Vibration-Sensing Electronic Yarns for the Monitoring of Hand Transmitted Vibrations †
Abstract
1. Introduction
2. Materials and Methods
2.1. Vibration-Sensing E-Yarn Fabrication
2.2. Inducing and Recording Vibrations
2.3. Data Collection and Analysis
2.4. Vibration-Sensing E-Yarns Embedded within Fabrics
3. Results
3.1. Characterzation of the Vibration-Sensing E-Yarns
3.1.1. Vibration-Sensing E-Yarn Frequency Dependence
3.1.2. Vibration-Sensing E-Yarns Amplitude Dependence
3.1.3. Validating the Accuracy of the Vibration-Sensing E-Yarn Measurements
3.2. Constructing Vibration-Sensing E-Yarns Using a Knit Braided Outer Sheath
3.3. Characterisation of Vibration-Sensing E-Yarns Embedded within Fabrics
4. Conclusions
Author Contributions
Funding
Institutional Review Board Statement
Informed Consent Statement
Data Availability Statement
Acknowledgments
Conflicts of Interest
Appendix A
Appendix A.1. Experiments to Determine How to Attach the E-Yarn to the Vibration Stage
 , Tesa 51571 white double-sided cloth tape
  , 3M 4026 white foam tape
  , 3M 9088 transparent double sided plastic tape
  , 3M scotch 9536 white foam tape
  , 3M 4910F VHB™ clear foam tape
  and beeswax
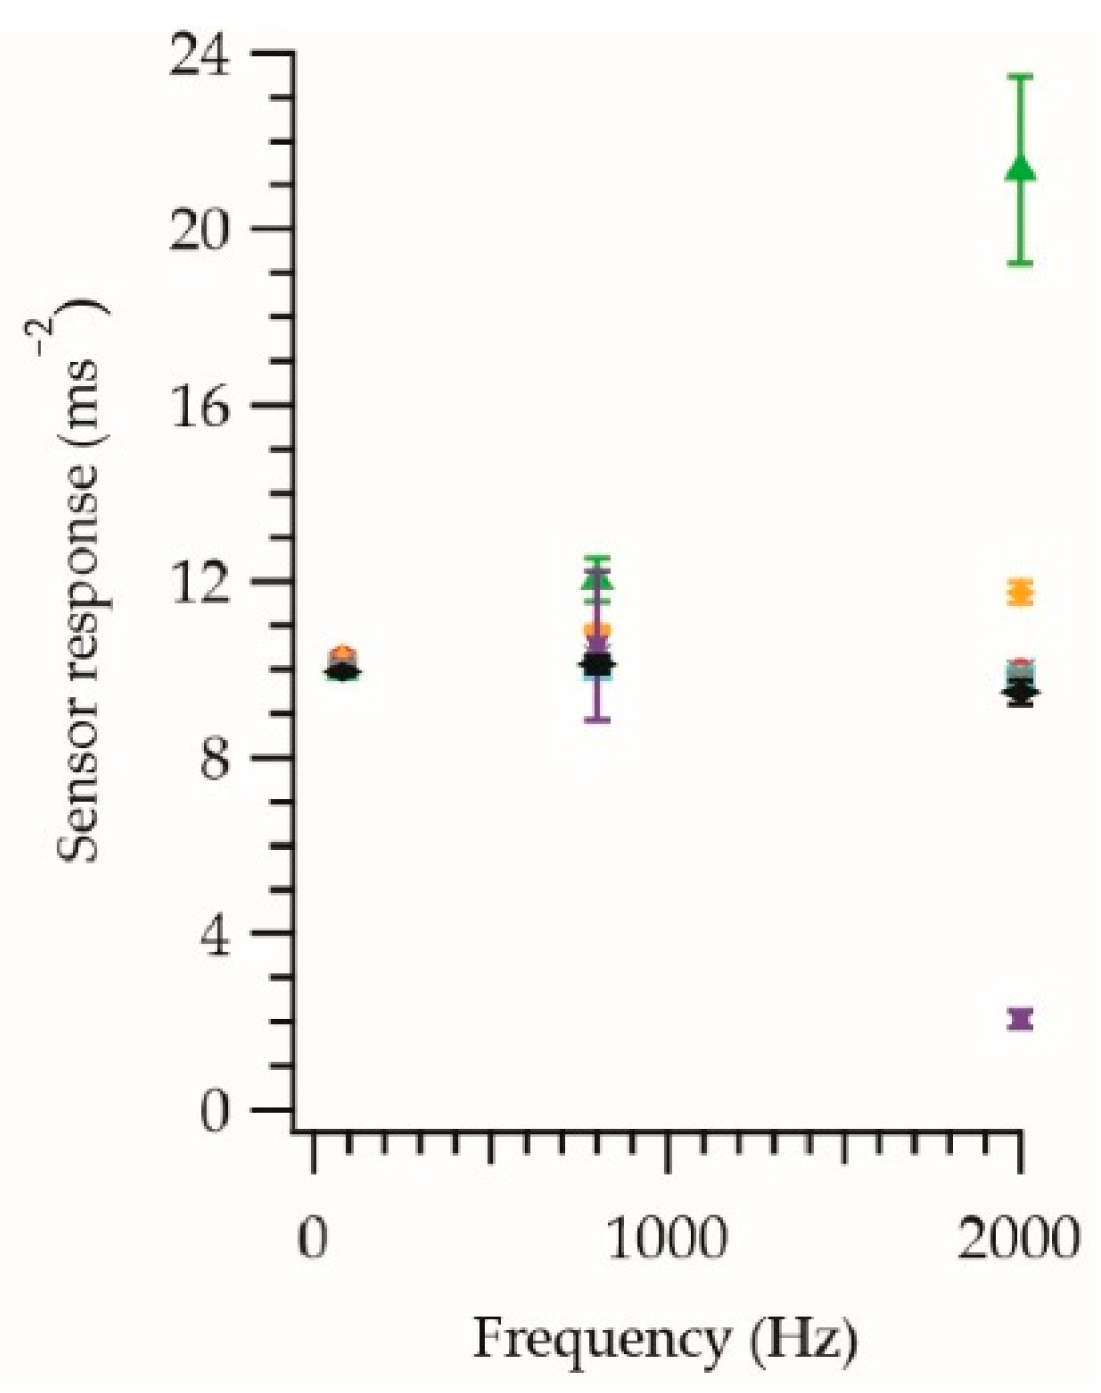
  at different frequencies with a vibration amplitude of 10 ms−2.
 , Tesa 51571 white double-sided cloth tape
  , 3M 4026 white foam tape
  , 3M 9088 transparent double sided plastic tape
  , 3M scotch 9536 white foam tape
  , 3M 4910F VHB™ clear foam tape
  and beeswax
  at different frequencies with a vibration amplitude of 10 ms−2.
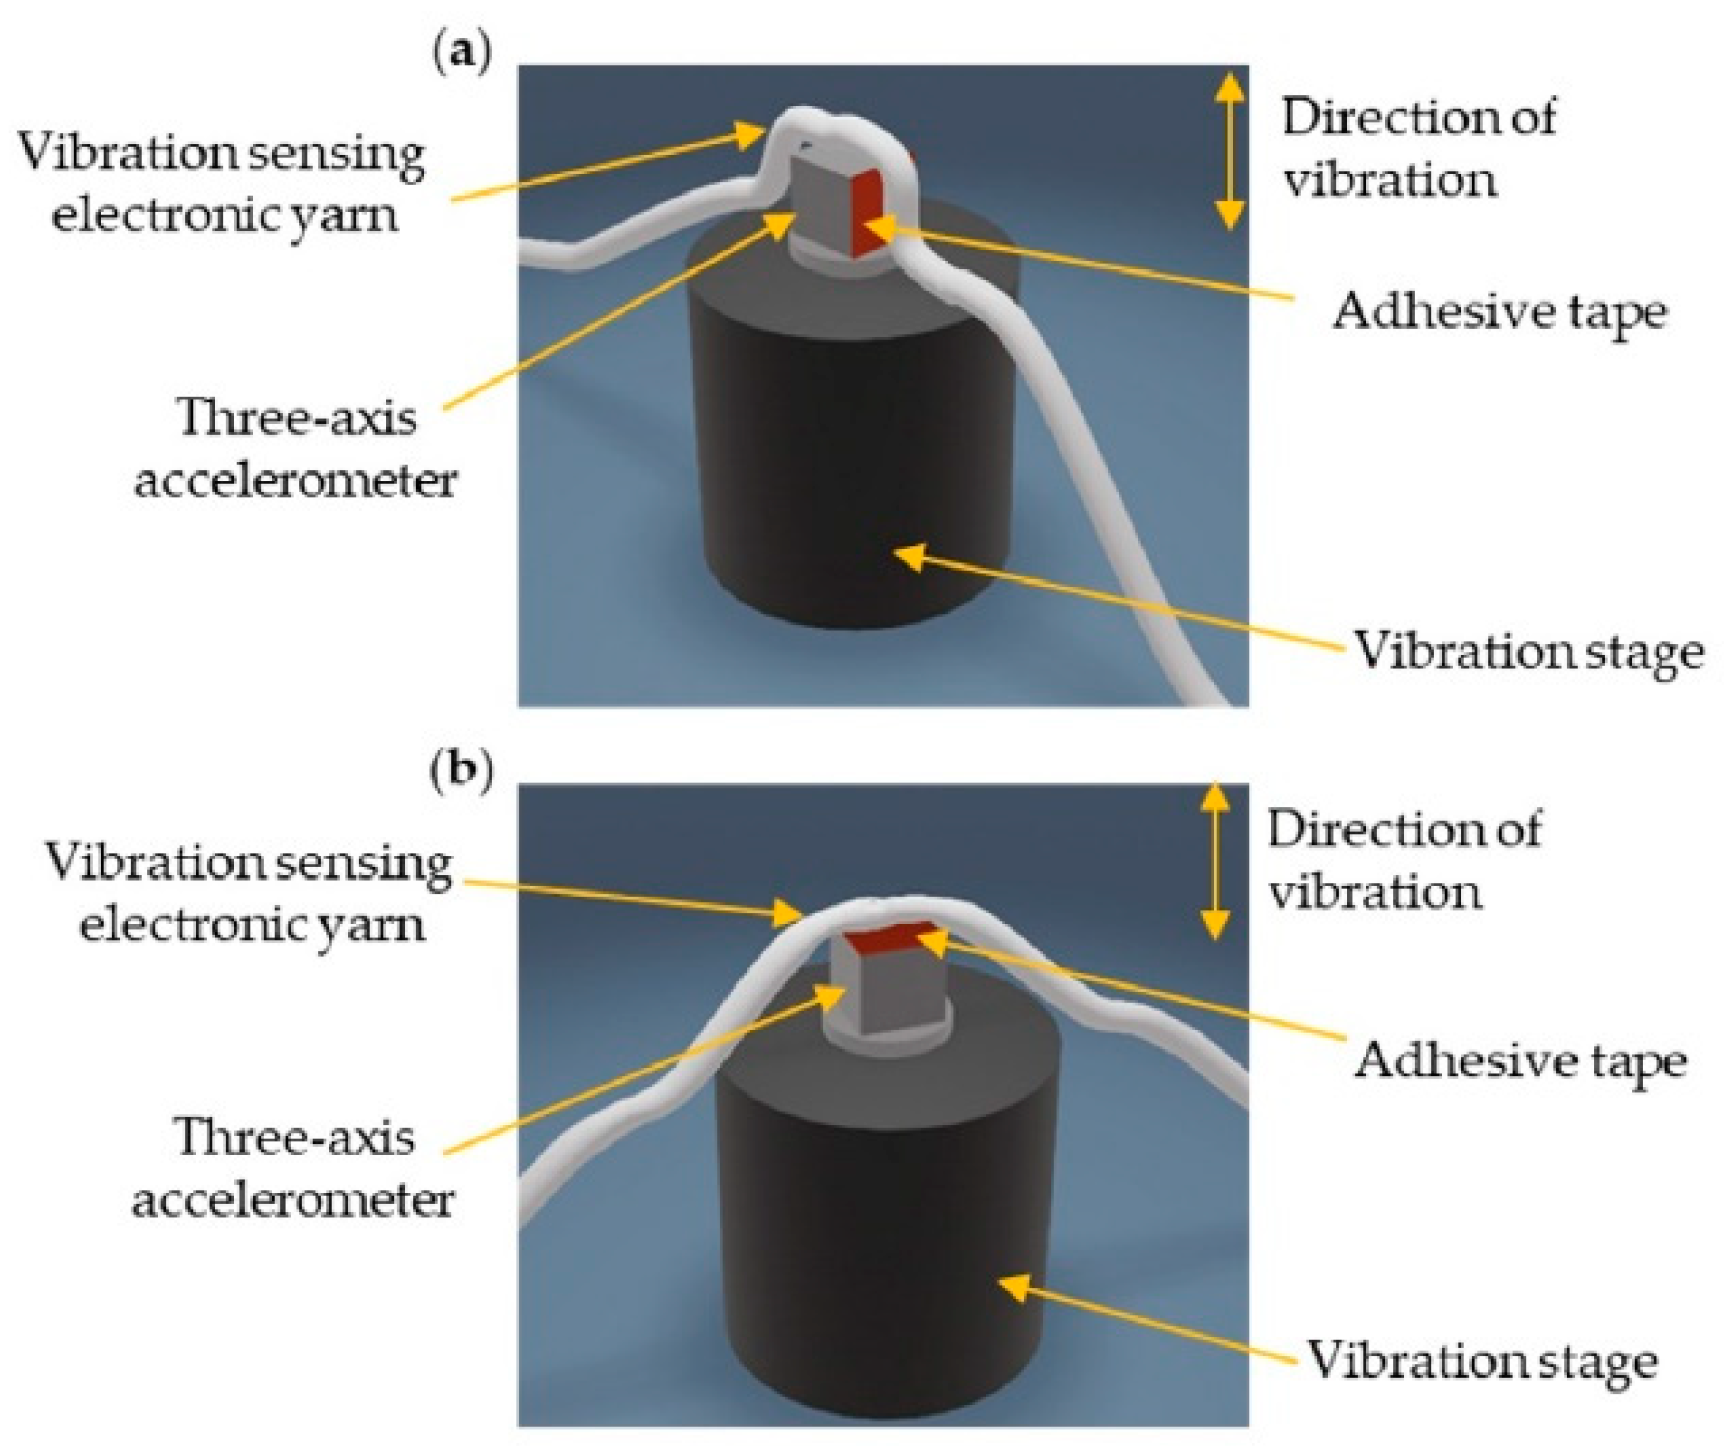
Appendix A.2. E-Yarn Facing Experiments
| Direction | Vibration Amplitude (ms−2) | Sensor Response (ms−2) |
|---|---|---|
| Up | 10.09 ± 0.03 | 10.66 ± 0.03 |
| Down | 10.14 ± 0.02 | 7.22 ± 0.01 |
| Left | 9.82 ± 0.02 | 1.04 ± 0.15 |
| Right | 10.18 ± 0.01 | 4.93 ± 0.51 |
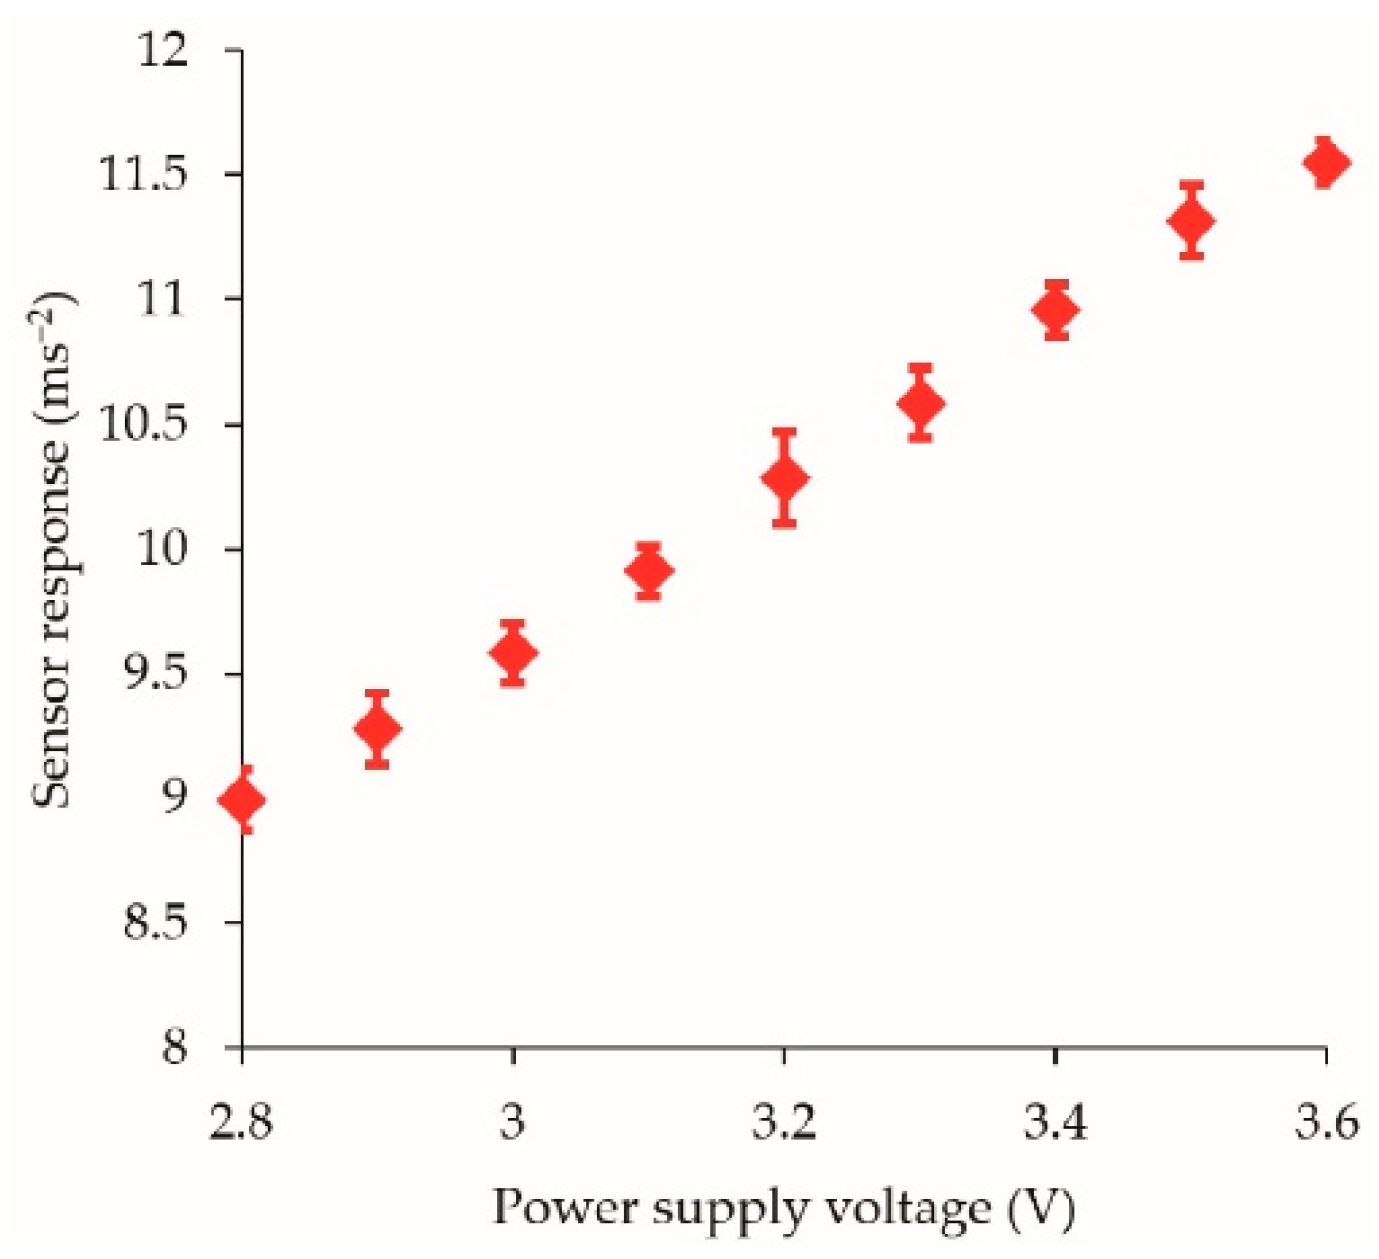
Appendix A.3. Applied Voltage Experiments
References
- Rahemtulla, Z.; Hughes-Riley, T.; Dias, T. Developing a Vibration-Sensing Yarn for Monitoring Hand-Transmitted Vibrations. Proceedings 2019, 32, 6. [Google Scholar] [CrossRef]
- Griffin, M.J.; Bovenzi, M. The Diagnosis of Disorders Caused by Hand-Transmitted Vibration: Southampton Workshop 2000. Int. Arch. Occup. Environ. Health 2002, 75, 1–5. [Google Scholar] [CrossRef] [PubMed]
- Griffin, M.J. Minimum Health and Safety Requirements for Workers Exposed to Hand-Transmitted Vibration and Whole-Body Vibration in the European Union; a Review. Occup. Environ. Med. 2004, 61, 387–397. [Google Scholar] [CrossRef] [PubMed]
- Pyykkö, I.; Korhonen, O.; Färkkilä, M.; Starck, J.; Aatola, S.; Jäntti, V. Vibration Syndrome among Finnish Forest Workers, a Follow-up from 1972 to 1983. Scand. J. Work. Environ. Health 1986, 12, 307–312. [Google Scholar] [CrossRef] [PubMed]
- Letz, R.; Cherniack, M.G.; Gerr, F.; Hershman, D.; Pace, P. A Cross Sectional Epidemiological Survey of Shipyard Workers Exposed to Hand-Arm Vibration. Br. J. Ind. Med. 1992, 49, 53–62. [Google Scholar] [CrossRef] [PubMed][Green Version]
- Bovenzi, M. Exposure-Response Relationship in the Hand-Arm Vibration Syndrome: An Overview of Current Epidemiology Research. Int. Arch. Occup. Environ. Health 1998, 71, 509–519. [Google Scholar] [CrossRef]
- Virokannas, H. Dose-Response Relation between Exposure to Two Types of Hand-Arm Vibration and Sensorineural Perception of Vibration. Occup. Environ. Med. 1995, 52, 332–336. [Google Scholar] [CrossRef] [PubMed]
- Virokannas, H. Vibration Perception Thresholds in Workers Exposed to Vibration. Int. Arch. Occup. Environ. Health 1992, 64, 377–382. [Google Scholar] [CrossRef]
- Miyashita, K.; Shiomi, S.; Itoh, N.; Kasamatsu, T.; Iwata, H. Epidemiological Study of Vibration Syndrome in Response to Total Hand-Tool Operating Time. Occup. Environ. Med. 1983, 40, 92–98. [Google Scholar] [CrossRef]
- Hagberg, M.; Morgenstern, H.; Kelsh, M. Impact of Occupations and Job Tasks on the Prevalence of Carpal Tunnel Syndrome on JSTOR. Scand. J. Work. Environ. Health 1992, 18, 337–345. [Google Scholar] [CrossRef]
- Nilsson, T.; Hagberg, M.; Burström, L.; Kihlberg, S. Impaired Nerve Conduction in the Carpal Tunnel of Platers and Truck Assemblers Exposed to Hand-Arm Vibration. Scand. J. Work. Environ. Health 1994, 20, 189–199. [Google Scholar] [CrossRef][Green Version]
- Nilsson, T.; Hagberg, M.; Burström, L.; Lundstörm, R. A five-year follow-up of nerve conduction over the carpul tunnel. In Hand-Arm Vibration Syndrome: Diagnostics and Quantitative Relationships to Exposure: Proceedings: Stockholm Workshop 94; Gemne, G., Ed.; Arbetsmiljöinstitutet: Solna, Sweden, 1995; pp. 117–120. ISBN 9170452962. [Google Scholar]
- Griffin, M.J. Measurement, Evaluation, and Assessment of Occupational Exposures to Hand-Transmitted Vibration. Occup. Environ. Med. 1997, 54, 73–89. [Google Scholar] [CrossRef]
- British Standards Institution. BS EN ISO 5349-1-Mechanical Vibration-Measurement and Evaluation of Human Exposure to Hand-Transmitted Vibration-Part 1: General Requirements; British Standards Institution: London, UK, 2001. [Google Scholar]
- British Standards Institution. BS EN ISO 8041:2005-Human Response To Vibration-Measuring Instrumentation; British Standards Institution: London, UK, 2005. [Google Scholar]
- HAVS Hand Arm Vibration & Workplace Social Distancing-Reactec. Available online: https://www.reactec.com/?gclid=Cj0KCQiA1KiBBhCcARIsAPWqoSonRNNpjG-xJn4fdg8DPGoPNwQa4jfjRGiC_gGaz2D4qUxGXt57WfoaAiZAEALw_wcB (accessed on 15 February 2021).
- HAVSco–HAV Dosimeters. Available online: https://havsco.co.uk/dosimeters/ (accessed on 16 February 2021).
- Hand Arm Vibration Meter PCE-HAV 100|PCE Instruments. Available online: https://www.pce-instruments.com/english/measuring-instruments/test-meters/vibration-meter-pce-instruments-hand-arm-vibration-meter-pce-hav-100-det_5932744.htm (accessed on 16 February 2021).
- Hand Arm Vibration(HAV)–CVK. Available online: https://www.cvk.se/products/hand-arm-vibrationhav/ (accessed on 16 February 2021).
- HealthVib HAV100-3Ch–CVK. Available online: https://www.cvk.se/products/hand-arm-vibrationhav/healthvib-hav100-3ch/ (accessed on 1 April 2021).
- Stoppa, M.; Chiolerio, A. Wearable Electronics and Smart Textiles: A Critical Review. Sensors 2014, 14, 11957–11992. [Google Scholar] [CrossRef] [PubMed]
- Hughes-Riley, T.; Dias, T.; Cork, C. A Historical Review of the Development of Electronic Textiles. Fibers 2018, 6, 34. [Google Scholar] [CrossRef]
- Wang, X.; Li, Q.; Tao, X. Sensing Mechanism of a Carbon Nanocomposite-Printed Fabric as a Strain Sensor. Compos. Part A Appl. Sci. Manuf. 2021, 144, 106350. [Google Scholar] [CrossRef]
- Jung, W.T.; Jeon, J.W.; Jang, H.S.; Kim, D.Y.; Lee, H.K.; Kim, B.H. Commercial Silk-Based Electronic Textiles for NO2 Sensing. Sens. Actuators B Chem. 2020, 307, 127596. [Google Scholar] [CrossRef]
- Shaker, K.; Umair, M.; Hamdani, S.T.A.; Nawab, Y. Effect of Fabric Structure on the Performance of 3D Woven Pressure Sensor. Fibers Polym. 2021, 22, 847–853. [Google Scholar] [CrossRef]
- Hughes-Riley, T.; Jobling, P.; Dias, T.; Faulkner, S.H. An Investigation of Temperature-Sensing Textiles for Temperature Monitoring during Sub-Maximal Cycling Trials. Text. Res. J. 2021, 91, 624–645. [Google Scholar] [CrossRef]
- Hughes-Riley, T.; Dias, T. Developing an Acoustic Sensing Yarn for Health Surveillance in a Military Setting. Sensors 2018, 18, 1590. [Google Scholar] [CrossRef] [PubMed]
- Satharasinghe, A.; Hughes-Riley, T.; Dias, T. Photodiodes Embedded within Electronic Textiles. Sci. Rep. 2018, 8, 16205. [Google Scholar] [CrossRef]
- Li, M.; Torah, R.; Nunes-Matos, H.; Wei, Y.; Beeby, S.; Tudor, J.; Yang, K. Integration and Testing of a Three-Axis Accelerometer in a Woven E-Textile Sleeve for Wearable Movement Monitoring. Sensors 2020, 20, 5033. [Google Scholar] [CrossRef]
- Tognetti, A.; Lorussi, F.; Carbonaro, N.; de Rossi, D. Wearable Goniometer and Accelerometer Sensory Fusion for Knee Joint Angle Measurement in Daily Life. Sensors 2015, 15, 28435–28455. [Google Scholar] [CrossRef] [PubMed]
- Hughes-Riley, T.; Lugoda, P.; Dias, T.; Trabi, C.; Morris, R. A Study of Thermistor Performance within a Textile Structure. Sensors 2017, 17, 1804. [Google Scholar] [CrossRef]
- Wang, X.; Liu, H.; Ouyang, S. Damping Properties of Flexible Epoxy Resin. J. Wuhan Univ. Technol. Mater. Sci. Ed. 2008, 23, 411–414. [Google Scholar] [CrossRef]
- Blaga, M.; Seghedin, N.-E. Knitted Materials Capacity for Vibration Protection Application. TEXTEH Proc. 2019, 2019, 6–9. [Google Scholar] [CrossRef]
- Liu, Y.; Hu, H. Vibration Isolation Behaviour of 3D Polymeric Knitted Spacer Fabrics under Harmonic Vibration Testing Conditions. Polym. Test. 2015, 47, 120–129. [Google Scholar] [CrossRef]
- Chen, F.; Liu, Y.; Hu, H. An Experimental Study on Vibration Isolation Performance of Weft-Knitted Spacer Fabrics. Text. Res. J. 2016, 86, 2225–2235. [Google Scholar] [CrossRef]
- Hughes-Riley, T.; Dias, T. The Development of Acoustic and Vibration Sensing Yarns for Health Surveillance. In Proceedings of the 25th International Congress on Sound and Vibration (ICSV25), Hiroshima, Japan, 8–12 July 2018. [Google Scholar]
- Analog Devices. Small, Low Power, 3-Axis ± 3 g Accelerometer ADXL337 Data Sheet; Analog Devices: Norwood, MA, USA, 2017; p. 17. [Google Scholar]
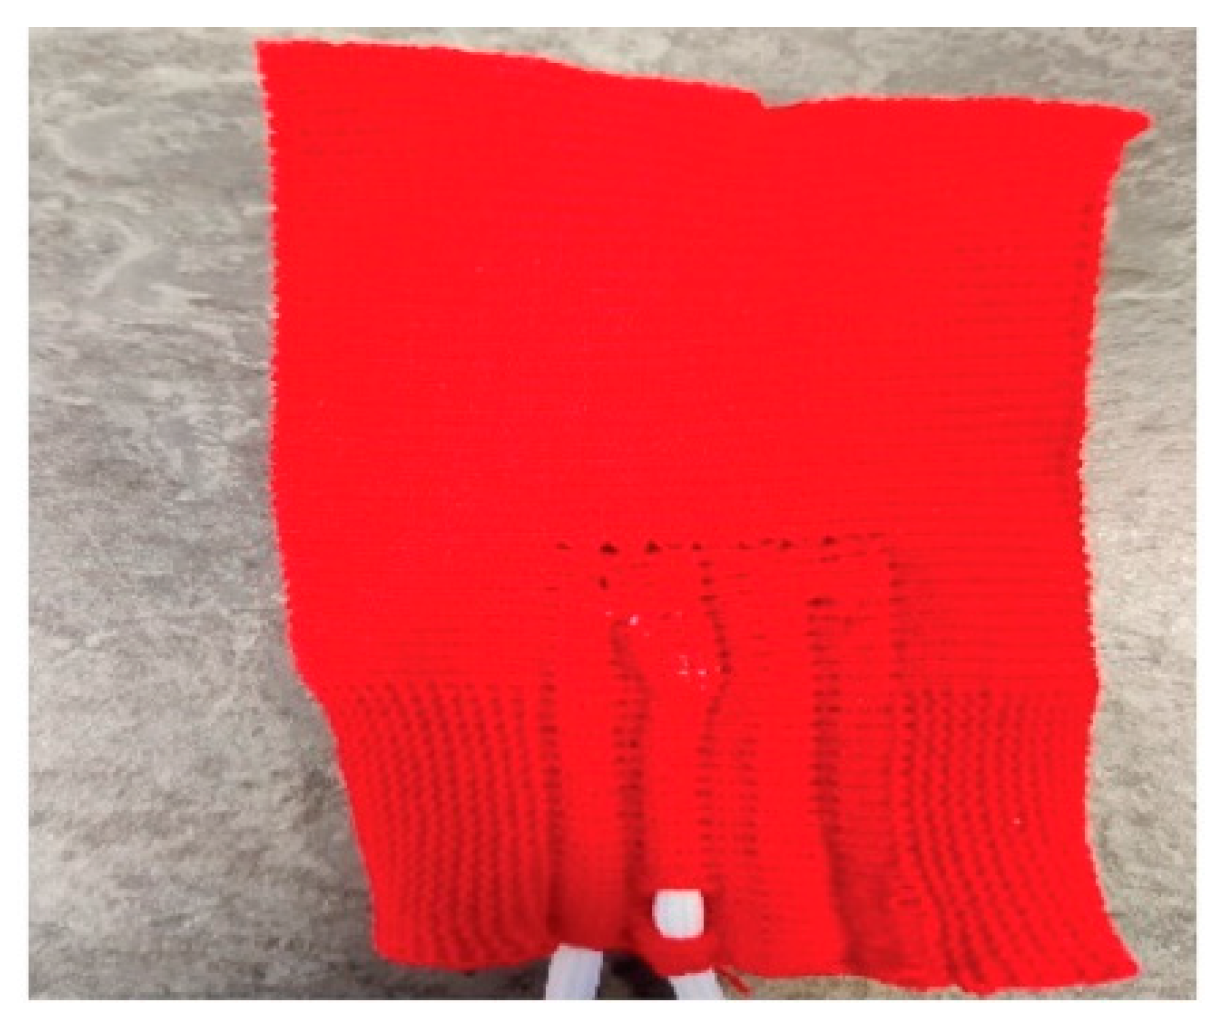
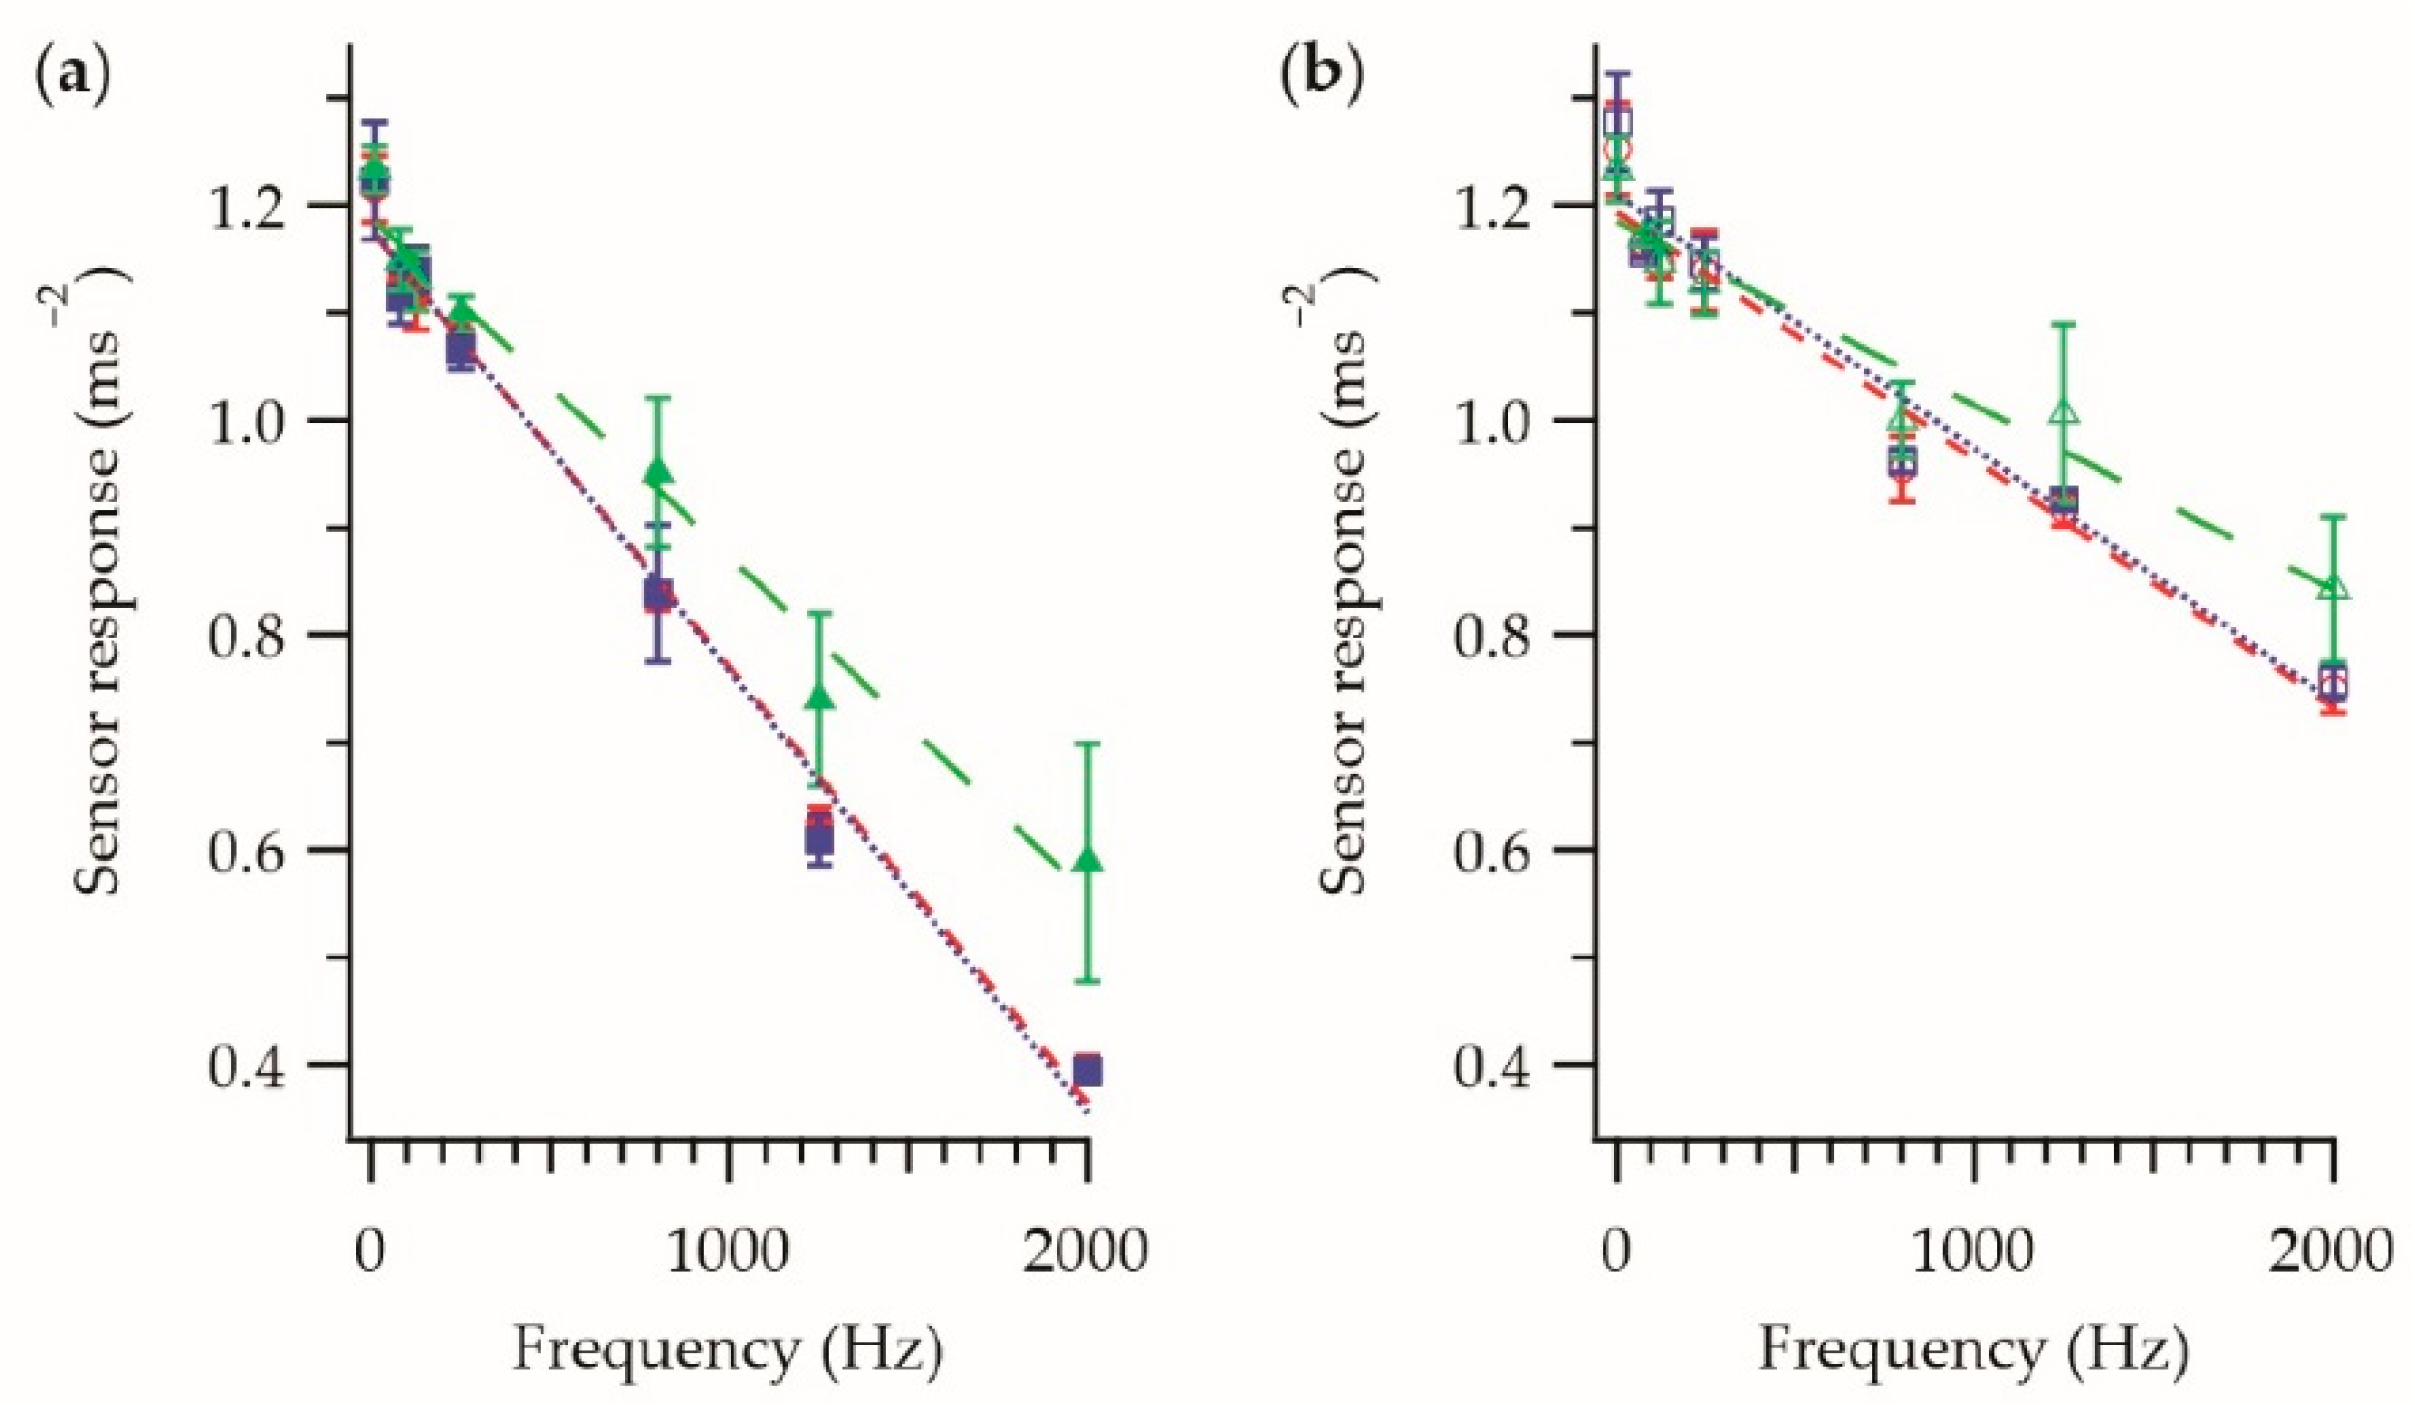
 ; encapsulated stage
  ; the final E-yarn
  . (b) The frequency response in the x-axis. Soldered stage
  ; encapsulated stage
  ; the final E-yarn
  . Each data point is an averaged measurement taken using four E-yarns, with the error bars representing the standard deviation in the measurements. Details of the linear fittings (dashed lines) are shown in Table 1. Previously presented elsewhere [1].
 ; encapsulated stage
  ; the final E-yarn
  . (b) The frequency response in the x-axis. Soldered stage
  ; encapsulated stage
  ; the final E-yarn
  . Each data point is an averaged measurement taken using four E-yarns, with the error bars representing the standard deviation in the measurements. Details of the linear fittings (dashed lines) are shown in Table 1. Previously presented elsewhere [1].
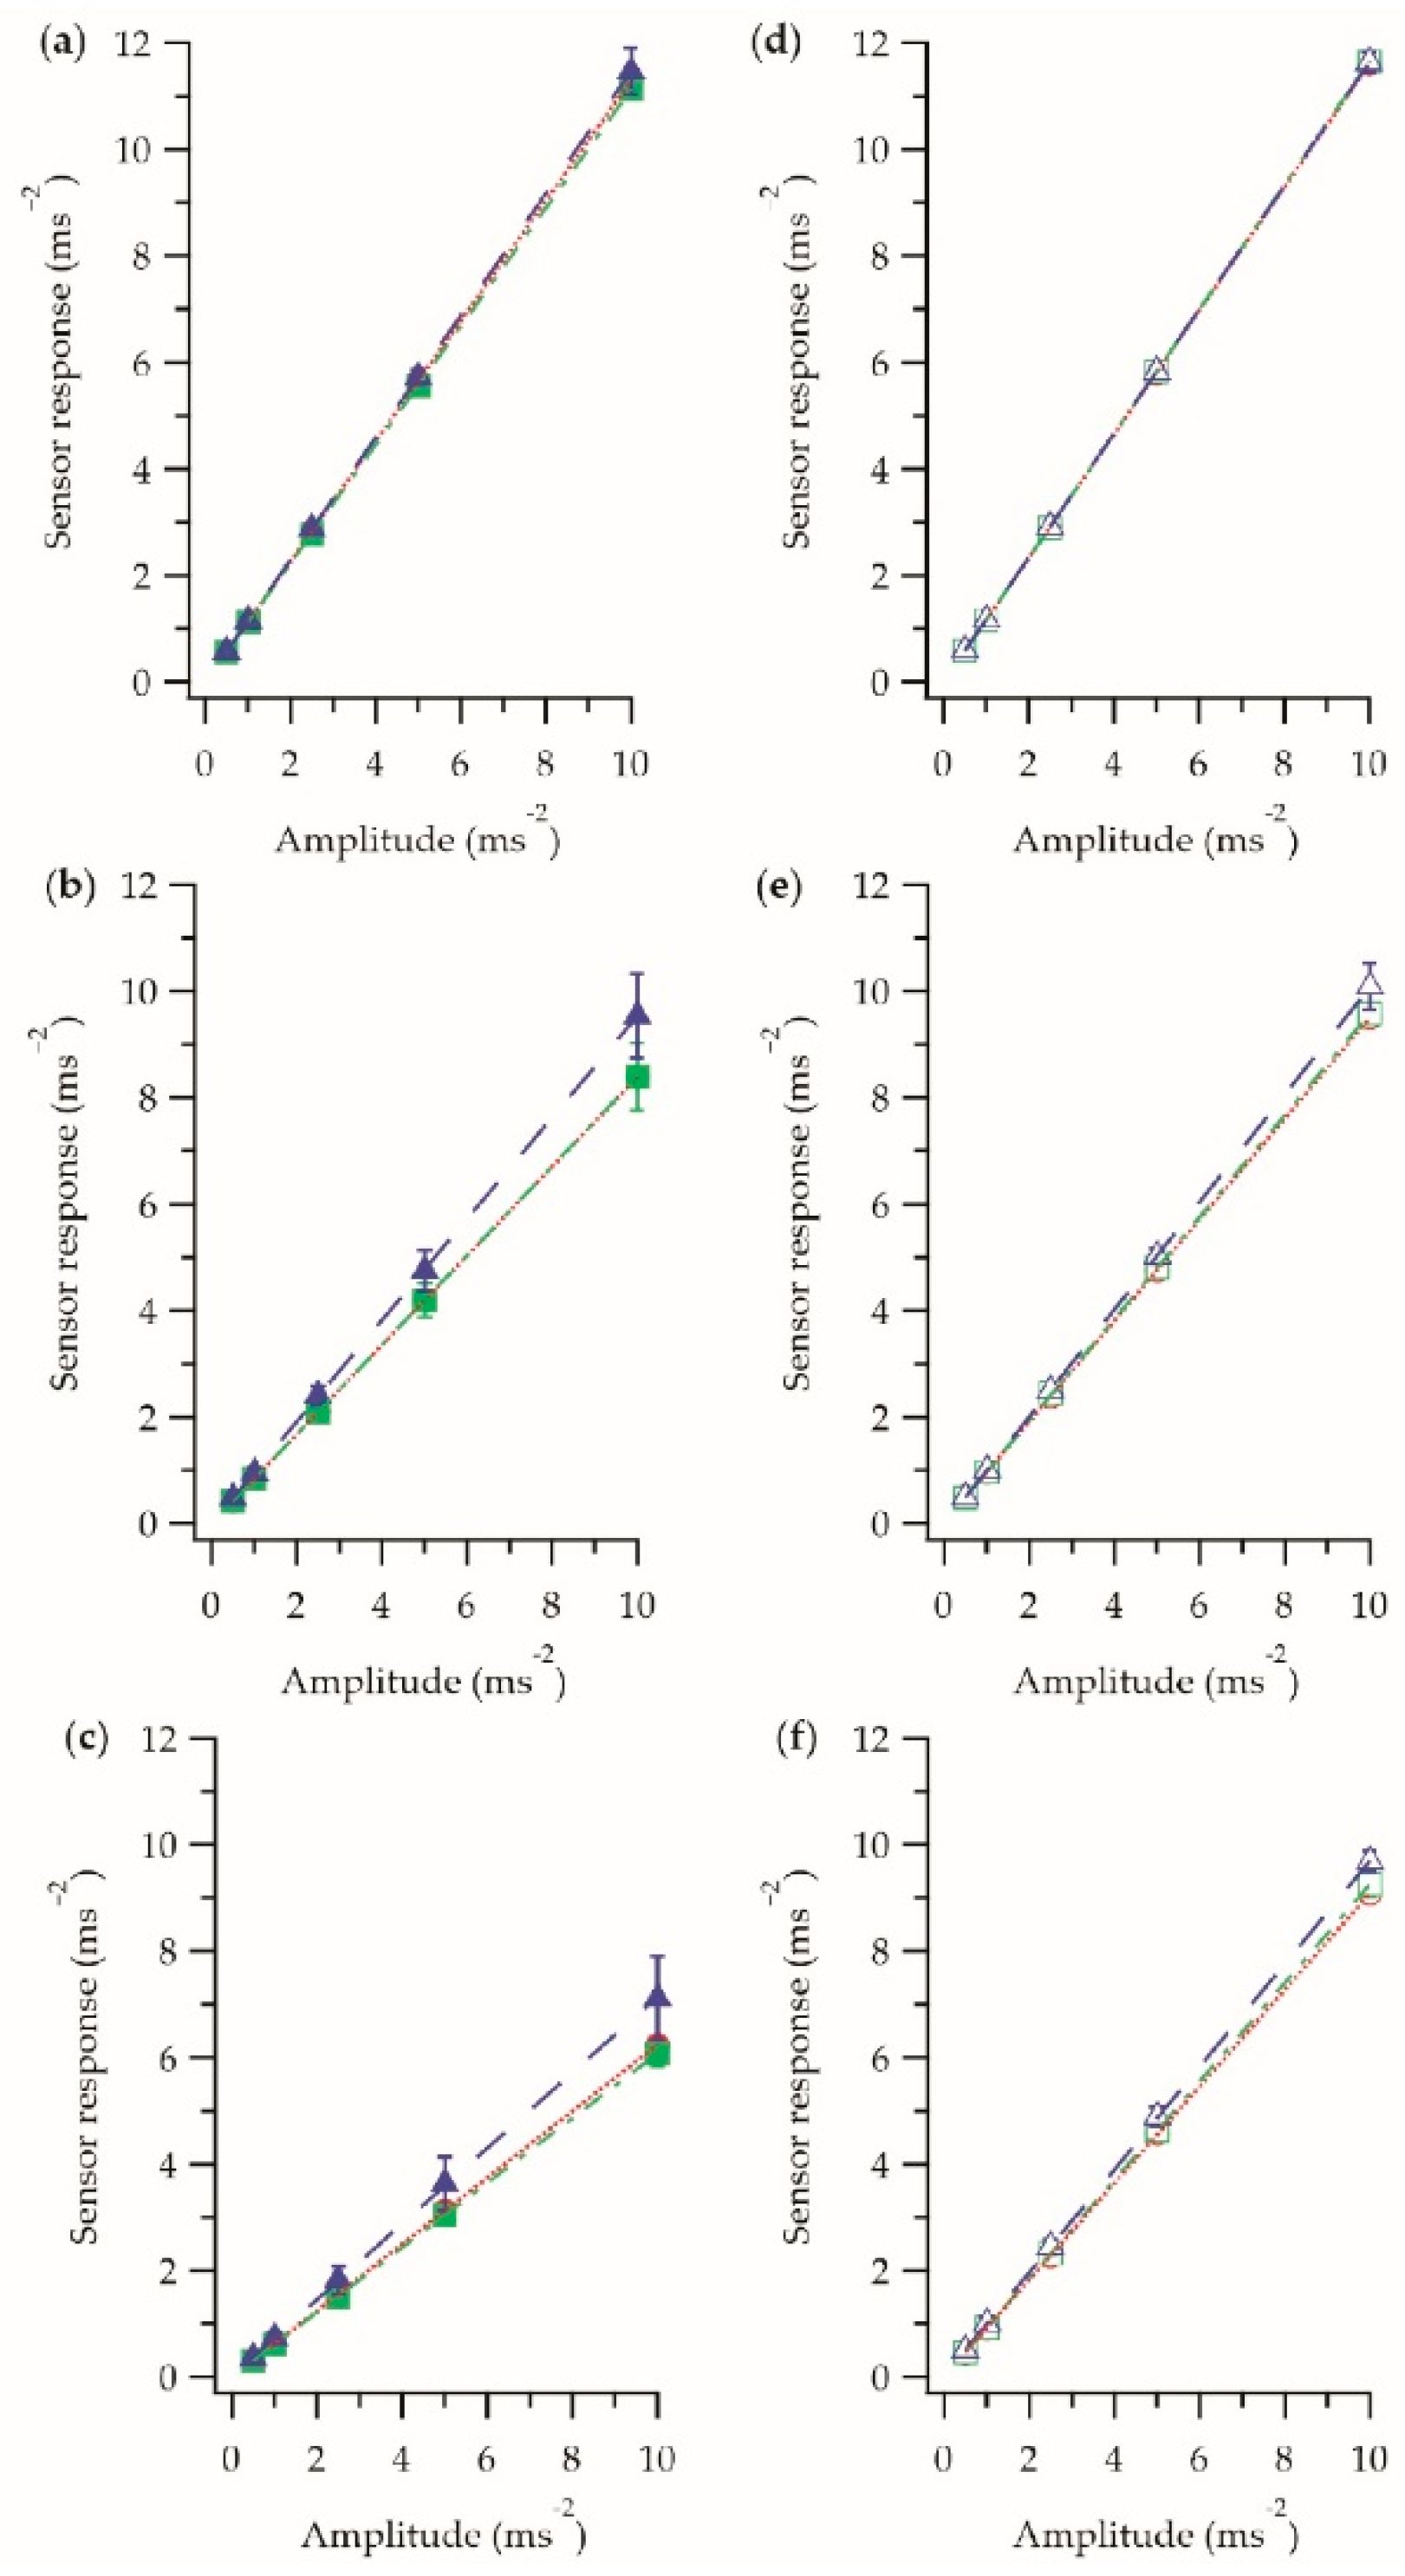
 ; encapsulated stage
  ; the final E-yarn
  . (d–f) Amplitude response in the x-axis at 80 Hz, 800 Hz and 1250 Hz respectively. Soldered stage
  ; encapsulated stage
  ; the final E-yarn
  . Each data point is an averaged measurement taken using four E-yarns, with the error bars representing the standard deviation in the measurements. Details of the linear fittings (dashed lines) are shown in Table 2. The results for the final E-yarn has previously been presented elsewhere [1].
 ; encapsulated stage
  ; the final E-yarn
  . (d–f) Amplitude response in the x-axis at 80 Hz, 800 Hz and 1250 Hz respectively. Soldered stage
  ; encapsulated stage
  ; the final E-yarn
  . Each data point is an averaged measurement taken using four E-yarns, with the error bars representing the standard deviation in the measurements. Details of the linear fittings (dashed lines) are shown in Table 2. The results for the final E-yarn has previously been presented elsewhere [1].
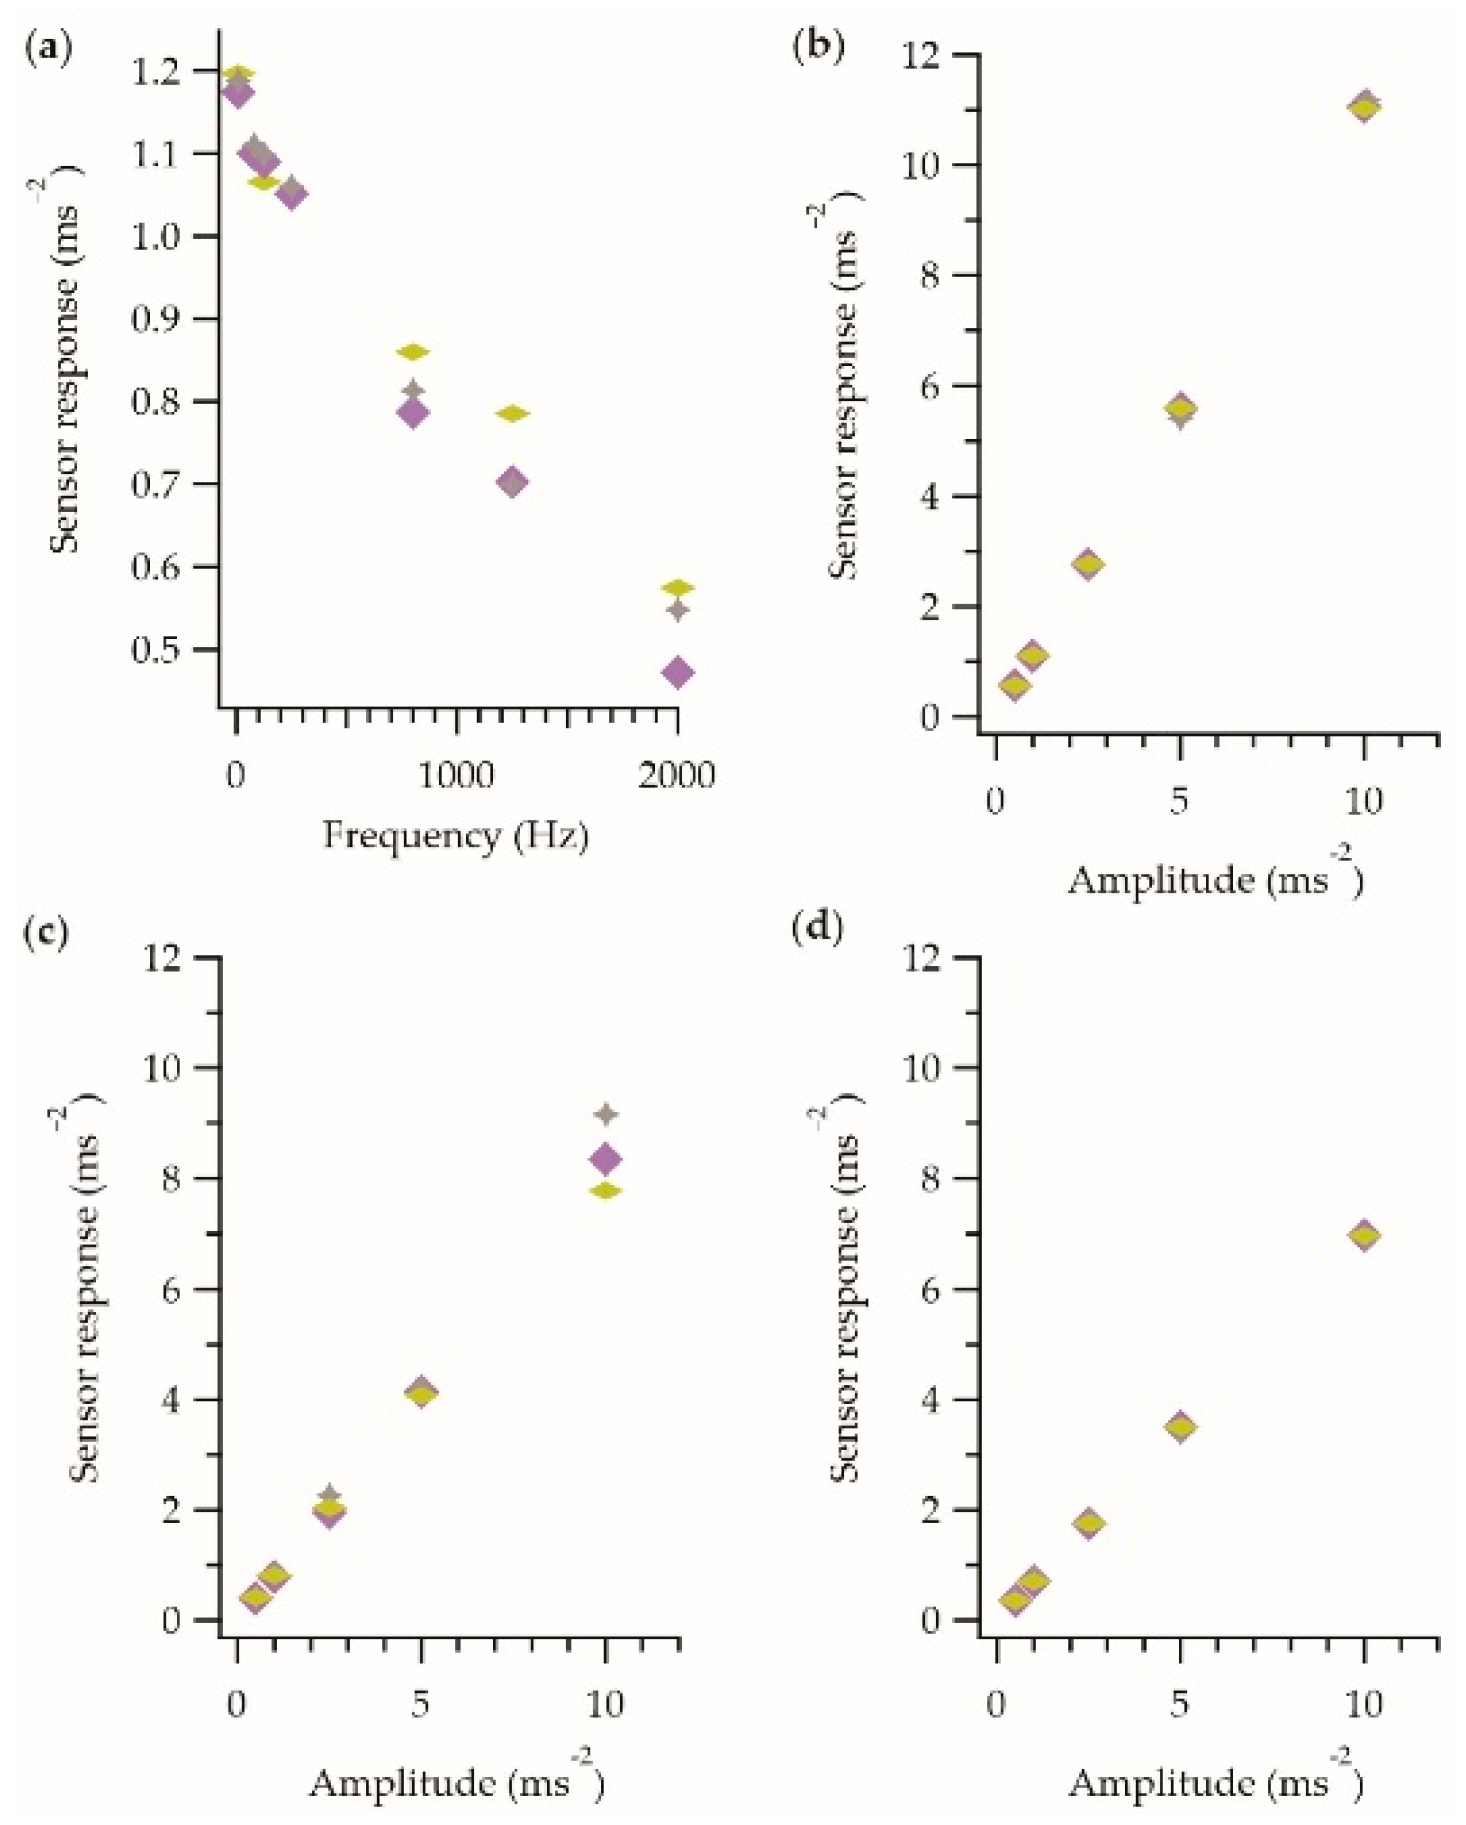
 (as described in the methods section), reverse sequential
  and random order
  . All data have been recorded in the z-axis only. (a) Frequency response data. (b) Amplitude response at 80 Hz. (c) Amplitude response at 800 Hz. (d) Amplitude response at 1250 Hz.
 (as described in the methods section), reverse sequential
  and random order
  . All data have been recorded in the z-axis only. (a) Frequency response data. (b) Amplitude response at 80 Hz. (c) Amplitude response at 800 Hz. (d) Amplitude response at 1250 Hz.
 ; 800 Hz
  ; 1250 Hz
  . (d) The amplitude response for the different frequencies in the x-axis: 80 Hz
  ; 800 Hz
  ; 1250 Hz
  . Each data point is the average of four measurements taken using a single E-yarn, with the error bars representing the standard deviation in the measurements.
 ; 800 Hz
  ; 1250 Hz
  . (d) The amplitude response for the different frequencies in the x-axis: 80 Hz
  ; 800 Hz
  ; 1250 Hz
  . Each data point is the average of four measurements taken using a single E-yarn, with the error bars representing the standard deviation in the measurements.
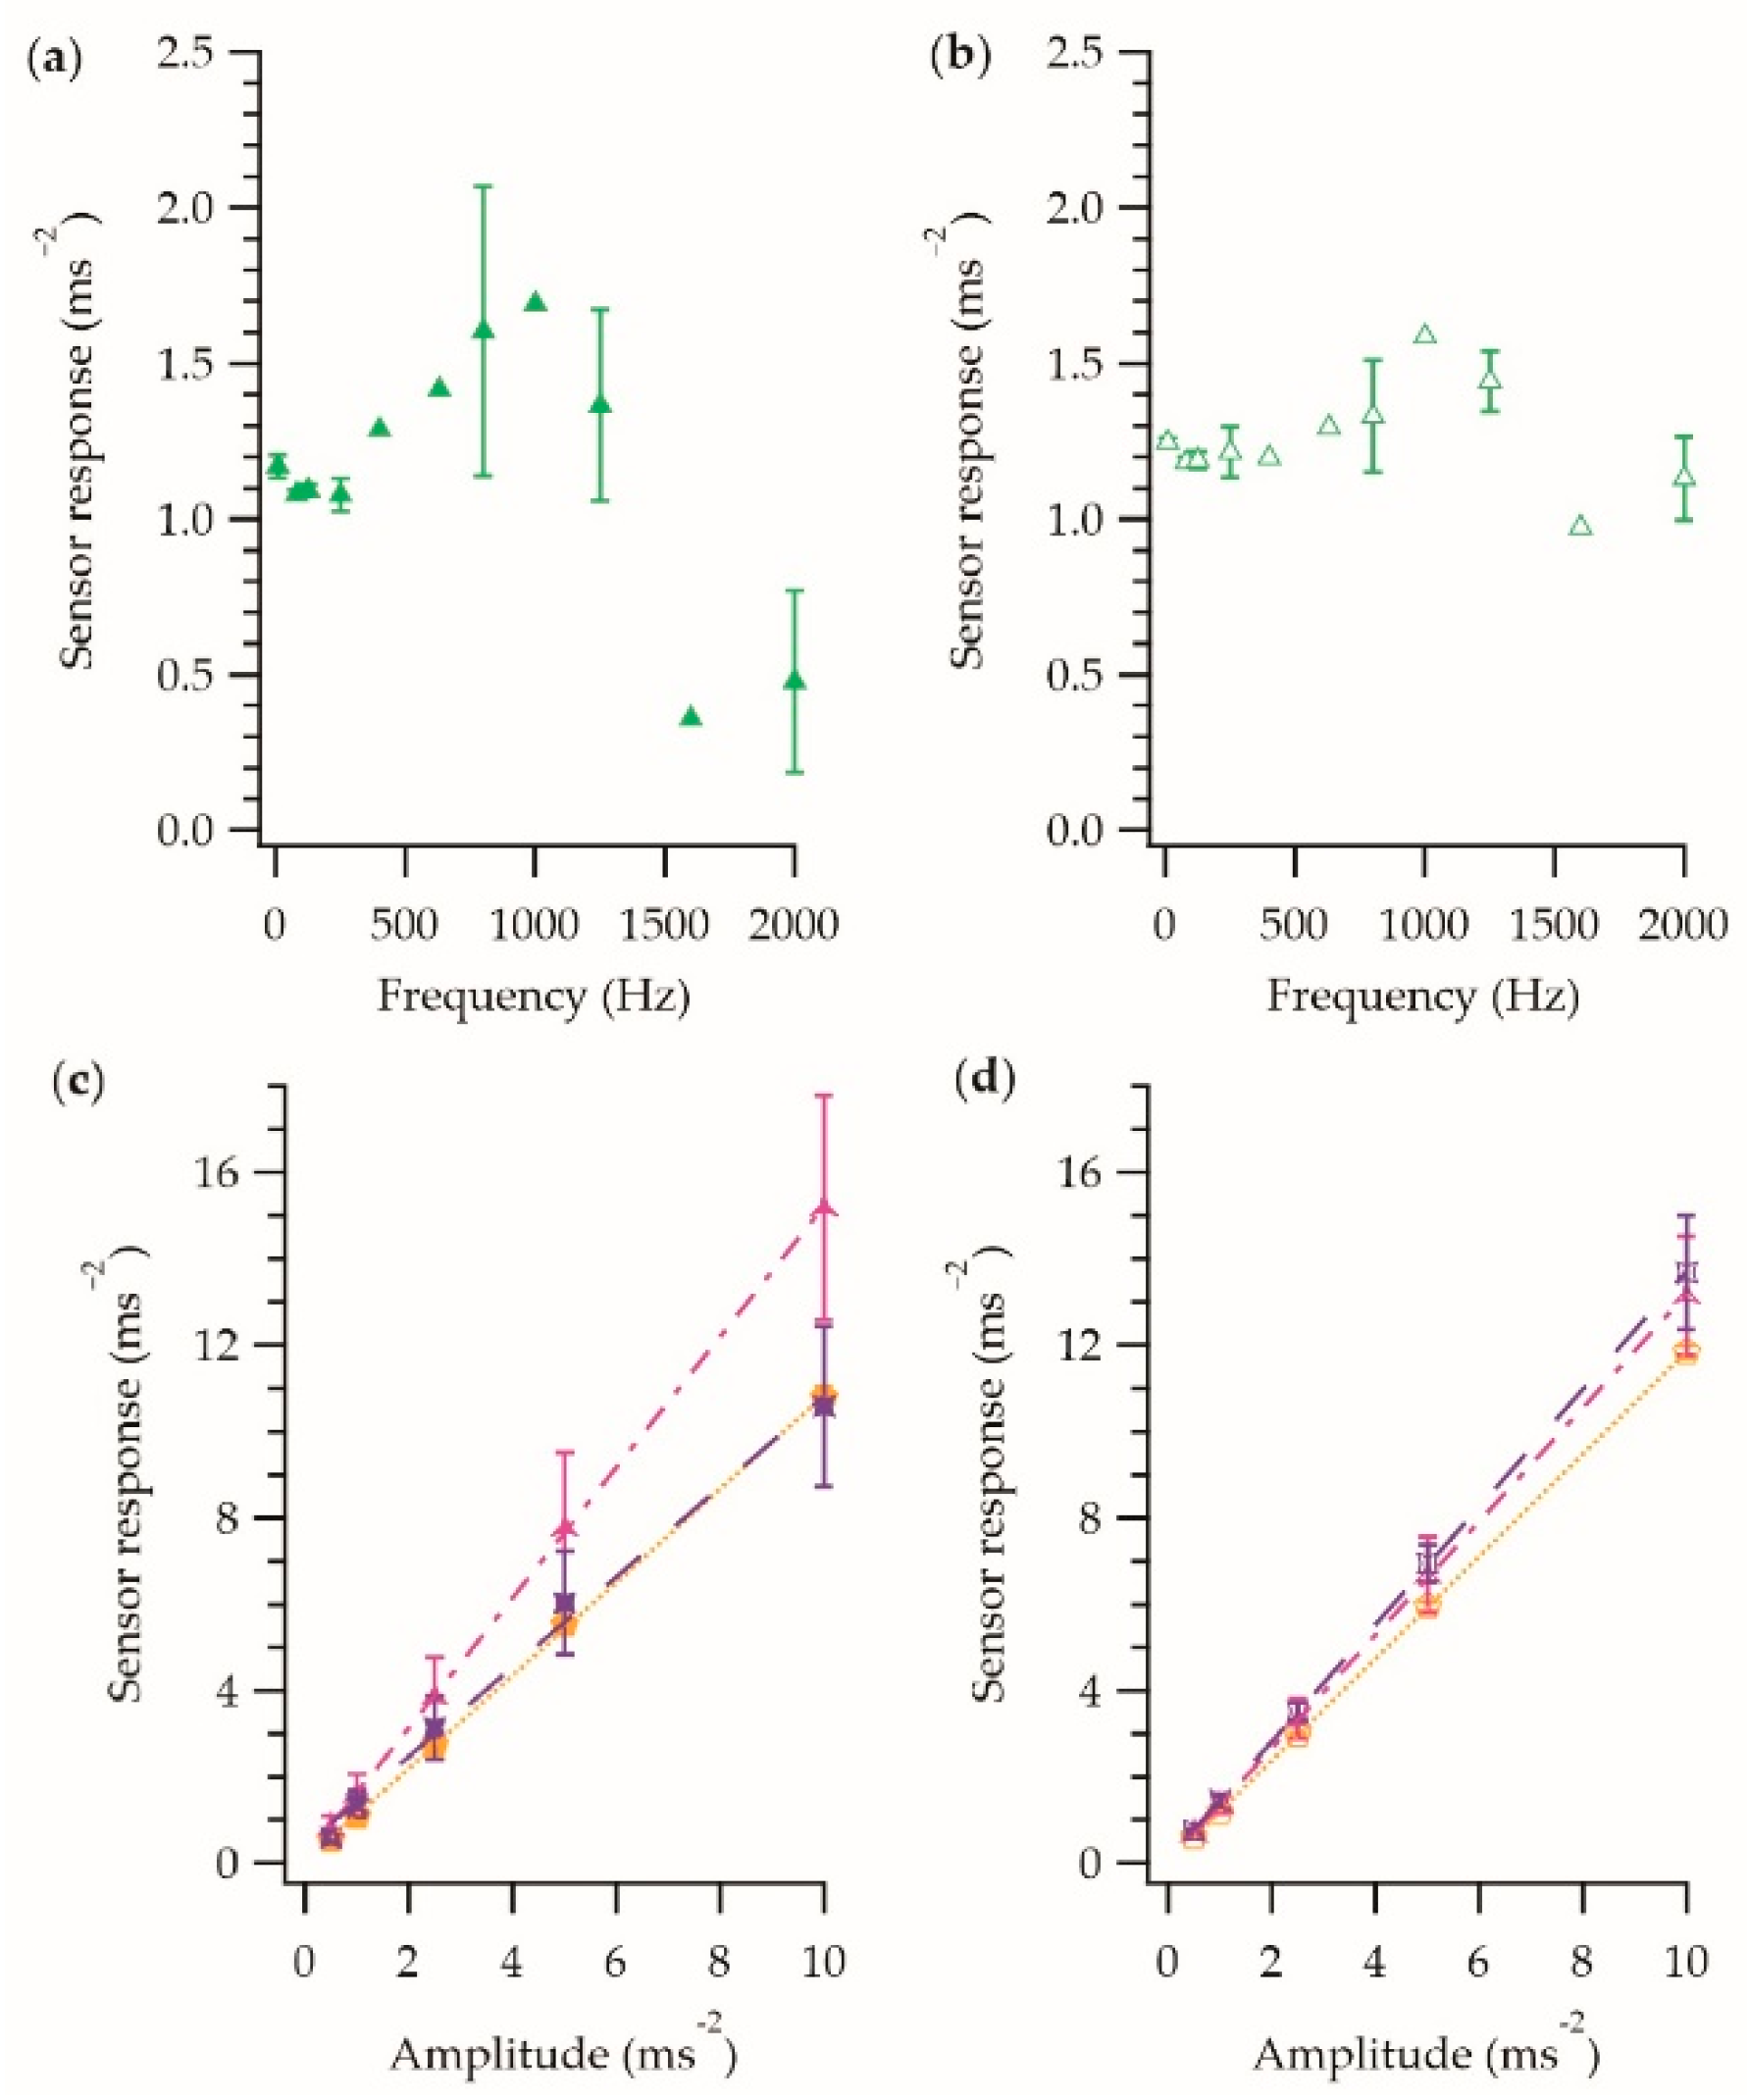
 ; 800 Hz
  ; 1250 Hz
  . Each data point is the average of five measurements taken using a single E-yarn, with the error bars representing the standard deviation in the measurements.
 ; 800 Hz
  ; 1250 Hz
  . Each data point is the average of five measurements taken using a single E-yarn, with the error bars representing the standard deviation in the measurements.
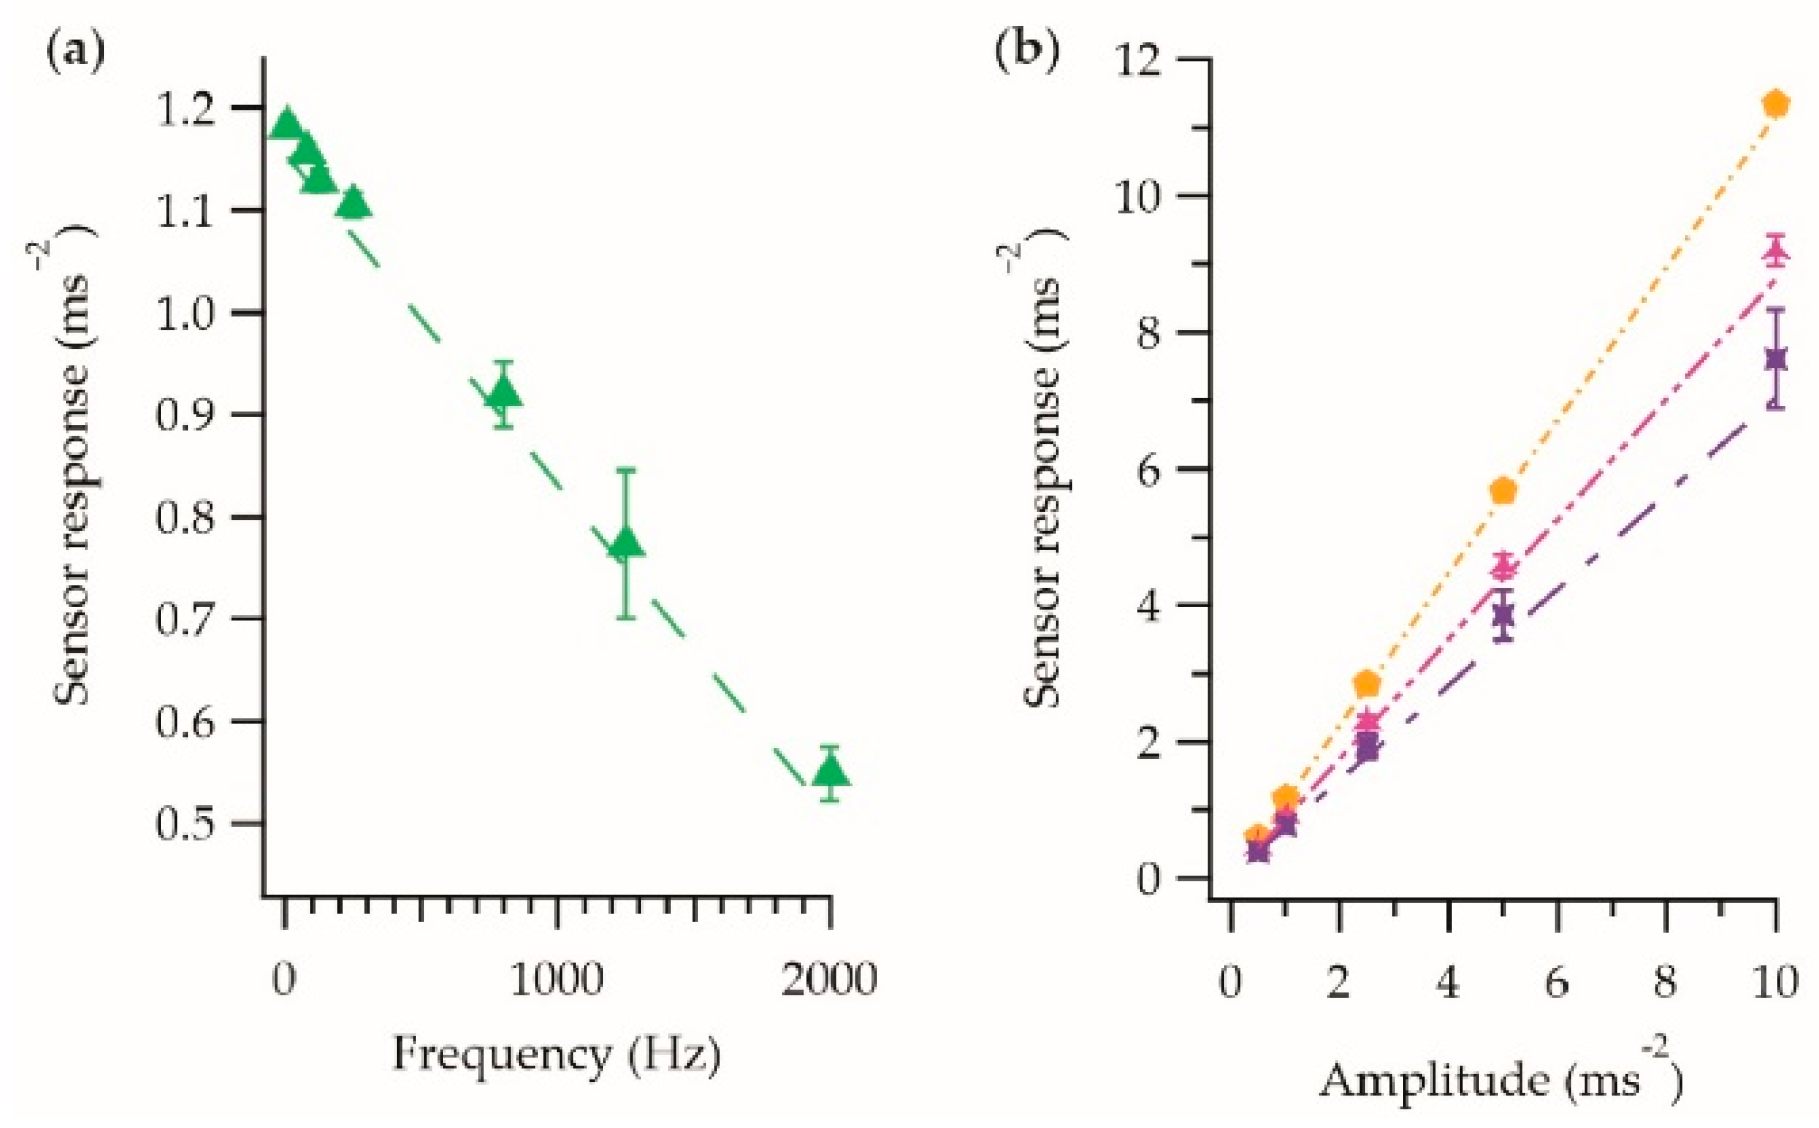
| Data Fitting | Coefficient of Determination (R2) | |
|---|---|---|
| Z-axis; soldered | S = (−4.06 ± 0.18) × 10−4 f + 1.18 ± 0.02 | 0.99 |
| Z-axis; encapsulated | S = (−4.11 ± 0.22) × 10−4 f + 1.18 ± 0.02 | 0.99 |
| Z-axis; final E-yarn | S = (−3.15 ± 0.21) × 10−4 f + 1.19 ± 0.02 | 0.98 |
| X-axis; soldered | S = (−2.31 ± 0.21) × 10−4 f + 1.20 ± 0.02 | 0.96 |
| X-axis; encapsulated | S = (−2.37 ± 0.24) × 10−4 f + 1.21 ± 0.02 | 0.95 |
| X-axis; final E-yarn | S = (−1.72 ± 0.20) × 10−4 f + 1.19 ± 0.02 | 0.94 |
| Frequency | Data Fitting | Coefficient of Determination (R2) | |
|---|---|---|---|
| Z-axis; soldered | 80 Hz | S = 1.13 ± 0.30 × 10⁻³ a + (1.85 ± 1.52) × 10−3 | 1.00 |
| Z-axis; encapsulated | 80 Hz | S = 1.11 ± 0.91 × 10⁻³ a − (0.82 ± 4.70) × 10−3 | 1.00 |
| Z-axis; final E-yarn | 80 Hz | S = 1.15 ± 0.92 × 10⁻³ a + (3.98 ± 4.74) × 10−3 | 1.00 |
| Z-axis; soldered | 800 Hz | S = 0.84 ± 0.70 × 10⁻³ a − (1.16 ± 3.61) × 10−3 | 1.00 |
| Z-axis; encapsulated | 800 Hz | S = 0.84 ± 0.37 × 10⁻³ a − (1.08 ± 1.89) × 103 | 1.00 |
| Z-axis; final E-yarn | 800 Hz | S = 0.95 ± 1.77 × 10⁻³ a + (5.13 ± 9.10) × 10−3 | 1.00 |
| Z-axis; soldered | 1250 Hz | S = 0.62 ± 0.27 × 10⁻³ a + (2.67 ± 1.38) × 103 | 1.00 |
| Z-axis; encapsulated | 1250 Hz | S = 0.61 ± 0.32 × 10⁻³ a + (0.92 ± 1.65) × 10−3 | 1.00 |
| Z-axis; final E-yarn | 1250 Hz | S = 0.71 ± 4.60 × 10⁻³ a + (3.74 ± 23.70) × 10−3 | 1.00 |
| X-axis; soldered | 80 Hz | S = 1.16 ± 0.53 × 10⁻³ a + (4.12 ± 2.72) × 10−3 | 1.00 |
| X-axis; encapsulated | 80 Hz | S = 1.17 ± 0.88 × 10⁻³ a − (6.82 ± 4.53) × 10−3 | 1.00 |
| X-axis; final E-yarn | 80 Hz | S = 1.16 ± 0.35 × 10⁻³ a + (8.50 ± 1.79) × 10−3 | 1.00 |
| X-axis; soldered | 800 Hz | S = 0.95 ± 1.40 × 10⁻³ a + (16.95 ± 7.22) × 10−3 | 1.00 |
| X-axis; encapsulated | 800 Hz | S = 0.96 ± 3.18 × 10⁻³ a + (20.22 ± 16.40) × 10−3 | 1.00 |
| X-axis; final E-yarn | 800 Hz | S = 1.01 ± 1.3 × 10⁻³ a + (12.70 ± 6.71) × 10−3 | 1.00 |
| X-axis; soldered | 1250 Hz | S = 0.91 ± 1.90 × 10⁻³ a + (13.73 ± 9.78) × 10−3 | 1.00 |
| X-axis; encapsulated | 1250 Hz | S = 0.92 ± 1.03 × 10⁻³ a + (6.92 ± 5.28) × 10−3 | 1.00 |
| X-axis; final E-yarn | 1250 Hz | S = 0.97 ± 1.84 × 10⁻³ a + (37.60 ± 9.46) × 10−3 | 1.00 |
| Axis | Frequency | Data Fitting | Coefficient of Determination (R2) |
|---|---|---|---|
| Z | 80 Hz | S = 1.09 ± 9.66 × 10⁻³ a + 0.03 ± 0.05 | 1.00 |
| Z | 800 Hz | S = 1.51 ± 9.19 × 10⁻³ a + 0.10 ± 0.05 | 1.00 |
| Z | 1250 Hz | S = 1.04 ± 45.00 × 10⁻³ a + 0.38 ± 0.23 | 1.00 |
| X | 80 Hz | S = 1.19 ± 2.24 × 10⁻³ a + 0.01 ± 0.01 | 1.00 |
| X | 800 Hz | S = 1.31 ± 6.19 × 10⁻³ a + 0.03 ± 0.32 | 1.00 |
| X | 1250 Hz | S = 1.36 ± 5.37 × 10⁻³ a + 0.09 ± 0.03 | 0.99 |
| Data Fitting | Coefficient of Determination (R2) | |
|---|---|---|
| Frequency dependence | S = (−3.18 ± 0.04) × 10−4 f + 1.18 ± 0.00 | 1.00 |
| Amplitude dependence: 80 Hz | S = 1.13 ± 0.47 × 10⁻³ f + (21.02 ± 2.40) × 10−3 | 1.00 |
| Amplitude dependence: 800 Hz | S = 0.92 ± 1.00 × 10⁻³ a − (3.85 ± 5.14) × 10−3 | 1.00 |
| Amplitude dependence: 1250 Hz | S = 0.76 ± 2.79 × 10⁻³ a + (23.14 ± 14.40) × 10−3 | 1.00 |
Publisher’s Note: MDPI stays neutral with regard to jurisdictional claims in published maps and institutional affiliations. |
© 2021 by the authors. Licensee MDPI, Basel, Switzerland. This article is an open access article distributed under the terms and conditions of the Creative Commons Attribution (CC BY) license (https://creativecommons.org/licenses/by/4.0/).
Share and Cite
Rahemtulla, Z.; Hughes-Riley, T.; Dias, T. Vibration-Sensing Electronic Yarns for the Monitoring of Hand Transmitted Vibrations. Sensors 2021, 21, 2780. https://doi.org/10.3390/s21082780
Rahemtulla Z, Hughes-Riley T, Dias T. Vibration-Sensing Electronic Yarns for the Monitoring of Hand Transmitted Vibrations. Sensors. 2021; 21(8):2780. https://doi.org/10.3390/s21082780
Chicago/Turabian StyleRahemtulla, Zahra, Theodore Hughes-Riley, and Tilak Dias. 2021. "Vibration-Sensing Electronic Yarns for the Monitoring of Hand Transmitted Vibrations" Sensors 21, no. 8: 2780. https://doi.org/10.3390/s21082780
APA StyleRahemtulla, Z., Hughes-Riley, T., & Dias, T. (2021). Vibration-Sensing Electronic Yarns for the Monitoring of Hand Transmitted Vibrations. Sensors, 21(8), 2780. https://doi.org/10.3390/s21082780


