1. Introduction
In the logistic chain domain, multiple stakeholders need to exchange data about shipments transiting from the shipper to the consignee. The data exchange purpose is to give visibility to all the stakeholders about the shipments progress in the logistic chain and trace the path as well as the transport conditions throughout the entire chain.
We refer to the data collected during shipments transit as traceability data, the system in charge of collecting, saving and sharing those data as traceability system and the whole process of data collection and processing as the traceability process.
Traditional traceability systems handle traceability data in a central system hosted by one of the stakeholders, which constitutes a risk on the availability of the traceability data (single point of failure). The lack of transparency in the qualification process could also be a source of dispute on the correct application of data handling and qualification rules agreed by all the traceability process stakeholders.
The advent of blockchain technology and smart contracts help develop new traceability systems. Such systems allow stakeholders to achieve the secure and transparent sharing of traceability data, using the blockchain secured and distributed ledger. In addition, smart contracts allow stakeholders to share data handling and decision-making rules, in order to ensure that the same agreed rules are applied by all the stakeholders.
Increasingly, IoT devices are used to automatically collect field data. Those data are used both for traceability purpose and to take automatic decisions, such as the creation of
shipment incidents, when one or more of the negotiated
shipment transport conditions are not respected. As a result, the human intervention is limited in the process, as well as process error probability. To automate the traceability process decision making, new traceability system architectures have been proposed in the literature combining smart contracts and IoT (see, e.g., [
1,
2,
3,
4]).
However, in the existing smart contracts and IoT traceability systems literature, many of the provided architectures propose to integrate the IoT data directly into the smart contract (see, e.g., [
1,
2,
3,
4]). This could lead to unsound decisions taken by the smart contract based on erroneous data collected and sent directly to the smart contract by the IoT data sources. To overcome this issue, we propose to introduce an IoT data qualification process in smart-contracts and IoT-based traceability architectures.
We proposed in [
5] to enhance traceability architectures using blockchain, smart contracts and IoT, combined with a lightweight IoT data qualification process. However, in this previous work, the proposed qualification process covered only outlier measure detection, which is only one facet of data quality. Furthermore, we did not compute the qualification at different levels such as the measure and the sensor level. Moreover, the IoT data qualification process was centralized at one stakeholder’s site, and there was no guarantee for the other stakeholders on the correct execution of the agreed IoT data qualification rules. In addition, the stakeholder in charge of the IoT data qualification represented a single point of failure of the architecture on the IoT data qualification part.
To overcome the above limitations, the main contributions of this article are threefold: (i) The literature review of IoT data qualification highlights that the data quality of a system is assessed by means of several dimensions. Considering the logistic chain properties, the first contribution is to identify the most relevant IoT data qualification dimensions and provide measurement methods for each of them. (ii) To help the stakeholders to get an end-to-end visibility of the data quality and to identify the quality issues causes, the second contribution aims at measuring the data quality at four levels: IoT data events, IoT data sources, shipments and IoT data sources-shipments associations. (iii) To ensure the stakeholders agreement on the traceability data, the data qualification rules, and the decisions taken based on the data, such as the creation of incidents, the third contribution consists in integrating the data qualification measurement methods in a traceability smart contract.
The rest of the article is organized as follows. In
Section 2, we present the logistic domain context and its requirements through an example use case.
Section 3 highlights the main research questions addressed in the paper together with their motivations.
Section 4 studies the works related to the IoT data quality and the use of the blockchain to assess this quality. In
Section 5, we present the use of the selected IoT data quality dimensions to measure the data quality.
Section 6 presents the architecture of the proposed traceability solution. The evaluation of our proposed IoT data quality assessment approach is presented in
Section 7. Finally, we conclude in
Section 8 and present some future works.
2. Medical Equipment Cold Chain Use Case
In this section, we present a business-to-business logistic chain emblematic example. Because of its specific constraints, the medical equipment cold chain is handled by specific transport means. We chose this use case for two reasons: (1) the requirement for transport monitoring; and (2) we worked with an ALIS customer specialized in the production of medical equipment and we were able to discuss with this customer about their traceability needs for this specific cold chain context.
Some of the equipment, such as perishable medical diagnostic kits used in blood tests, needs to be transported under strict conditions with a temperature between a minimum of +2 and a maximum of +8 C. The non-compliance with this temperature interval may render the medical diagnostic kits unusable. The stakeholders should be notified of any temperature non-compliance.
At least three traceability stakeholders are involved in the traceability system of this medical equipment cold chain: a shipper (at the origin of the transport request), a carrier (in charge of transport operation) and a consignee (the recipient of the transported equipment). In our context, we use the term shipment to designate any object entrusted to the carrier by the shipper, in order to be forwarded to the consignee.
The transport condition data are collected through IoT data sources declared by the stakeholders and every IoT data source has its own data communication interval. Among the declared IoT data sources used in our scenario, there is a connected object equipped with sensors that accompanies the shipments and that is assigned by the shipper.
For visibility and transparency purpose, the stakeholders need to securely share all the traceability data created manually or collected automatically by the IoT data sources. The stakeholders need also to be sure that the traceability data processing conforms to the rules agreed between the stakeholders.
The shipper is responsible for the shipment creation in the traceability system, with all the data required by the carrier for the good execution of the transport operation, such as the origin, destination, transport temperature thresholds and IoT data reception interval. In this scenario, we focus on the management of incidents that could be detected automatically by the traceability system, based on the data sent by the IoT data sources, such as the non-compliance with the negotiated transport temperature interval.
The data received from the IoT data sources will be used to automatically create incidents in the traceability process if necessary. Hence, these data should not be integrated directly into the system. A data qualification process is required to ensure that the IoT data quality is good enough to ensure the proper incidents detection. For this purpose, the stakeholders should have the ability to set the required thresholds for the IoT data quality. Thus, the data that do not meet the quality thresholds requirements could not be used in the traceability process.
The data qualification process has many advantages: it not only provides a quality degree to each shipment related IoT event and a performance measure of its associated data source but also helps the users to choose the most trustworthy data source and facilitates the detection of damaged ones in order to repair or replace them.
3. Research Questions and Motivations
Based on the above-mentioned use case, we can highlight six main research questions addressed in this article and their motivations: (1) How accurate are the data? In other words, do the data reflect the reality of the shipment transport operation? Measuring data accuracy avoids the use of unreliable data. (2) Are the data complete? Indeed, the existence of gaps in the collected data may affect the shipment traceability. (3) Are the data consistent? The consistency issue arises when the collected data assigned to a shipment comes from several sources with possibly discrepancies leading to incidents. In this case, an agreement could be defined to tolerate a minimum deviation between the data, for example, a gap of 0.5 C in the temperature may be considered as acceptable. (4) Are the data timely valid? That is, are the data compliant with the receiving window agreed between the stakeholders? The non-respect of this interval may significantly affect the stakeholder’s visibility and the required transparency of ongoing transport operations.
Each above question reflects a facet (dimension) of the quality process that this paper addresses and thus the main contribution of this paper is to propose quality measures for each dimension identified as relevant in our context namely: accuracy, completeness, consistency and currentness. These quality dimensions are defined in the next section.
In addition, to the above quality dimensions questions, there is a concern about quality granularity. (5) How can the system provide different levels of quality: data events, IoT data sources and per shipment performances? This high precision quality monitoring facilitates the identification at the right time of the data sources that need to be repaired or removed.
Finally, there is a question concerning transparency. (6) How can the data and the data quality measurement rules be shared securely among the stakeholders to ensure their agreement on the correct application of these rules? To address this issue, we propose to implement the above quality measures into a smart contract, in order to ensure the agreement of all the stakeholders on the correct application of the proposed quality measures.
4. Related Works
Data quality is not a recent research topic. The first data quality studies concerned databases. Many data quality aspects have been considered such as the accuracy, consistency and reliability to improve the quality of data inputs into databases and handle databases incompatibility and time critical delivery data [
6].
With the advent of the IoT as new data sources, the existing data quality studied aspects needed to be extended to the specificities of those new data sources. The data collected from IoT data sources need to be controlled even more due to the limited capacity of these sources to ensure the security and the quality of their data. The “Never trust user input” should evolve to “Never trust things input”, as stated by Karkouch et al. [
7].
Moreover, the emergence of blockchain opens new opportunities for systems that involve multiple stakeholders. The logistic chain domain, which involves multiple stakeholders, provides relevant use cases for this technology [
8], especially for traceability purpose [
9]. The blockchain promotes the development of smart logistics [
10], using smart contracts.
Before providing a literature review, it is important first to define some terms used in the domain of data quality and their meaning in the logistic context.
4.1. Data Quality Definitions
Data quality dimensions are attributes representing a single aspect of the data quality, as stated by Richard Y. Wang [
11]. In this work, we consider the following data quality dimensions:
accuracy,
completeness,
consistency and
currentness.
The
accuracy, as stated by [
12], refers to: “the degree to which data has attributes that correctly represent the true value of the intended attribute of a concept or event in a specific context of use”. In our context, it is difficult to know if a received measurement reflects the real
shipment situation, especially when the
shipment transport operation is ongoing. However, we can define an accuracy measurement method based on the received measure and the measure source specifications.
The
completeness, according to [
12], corresponds to “the degree to which subject data associated with an entity has values for all expected attributes and related entity instances in a specific context of use”. In our context, the completeness depicts the fact that all the expected events have been received by a data source or a
shipment according to the update interval agreed by all the stakeholders.
The
consistency, according to ISO [
12], refers to “The degree to which data has attributes that are free from contradiction and are coherent with other data in a specific context of use”. It is also referred to as concordance in some works [
13]. In our context, the
consistency dimension corresponds to the degree of coherence between IoT data events sent by different IoT data sources and related to the same
shipment.
The
currentness was defined by ISO [
12] as: “The degree to which data has attributes that are of the right age in a specific context of use”. It is also referred to as timeliness, currency, freshness, delay or contemporaneous, in some works [
13,
14]. In our context, an event is considered of the right age when it is received at the expected time according to the update interval agreed by the stakeholders and defined in the smart contract.
4.2. Related Works Study Criteria
The combination of the blockchain smart contracts and the IoT helps in the development of trusted [
15] and automated systems. However, the IoT data quality is a hindrance to the development and adoption of this new generation of systems.
In this article, we present the works related to the IoT data quality issue according to three criteria: (C1) the quality dimensions; (C2) the quality levels; and (C3) the use of blockchain smart contracts for data quality management.
4.2.1. Quality Dimensions (C1)
The IoT data quality issue has been addressed using data quality dimensions. For this purpose, the traditional data quality dimensions [
11] have been used and adapted to the IoT context needs [
13].
The definition of the IoT quality dimensions and their corresponding calculation methods facilitates their usage and application in the target IoT based systems. Due to the lack of works on IoT data using quality dimensions in the logistic chain context, we selected some representative related works from other domains.
Many of the existing works show the interest of using those quality dimensions for IoT data quality handling. In each work, the authors selected the dimensions relevant to their domain and defined the corresponding measurement methods for the selected quality dimensions.
Li et al. [
16] defined and measured the currency, availability and validity metrics in a pervasive environment (IoT context) and the problem of data expiration (data no longer usable). It is worth noting that, in the traceability context, the data do not expire. It is important to get all the data for traceability purpose even though the data received late will have a poor currentness quality index.
Sicari et al. [
17] proposed a quality-aware and secured architecture handling: accuracy, currentness, completeness and other quality dimensions. A framework for determining the quality of heterogeneous information sources was proposed by Kuemper et al. [
18], using the dimensions of accuracy and consistency.
To ensure a real-time data allocation and data quality in multiple partitions collection and storage, Kolomvatsos [
19] proposed a real time data pre-processing mechanism, using Fuzzy Logic and handling the accuracy dimension.
In the domain of Ambient Assisted Living (AAL) systems, Kara et al. [
20] proposed a quality evaluation model. Their approach is based on the definition and execution of quality metrics and the use of fuzzy logic to evaluate the metrics and decide of the data quality level. In the same precedent domain, Erazo-Garzon et al. [
21] defined, measured and evaluated the quality of data collected from an intelligent pillbox, using seven data quality dimensions, among them the accuracy, the completeness, the currentness and the confidentiality.
All the above works use some of or all our required IoT quality dimensions. However, their measurements methods do not meet our needs of dimensions definition and measurement at different levels: data event, data source and shipment.
4.2.2. Quality Levels (C2)
In the logistic chain context, the stakeholders need to be provided with a full quality visibility at different levels of the manipulated objects. This is our second criterion (C2). It is helpful for the data quality management and simplifies the investigation in case of discrepancy between the stakeholders IoT data sources. Some works proposed data quality models to handle this issue.
A generic data quality metamodel for data stream management was proposed by Karkouch et al. [
22]; in the evaluation of their work, the authors used the accuracy and completeness dimensions. There is also the work of Fagúndez et al. [
23] on a data quality model to assess sensors data quality in the health domain, using the dimensions of accuracy, completeness, freshness and consistency.
The above cited models do not meet our context needs. On the one hand, the data sources in our context are reused and affected by different shipments in different transport operations. On the other hand, to meet the criterion (C2) in our proposition, we provide the stakeholders with a full visibility of the data quality at different object levels, using an adequate quality model.
4.2.3. Blockchain Smart Contracts for Data Quality Management (C3)
Traceability data need to be shared securely among the stakeholders in order to ensure their agreement on the data quality and the correct application of the agreed data calculation methods. This is our third criterion (C3). The following representative works from the literature propose IoT-blockchain based architectures to handle this issue.
In the domain of crowdsensing platforms, there are many recent works, proposing to use the blockchain in order to improve the quality of the collected IoT data, such as the works of Gu et al. [
24], Nguyen and Ali [
25], Wei et al. [
26], Cheng et al. [
27], Huang et al. [
28], Zou et al. [
29] and Javaid et al. [
30]. Their propositions are based essentially on users’ reviews, reputation and reward mechanisms to incentivize the users to improve the quality of their provided data. Those mechanisms are not applicable in the logistic chain context, in which the stakeholders are known and responsible of their provided data.
Casado-Vara [
31] proposed an IoT data quality framework based on the use of a blockchain, in the context of smart homes. The proposed solution is limited to the accuracy dimension and does not involve multiple stakeholders, each having its own data sources as is in our context.
In the context of a fish farm, Hang et al. [
32] proposed a blockchain based architecture to ensure agriculture data integrity. Their proposed fish farm architecture includes an outlier filter, that removes measurements beyond the expected values. This outlier filter is implemented outside the blockchain, using a Kalman filter algorithm.
Leal et al. [
14] proposed a framework for end-to-end traceability and data integrity, in the domain of pharmaceutical manufacturing. They addressed the problem of temporal and multi-source variability using probability distribution methods. In our logistic traceability context, we do not need to estimate sensor measurement data, so we should just report these data as they are sent by sensors. If some data are missed or out of the expected ranges, this results in a quality incident on which the involved stakeholders need to agree.
In our proposition, we implement the data quality measurement methods in a blockchain smart contract in order to ensure a secured sharing and agreement of all the stakeholders on the correct application of the measurement method and the resulting data quality.
4.3. Summary of the Related Works Study
To enhance and secure the IoT data quality in the logistic chain, we propose in this article a data quality assessment architecture using accuracy, completeness, consistency and currentness dimensions (C1) in a blockchain smart contract for logistic chain traceability. The proposed architecture provides the logistic chain stakeholders with data quality visibility at different levels (C2) and guarantees the user agreement on the correct quality rules application (C3). Besides, the proposed architecture does not only increase the integrated data quality, but also the stakeholder’s trust and adherence to the resulting automatic decisions.
Table 1 summarizes the selected related works and how they meet the studied three criteria.
5. Data Qualification Using Data Quality Dimensions
In this work, the data qualification refers to the definition of data quality measurement methods and the application of those methods on every data received and handled by the smart contract.
We focus on the qualification of traceability IoT data. Because these data are automatically collected and used by the smart contract for the detection of incidents, their qualification is essential for building reliable and automated traceability system.
Thanks to a data quality study adapted to the logistic chain domain, we identified: (i) relevant IoT data quality dimensions; and (ii) their respective measurement methods.
The IoT data quality model purpose is to be implemented in the traceability smart contract, in order to assess the
shipment data quality and consequently improve the incidents creation process. Among the quality models proposed in the literature, the model by Karkouch et al. [
22] is the closest to our above needs, and we decided to implement and extend this model for the logistic chain domain.
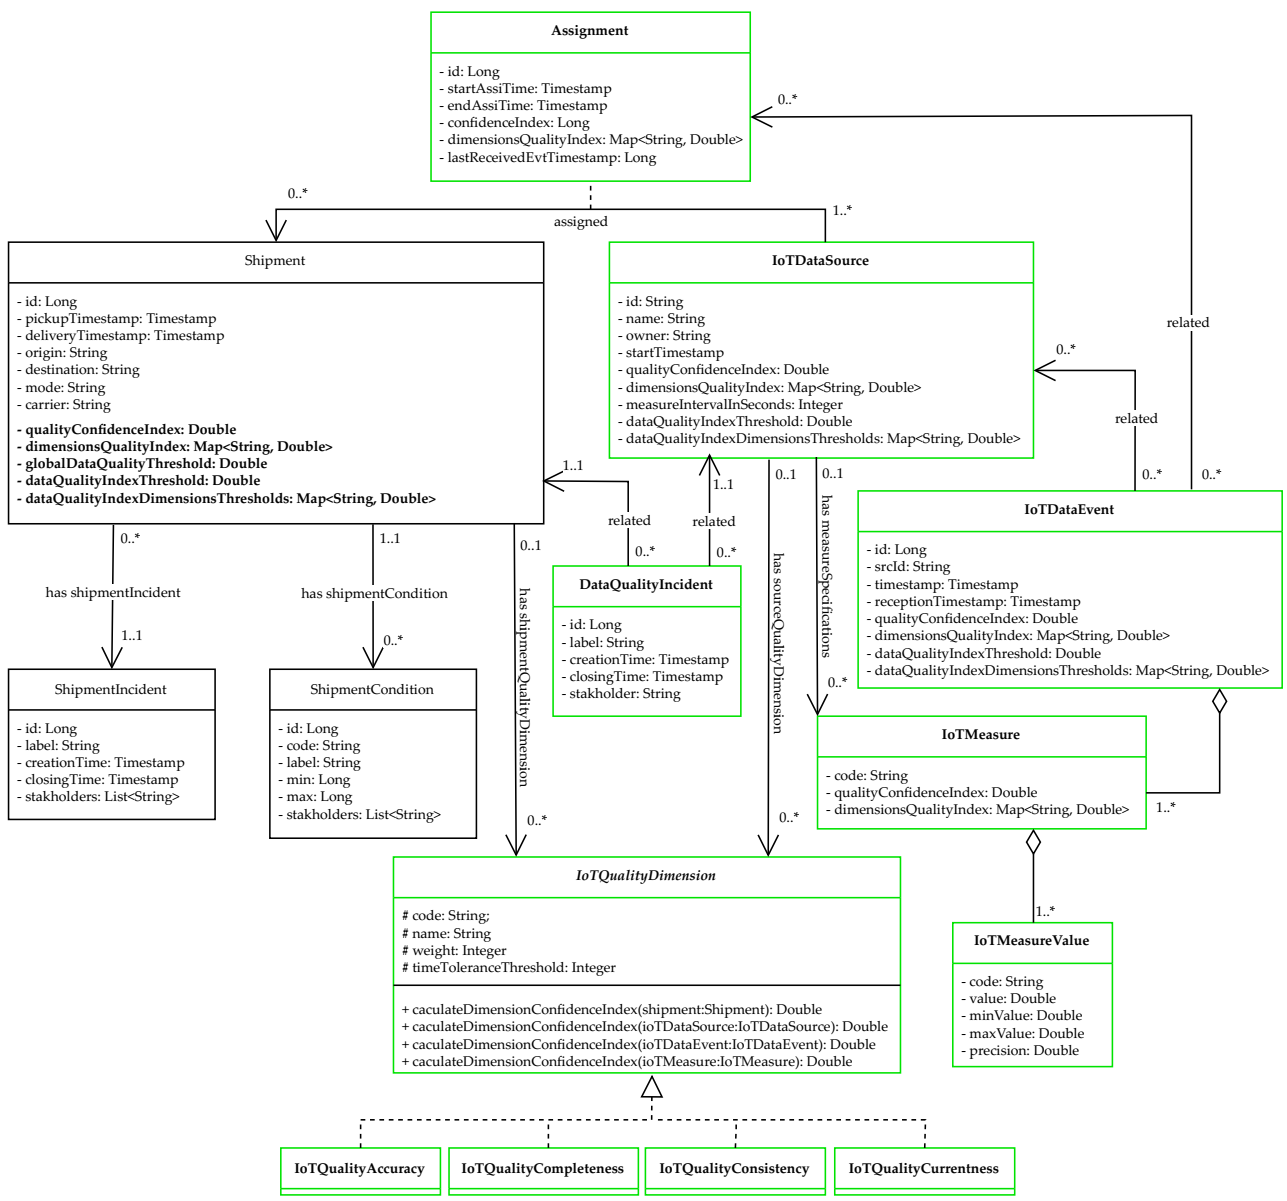
As depicted in
Figure 1, we added the
entity to collect the data quality at the
shipment level with its own
. Furthermore, for capturing the data quality during the association of the
and the
, we added the
entity which reflects this temporary relationship.
Furthermore, we highlight in
Figure 1 all the model entities and attributes added for the quality assessment purpose. The main entity of this model is
which has its own
and its own
affected to it through the
entity. It is worth noting that the
has a weight attribute defining the importance of the dimension according to the stakeholders needs.
In our context, we need to distinguish different application levels of each dimension, for quality visibility at every object level. The quality index resulting from a dimension application is calculated differently for each dimension related entity in the schema. In some cases (detailed in the next sections), an is not defined for some entities of the schema. For example, the completeness dimension is not defined for and ; it is used only for entities with an update time interval constraint such as and .
Moreover, we introduce in this model a , in order to provide users with an overview of the data quality for the main objects manipulated in our traceability system, which are the , , and .
The calculation of the quality index takes into account the weight
W of dimensions fixed by the users for
and
. We calculate this quality index for the
and
as an average of their
n and
m :
For the quality index calculation, we use the quality indexes of its related objects. Regarding the , we use the average quality of its related . The methods used to calculate the are detailed in the next sections.
The quality thresholds are set by the stakeholders to define the minimum accepted quality index. Values that do not respect this quality will be stored for traceability purpose but will not be used for dynamic incident detection.
To monitor the compliance of the received data according to both the quality threshold and the transport conditions defined in the smart contract, we added in the model, respectively, the entities: and . results from a non-compliance with the agreed quality thresholds and results from a non-compliance with the agreed business transport conditions. For example, consider a with an interval of possible values from 0 to 50 C, and monitoring a with business transport conditions of 2–8 C. If this sends a temperature value of 100 C, this value is considered as non-compliant with the quality thresholds and generates a . However, if the sent value is 20 C, it is considered as non-compliant with the business transport conditions and generates a .
In the next subsections, we detail how the dimensions are used to calculate the quality indexes for the different object levels.
5.1. Accuracy
The accuracy measurement method is based on the specifications (sensor measure precision value and sensor minimum and maximum measurable values). Using this method, we can ensure that the received measurement is a possible normal value that can be sent by the concerned .
Therefore, the received measurement could be used by the traceability smart contract, for example to create an incident, if the received measurement is out of the ranges fixed by the shipper for this specific measurement.
In the following subsection, we detail the accuracy calculation method depending on the object level.
Accuracy Levels
We identify five accuracy levels: the accuracy , the accuracy , the accuracy , the accuracy and the accuracy .
The accuracy as indicated by its name is related to only one value of the . It is used to indicate if a value of the is in the range of relevant and acceptable values of this specific , based on the specifications. For example, consider an m, with precision p, and and are, respectively, the minimum and the maximum possible values given by the manufacturer.
We calculate the
accuracy
using the following formula:
The
is composed of
n, and consequently we calculate the
accuracy
as an average of all its
accuracies:
The
accuracy
corresponds to an overview of the accuracies of all its related
. This is useful in our context where the
is considered as a coherent set of
. If this is not the case, the accuracy calculated at the
level can directly be used, and the
accuracy can be ignored. However, for an
with n related
, the
accuracy corresponds to the average of all the
related
accuracies:
The accuracy gives an overview of all the related accuracies, it is related to the historic of received from the . In our context, we consider that it is important to take in consideration this historic of in the calculation of accuracy, because it indicates the reliability of the since it has been deployed and used in our traceability system.
If the users are interested only in the
accuracies, the accuracy calculated at the
level could be reused at the
level in order to give them an
accuracy per
. The accuracy of an
corresponds to the accuracy average of all its related
:
Finally, the level accuracy emphasizes all the related accuracies for the specific time period in which the is assigned to the . Every is considered as an independent transport operation that should have its own accuracy value.
For a
with
n to
, the accuracy
corresponds to the average of all the
-
. For each
accuracy
, the number of
to be considered in the accuracy calculation, corresponds to the number of
sent by the
for this specific
relationship:
5.2. Completeness
The completeness measurement method calculates the gap in the data reception for a specific object. It concerns the levels of the , the and the .
5.2.1. Completeness Levels
At the
level, the completeness is calculated based on the source
, the source measure interval
I, the number of received
n from the
and the reception timestamp of the last
, related to the
:
The completeness means that all the expected of the assigned , have been received by the during the and association time period enshrined in the smart contract.
Consequently, for the , the frequency is at least one per IoT update time interval I defined in the smart contract. The highlights for the stakeholders the capacity of each to send all the expected data during its association with a . This helps the stakeholders to decide on the reusability of the for further in the case of a good completeness value or, otherwise, to take over the in order to identify the completeness source problem.
The
evolves during the
and the
association time period, and it is recalculated for every new
reception at the timestamp
, based on the current number of received
n, the
update interval
I, the
-
and
timestamps.
At the
level, the completeness
gives an idea of the completeness trend of all the
related
. It is calculated as a
average of the
assigned to the
:
5.2.2. Completeness Incidents
The completeness problem reflects the missing
. Many reasons could be at the origin of missing
: network errors, synchronization problems or device malfunctions [
33]. If it is not handled, missing data seriously affect the reliability of the data collected through the
.
We propose to generate a completeness incident, if the completeness index of the object fall below the completeness threshold fixed by the stakeholders. The update-missing incident created by the smart contract will also remain there in order to trace the history of data quality problems related to the event .
5.3. Consistency
It is important to calculate the coherence degree between and to alert the stakeholders in the case of incoherence detection. The stakeholders should take a corrective action, such as identifying and removing failing , adapting new threshold values, etc.
The main in this work is the shipper shipment connected object. However, other could be added by any of the transport stakeholders. When two or more assigned to the monitor the same transport conditions, we calculate the consistency of those , by comparing their .
The comparison takes into account two tolerance thresholds: the time tolerance threshold and the measure tolerance threshold . Those two thresholds should be defined at the creation for every assigned to the , of course through a mutual agreement between the stakeholders in charge of those .
Consistency Levels
The consistency dimension concerns the levels of
and
. When an
is received from
at a timestamp
, and contains a list
of
, we check if there are other
related to the
and sent by other
, verifying that for each
, received from
at the timestamp
and containing a list
of
:
where
are compared using their codes (see
Figure 1).
If there is only one
for the
, or there are no
verifying the above conditions, then there is no consistency calculation to do. Otherwise, the
consistency is calculated using the following method:
The
consistency
gives an overview of the
data consistency between all the
related to the
and monitoring the same transport conditions. It is calculated as an average of the
related
consistency:
.
5.4. Currentness
In the logistic traceability context, the currentness dimension may not be critical. Indeed, the most important is to detect incidents, even though the data are received late. However, currentness may reveal incidents concerning data acquisition. Thus, the stakeholders define the currentness threshold according to the use case.
5.4.1. Currentness Levels
We consider the following currentness levels: , and .
For an
, the currentness
is calculated based on the previous
reception timestamp
, the update interval defined in the smart contract
I, the expected next
timestamp
which is equal to
and the current
reception timestamp
.
For the , the interval I is a shipper requirement that should be met through the sending of an to the smart contract, every time that this interval has elapsed. Consequently, the currentness indicates not only the quality of the data but also the meet degree of one of the more important shipper requirements defined in the smart contract, the update interval I.
Furthermore, the at the level is calculated using the same above method, but it is worth noting that the has its own update interval that could be different from the update interval.
Regarding the , the currentness corresponds to the degree to which the has met the update interval time requirement, in the entire history of its related , including the last received .
The currentness dimension helps the users in the choice of the
to be assigned to the
, users will always choose the
with the highest currentness among the available
. The
currentness
is calculated as the average of all the
related
:
From the perspective, the currentness indicates the degree to which the shipper update time interval requirement has been met for the by all its related , during the - association time period. To measure the currentness performance of the - association, the currentness calculated for this association is saved in the object.
The
is useful when the
stakeholders need to investigate a low
currentness, as it helps to identify the
related
(s) responsible(s) of the low currentness value. The
currentness
corresponds to the average
of all its
n related
objects. The
is calculated as a
average of the
received from the
for the
, during their
association:
5.4.2. Currentness Incidents
There are two currentness control points, the reception of the by the stakeholder IS (shipper IS, carrier IS or consignee IS) and the reception of the by the smart contract. In case of non-reception of the by the stakeholder IS, this leads to a missing update on the smart contract side.
The is configured to send an every n seconds. If this interval has elapsed and no new has been received from the , the situation is considered as a missing update problem.
The missing update is not critical if the IoT update interval of the smart contract is larger than n seconds, because the smart contract generally does not wait for a new as long as this update interval does not expire.
In contrast, if the update interval is equal to n seconds, the stakeholder IS notifies the smart contract in the case of missing data. Once notified, the smart contract assigns a missing update related incident to the owner. The origins of this kind of incidents are multiple; for example, the is not able to connect to the IoT network, the has internal problem or an IoT cloud data platform problem.
6. The Distributed Architecture of the Traceability System
This section presents the architecture of the proposed traceability solution and its main components: the blockchain smart contract and the IoT data sources.
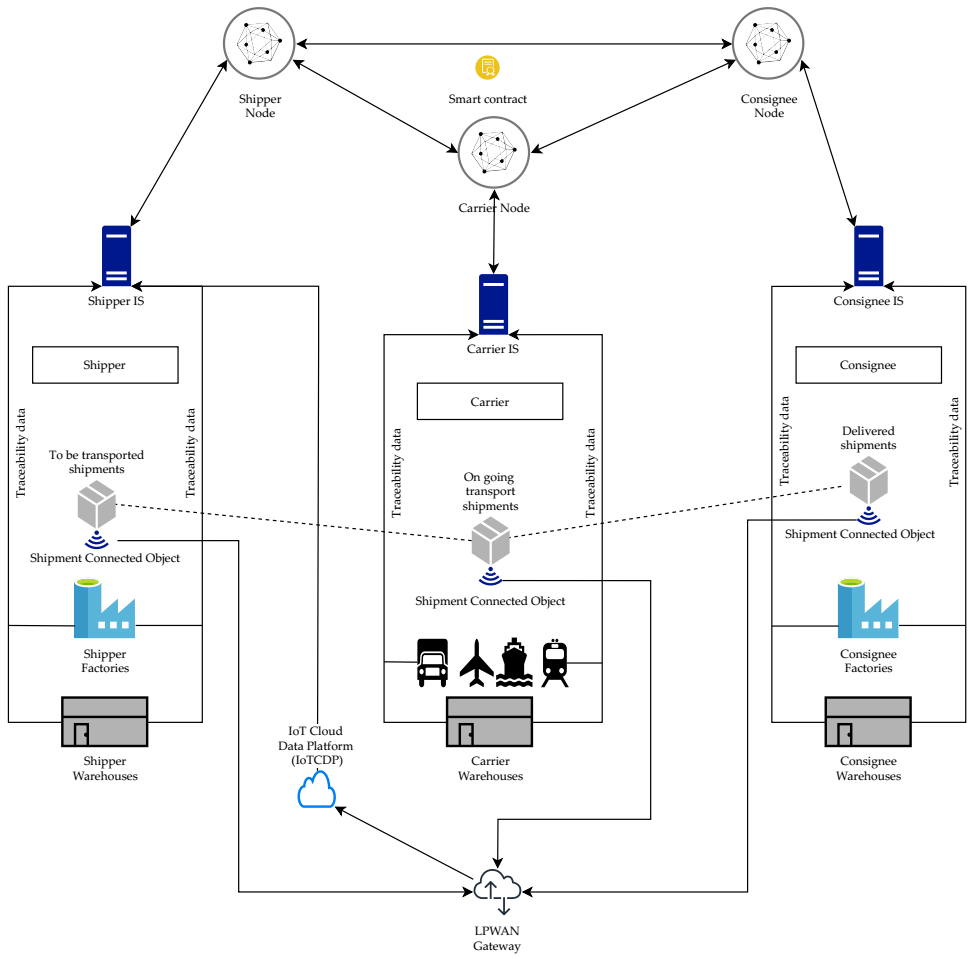
To respond to the identified criteria for secured traceability data, data qualification and transparency, we propose a distributed, secured and trusted architecture, based on the use of blockchain smart contracts, as depicted in
Figure 2. The main components of this architecture are a smart contract shared by all the stakeholders and IoT data sources. The arrows in this figure indicate data transmission directions.
For the smart contract component, we chose to work on a Hyperledger Fabric blockchain [
34]. It is a permissioned blockchain that presents many advantages in comparison to the other blockchains, among them: a node architecture based on the notion of organization to establish a trust model more adapted to the enterprise context, the support of the Go, Javascript and Java languages for writing smart contracts and a parameterized consensus protocol [
5].
The smart contract is installed on the top of a blockchain involving all the stakeholders. This smart contract holds all the rules about the collected traceability data management, the incident management and the IoT data qualification. Those rules have been validated by all the traceability system stakeholders.
IoT data sources are assigned to each shipment. They are responsible of the field data collection about the shipment transport conditions.
It is worth noting that the three stakeholders depicted in
Figure 2 are given as examples. As many stakeholders as needed may be added to this architecture. The addition of stakeholders is enabled by the underlying Hyperledger Fabric- based architecture [
34]. In addition, the maximum number of stakeholders in the context of logistic chain is limited. For example, in our use case, this number is of the order of tens stakeholders.
The stakeholders to be added to this architecture are those who need to participate in the traceability process. They are added before the creation of any shipment transport operation in which they will be involved.
6.1. The Smart Contract
Smart contracts are “trusted distributed applications” [
34]. They are secured by the underlying blockchain and the peers consensus mechanism. In the transport traceability context, we need a distributed and secured application to share traceability data among all the traceability process stakeholders and ensure their agreement on the shared data quality and the incidents created based on this data.
We proposed in [
5] to implement a lightweight IoT data qualification application and a traceability smart contract handling all the
shipment transport operation process. The implemented smart contract allowed the stakeholders to define all the transport conditions terms, update the transport status and transport related milestones status, integrating IoT data about the
shipment transport operation progress and creating both manual or automatic transport related incidents.
The contractual constraints, negotiated between stakeholders, are enshrined in the smart contract, and should be respected by all the stakeholders. Any gap between those constraints and the data provided by a stakeholder results in a non-compliance incident created automatically by the smart contract. The contractual constraints are communicated to the smart contract by the shipper system at the shipment creation time.
In this article, we extend the traceability proposal presented in [
5] to overcome two important limitations.
(i) The IoT data qualification is centralized at the
shipper side, and there is a lack of guarantees for the other stakeholders on the good execution of the agreed IoT data quality calculation rules.
(ii) The lightweight IoT data qualification module is limited to data outlier’s detection.
Therefore, we propose in this work to enhance the IoT data application through the implementation of the quality model presented in
Section 5, into the traceability smart contract. This allows ensuring the stakeholders agreement on the correct application of the data qualification rules. The data qualification module is also improved by the integration of the accuracy, completeness, consistency and currentness dimensions.
that do not conform to the defined IoT quality model constraints generate visible by all the stakeholders. They are not discarded but saved in the blockchain for audit purpose.
As examples of decisions taken automatically by the smart contract based on the received events,
Table 2 shows some temperature events values received by the smart contract, their Quality Indexes (QI) and their corresponding decisions. For these examples, we consider multiple IoT data sources with manufacturer temperature specifications interval of [0
C, 50
C]. Those data sources are assigned to a
shipment with a temperature conditions transport interval of [2
C, 8
C]. The quality dimensions’ weights are set to 4 for accuracy, 4 for consistency and 1 for Currentness. If the event QI is below the quality index threshold (0.7) a
is generated for the event. Consequently, the event QI is calculated as follows:
where 9 is the sum of dimensions’ weights (
).
6.2. The IoT Data Sources
In the proposed traceability architecture, the IoT data could be received from many IoT data sources. Each stakeholder could decide to assign an IoT data source that it owns to a shipment in which it has a stakeholder role, at any time during the shipment progress in the logistic chain. The only condition to do so is that the IoT data source and the shipment have already been created in the smart contract.
The assignment of an IoT data source to a shipment is for a limited period. Every data source assigned to a shipment sends IoT data about the shipment transport conditions at a fixed time interval defined in the shipment smart contract instance.
If a data-related incident is detected by the smart contract, it is automatically affected to the IoT data source owner declared in the smart contract. The smart contract has a detailed description of the IoT data source specifications collected at the data source creation in the smart contract. This is a requirement for the correct application of the data quality measures.
The shipper in our context has a principal IoT data source which is the shipment connected object accompanying the shipment. The role of this object is to collect data about the shipment transport conditions, throughout the transport operation.
To send the collected data to the shipper IS (Information System), the connected object uses an LPWAN (Low Power Aera Network) network Gateway, which transmits the received messages to the IoT Cloud Data Platform (IoTCDP) before their reception in the shipper IS.
The shipper IS sends the received messages to the shipper node including the connected object id of the messages. This connected object id is used by the smart contract to link the received IoT messages to the right shipment in the smart contract. In this context, the data are pushed by the IoT object. The pull/push of data from/to the connected object is out of the scope of our work. The shipment connected object collects data about the shipment pickup, transport and delivery conditions.
Each stakeholder could declare other IoT data sources, such as IoT data sources related to factories, warehouses, transport vehicles, etc. In general, every data source that can collect and send automatically measurements about the shipments could be declared by the stakeholder as an IoT data source. Moreover, all IoT data sources, except the shipment connected object, help to collect data about the shipment conditions in a specific segment of the transport operation. Only the shipment connected object that accompanies the shipment continues to collect data about the shipment transport conditions during the whole transport operation.
7. Evaluation
The objectives of this section are: (i) to evaluate the proposed quality measures; (ii) to evaluate the impact of the IoT data quality module on the number of created incidents; and (iii) to evaluate the impact of the IoT data quality module on the IoT data event insertion time in the blockchain.
We evaluated our proposed quality measures to measure their pertinence and performance. We also monitored the number of quality incidents created to highlight the impact of the quality module. The number of shipment incidents was also monitored to emphasize the impact of the quality module on the business decisions.
The IoT data event insertion time in the blockchain was also measured in our tests, firstly with the quality module activated and then with the quality module inactivated, in order to evaluate the impact of our proposed quality module on the data event insertion time and ensure the final users that this time is acceptable while ensuring the quality.
7.1. Smart Contract Architecture
For the implementation purpose, we used the same architecture used in our previous work on the traceability using smart contracts and IoT [
5]. It is an architecture based on the use of Hyperledger Fabric as the blockchain implementation, with three peers (stakeholders): a
shipper, a
carrier and a
consignee. On the top of this blockchain, we implemented our traceability and IoT data qualification smart contract.
The smart contract used in this evaluation was developed on the top of a Hyperledger Fabric blockchain, using the Fabric Java Framework. We used in this evaluation a Virtual Machine (VM) with the characteristics depicted in
Table 3.
Furthermore, we set the Hyperledger Fabric block creation timeout to 1 s and the maximum number of transactions per block to 15. This means that, after the reception of a new transaction, the system will trigger the block creation either after a time wait of 1 s or after a total number of 15 new transactions is reached. In addition, we used in this evaluation the Raft consensus algorithm, with a unique ordering service node [
5].
In the existing traceability smart contract [
5], we added many new methods such as
and
. The
method inserts the data source given as input in the blockchain. The
method assigns an existing IoT data source to an existing
shipment, using their IDs. Based on the quality measures proposed in this article, we updated the
method with the following new functionalities:
(i) calculate the event quality measures; and
(ii) update the IoT data source and the quality measures of the
shipments related to this IoT data source.
7.2. Evaluation Experimental Choices
Due to a lack of real data to evaluate the proposed architecture in our use case, we chose to simulate our use case data with a well-known dataset in the IoT domain. The Intel Berkeley dataset is a collection of sensor data, collected by Intel research team in the Intel Berkeley Research lab, between 28 February and 5 April 2004 [
35]. An example of the dataset content is depicted in
Table 4.
To adapt this dataset to our context, we considered every sensor as an IoT data source. This gives us 54 data sources to be handled. For the shipments, we used every 24 h of sensor data collection as a shipment, which results in 2052 shipments (54 sensors multiplied by 38, the number of data collection days), for the whole dataset.
Furthermore, we considered only the temperature measures in this evaluation because it is the main measure for our use case, but the module could be used to handle any other measure type.
We began the evaluation phase by defining the user’s quality thresholds requirements for all the data sources and shipments. We used the same threshold for the data sources, the shipments and the four quality dimensions. We made a series of tests by varying the defined threshold, going from 0 (no quality constraints) to 1 (strict quality), to show the impact of those thresholds on the number of created quality and shipments incidents.
In
Table 5, we establish a classification of data quality indexes for our dimensions and objects. This classification helps in the presentation and the analysis of the evaluation results.
We chose the following weights for the quality dimensions based on their importance for the use case in the context of the medical equipment cold chain: a weight of 4 for the accuracy, the completeness, and the consistency, which are the most important for our users, and a weight of 1 for the currentness, which is not as critical as the other dimensions, as explained in
Section 5.
For the
shipment incidents, we chose an accepted temperature interval of 20 to 25
C based on the work of Hui et al. [
36]. Beyond this temperature interval, if the received event quality is compliant with the
shipment quality threshold, this event results in a
shipment incident created for all the
shipments that have an active assignment relationship with the event data source.
There was no information in the dataset about the sensor’s precision value. Consequently, we chose to set this value to 0.5 C, which is a recurrent value in the temperature sensors.
In the following evaluation results, we did not take into account the sensor 5 from which we did not see any event. We also ignored some other events with the sensor IDs 55, 56 and 58, because in the dataset reference the number of sensors was only 54, and events coming from the same sensor with the same event number (113,474 events in the dataset).
There were also 355 events in the dataset that we could not parse correctly due to their data presentation errors and 526 incomplete lines, from which we could not get all the event required data. This results in a total of 2,199,327 events integrated correctly in our quality tests, from a total of 2,313,682 events present in the dataset.
We used the event timestamp in the dataset as an event reception timestamp in this evaluation. Moreover, we used this timestamp to order and identify the events, for shipment incident creation and closing purpose. The results of this choice were 10,299 duplicated events, because they had the same timestamp as previously received events from the same sensor.
Furthermore, we use the quality threshold to define the stakeholder’s requirement for the quality indexes of events to be integrated in the data source or sent to shipments. All the events with a quality index below the defined quality threshold value results in a quality incident and are not used to create shipment incidents in case of non-compliance with the agreed transport conditions. If the quality incident is detected by the data source, it will not send the event to its related shipments.
7.3. Results Concerning the Accuracy, Completeness and Currentness Dimensions
Firstly, regarding the accuracy, the sensors used to collect the Intel Berkeley dataset, a valid temperature value should be in the range of 0–50
C according to [
37], otherwise we consider this temperature as inaccurate.
Regarding the completeness, we used the following parameters: the update interval of 31 s, the maximum timestamp among the already integrated events timestamps, the start IoT data source and the shipment start timestamp. We set the IoT data source start timestamp at 28 February 2004 at 00:00:00 am, and, for the shipment, the start timestamp is the shipment date and the start time set at 00:00:00 am and the end at 11:59:59 pm.
Concerning the currentness, we used the measure interval of 31 s given for the dataset. We used this same update interval for the data sources and the shipments. In our tests, we did not consider the difference that could exist between the event reception timestamp and the event production timestamp. This difference could affect the test and need to be addressed in future works.
Table 6 shows the classification of quality results obtained for the sensors (data sources), regarding the different quality dimensions defined in this work and using multiple quality threshold values. Those results show that in the 53 retained sensors: 42 have a good accuracy, 29 have a poor completeness and 29 have a lower currentness.
Regarding the global sensor quality index, most sensors (38) have a low-quality index. If the quality threshold is set to a good quality value (e.g., 0.7), only 15 sensors are usable, and, in the case of threshold of high quality (e.g., 0.9), there is no usable sensor in this dataset.
Thanks to the quality module, all the events with a quality incident problem are not integrated into the shipments assigned to the event data source, and this keeps the shipment events quality at the level fixed and agreed by all the stakeholders. For example, in the case of Sensor 45, when we set the quality threshold at 1, 9% of the events received from this sensor have not been integrated into the source related shipments, due to their quality problems.
In
Table 7, we can clearly see the impact of the threshold choice on the percentage of quality incidents. This percentage represents the events that do not respect the agreed quality thresholds. The events are filtered at the data source level according to the selected quality threshold value.
Consequently, the percentage of quality incidents drops from around 25% of the total received events for a threshold at 0.5 to around 21% when the quality threshold was greater or equal to 0.7. The percentage of
shipment incidents evolution is not linear due to the
shipments number evolution depending on the selected quality threshold, as depicted in
Table 8.
Regarding the
shipments quality results, it is important to note that there were 421
shipments for which we did not receive any event, no matter what the quality threshold value was. This number increases to 821
shipments, when we set the quality threshold at 0.5, 0.7, 0.9 or 1, as depicted in
Table 8. Consequently, we did not consider those
shipments in the following
shipment quality results, because all our quality dimension calculations are based on the events values and timestamps.
Table 9 shows that the percentage of
shipments with a high accuracy level increase as the
shipments quality thresholds increases, and this is the same for the currentness. The percentage of events with a poor completeness index increases due to events blocked by the quality threshold at the data source level.
The shipment quality index also is improved by the quality threshold increase; for example, we went from 27% of poor data quality shipments when the quality threshold was at 0 to only 2%, when the quality threshold was up to 0.5.
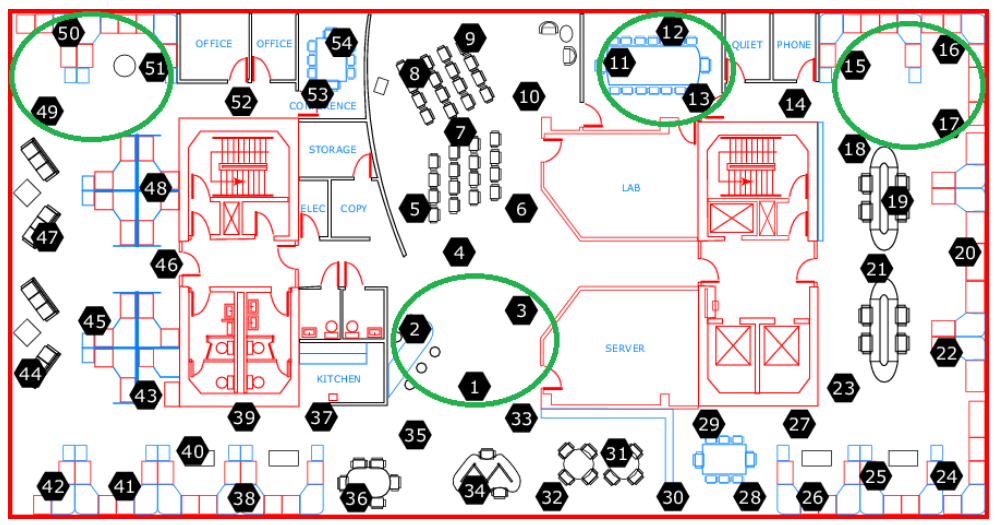
7.4. Results Concerning the Consistency Dimension
For the consistency evaluation, we selected four groups of sensors placed in proximity zones, as depicted in
Figure 3: {1, 2, 3}, {11, 12, 13}, {15, 16, 17} and {49, 50, 51}. For each group, we linked each sensor to all its related sensors
shipments in the same sensors group.
The total number of shipments related to the selected groups was 456 (12 sensors multiplied by 38 data collection days). There were 84 shipments related to those groups, for which we did not receive any event from the sensors, whatever the quality threshold value. This number increases to 171 shipments when we set the quality threshold at 0.5, 0.7, 0.9 or 1, due to the events quality filtering at the data source level.
Furthermore, we set in this evaluation the tolerance time interval to 31 s and the consistency tolerance temperature to 0.5 C. This means that two events are considered as eligible to the consistency test only when their timestamps difference is lower than 31 a, and they are considered as concordant if their reported temperatures difference is lower than 0.5 C.
Table 10 summarizes the consistency evaluation results for the selected sensors groups. The group {1, 2, 3} has at least 76% of its
shipments with a high consistency index. Those results show that the events reported by the group {1, 2, 3} were more concordant than those reported by the other groups.
The consistency results for the selected groups were generally good to high, except for 3% of shipments related to the group {1, 2, 3}, when the quality threshold was at 0. This shows the impact of the quality threshold on the consistency quality results.
7.5. Impact of the IoT Data Quality Module on the IoT Data Event Insertion
For the smart contract IoT data quality evaluation, and due to our blockchain architecture response time (around 1 s per operation), we selected a sample of 3000 events from the dataset. This sample corresponds to the first 1000 events received from the Sensors 1–3 on 28 February 2004.
The average response time of the using the 3000 events data sample was around s, with an average standard deviation of s. When we disabled the quality module, with the same data sample, the average response time of this method drops to around s, with an average standard deviation of s.
This result shows that our quality module adds only around s to the event integration time. The additional quality module cost is acceptable regarding the data quality improvement brought by this module.
7.6. Related Works Discussion
As shown in
Section 4, the works of Casado-Vara et al. [
31], Hang et al. [
32] and Leal et al. [
14] are the closest to our work.
Casado-Vara et al. [
31] proposed a vote method to address the accuracy and the consistency problems. Their vote method is based on the game theory to find a cooperative temperature among all the used temperature sensors. It is not applicable in our context, because we have different data sources owned by different stakeholders, and we need to report all the data sent by those data sources for audit purpose.
In the case of discrepancy between the stakeholder’s data sources related to the same
shipment, we need to trace this discrepancy, and, if it goes below the fixed quality threshold, a corresponding quality incident is created by the smart contract. However, the vote method in [
31] could be used in the very specific case of many
shipments with similar data sources, the same
shipper, the same
carrier and from which we want to have a global measure trend.
Hang et al. [
32] proposed a Hyperledger Fabric based architecture. This blockchain implementation choice is perfectly adapted to our B2B use case, and we used the same in our proposed architecture. However, they only addressed the accuracy problem (outlier filtering) using the Kalman filter.
Besides, the standard version of Kalman filter did not meet our needs, because the outlier interval limits are not fixed and evolve according to the received data. This could be problematic when the Kalman filter goes in fail mode, as stated by Berman [
38]. The usage of an assisted version of the Kalman filter needs to be explored in future work.
Leal et al. [
14] proposed using an Ethereum traceability-based architecture. Their Ethereum choice is justified by the solution monetization goal. However, in our use case, we chose to work with Hyperledger Fabric which does not need any cryptocurrency management and has an organization architecture more adapted to our B2B logistic chain context, in terms of data access levels management.
In addition, Leal et al. [
14] addressed the accuracy, consistency and currentness problems using probability distribution methods, but they did not provide further details about their application and evaluation of those methods.
Furthermore, the authors of [
14] proposed to filter the data inside and outside the blockchain, which is a good idea, and we already have in our architecture the inside blockchain data filtering. Besides, we need to explore the adding of a data filtering first level outside the blockchain, in future works.
The outside blockchain filtering needs to be done carefully, because it should not prevent the blockchain from getting the required traceability data; although, in some cases these data will be outliers, they need to be traced for further audit purposes.
7.7. Conclusions on the Evaluation
This evaluation section demonstrates the pertinence of the proposed IoT data quality module and the impact of this module on the data to be used in the traceability smart contract. The entire data qualification process is executed in a secured and distributed application on which users agree on every datum to be included, on its qualification process and decisions to be taken based on this datum.
It is worth noting that the choice of the quality thresholds has a huge impact on the data filtering process set at the data source level. The events with a quality index below the defined quality threshold will never be sent to the shipment. This leads directly to data loss at the shipment level. For this reason, stakeholders may prefer selecting a good quality threshold ([0.7,0.9]), rather than a high one ([0.9,1]).
Although the proposed architecture evaluation shows encouraging results, this architecture still needs to be tested in a real-life scenario with more data and stakeholders to get more information about its real performances.
8. Conclusions and Future Works
In this article, we propose a distributed architecture and a smart contract to enhance the IoT data quality in the context of logistic traceability. The proposed architecture uses a model of IoT data quality with four main data quality dimensions: accuracy, currentness, completeness and consistency.
We also propose an approach for the calculation of the selected data quality dimensions. The dimensions calculation results are used in our traceability smart contract to set and control the data quality of events, data sources, shipments and shipments data sources associations.
The proposed architecture ensures the stakeholders agreement on the data quality calculation and application rules, and consequently their trust in the decisions taken automatically by the traceability smart contract. We evaluated our proposed IoT data quality assessment architecture based on an online available dataset, and the results show the relevancy of this architecture.
This work could be extended by evaluating the scalability of the proposition when adding more stakeholders. The approach used to calculate the quality dimensions could be combined with algorithms, such as DBSCAN [
39] or an assisted version of the Kalman filter [
40], to improve the quality index calculation.
The blockchain data charge could be alleviated by adding in this architecture a first level of data filtering on each stakeholder side. The IoT data sources’ security and interoperability also need to be addressed. Finally, the architecture evaluation needs to be done in a real-life scenario to ensure its performance in the context of logistic chain traceability.


 ,
, 
