
A Non-Invasive Millimetre-Wave Radar Sensor for Automated Behavioural Tracking in Precision Farming—Application to Sheep Husbandry

 , ,
, ,  and
and
Abstract
:1. Introduction
2. Material and Methods
2.1. Sheep
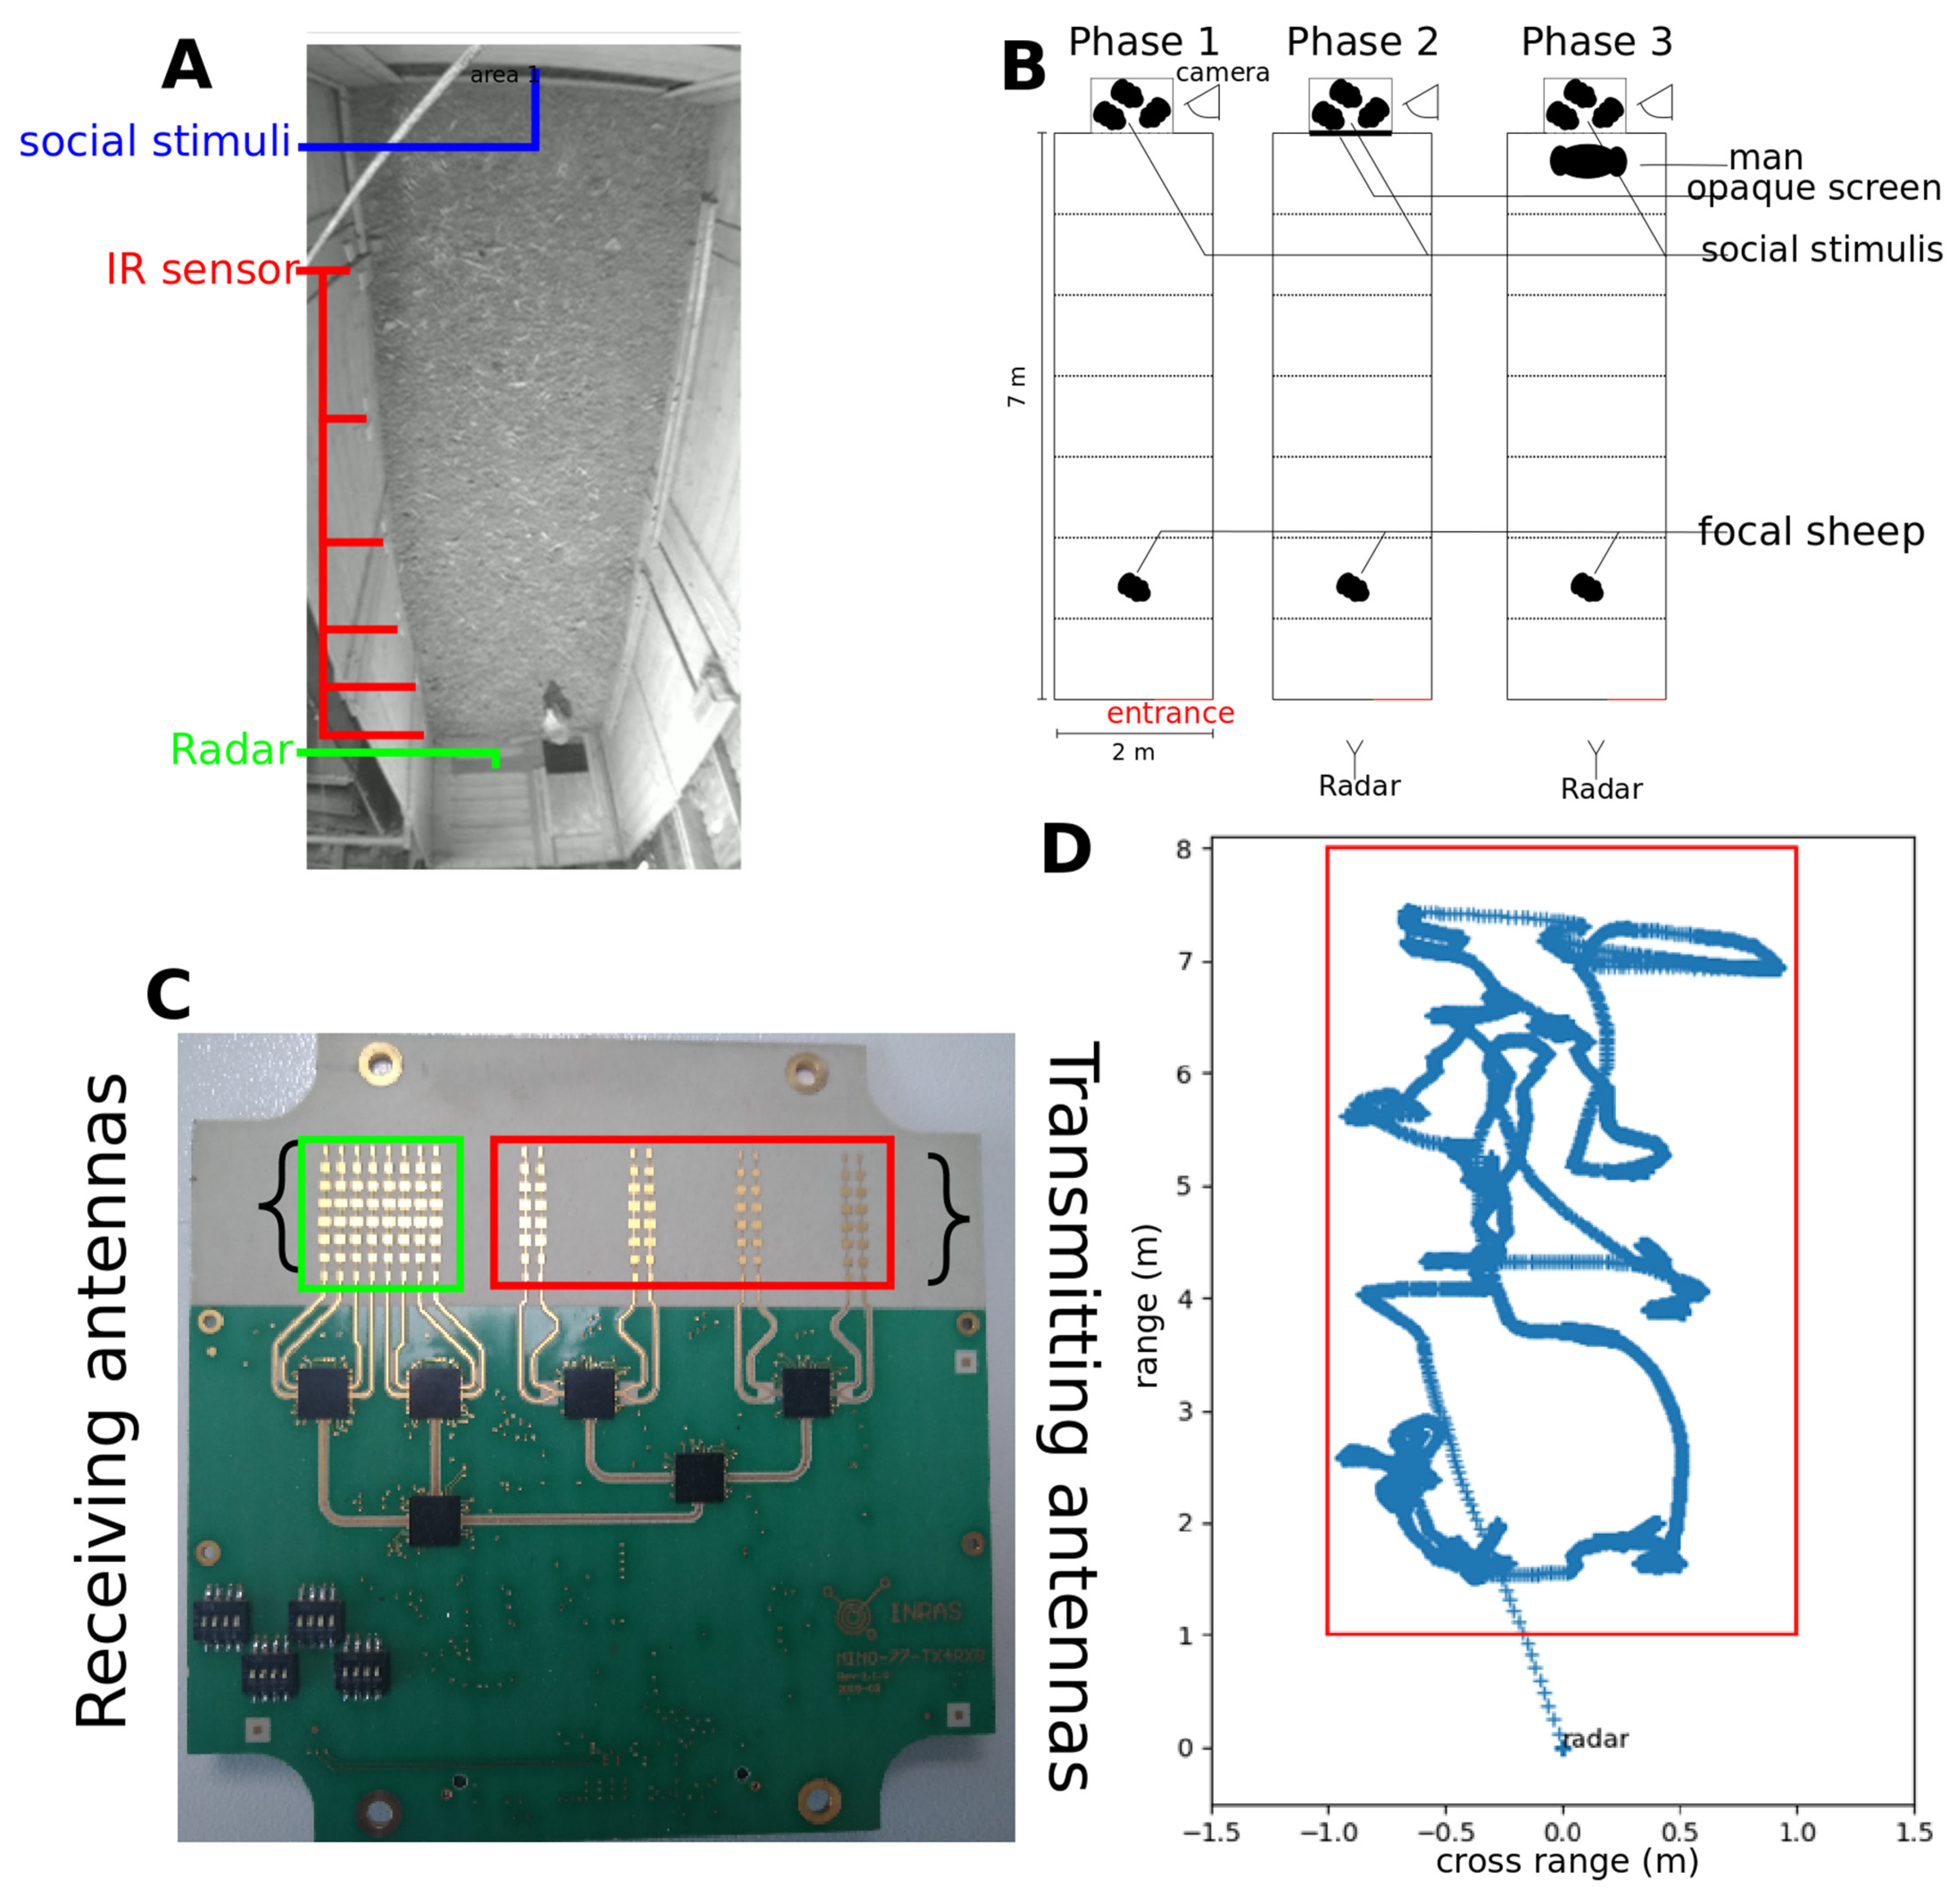
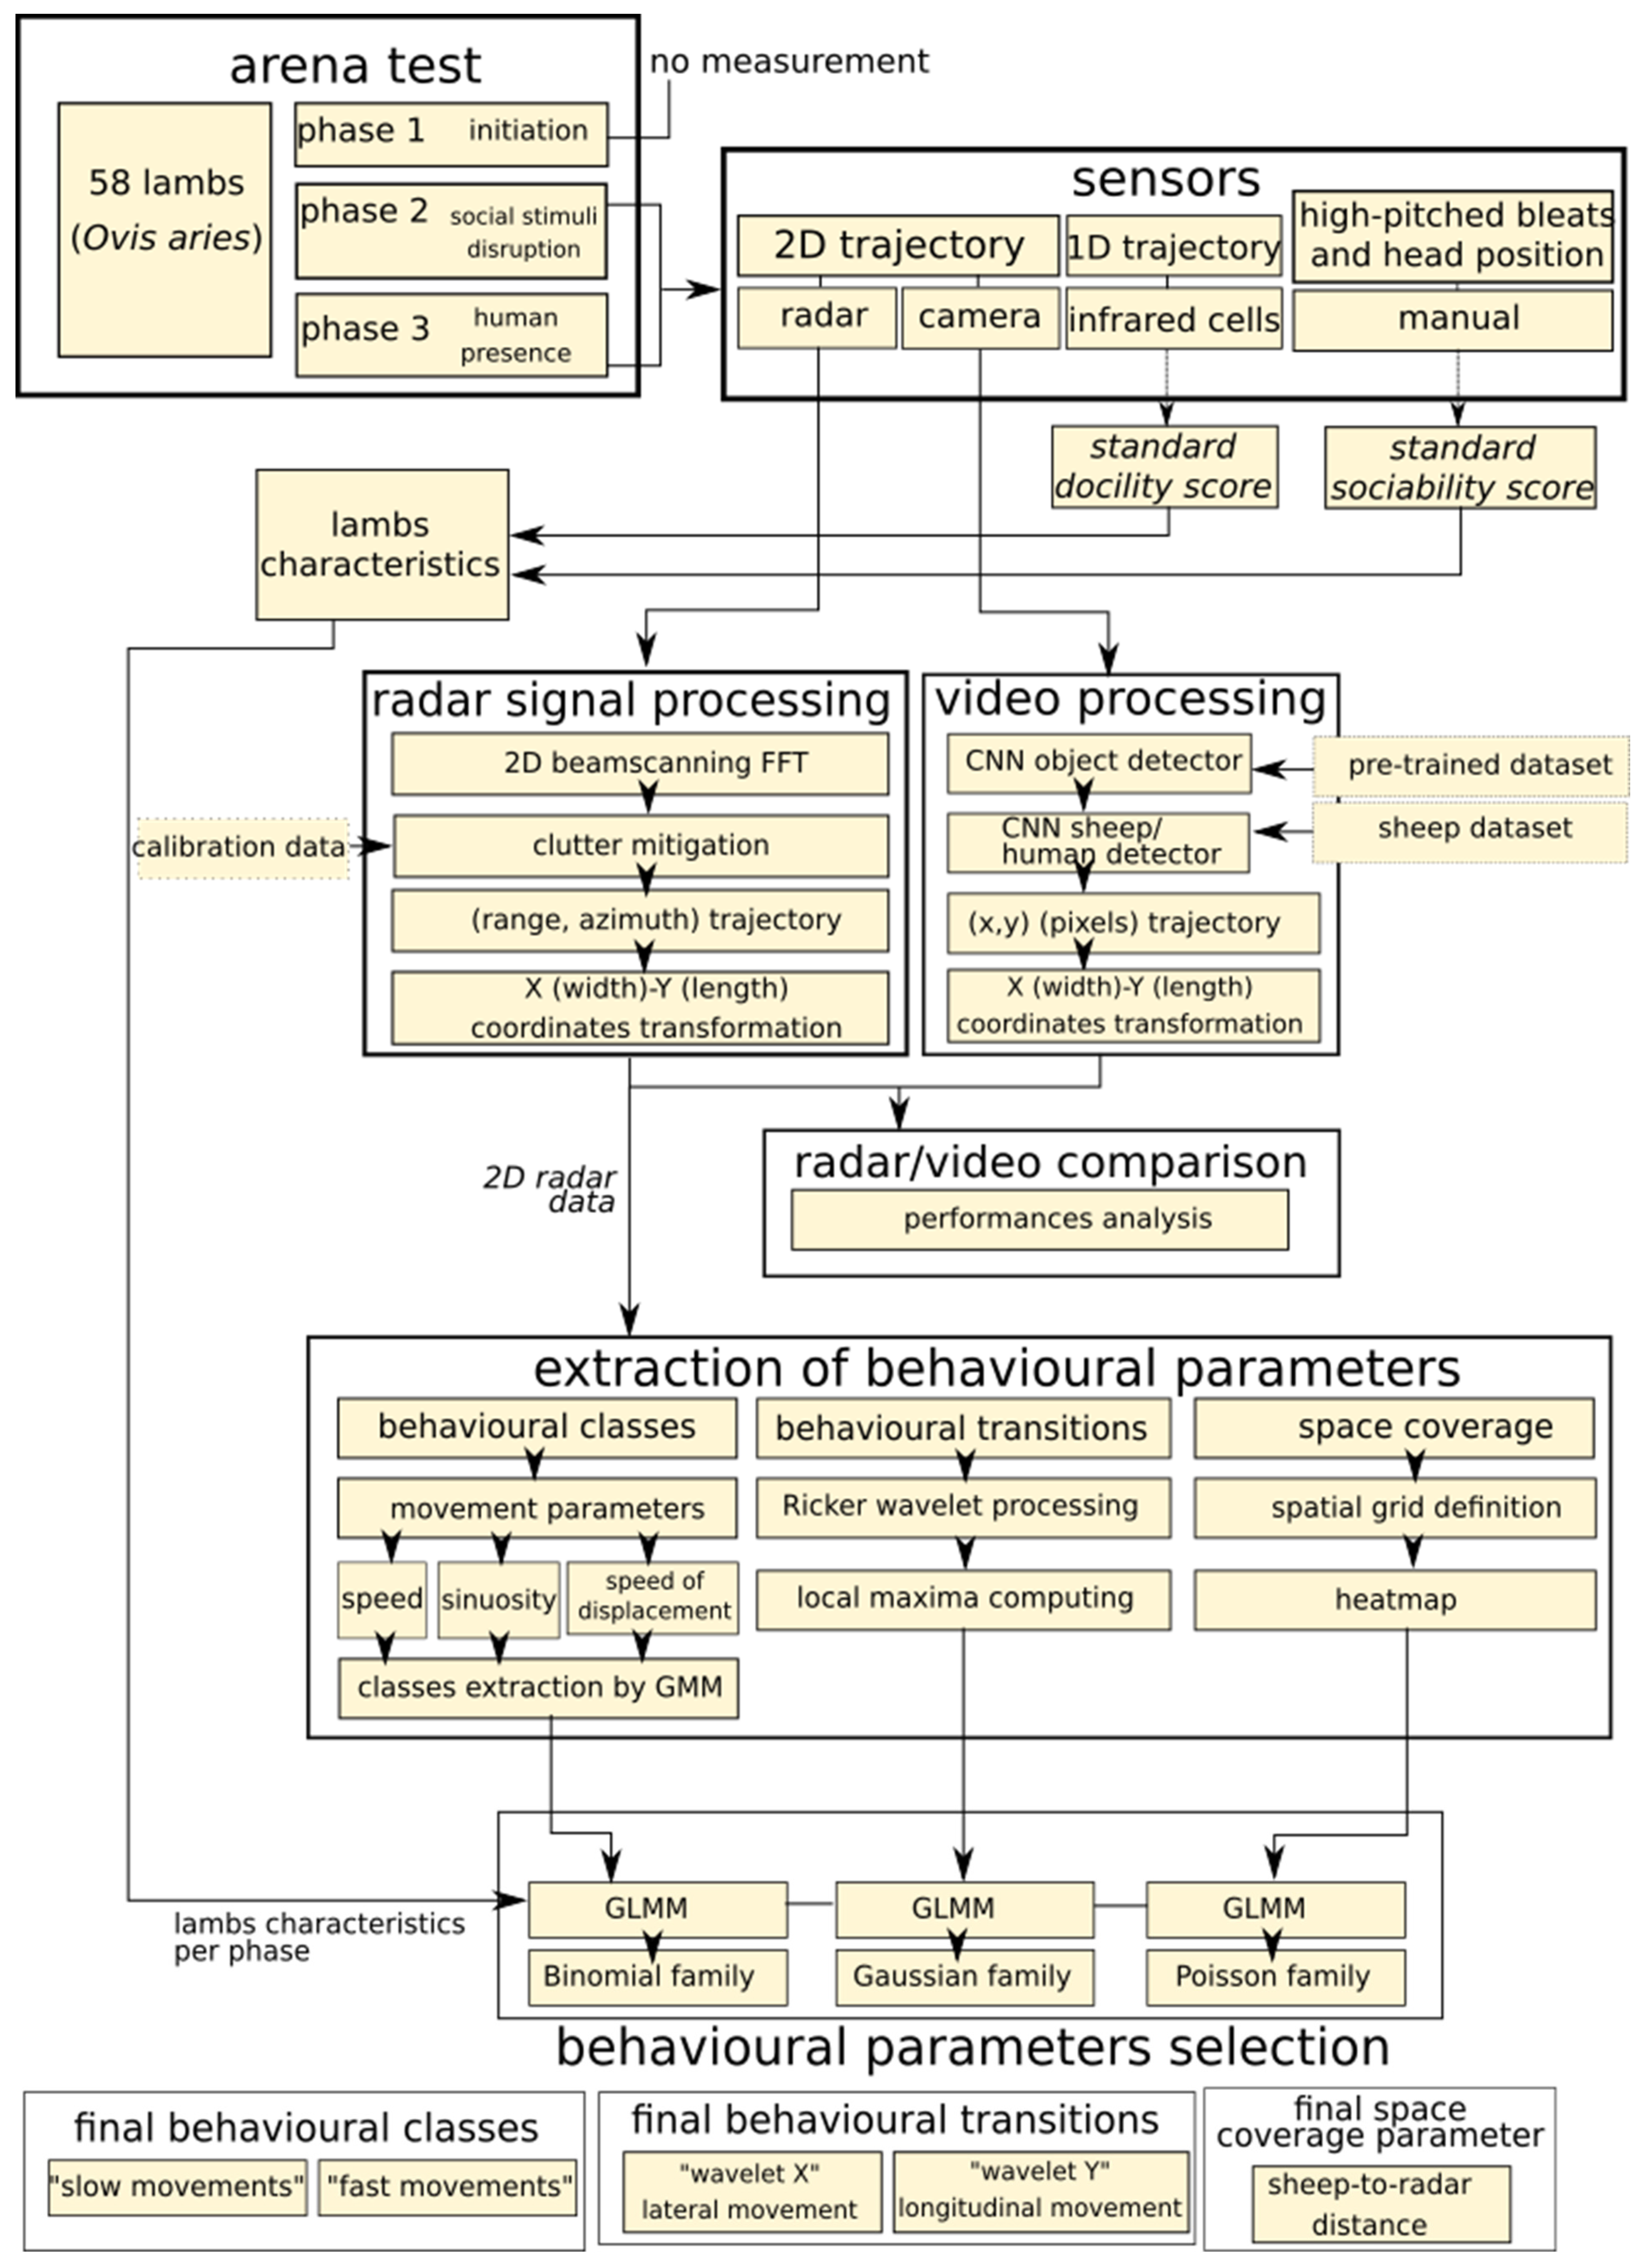
2.2. Arena Test
- -
- In phase 1, the focal sheep could explore the arena for 15 s and see its conspecifics through a grid barrier;
- -
- In phase 2, visual contact between the focal sheep and the social stimuli was disrupted using an opaque panel pulled down from the outside of the pen for 60 s. This phase was used to assess the sociability of the sheep towards its conspecifics;
- -
- In phase 3, visual contact between the focal sheep and its conspecifics was re-established and a human was standing still in front of grid barrier for 60 s. This phase was used to assess the sociability of the focal sheep towards conspecifics in presence of a immobile human.
2.3. Data Collection
2.4. Video and Radar Tracking
2.5. Extraction of New Behavioural Parameters Form the Radar Data
- 1: Behavioural classes;
- 2: Behavioural transitions;
- 3: Space coverage;
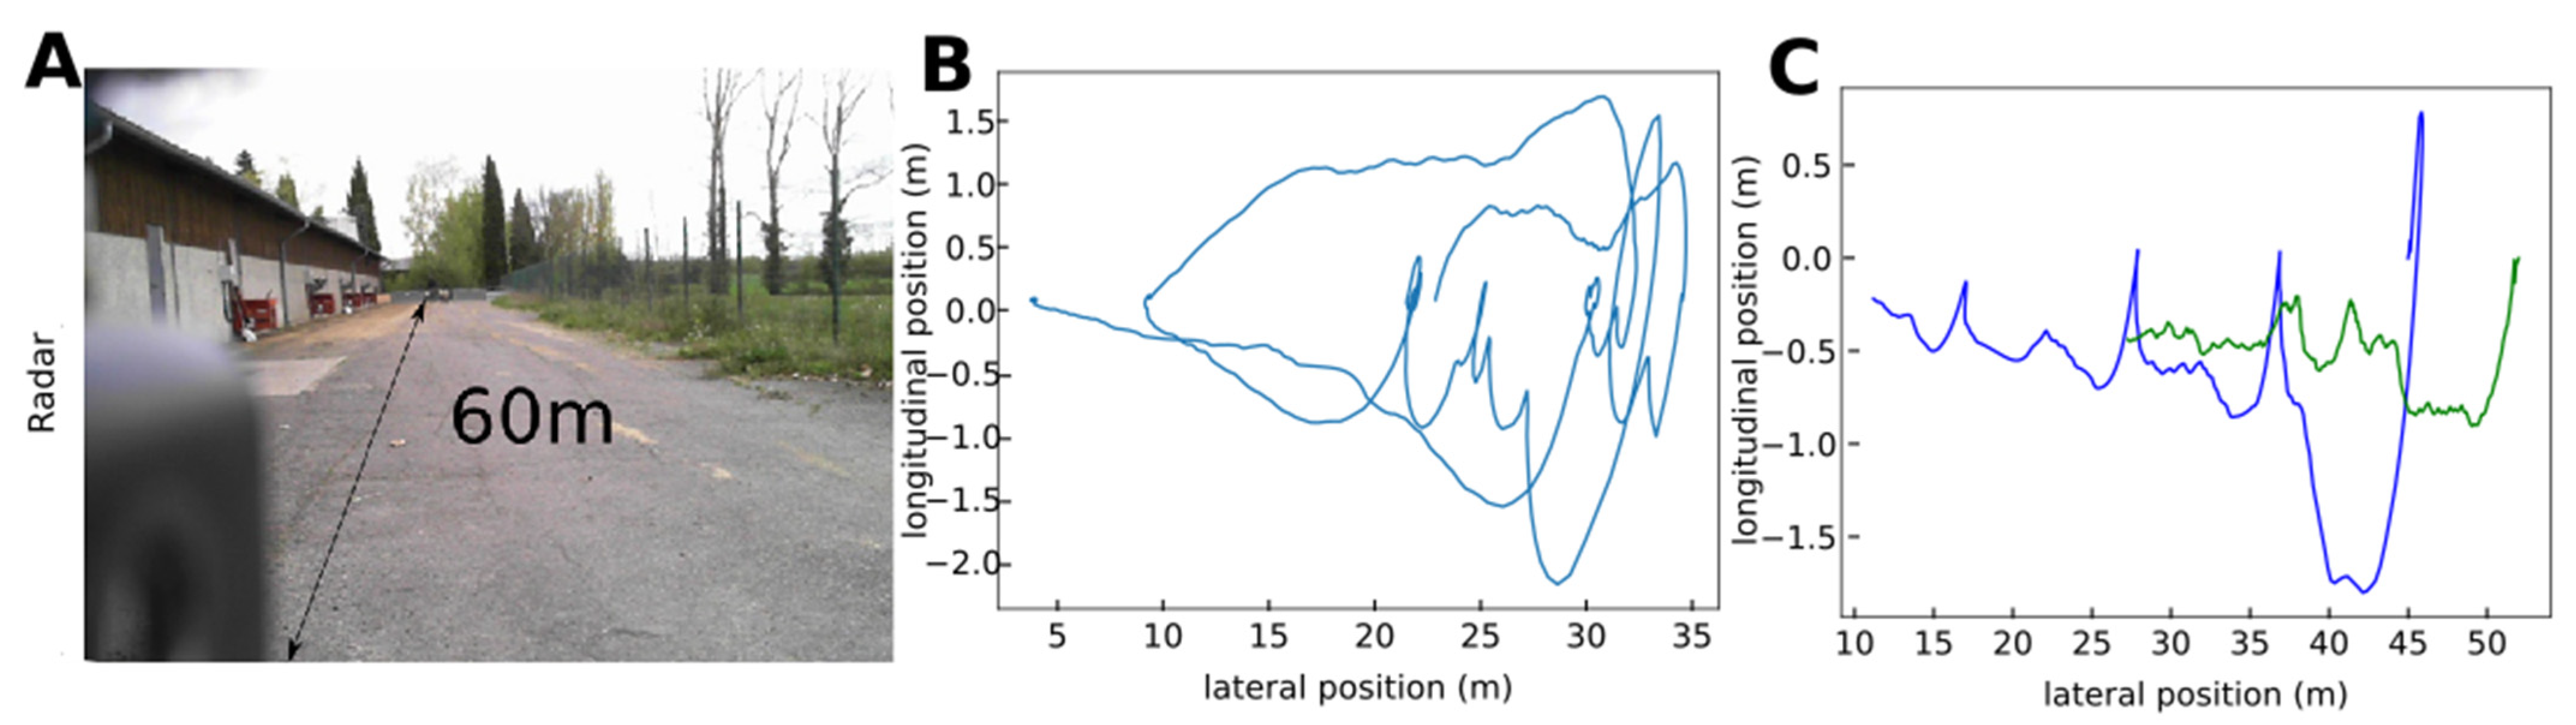
2.6. Outdoor Radar Tracking
2.7. Statistical Analyses
- Analysis of new movement features
- Classification of behavioural types;
3. Results
3.1. Radar Tracking Is Faster and More Accurate Than Video Tracking
3.2. New Behavioural Indicators from the Radar Data
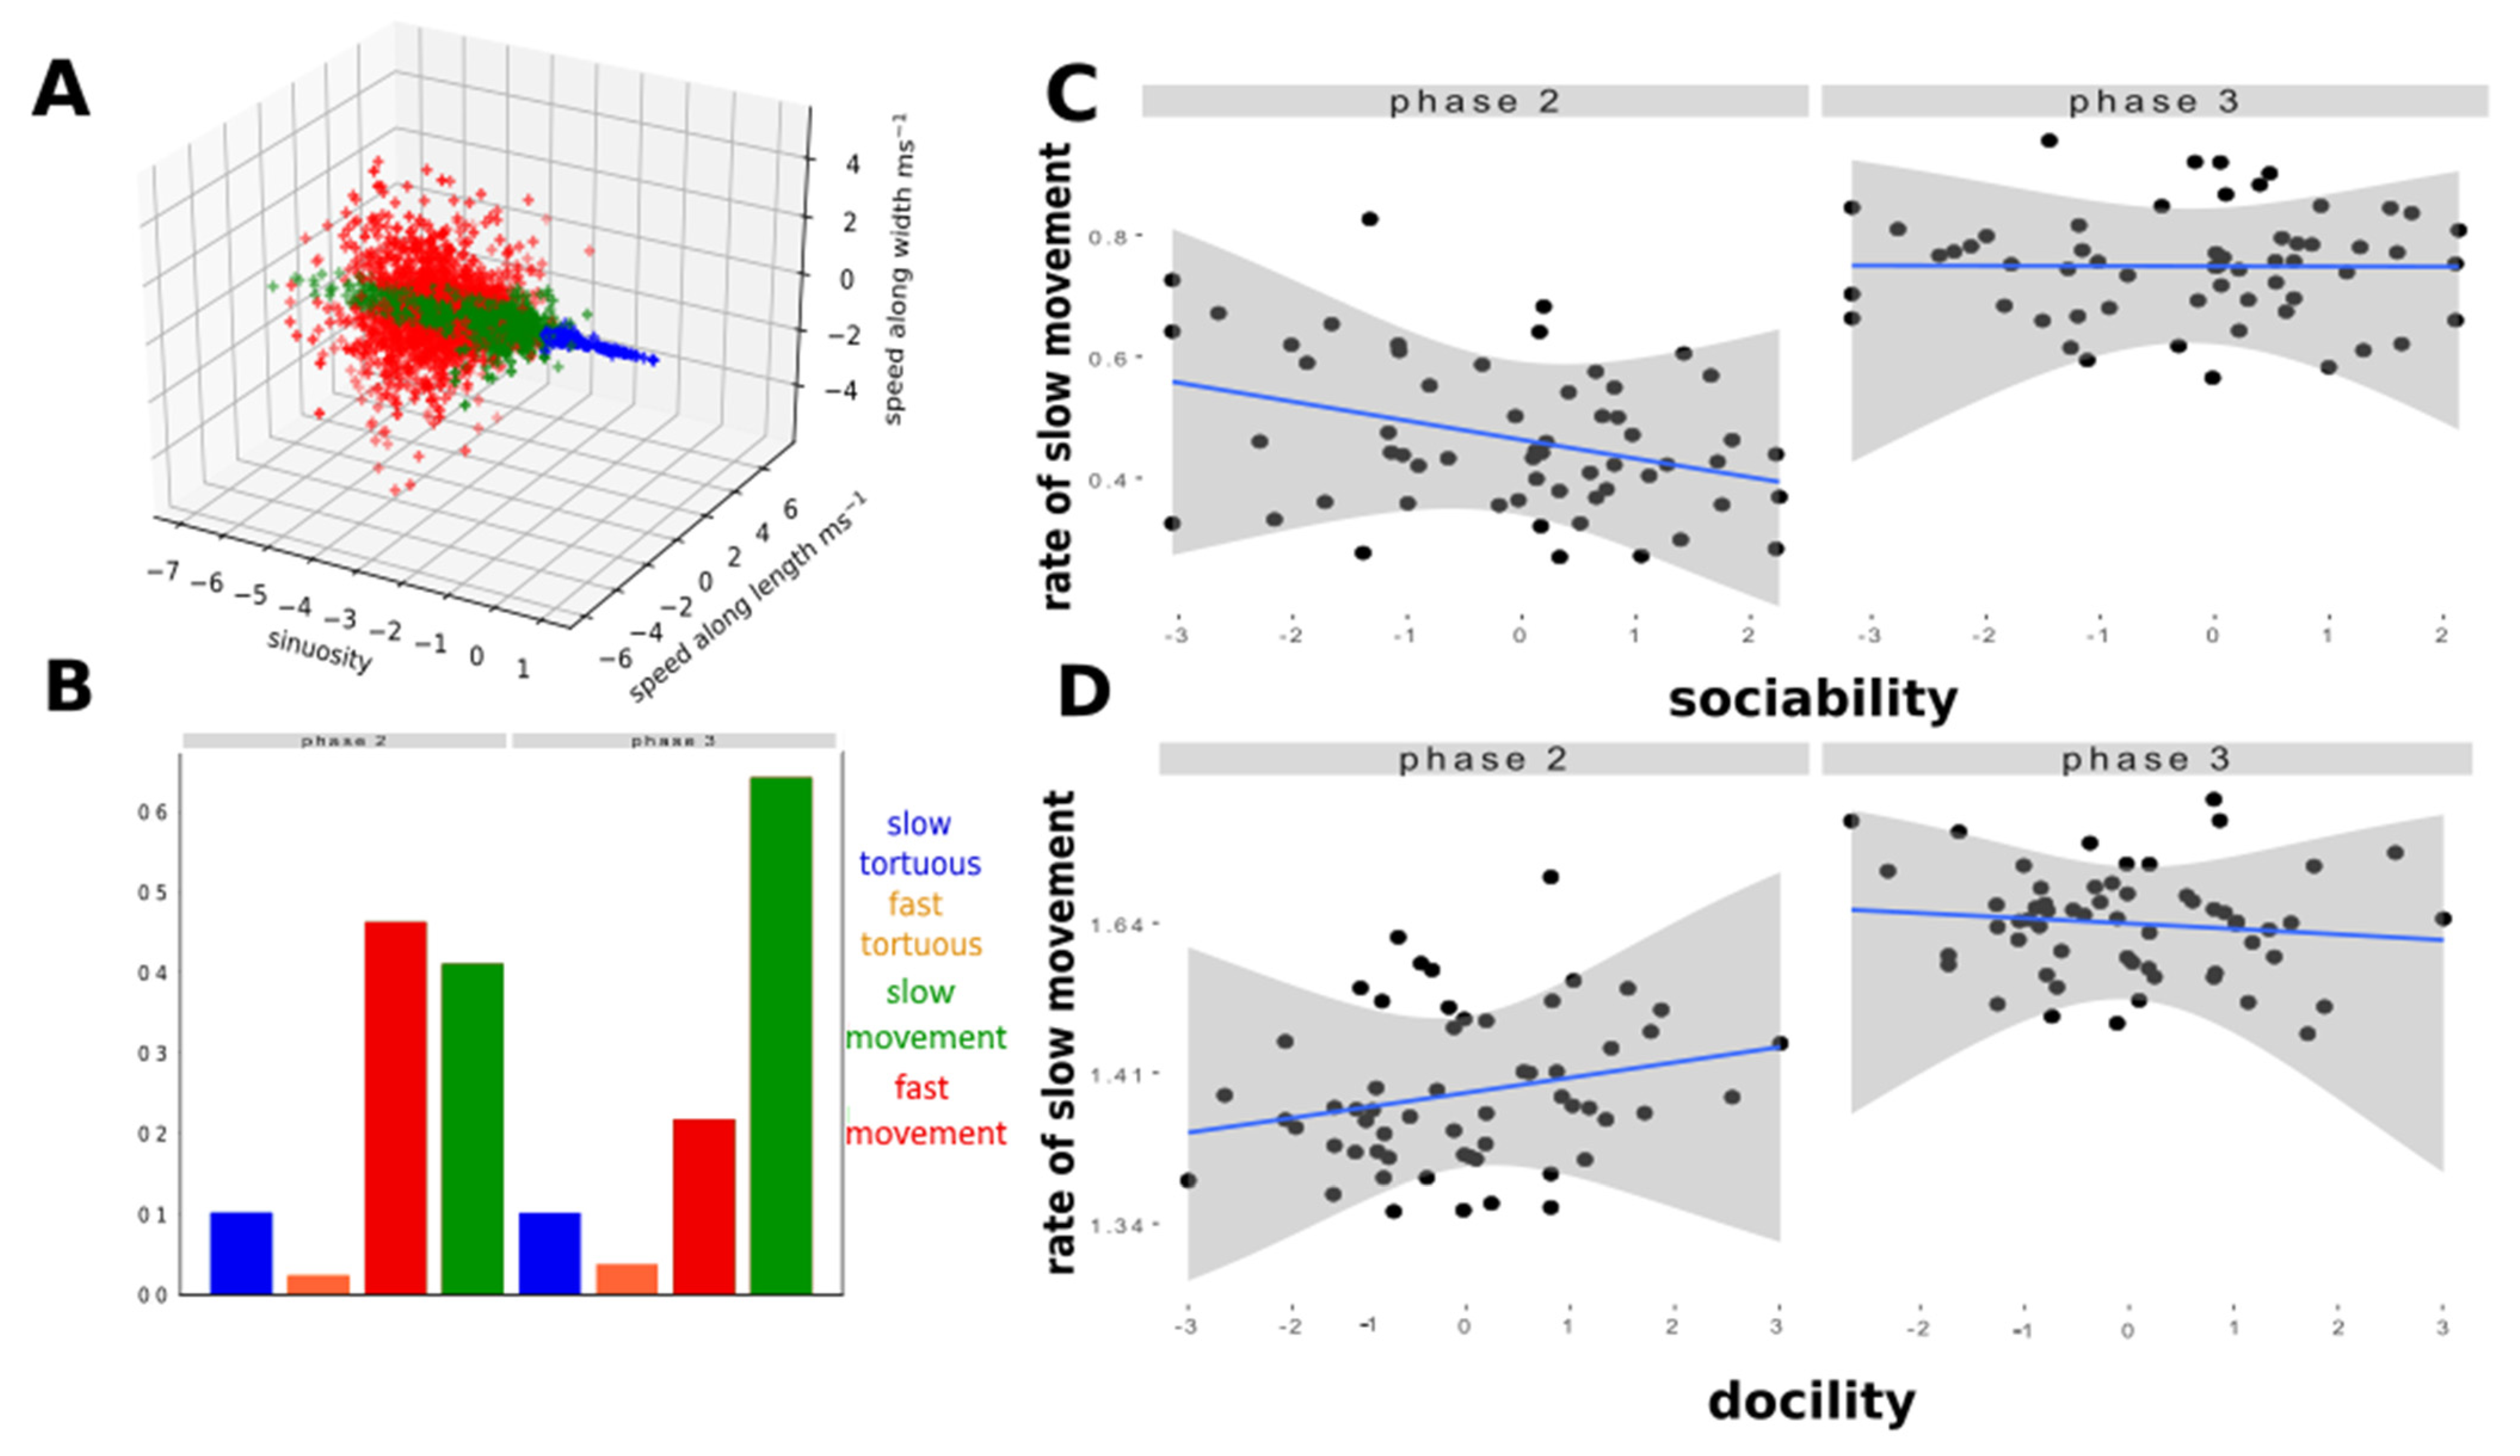
- Behavioural classes: detection of slow and fast movements
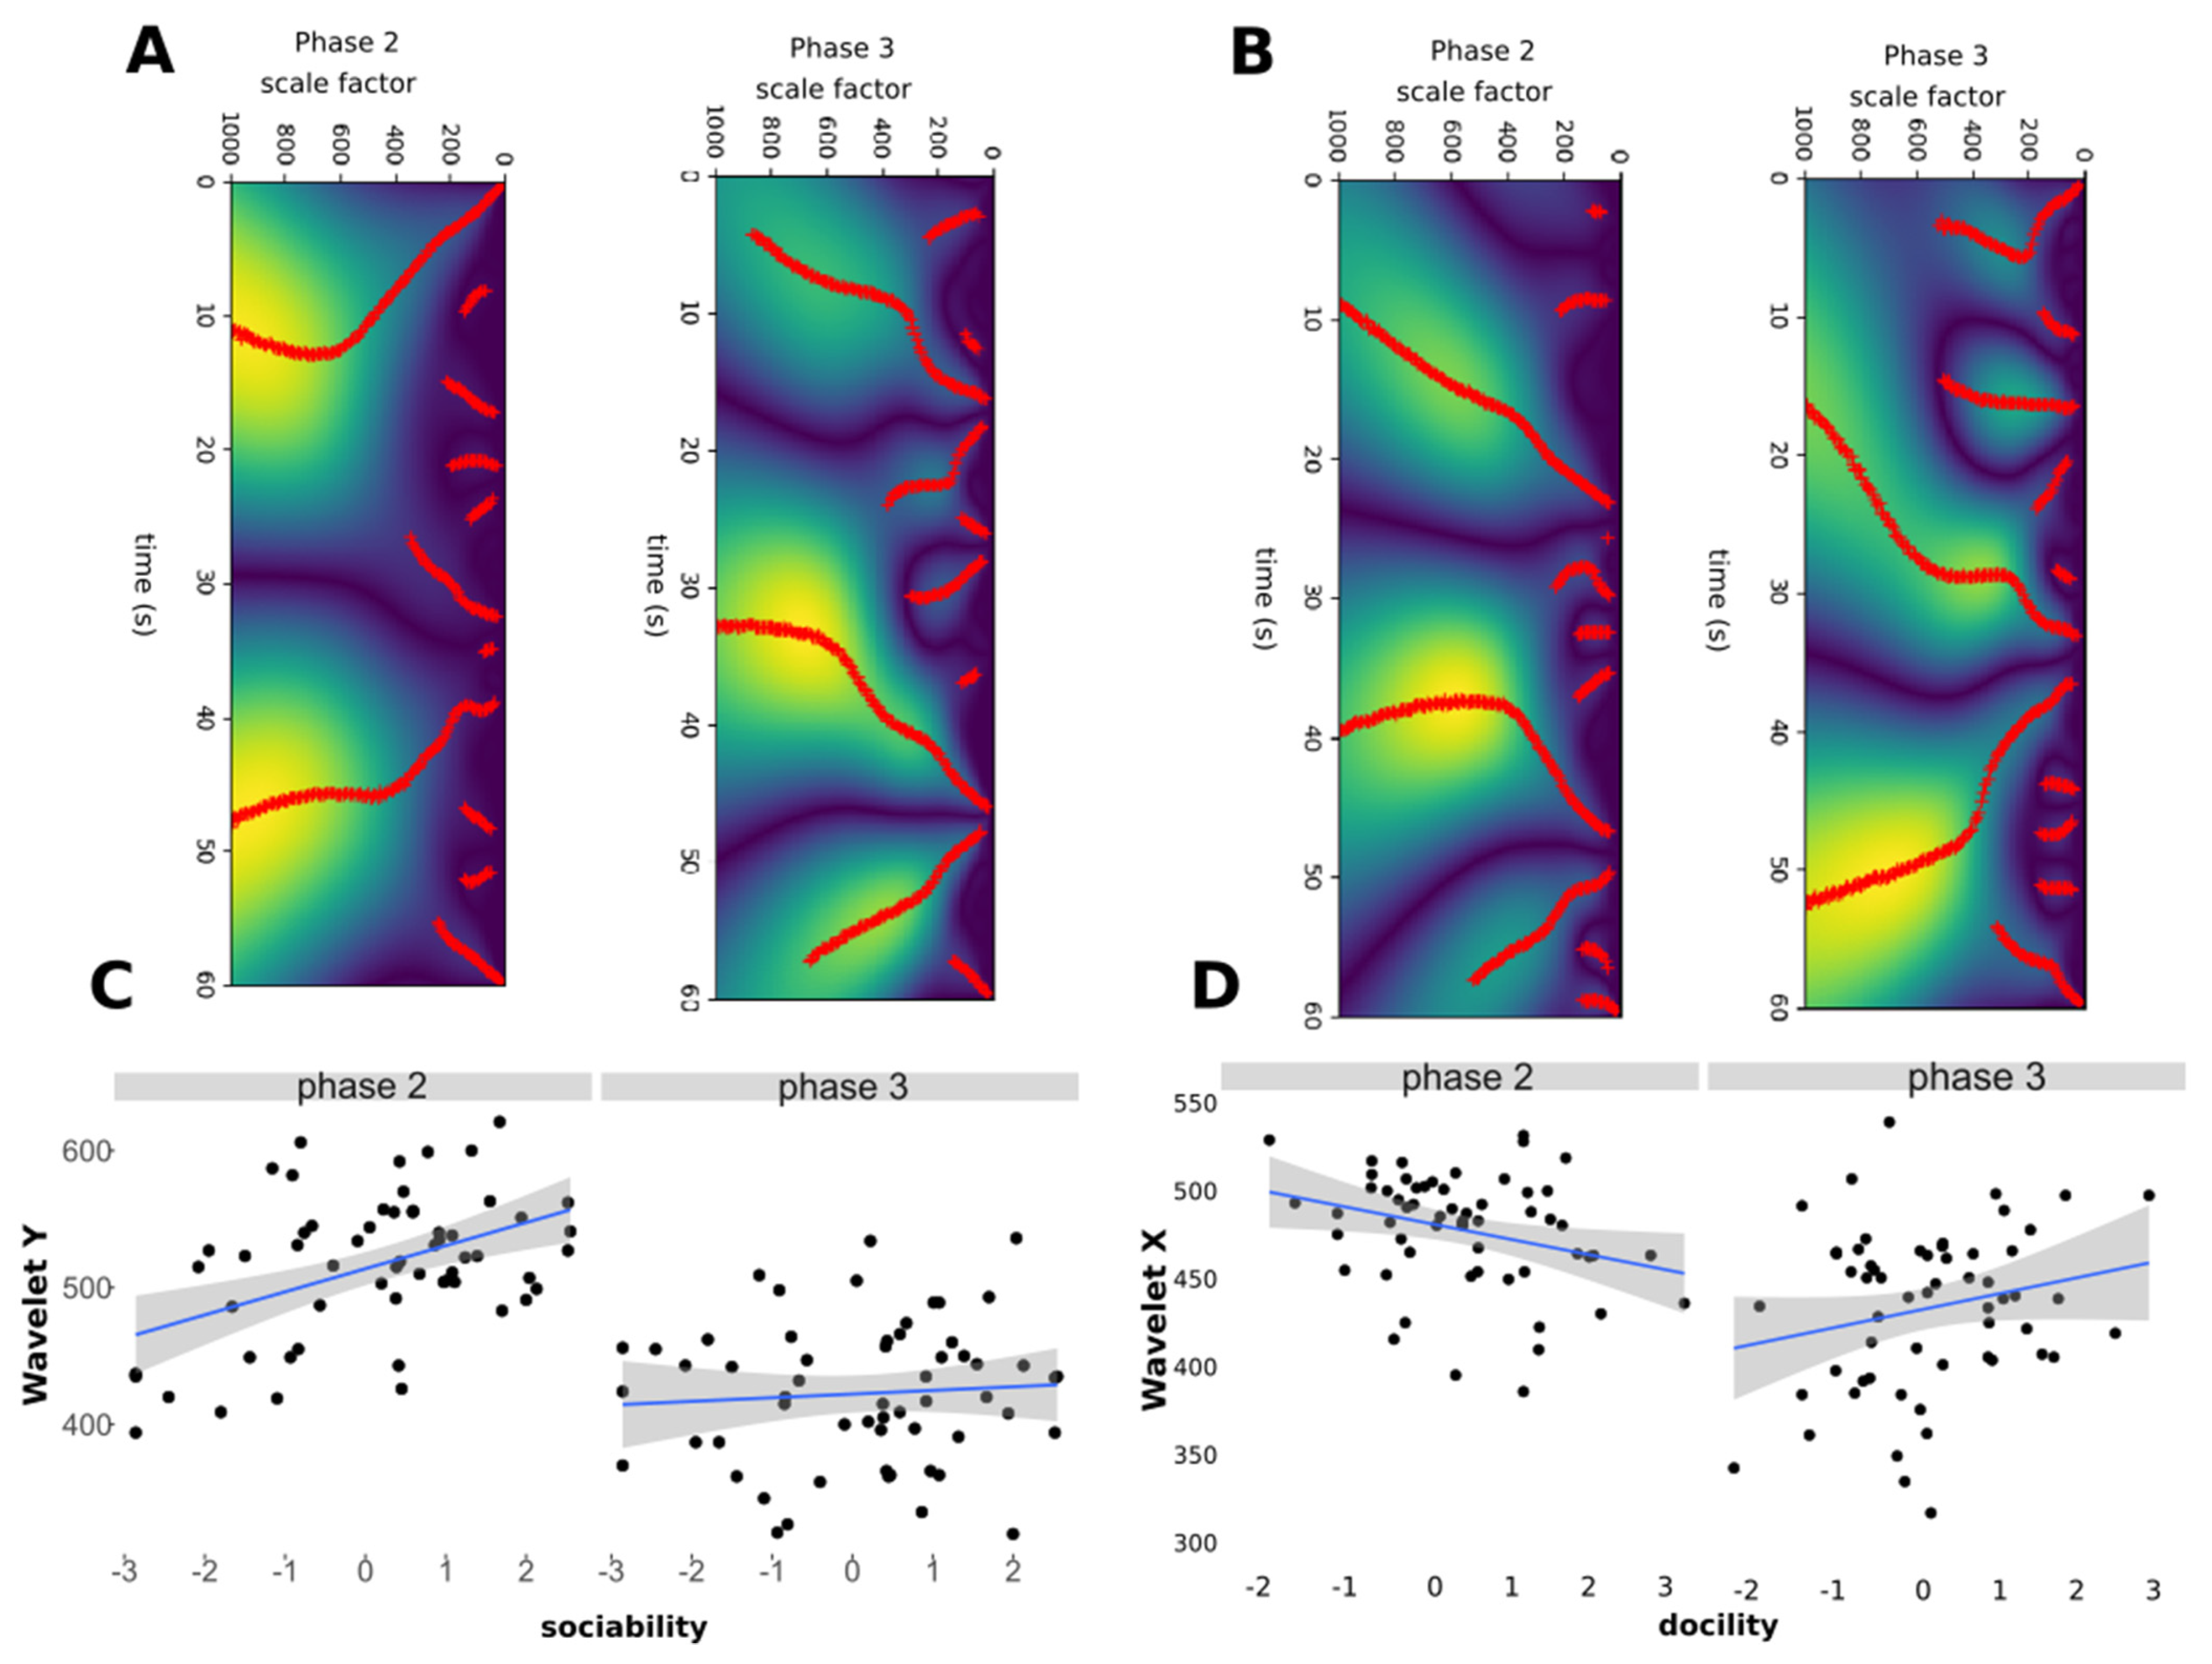
- Wavelet analysis: detection of erratic behavioural transitions;
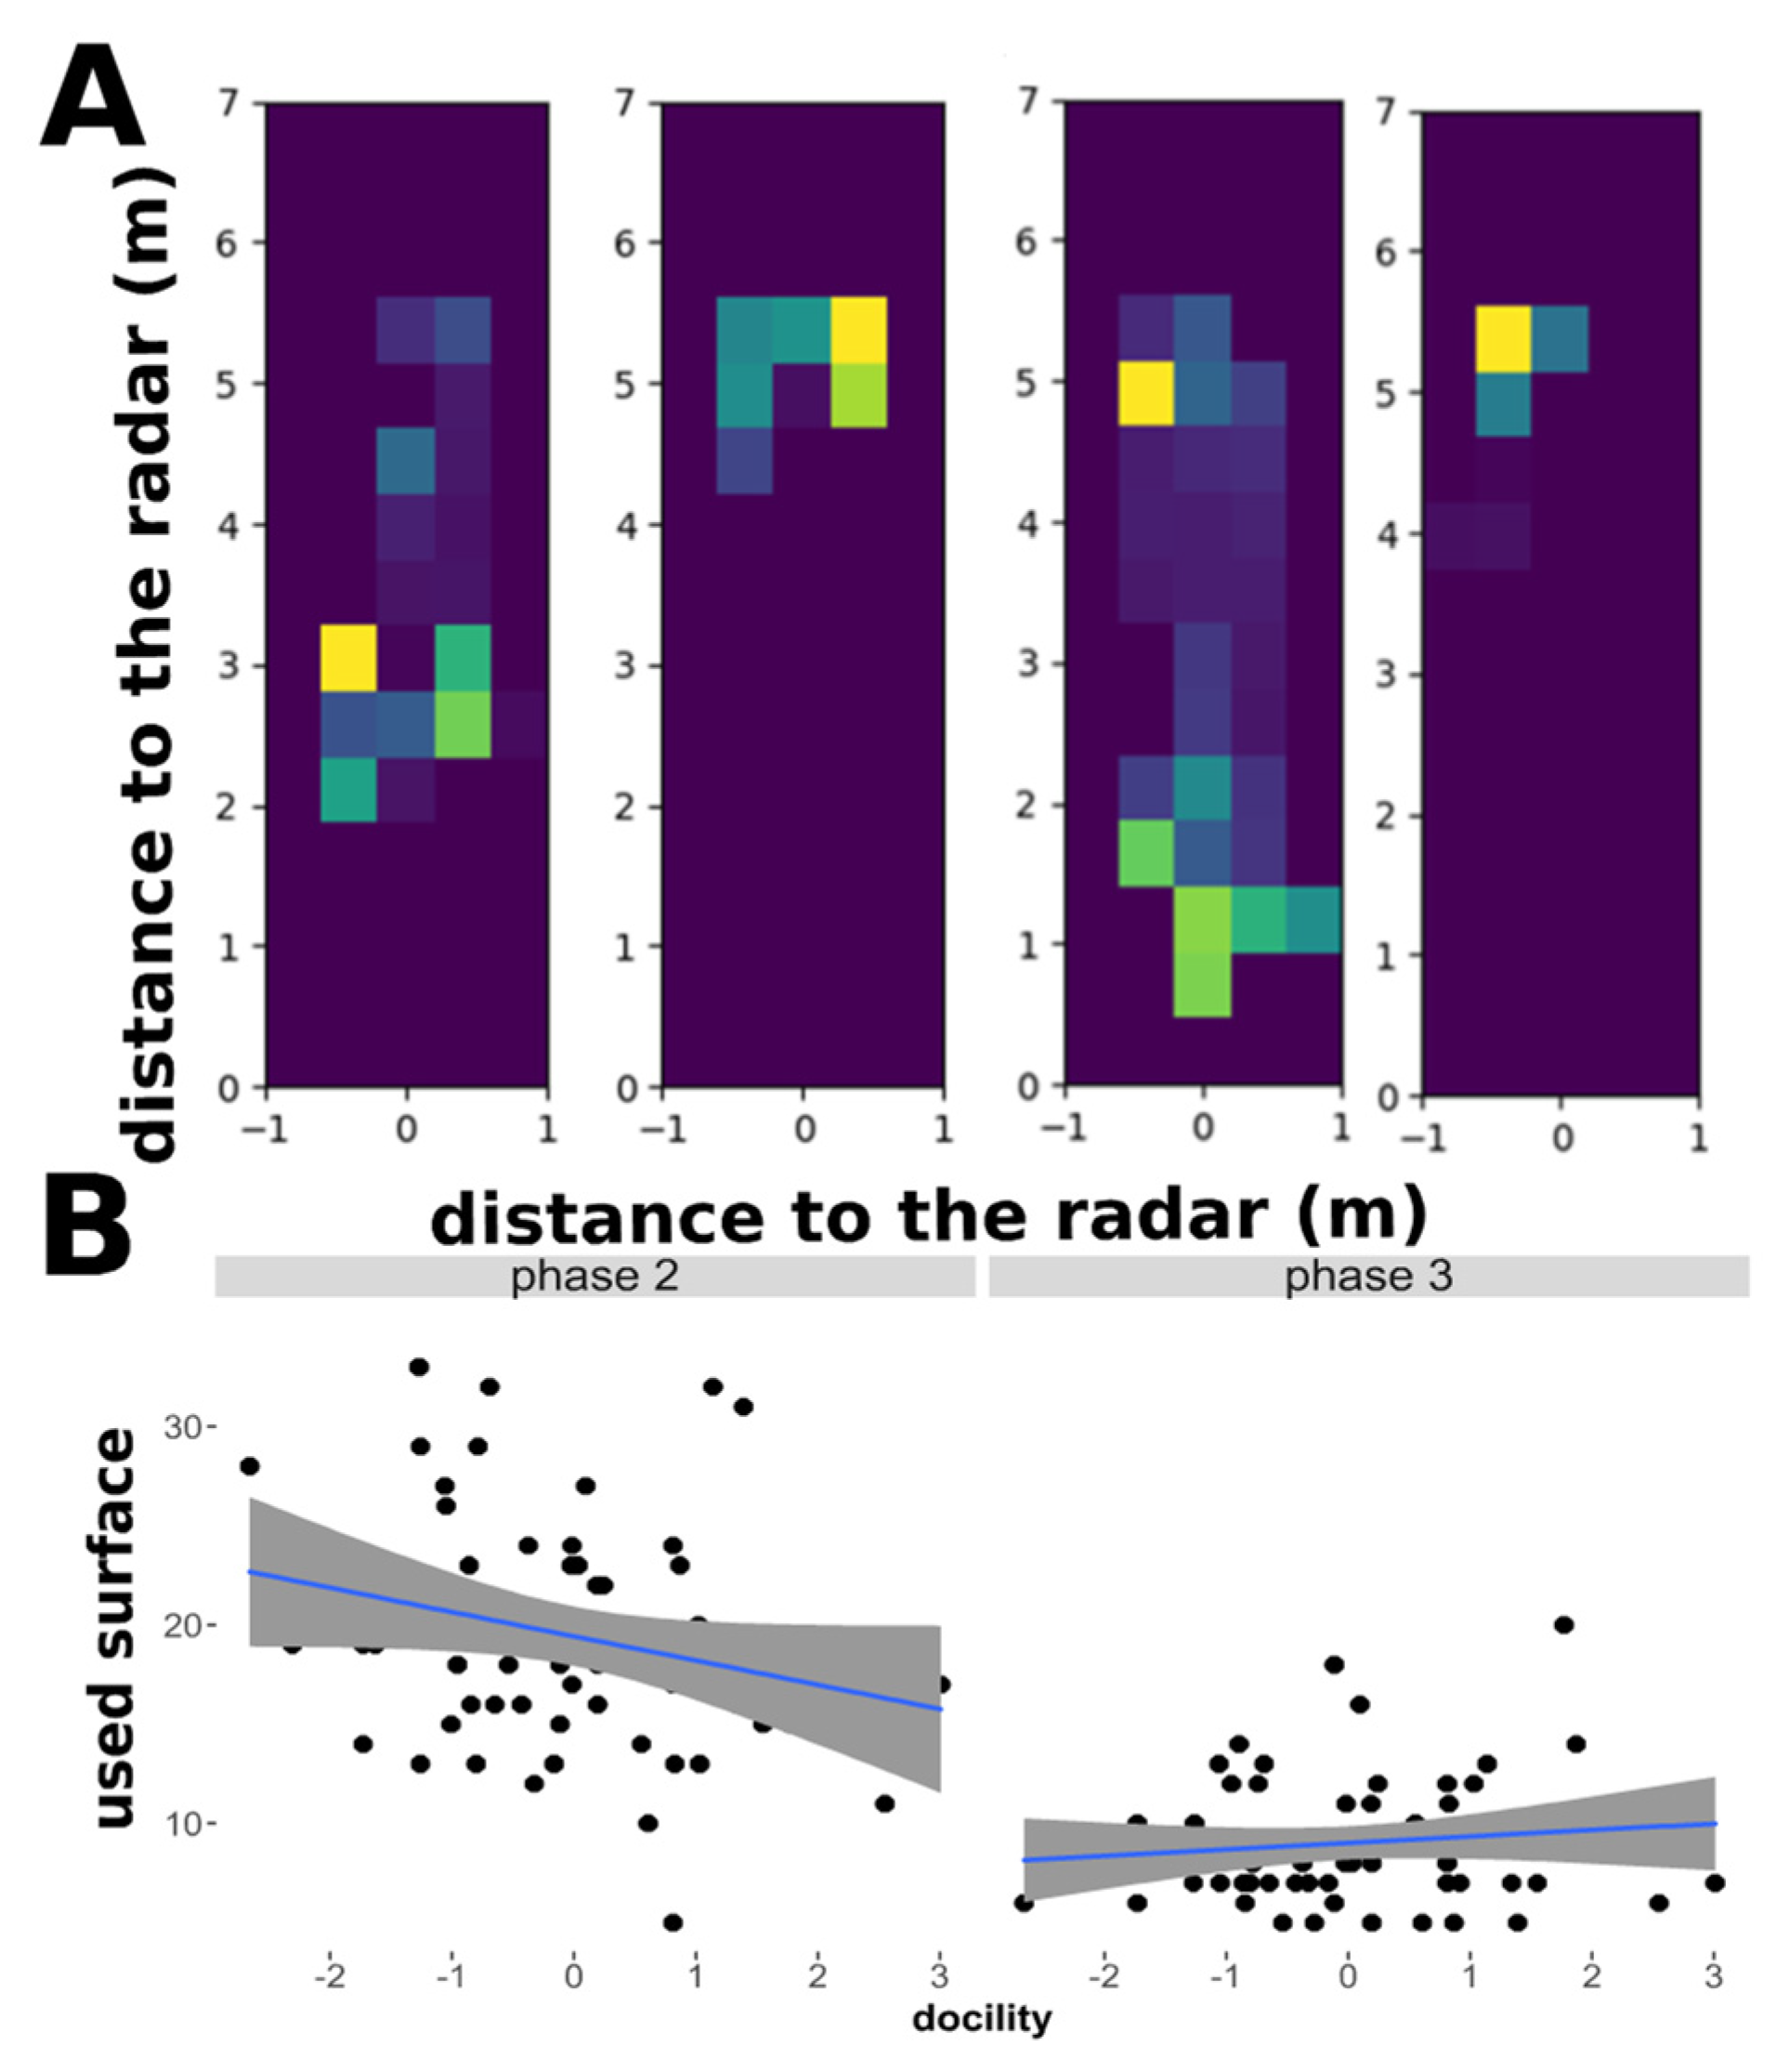
- Heatmap analyses: Detection of spatial coverage
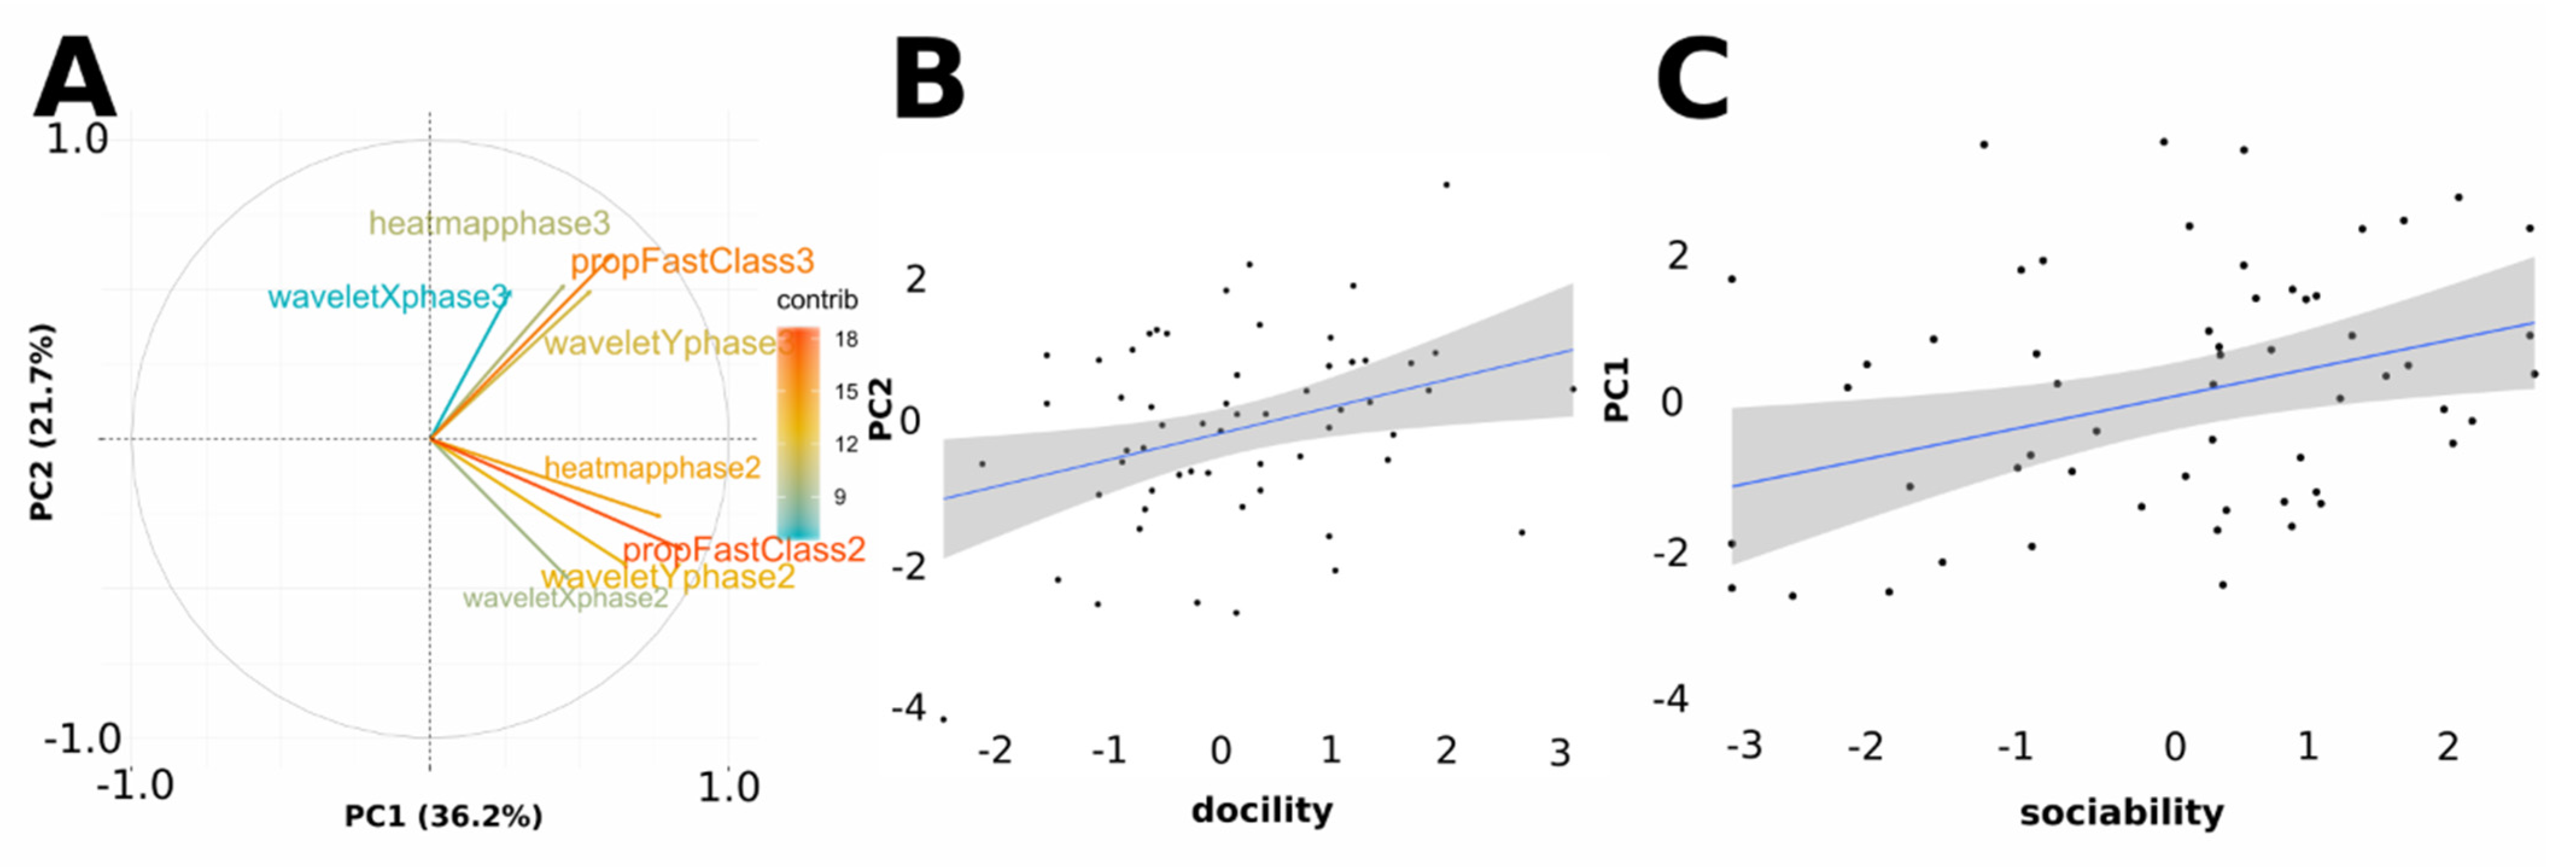
3.3. Sheep Behavioural Phenotype
3.4. Outdoor Radar Tracking
4. Discussion
5. Conclusions
Supplementary Materials
Author Contributions
Funding
Institutional Review Board Statement
Informed Consent Statement
Data Availability Statement
Acknowledgments
Conflicts of Interest
References
- Branson, K.; Robie, A.A.; Bender, J.; Perona, P.; Dickinson, M.H. High-Throughput Ethomics in Large Groups of Drosophila. Nat. Methods 2009, 6, 451–457. [Google Scholar] [CrossRef]
- Anderson, D.J.; Perona, P. Toward a Science of Computational Ethology. Neuron 2014, 84, 18–31. [Google Scholar] [CrossRef] [Green Version]
- Brown, A.E.X.; de Bivort, B. Ethology as a Physical Science. Nat. Phys. 2018, 14, 653–657. [Google Scholar] [CrossRef]
- Morand-Ferron, J.; Cole, E.F.; Quinn, J.L. Studying the Evolutionary Ecology of Cognition in the Wild: A Review of Practical and Conceptual Challenges. Biol. Rev. 2016, 91, 367–389. [Google Scholar] [CrossRef]
- Huang, W.; Pilkington, J.G.; Pemberton, J.M. Patterns of MHC-Dependent Sexual Selection in a Free-Living Population of Sheep. Mol. Ecol. 2021. [Google Scholar] [CrossRef] [PubMed]
- Canario, L.; Mignon-Grasteau, S.; Dupont-Nivet, M.; Phocas, F. Genetics of Behavioural Adaptation of Livestock to Farming Conditions. Animal 2013, 7, 357–377. [Google Scholar] [CrossRef] [PubMed] [Green Version]
- Phocas, F.; Boivin, X.; Sapa, J.; Trillat, G.; Boissy, A.; Neindre, P.L. Genetic Correlations between Temperament and Breeding Traits in Limousin Heifers. Anim. Sci. 2006, 82, 805–811. [Google Scholar] [CrossRef]
- Boissy, A.; Bouix, J.; Orgeur, P.; Poindron, P.; Bibé, B.; Le Neindre, P. Genetic Analysis of Emotional Reactivity in Sheep: Effects of the Genotypes of the Lambs and of Their Dams. Genet. Sel. Evol. 2005, 37, 381–401. [Google Scholar] [CrossRef]
- Tomkiewicz, S.M.; Fuller, M.R.; Kie, J.G.; Bates, K.K. Global Positioning System and Associated Technologies in Animal Behaviour and Ecological Research. Philos. Trans. R. Soc. B Biol. Sci. 2010, 365, 2163–2176. [Google Scholar] [CrossRef] [Green Version]
- Cadahía, L.; López-López, P.; Urios, V.; Negro, J.J. Satellite Telemetry Reveals Individual Variation in Juvenile Bonelli’s Eagle Dispersal Areas. Eur. J. Wildl. Res. 2010, 56, 923–930. [Google Scholar] [CrossRef] [Green Version]
- Voulodimos, A.S.; Patrikakis, C.Z.; Sideridis, A.B.; Ntafis, V.A.; Xylouri, E.M. A Complete Farm Management System Based on Animal Identification Using RFID Technology. Comput. Electron. Agric. 2010, 70, 380–388. [Google Scholar] [CrossRef]
- Riley, J.R.; Smith, A.D.; Reynolds, D.R.; Edwards, A.S.; Osborne, J.L.; Williams, I.H.; Carreck, N.L.; Poppy, G.M. Tracking Bees with Harmonic Radar. Nature 1996, 379, 29–30. [Google Scholar] [CrossRef]
- Pérez-Escudero, A.; Vicente-Page, J.; Hinz, R.C.; Arganda, S.; De Polavieja, G.G. IdTracker: Tracking Individuals in a Group by Automatic Identification of Unmarked Animals. Nat. Methods 2014, 11, 743–748. [Google Scholar] [CrossRef]
- García-Martín, E.; Rodrigues, C.F.; Riley, G.; Grahn, H. Estimation of Energy Consumption in Machine Learning. J. Parallel Distrib. Comput. 2019, 134, 75–88. [Google Scholar] [CrossRef]
- Dell, A.I.; Bender, J.A.; Branson, K.; Couzin, I.D.; de Polavieja, G.G.; Noldus, L.P.; Pérez-Escudero, A.; Perona, P.; Straw, A.D.; Wikelski, M. Automated Image-Based Tracking and Its Application in Ecology. Trends Ecol. Evol. 2014, 29, 417–428. [Google Scholar] [CrossRef] [PubMed]
- Dore, A.; Lihoreau, M.; Billon, Y.; Ravon, L.; Bailly, J.; Bompa, J.-F.; Ricard, E.; Aubert, H.; Henry, D.; Canario, L. Millimetre-Wave Radars for the Automatic Recording of Sow Postural Activity. In Proceedings of the 71. Annual Meeting of the European Association for Animal Production (EAAP), Porto, Portugal, 17 December 2020. [Google Scholar]
- Dore, A.; Henry, D.; Lihoreau, M.; Aubert, H. 3D Trajectories of Multiple Untagged Flying Insects from Millimetre-Wave Beamscanning Radar. In Proceedings of the 2020 IEEE International Symposium on Antennas and Propagation and North American Radio Science Meeting, Montréal, QC, Canada, 5–10 July 2020; IEEE: Piscataway, NJ, USA, 2020; pp. 1209–1210. [Google Scholar]
- Henry, D.; Aubert, H.; Ricard, E.; Hazard, D.; Lihoreau, M. Automated Monitoring of Livestock Behavior Using Frequency-Modulated Continuous-Wave Radars. Prog. Electromagn. Res. 2018, 69, 151–160. [Google Scholar] [CrossRef] [Green Version]
- Hazard, D.; Moreno, C.; Foulquié, D.; Delval, E.; François, D.; Bouix, J.; Sallé, G.; Boissy, A. Identification of QTLs for Behavioral Reactivity to Social Separation and Humans in Sheep Using the OvineSNP50 BeadChip. BMC Genom. 2014, 15, 778. [Google Scholar] [CrossRef] [Green Version]
- Hazard, D.; Bouix, J.; Chassier, M.; Delval, E.; Foulquie, D.; Fassier, T.; Bourdillon, Y.; François, D.; Boissy, A. Genotype by Environment Interactions for Behavioral Reactivity in Sheep. J. Anim. Sci. 2016, 94, 1459–1471. [Google Scholar] [CrossRef]
- Ligout, S.; Foulquié, D.; Sèbe, F.; Bouix, J.; Boissy, A. Assessment of Sociability in Farm Animals: The Use of Arena Test in Lambs. Appl. Anim. Behav. Sci. 2011, 135, 57–62. [Google Scholar] [CrossRef]
- Haderer, A.; Wagner, C.; Feger, R.; Stelzer, A. A 77-GHz FMCW Front-End with FPGA and DSP Support. In Proceedings of the 2008 International Radar Symposium, Wroclaw, Poland, 21–23 May 2008; IEEE: Piscataway, NJ, USA, 2008; pp. 1–6. [Google Scholar]
- Redmon, J.; Farhadi, A. Yolov3: An Incremental Improvement. arXiv 2018, arXiv:1804.02767. [Google Scholar]
- Everingham, M.; Eslami, S.A.; Van Gool, L.; Williams, C.K.; Winn, J.; Zisserman, A. The Pascal Visual Object Classes Challenge: A Retrospective. Int. J. Comput. Vis. 2015, 111, 98–136. [Google Scholar] [CrossRef]
- Bonneau, M.; Vayssade, J.-A.; Troupe, W.; Arquet, R. Outdoor Animal Tracking Combining Neural Network and Time-Lapse Cameras. Comput. Electron. Agric. 2020, 168, 105150. [Google Scholar] [CrossRef]
- Dietlein, C.R.; Bjarnason, J.E.; Grossman, E.N.; Popović, Z. Absorption, Transmission, and Scattering of Expanded Polystyrene at Millimeter-Wave and Terahertz Frequencies. In Proceedings of the Passive Millimeter-Wave Imaging Technology XI, Orlando, FL, USA, 16–20 March 2008; International Society for Optics and Photonics: Bellingham, WA, USA, 2008; Volume 6948, p. 69480E. [Google Scholar]
- Balanis, C.A. Modern Antenna Handbook; John Wiley & Sons: Hoboken, NJ, USA, 2011. [Google Scholar]
- Reynolds, D.A. Gaussian Mixture Models. Encycl. Biom. 2009, 741, 659–663. [Google Scholar]
- Burnham, K.P. Model Selection and Multimodel Inference. In A Practical Information-Theoretic Approach; Springer: New York, NY, USA, 1998. [Google Scholar]
- Pedregosa, F.; Varoquaux, G.; Gramfort, A.; Michel, V.; Thirion, B.; Grisel, O.; Blondel, M.; Prettenhofer, P.; Weiss, R.; Dubourg, V. Scikit-Learn: Machine Learning in Python. J. Mach. Learn. Res. 2011, 12, 2825–2830. [Google Scholar]
- Simon, W.; Klein, T.; Litschke, O. Small and Light 24 GHz Multi-Channel Radar. In Proceedings of the 2014 IEEE Antennas and Propagation Society International Symposium (APSURSI), Memphis, TN, USA, 6–11 July 2014; IEEE: Piscataway, NJ, USA, 2014; pp. 987–988. [Google Scholar]
- Ryan, H. Ricker, Ormsby; Klander, Bntterwo-A Choice of Wavelets; CSEG Recorder: Calgary, AB, Canada, 1994. [Google Scholar]
- Poirier, J.-R.; Aubert, H.; Jaggard, D.L. Lacunarity of Rough Surfaces from the Wavelet Analysis of Scattering Data. IEEE Trans. Antennas Propag. 2009, 57, 2130–2136. [Google Scholar] [CrossRef]
- Gaucherel, C. Wavelet Analysis to Detect Regime Shifts in Animal Movement. Comput. Ecol. Softw. 2011, 1, 69. [Google Scholar]
- Bains, R.S.; Cater, H.L.; Sillito, R.R.; Chartsias, A.; Sneddon, D.; Concas, D.; Keskivali-Bond, P.; Lukins, T.C.; Wells, S.; Acevedo Arozena, A. Analysis of Individual Mouse Activity in Group Housed Animals of Different Inbred Strains Using a Novel Automated Home Cage Analysis System. Front. Behav. Neurosci. 2016, 10, 106. [Google Scholar] [CrossRef] [Green Version]
- Idris, A.; Moors, E.; Budnick, C.; Herrmann, A.; Erhardt, G.; Gauly, M. Is the Establishment Rate and Fecundity of Haemonchus Contortus Related to Body or Abomasal Measurements in Sheep? Animal 2011, 5, 1276–1282. [Google Scholar] [CrossRef]
- Team, R.C. R: A Language and Environment for Statistical Computing; R Foundation for Statistical Computing: Vienna, Austria, 2014. [Google Scholar]
- Stroup, W.W. Generalized Linear Mixed Models: Modern Concepts, Methods and Applications; CRC Press: Boca Raton, FL, USA, 2012. [Google Scholar]
- Lê, S.; Josse, J.; Husson, F. FactoMineR: An R Package for Multivariate Analysis. J. Stat. Softw. 2008, 25, 1–18. [Google Scholar] [CrossRef] [Green Version]
- Kaiser, H.F. Coefficient Alpha for a Principal Component and the Kaiser-Guttman Rule. Psychol. Rep. 1991, 68, 855–858. [Google Scholar] [CrossRef]
- Roberts, G.; Williams, A.; Last, J.D.; Penning, P.D.; Rutter, S.M. A Low-Power Postprocessed DGPS System for Logging the Locations of Sheep on Hill Pastures. Navigation 1995, 42, 327–336. [Google Scholar] [CrossRef]
- Sebe, F.; Nowak, R.; Poindron, P.; Aubin, T. Establishment of Vocal Communication and Discrimination between Ewes and Their Lamb in the First Two Days after Parturition. Dev. Psychobiol. J. Int. Soc. Dev. Psychobiol. 2007, 49, 375–386. [Google Scholar] [CrossRef] [PubMed]
- Sebe, F.; Ligout, S.; Porter, R. Vocal Discrimination of Kin and Non-Kin Agemates among Lambs. Behaviour 2004, 141, 355–369. [Google Scholar] [CrossRef]
- Ginelli, F.; Peruani, F.; Pillot, M.-H.; Chaté, H.; Theraulaz, G.; Bon, R. Intermittent Collective Dynamics Emerge from Conflicting Imperatives in Sheep Herds. Proc. Natl. Acad. Sci. USA 2015, 112, 12729–12734. [Google Scholar] [CrossRef] [PubMed] [Green Version]
- Huang, H.; Gui, G.; Sari, H.; Adachi, F. Deep Learning for Super-Resolution DOA Estimation in Massive MIMO Systems. In Proceedings of the 2018 IEEE 88th Vehicular Technology Conference (VTC-Fall), Chicago, IL, USA, 27–30 August 2018; pp. 1–5. [Google Scholar]
- Lui, H.-S.; Shuley, N. Resonance Based Radar Target Identification with Multiple Polarizations. In Proceedings of the 2006 IEEE Antennas and Propagation Society International Symposium, Albuquerque, NM, USA, 9–14 July 2006; IEEE: Piscataway, NJ, USA, 2006; pp. 3259–3262. [Google Scholar]


| Name | Indoor Tracking | Outdoor Tracking | Note |
|---|---|---|---|
| Operating frequency | 77 GHz | 24 GHz | This frequency is also called the carrier frequency of the frequency-modulated signal transmitted by the radar |
| Modulation Bandwidth | 3 GHz | 800 MHz | Frequency interval, centred at the operating frequency, used for the saw-tooth frequency modulation of the transmitted signal |
| Ramp time | 256 µs | 1 ms | Up-ramp duration of the saw-tooth frequency-modulated signal (or chirp duration) |
| Repetition time | 50 ms | 30 ms | Period of the transmitted frequency-modulated signal (or chirp repetition interval) |
| Number of linear arrays of the transmitting antenna array | 4 | 1 | One linear array composed of 8 × 2 rectangular patches radiating elements |
| Number of linear arrays of the receiving antenna array | 8 | 2 | Eight linear arrays composed of 8 rectangular patches radiating elements |
| Main lobe beamwidth of the transmitting antenna array in the horizontal plane | 50° | 58° | Angular range (or field of view) of the radar illumination in the horizontal plane |
| Transmitted power | 100 mW | 100 mW | Power delivered at the input terminals of the transmitting array antenna (the radiated power is defined as the product of the transmitted power by the efficiency of the antenna) |
| Tracking Method | Radar | Video |
|---|---|---|
| Number of measures per second | 50 | 25 |
| Read Only Memory (ROM) for all measures of a sheep | 151 Mo | 62 Mo |
| Random Access Memory (RAM) per measure | 524 Kb | 3.7 Mb |
| Processing time per measure | <20 ms | 250 ms |
| Distance to target centre | 1.1 m | 1.5 m |
| Estimate | Std. Error | z Value | Pr (>|z|) | |
|---|---|---|---|---|
| (Intercept) | 0.11 | 0.055 | 2.08 | 0.037 |
| Sociability | 0.13 | 0.039 | 3.47 | <0.001 |
| phase 3 | −1.24 | 0.0086 | −144.04 | <0.001 |
| Docility | −0.11 | 0.047 | −2.43 | 0.015 |
| sociability:phase 3 | −0.12 | 0.0061 | −19.90 | <0.001 |
| Docility: phase 3 | 0.16 | 0.0074 | 21.31 | <0.001 |
| Wavelet Y | Estimate | Std. Error | Df | t Value | Pr (>|t|) |
|---|---|---|---|---|---|
| (Intercept) | 514 | 6.64 | 110 | 77.3 | <0.001 |
| sociability | 17 | 4.68 | 110 | 3.63 | <0.001 |
| phase 3 | −91.5 | 9.07 | 55 | −10.1 | <0.001 |
| docility | −3.12 | 5.72 | 110 | −0.545 | 0.587 |
| Sociability:phase 3 | −14.4 | 6.4 | 55 | −2.25 | 0.05 |
| Docility:phase 3 | 4.7 | 7.81 | 55 | 0.602 | 0.55 |
| Wavelet X | Estimate | Std. Error | df | t Value | Pr (>|t|) |
| (Intercept) | 467 | 6.04 | 110 | 77.3 | <0.001 |
| sociability | 0.526 | 4.26 | 110 | 0.124 | 0.902 |
| phase 3 | −53.2 | 8.26 | 55 | −6.43 | <0.001 |
| Docility | −9.61 | 5.2 | 110 | −1.85 | 0.0673 |
| Sociability:phase 3 | 7.36 | 5.82 | 55 | 1.26 | 0.212 |
| Docility: phase 3 | 19.2 | 7.11 | 55 | 2.7 | <0.05 |
| Heatmap | Estimate | Std. Error | z Value | Pr (>|z|) |
|---|---|---|---|---|
| (Intercept) | 2.95 | 0.037 | 79.00 | <2 × 10⁻¹⁶ |
| docility | −0.066 | 0.031 | 2.07 | 0.039 |
| phase 3 | −0.77 | 0.053 | 14.27 | <2 × 10⁻¹⁶ |
| sociability | 0.048 | 0.023 | 2.022 | 0.043 |
| phase 3: docility | 0.099 | 0.046 | 2.15 | 0.032 |
| phase 3: sociability | −0.020 | 0.038 | 0.52 | 0.60 |
| Component | Eigenvalue | Variance Explained |
|---|---|---|
| PC 1 | 2.893 | 30.65 |
| PC 2 | 1.738 | 19.31 |
| PC 3 | 0.974 | 13.04 |
| PC 4 | 0.833 | 9.27 |
| PC 5 | 0.564 | 7.20 |
| PC 6 | 0.492 | 6.69 |
Publisher’s Note: MDPI stays neutral with regard to jurisdictional claims in published maps and institutional affiliations. |
© 2021 by the authors. Licensee MDPI, Basel, Switzerland. This article is an open access article distributed under the terms and conditions of the Creative Commons Attribution (CC BY) license (https://creativecommons.org/licenses/by/4.0/).
Share and Cite
Dore, A.; Pasquaretta, C.; Henry, D.; Ricard, E.; Bompa, J.-F.; Bonneau, M.; Boissy, A.; Hazard, D.; Lihoreau, M.; Aubert, H. A Non-Invasive Millimetre-Wave Radar Sensor for Automated Behavioural Tracking in Precision Farming—Application to Sheep Husbandry. Sensors 2021, 21, 8140. https://doi.org/10.3390/s21238140
Dore A, Pasquaretta C, Henry D, Ricard E, Bompa J-F, Bonneau M, Boissy A, Hazard D, Lihoreau M, Aubert H. A Non-Invasive Millimetre-Wave Radar Sensor for Automated Behavioural Tracking in Precision Farming—Application to Sheep Husbandry. Sensors. 2021; 21(23):8140. https://doi.org/10.3390/s21238140
Chicago/Turabian StyleDore, Alexandre, Cristian Pasquaretta, Dominique Henry, Edmond Ricard, Jean-François Bompa, Mathieu Bonneau, Alain Boissy, Dominique Hazard, Mathieu Lihoreau, and Hervé Aubert. 2021. "A Non-Invasive Millimetre-Wave Radar Sensor for Automated Behavioural Tracking in Precision Farming—Application to Sheep Husbandry" Sensors 21, no. 23: 8140. https://doi.org/10.3390/s21238140
APA StyleDore, A., Pasquaretta, C., Henry, D., Ricard, E., Bompa, J.-F., Bonneau, M., Boissy, A., Hazard, D., Lihoreau, M., & Aubert, H. (2021). A Non-Invasive Millimetre-Wave Radar Sensor for Automated Behavioural Tracking in Precision Farming—Application to Sheep Husbandry. Sensors, 21(23), 8140. https://doi.org/10.3390/s21238140