
Development of an Integrated EEG/fNIRS Brain Function Monitoring System

 , , , ,
Abstract
:1. Introduction
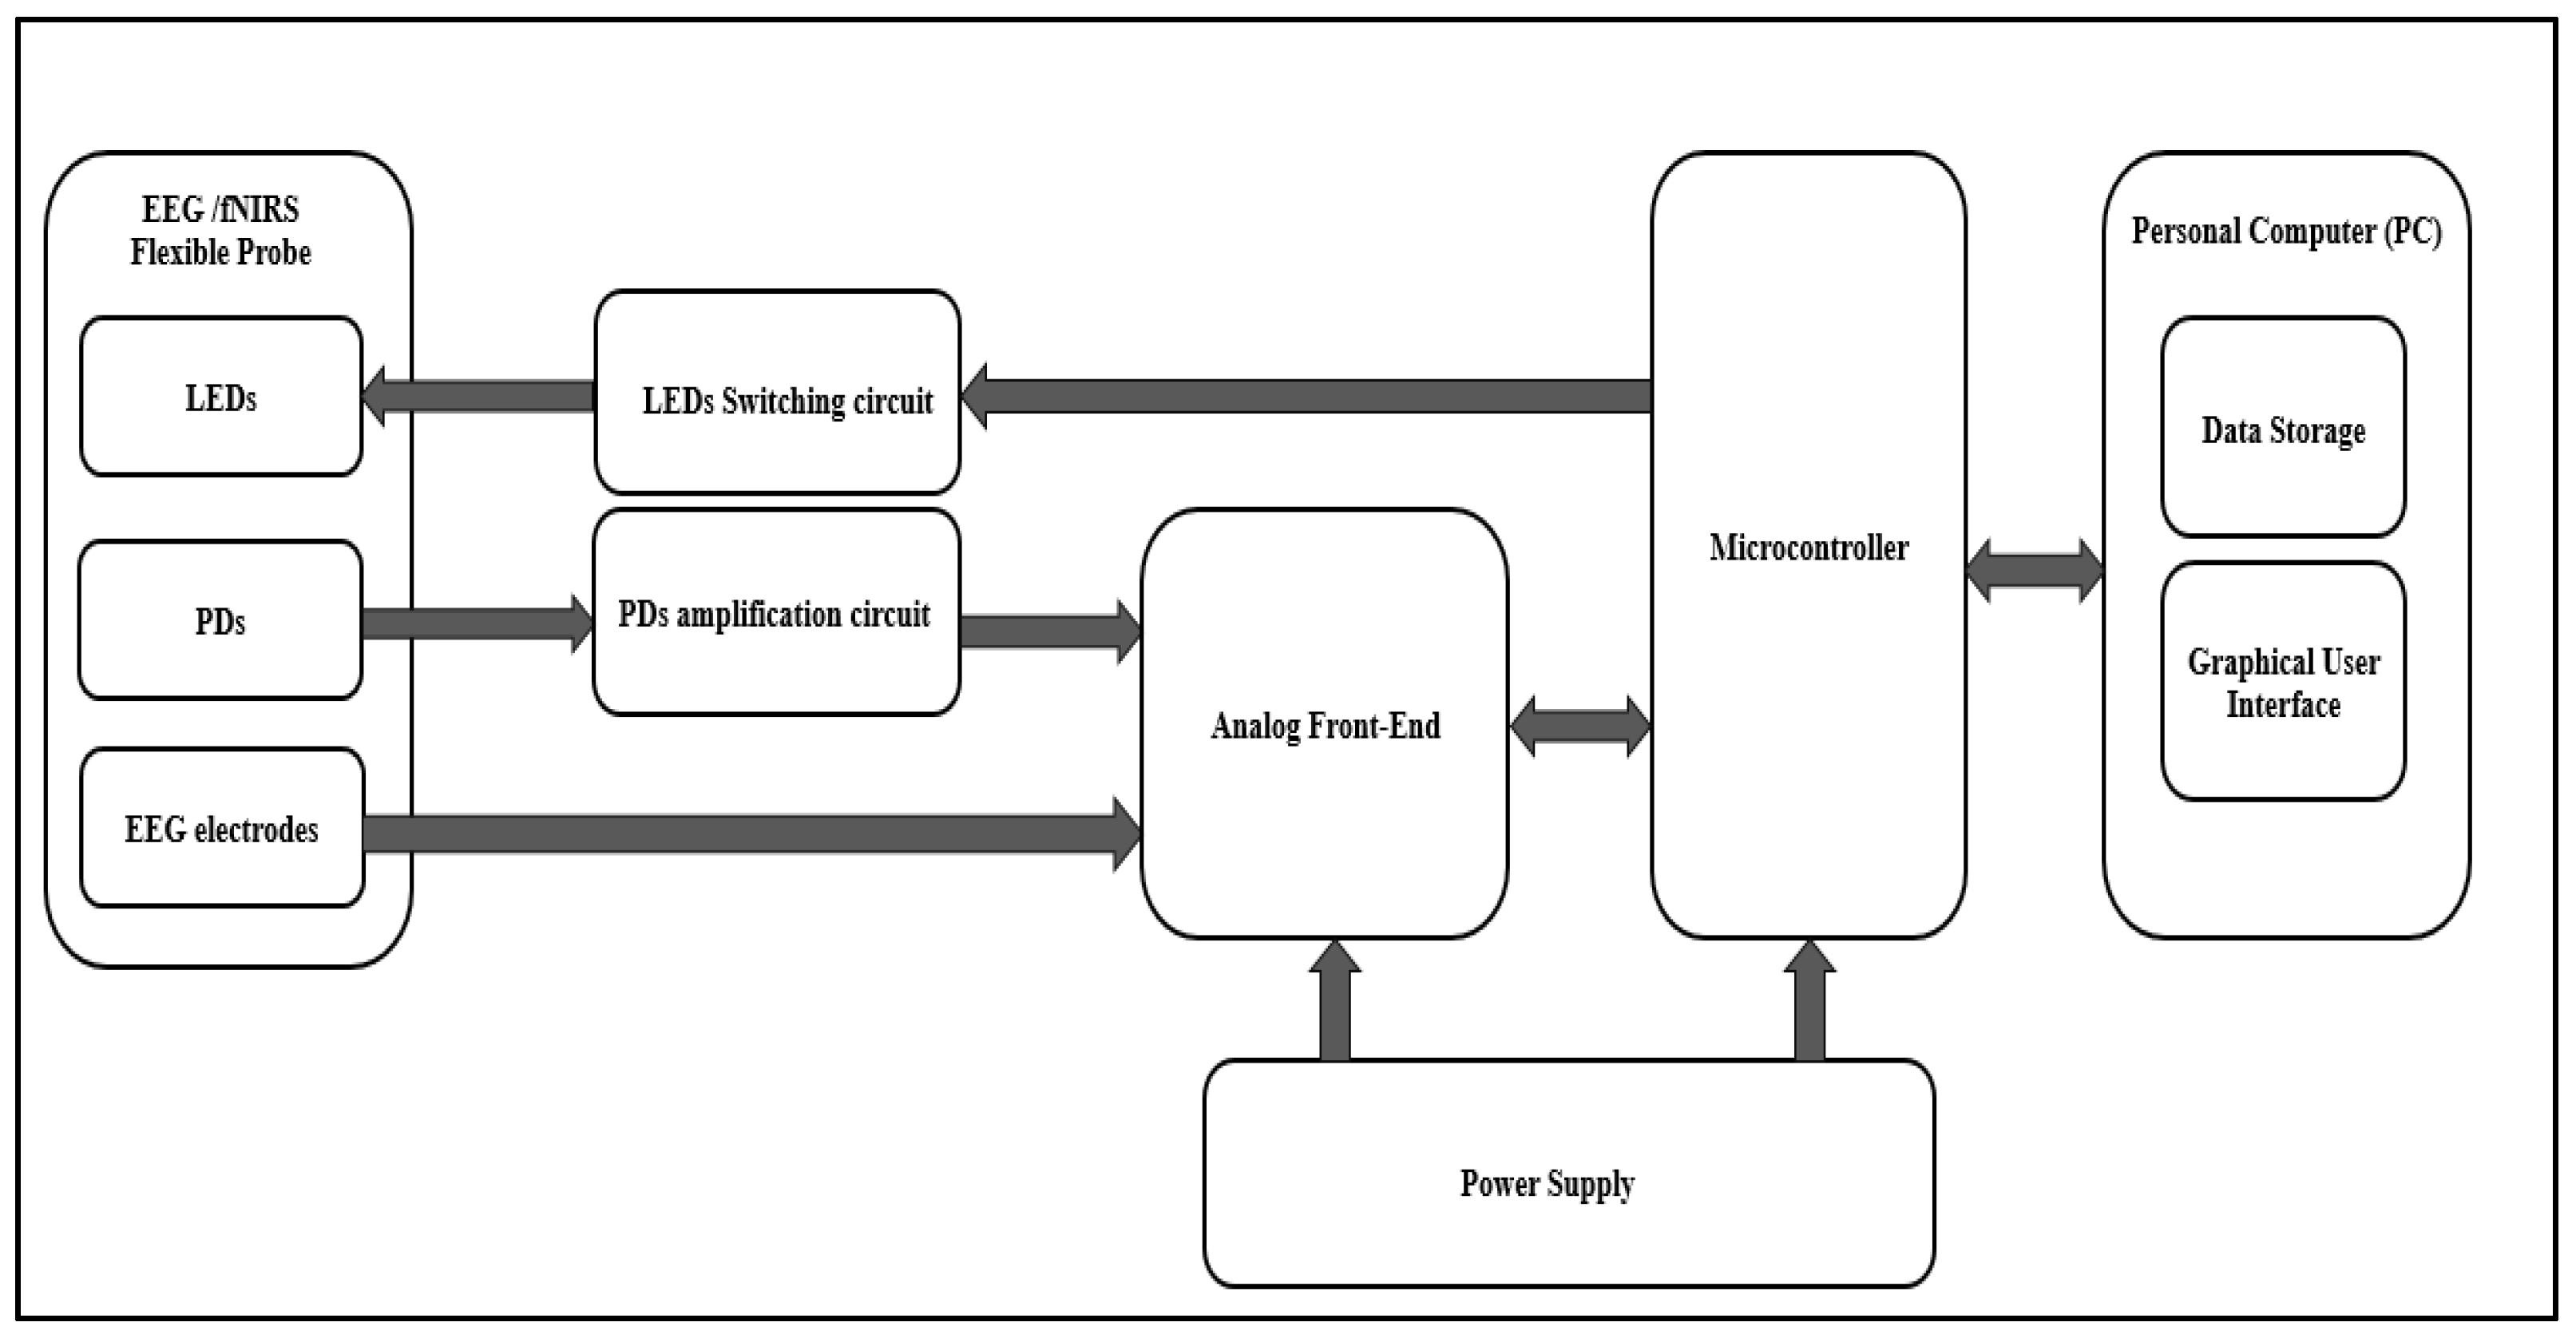
2. System Design
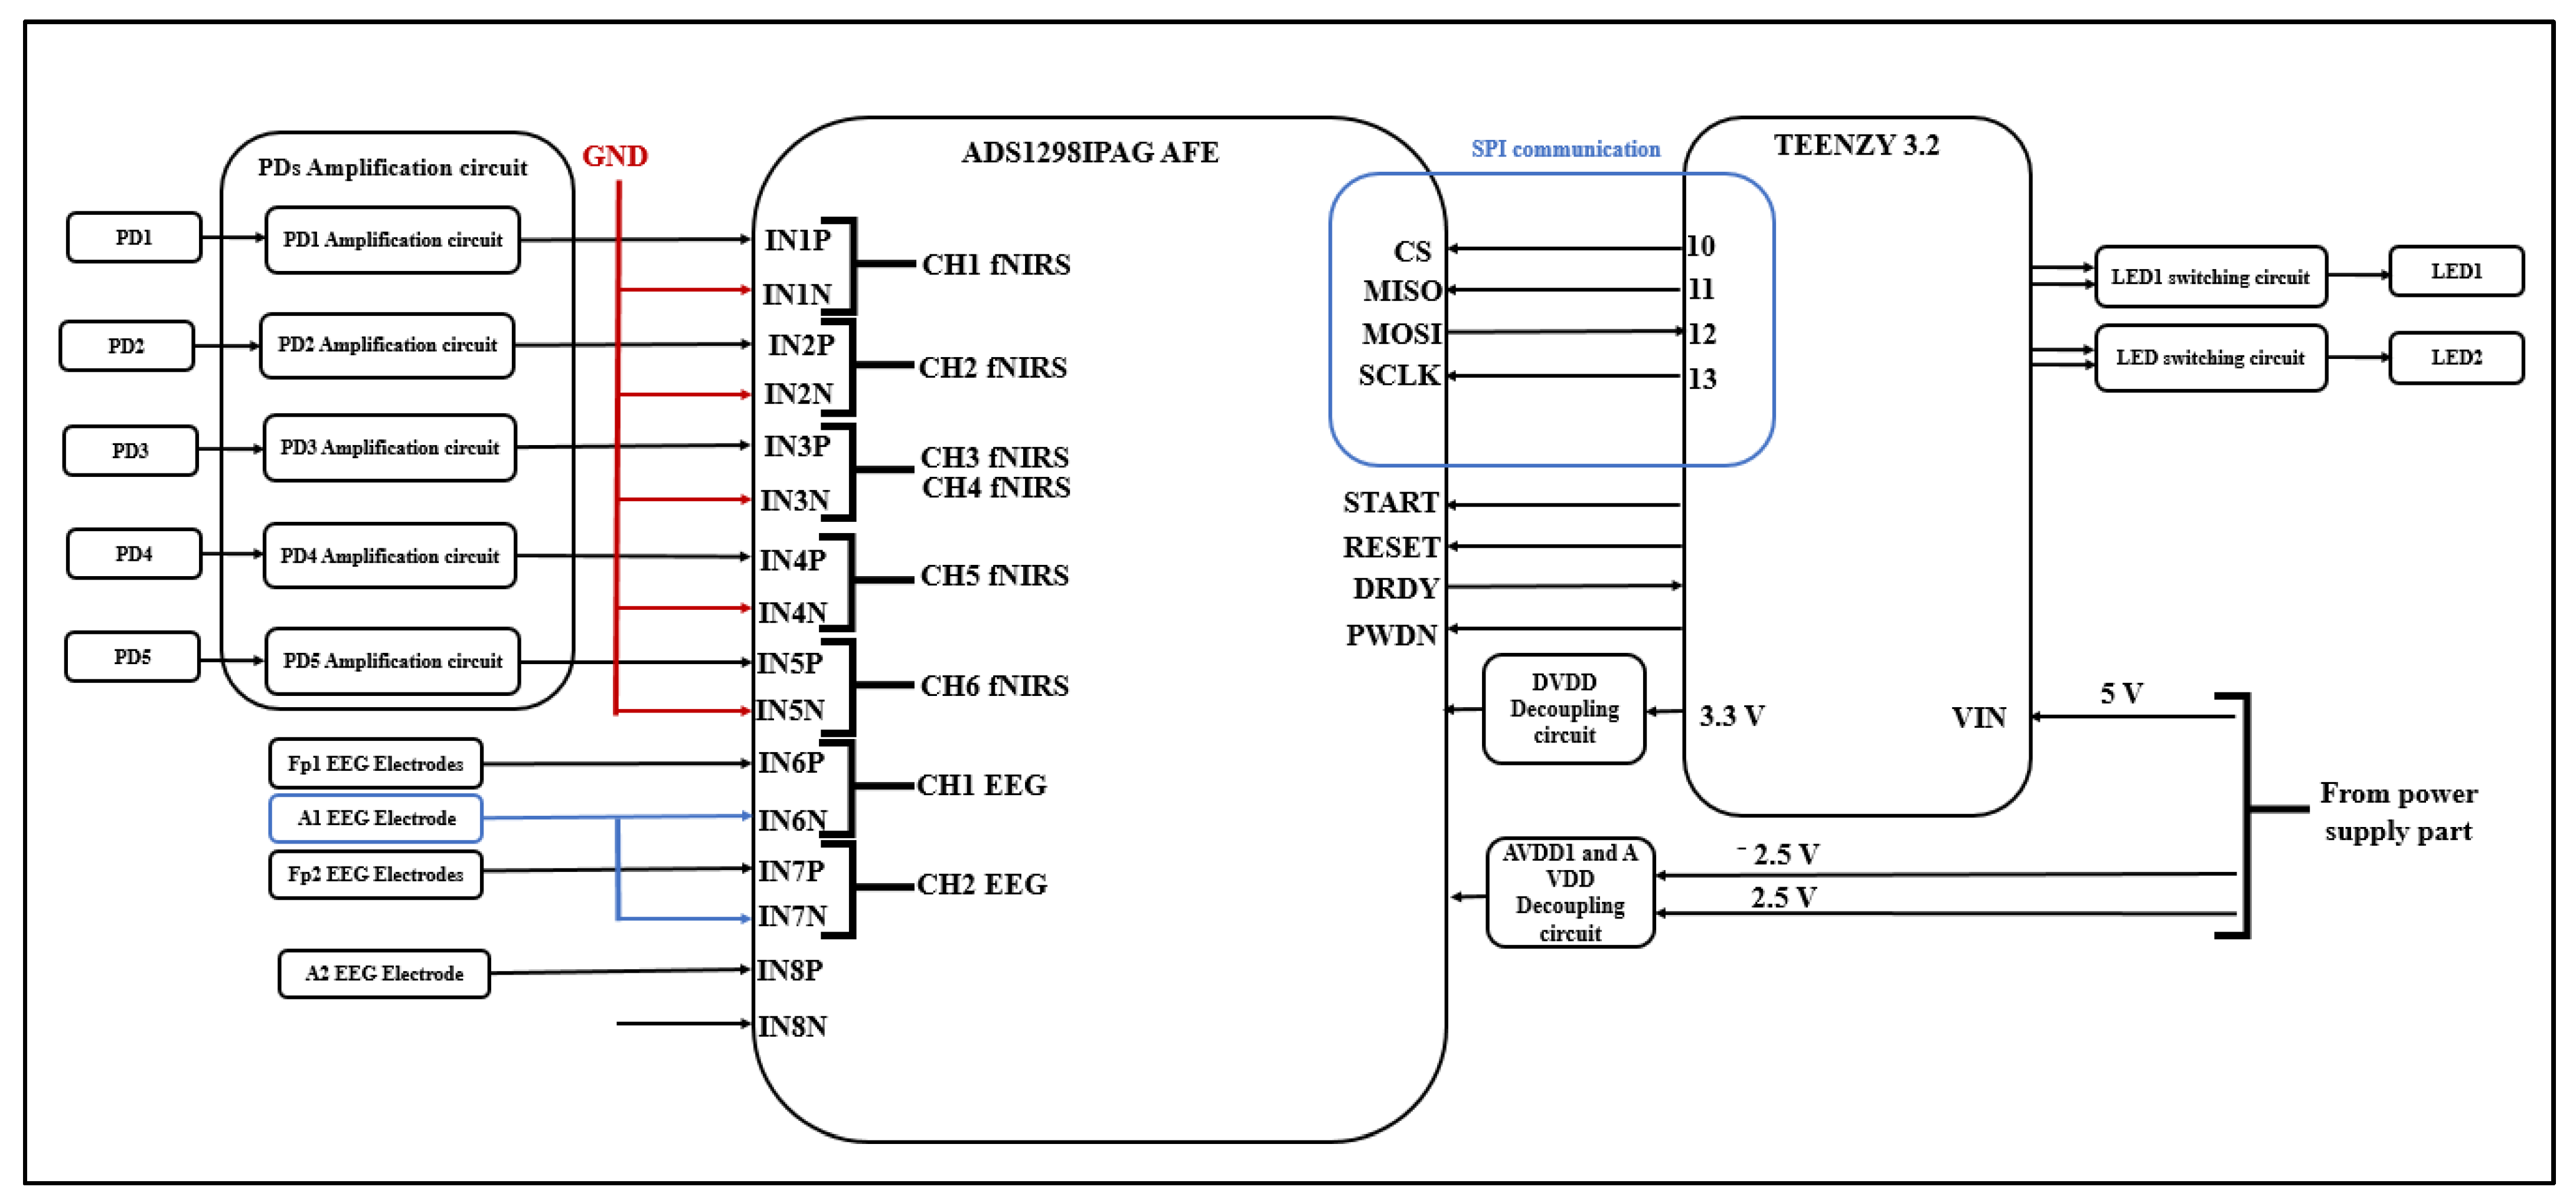
2.1. Analog Front-End for EEG and fNIRS Measurements
2.2. Microcontroller
2.3. Power Supply and Protection Circuit
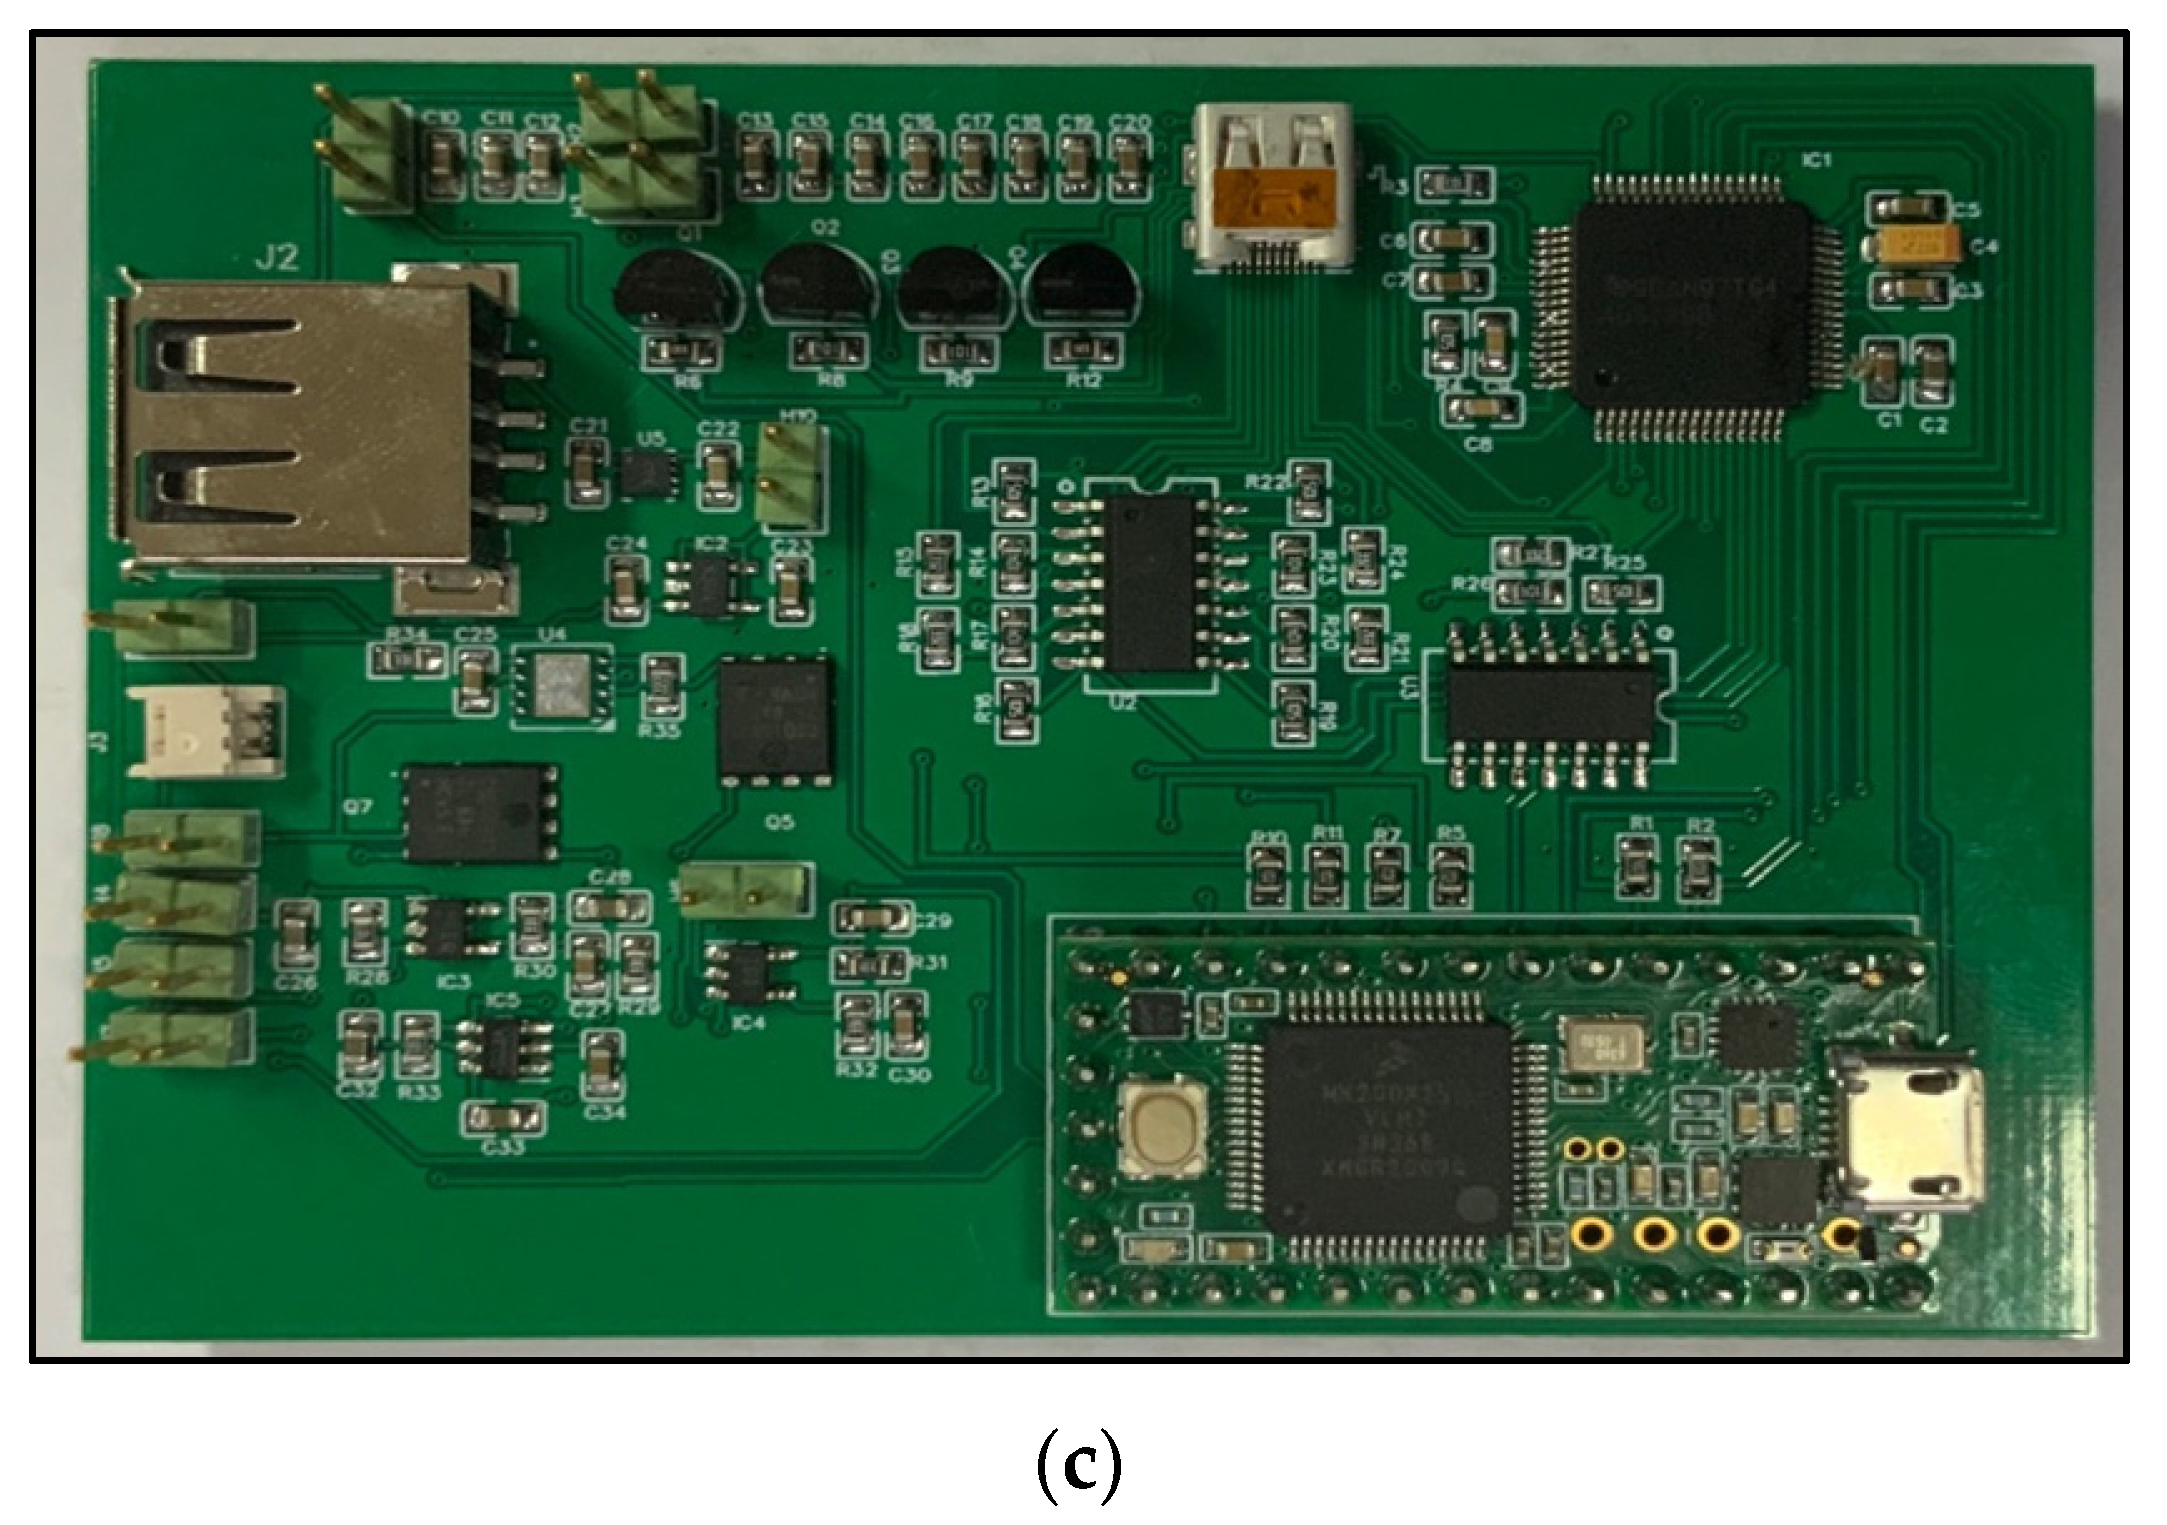
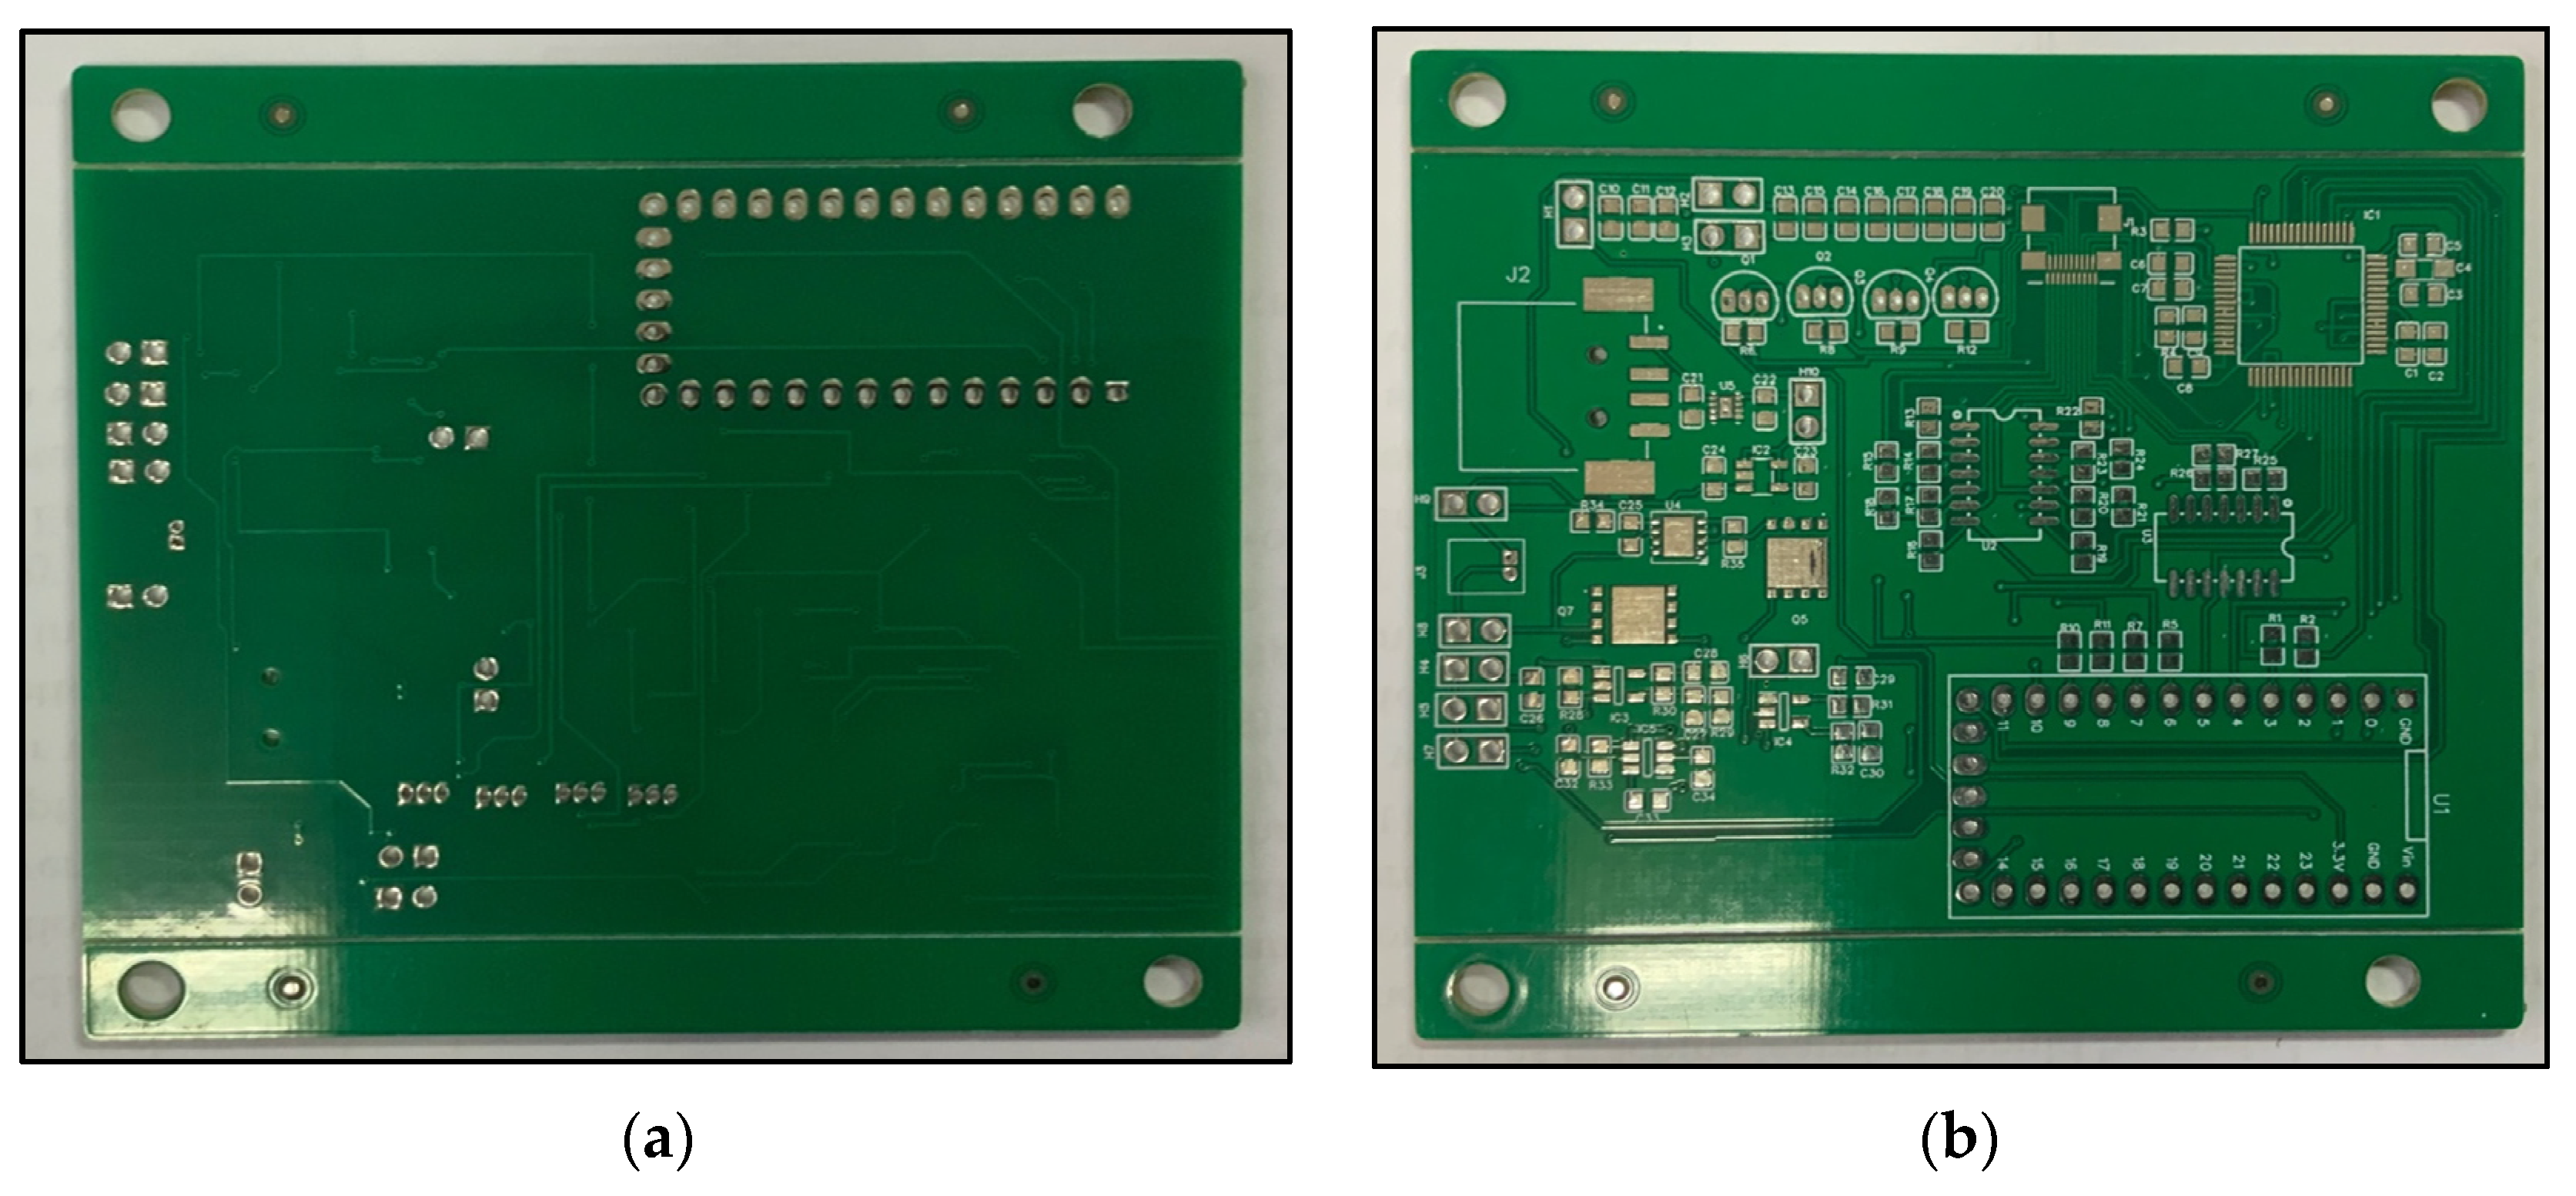
3. Implementation
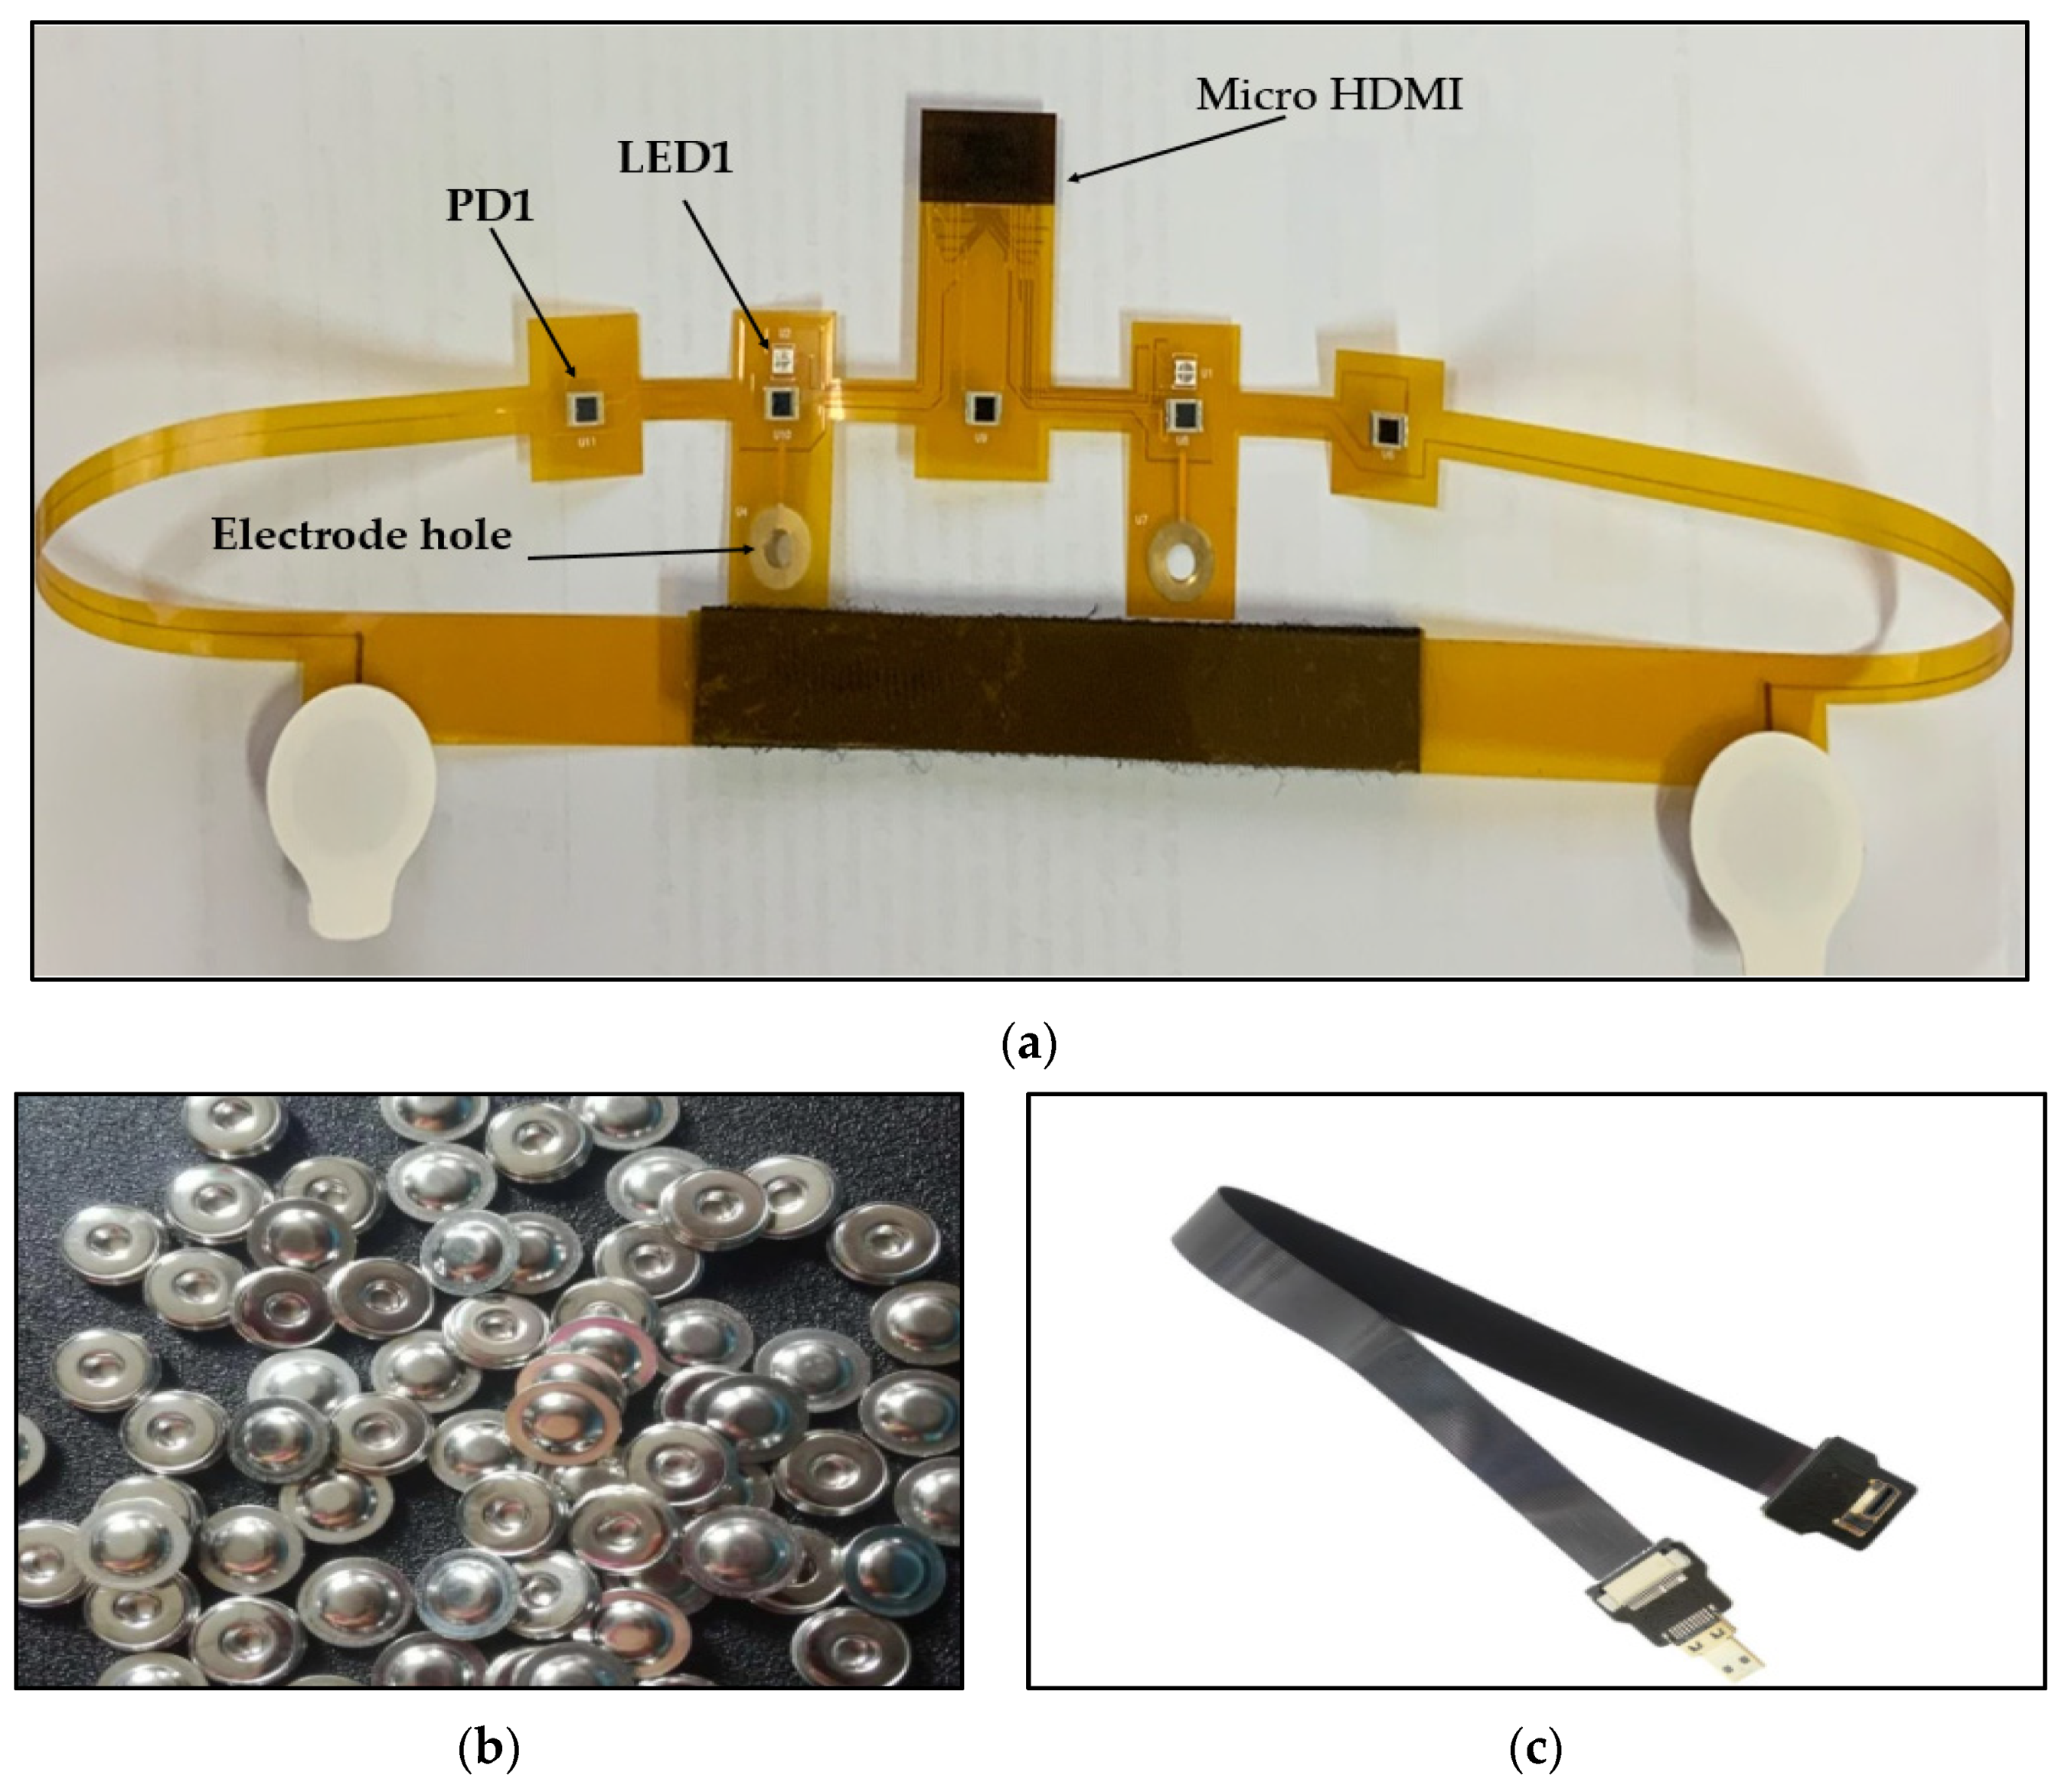
3.1. EEG/fNIRS Acquisition Circuit
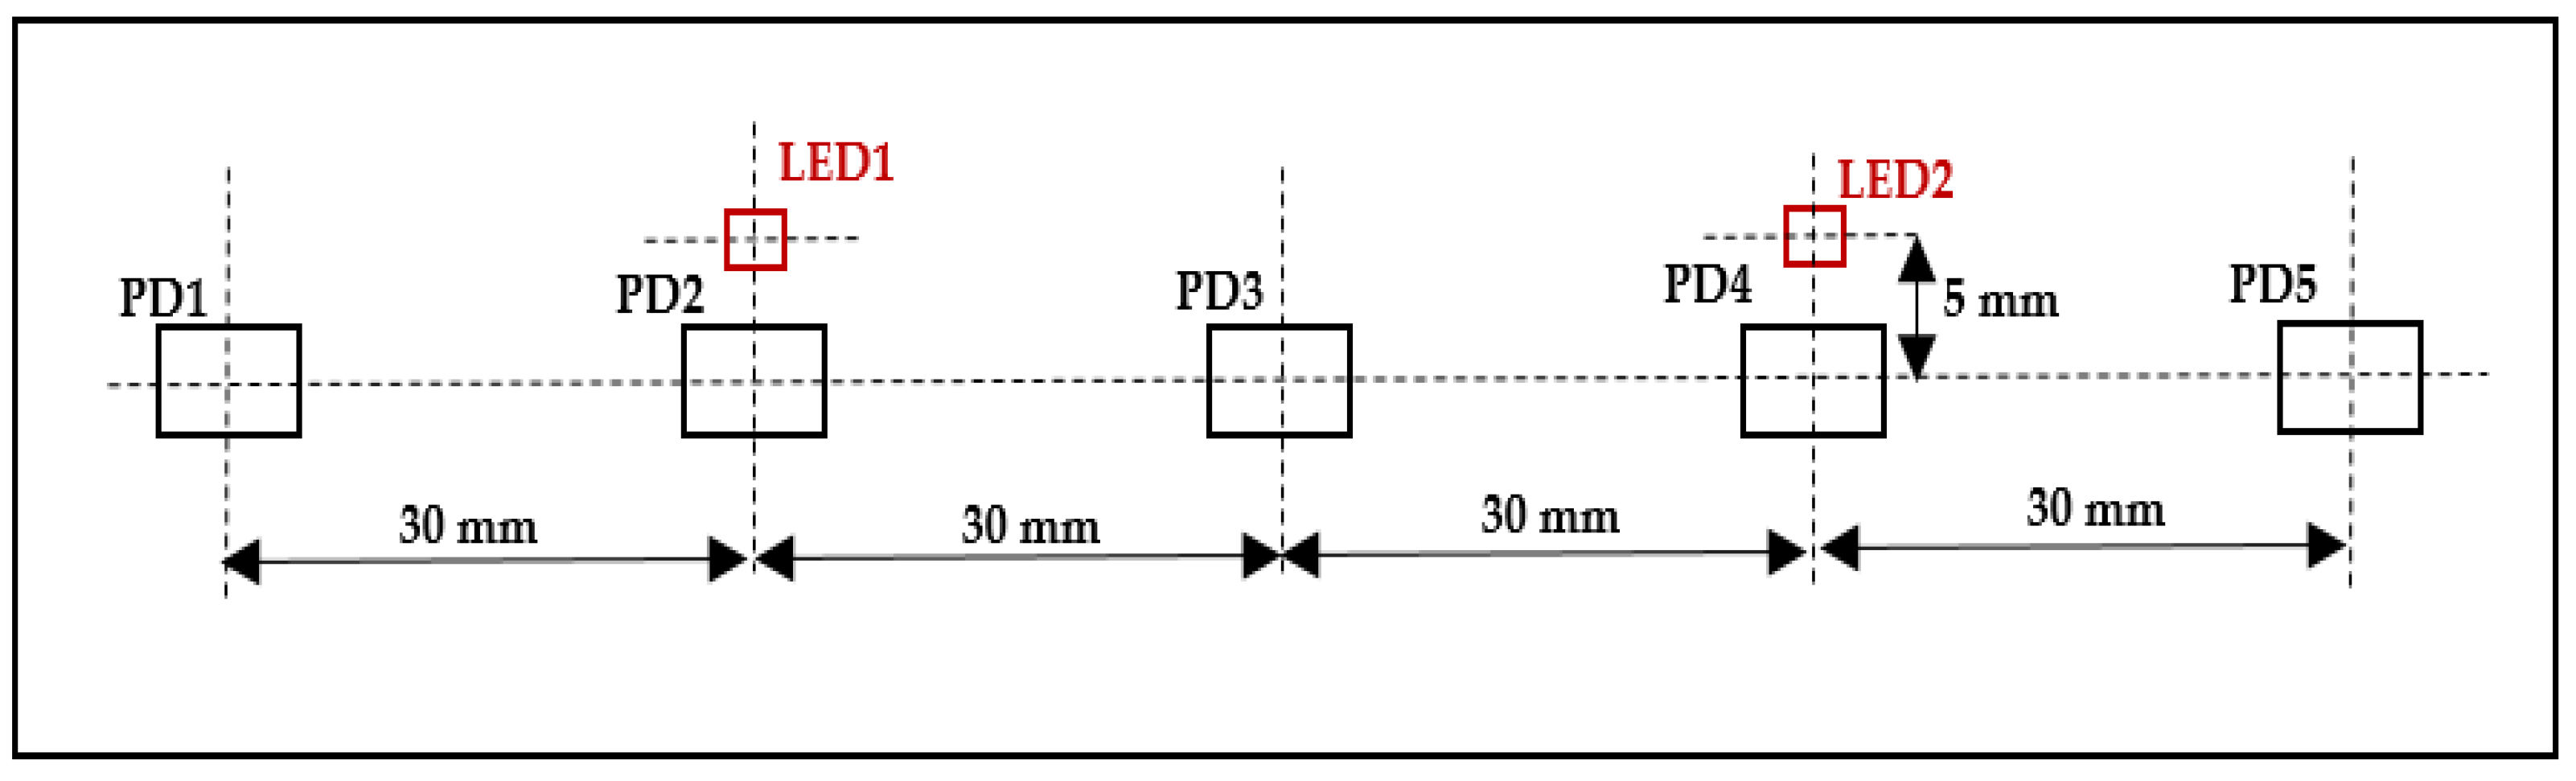
3.1.1. EEG/fNIRS Probe
3.1.2. Light-Emitting Diodes (LEDs) Switching Circuit
3.1.3. Photodiodes (PDs) Amplification Circuit
3.1.4. EEG/fNIRS Measurement and Control Circuit
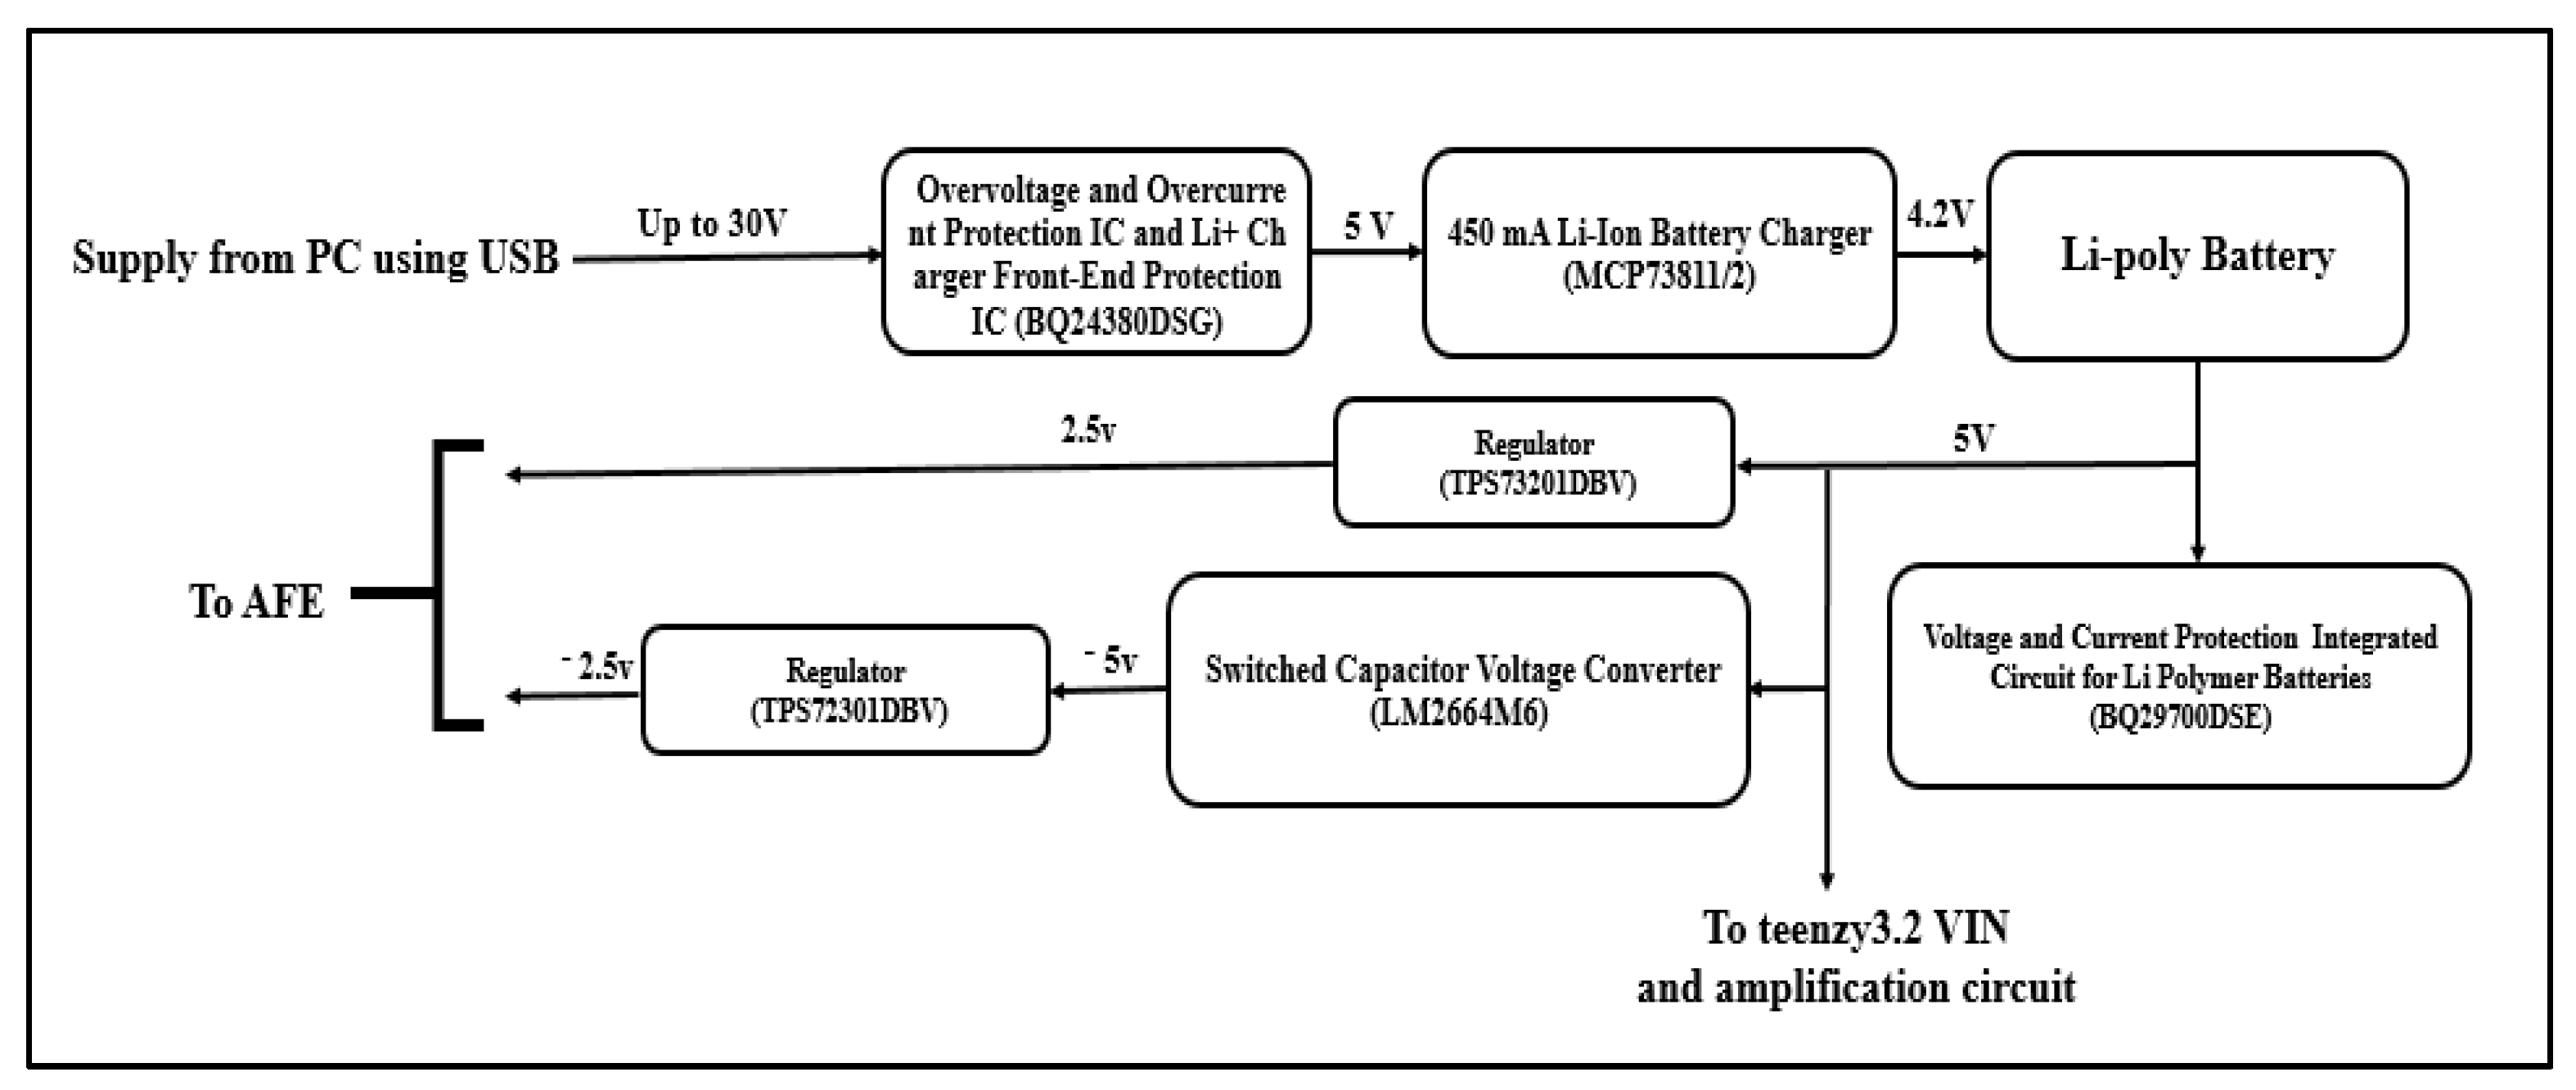
3.2. EEG/fNIRS Power Supply Circuit
3.2.1. Rechargeable Lithium Polymer Battery
3.2.2. Battery Charger
3.2.3. Overvoltage and Overcurrent Protection Circuit
3.2.4. Voltage Converter
3.2.5. Voltage Regulators
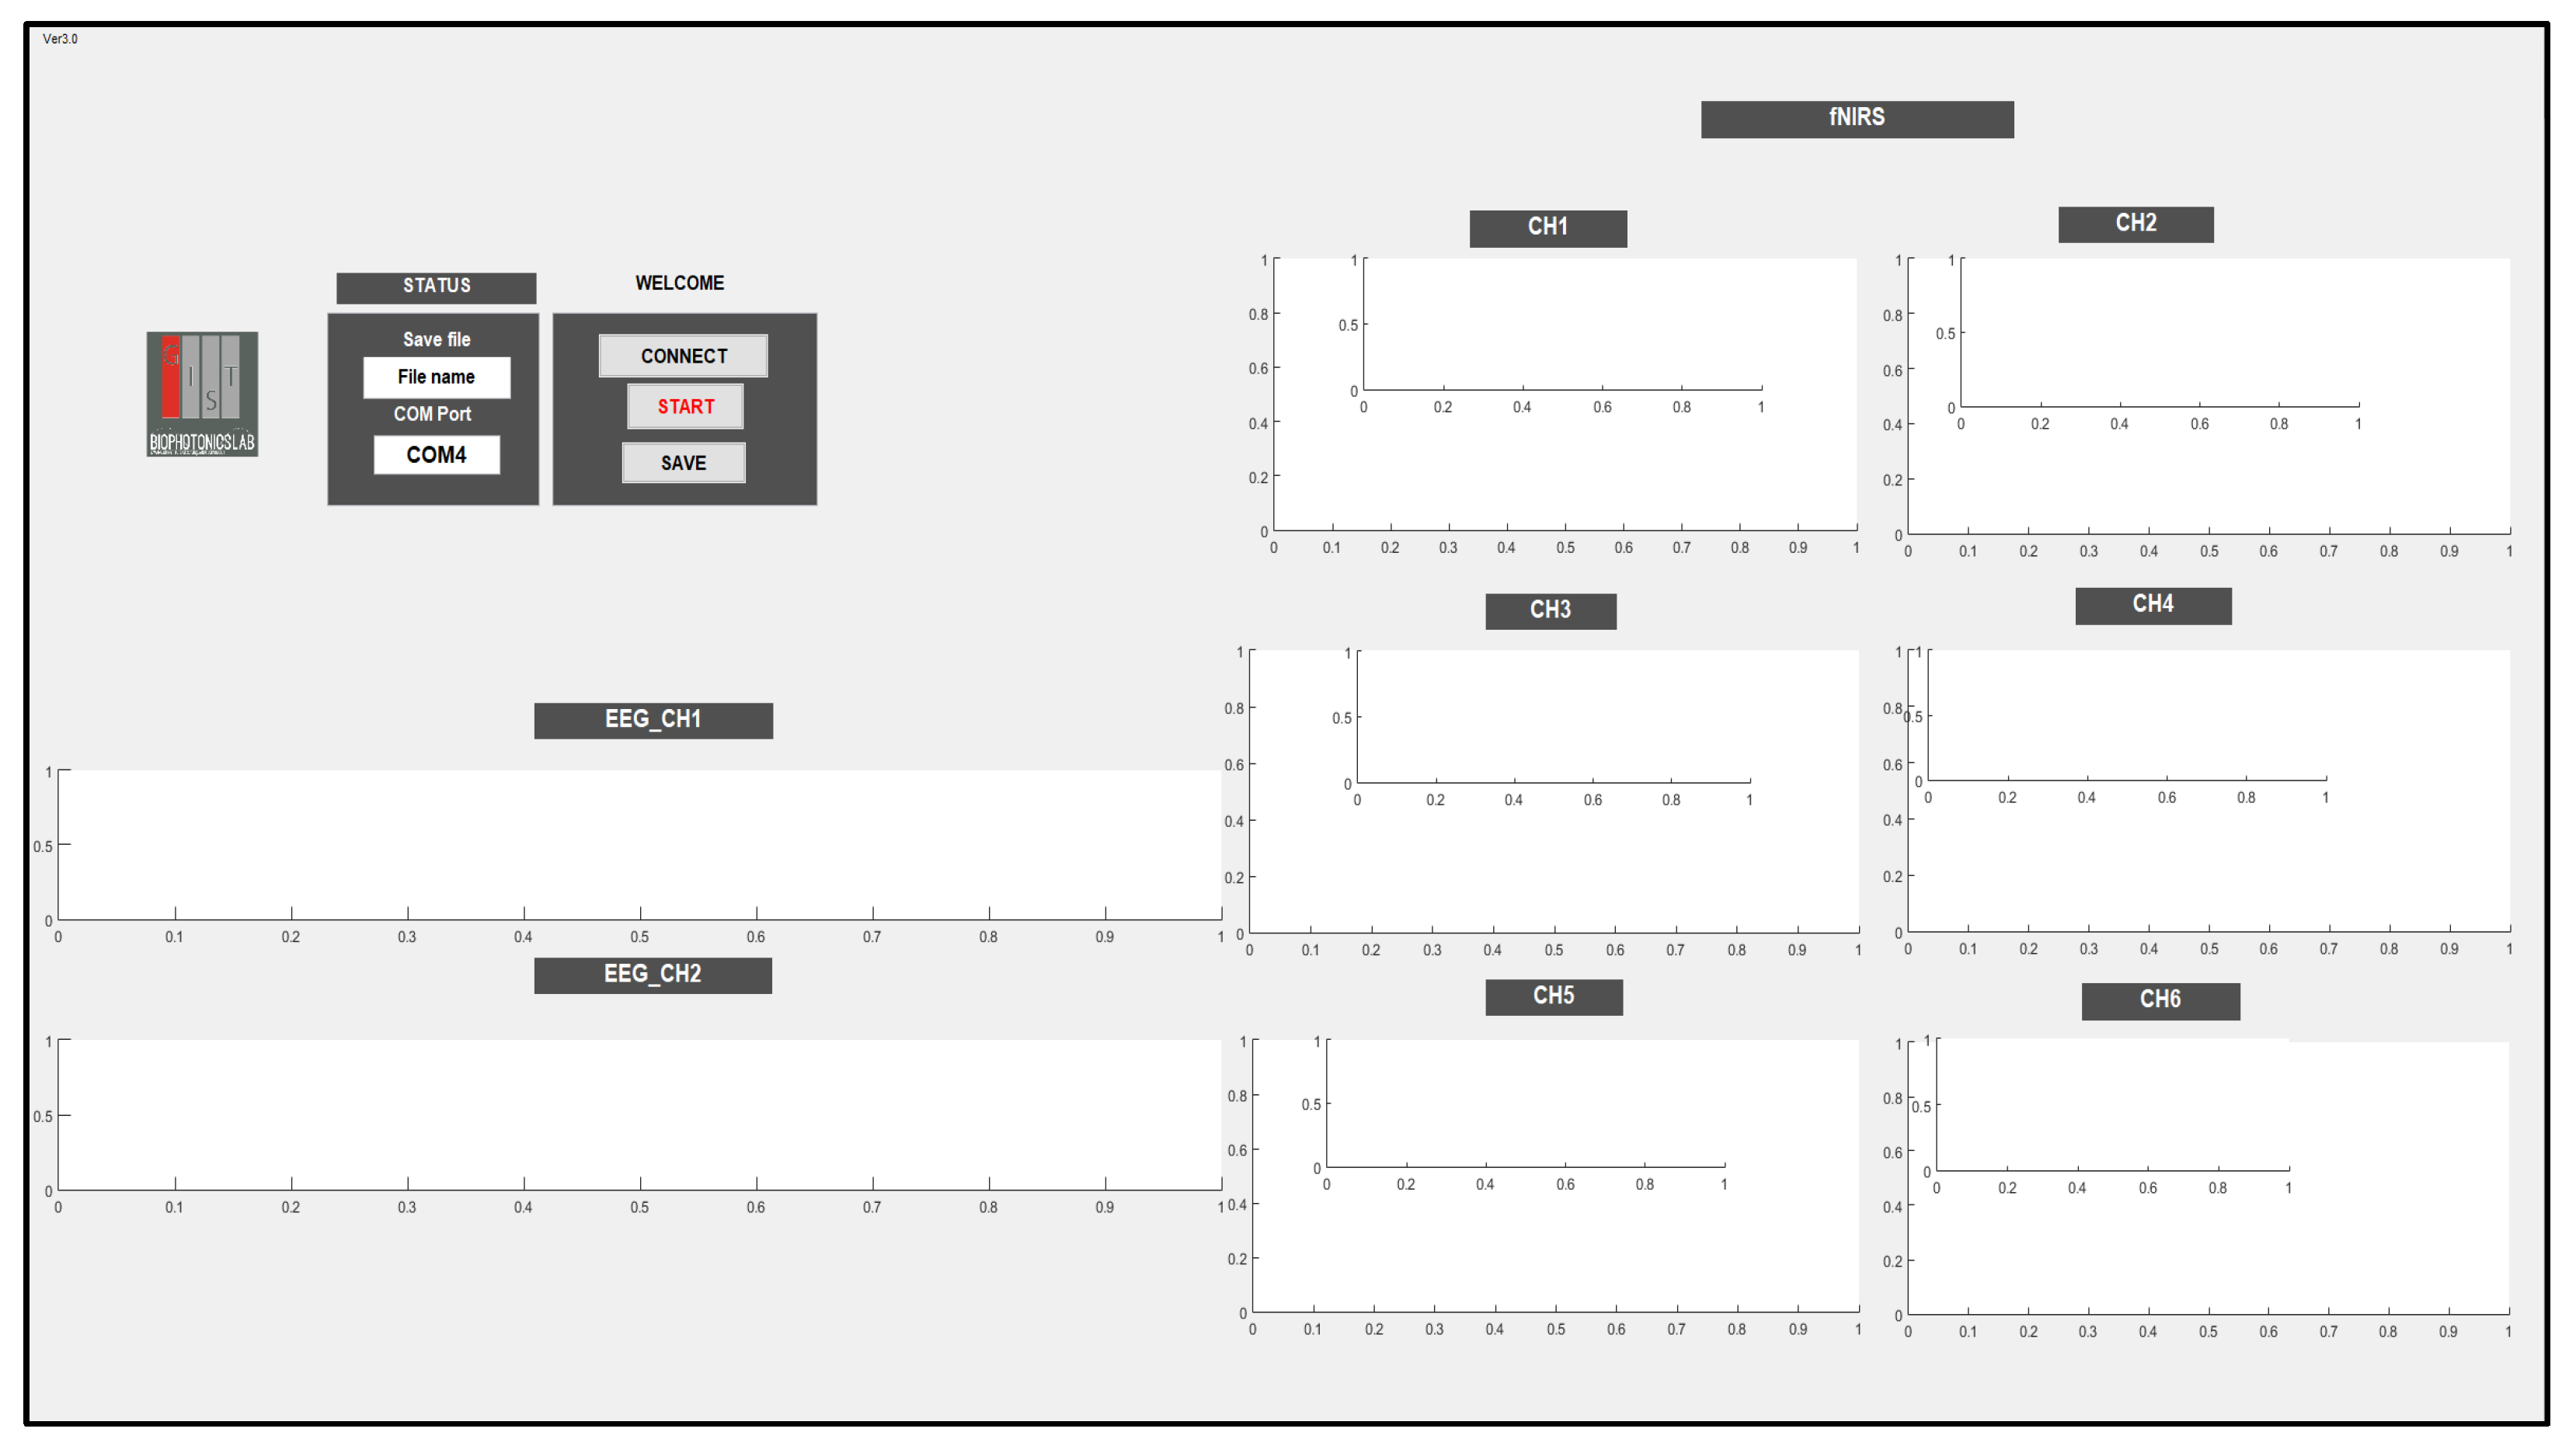
3.3. Personal Computer (PC)
3.4. EEG/fNIRS System Cost
4. EEG/fNIRS System Evaluation
4.1. Analog Front-End Evaluation
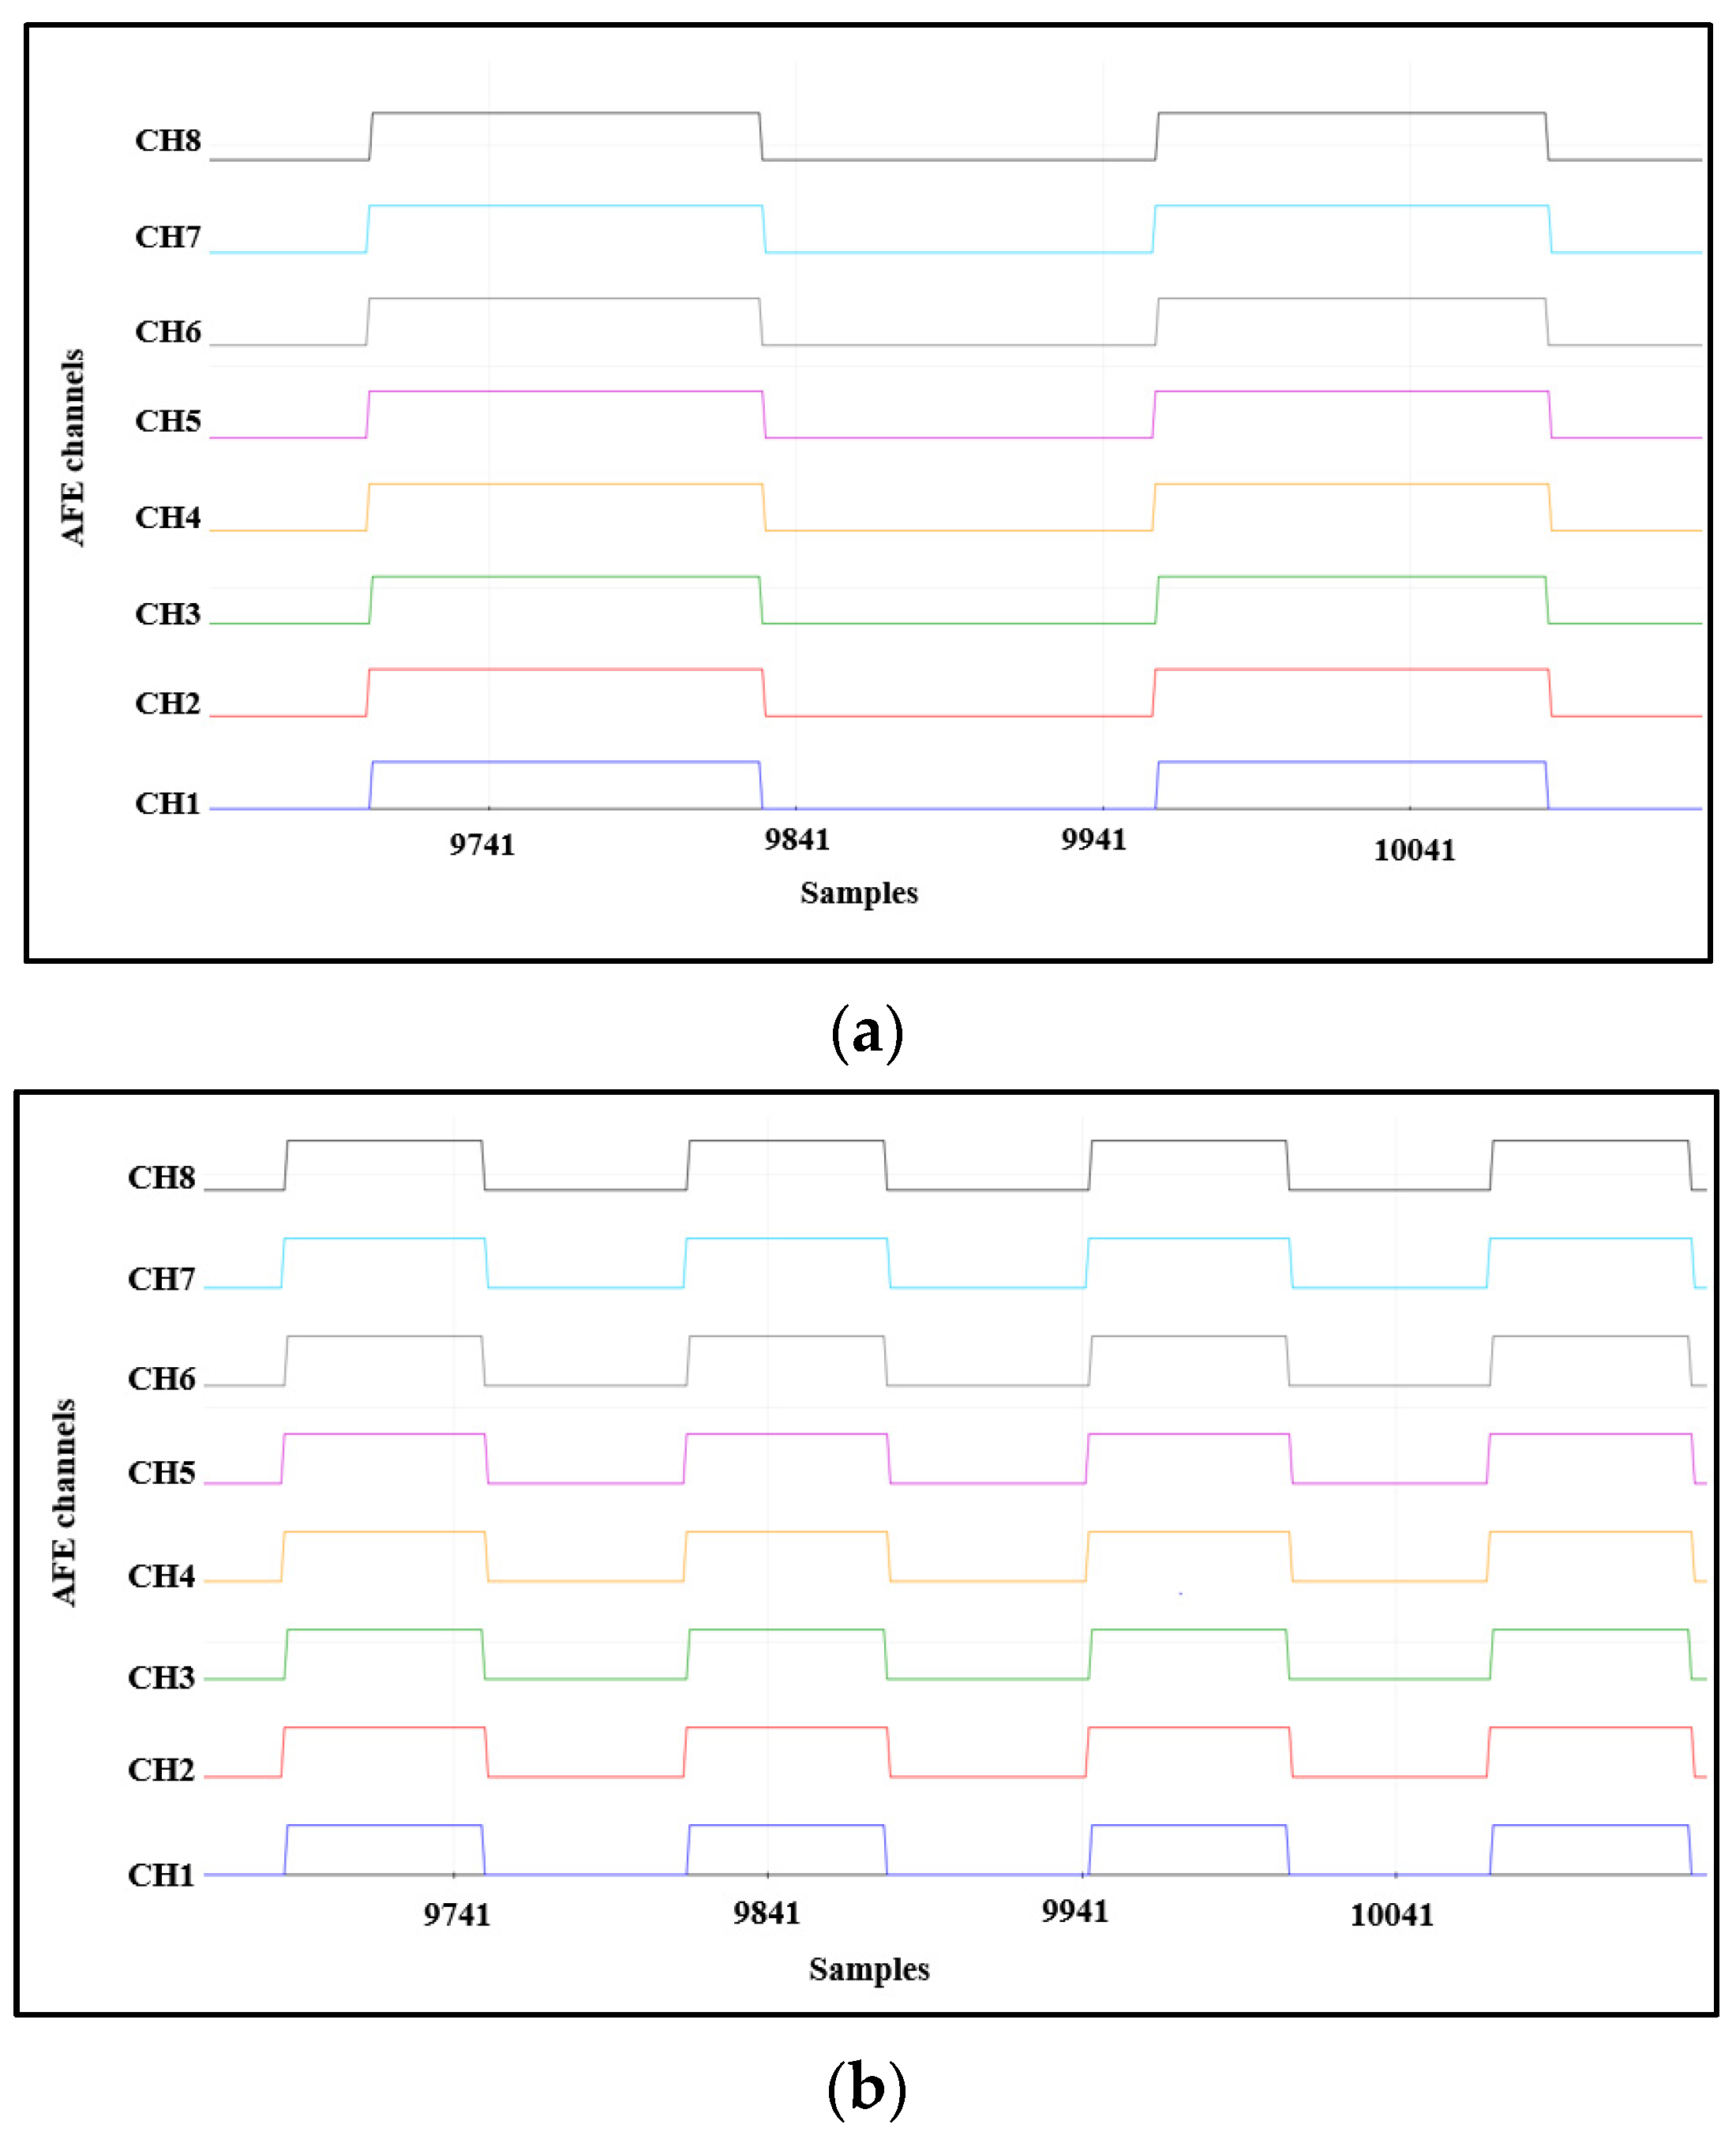
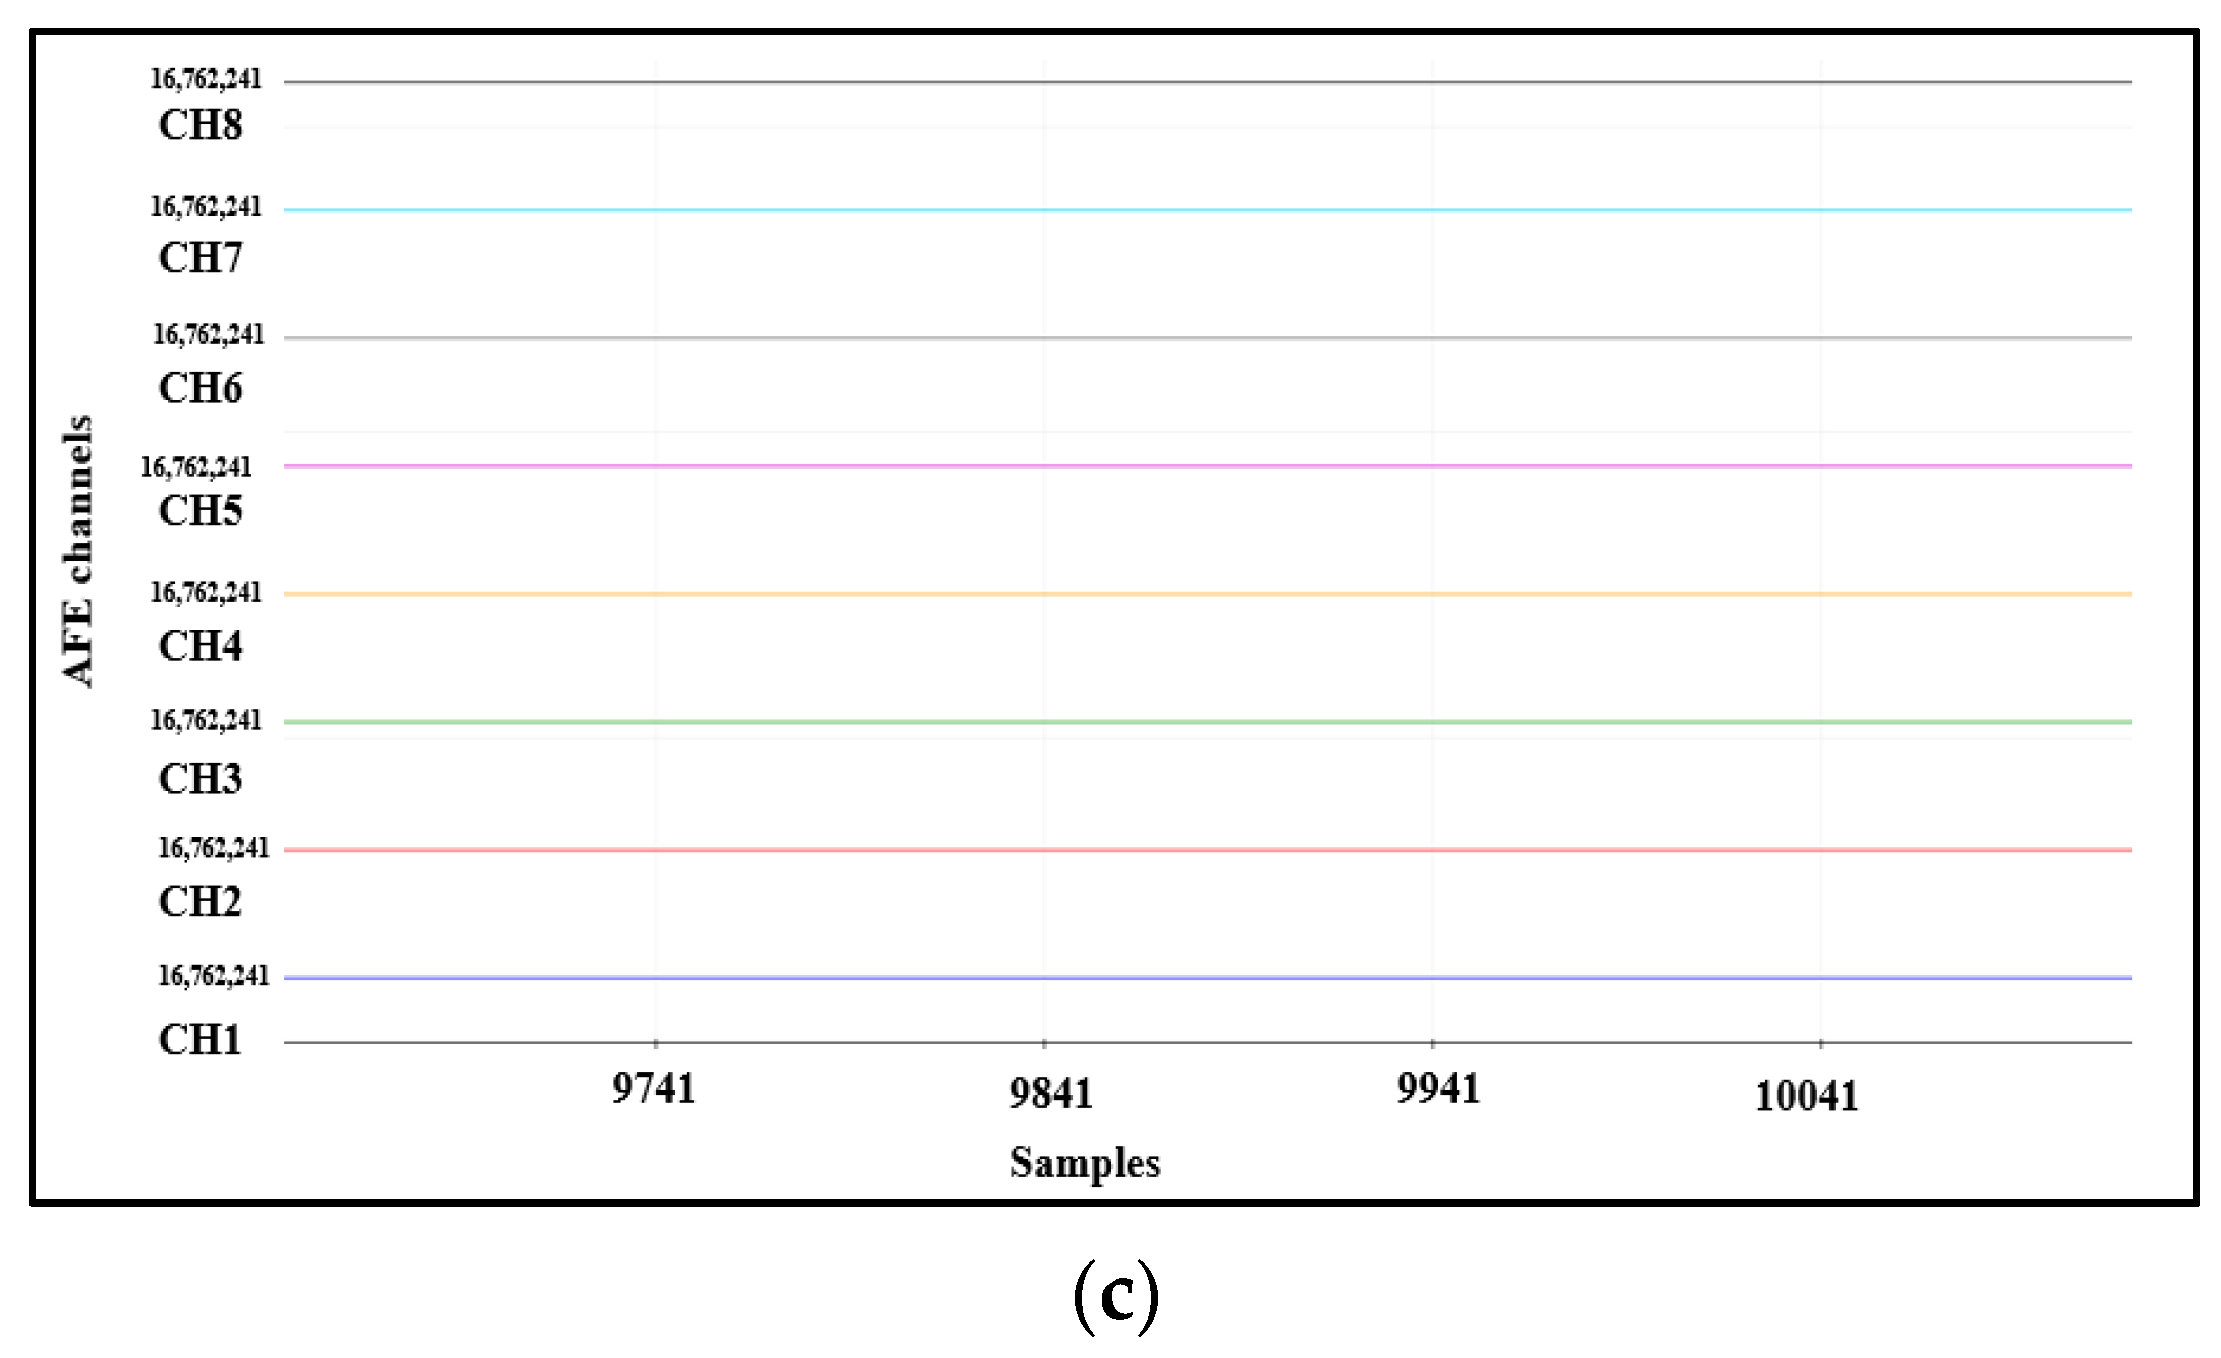
4.1.1. Internal Test Signal
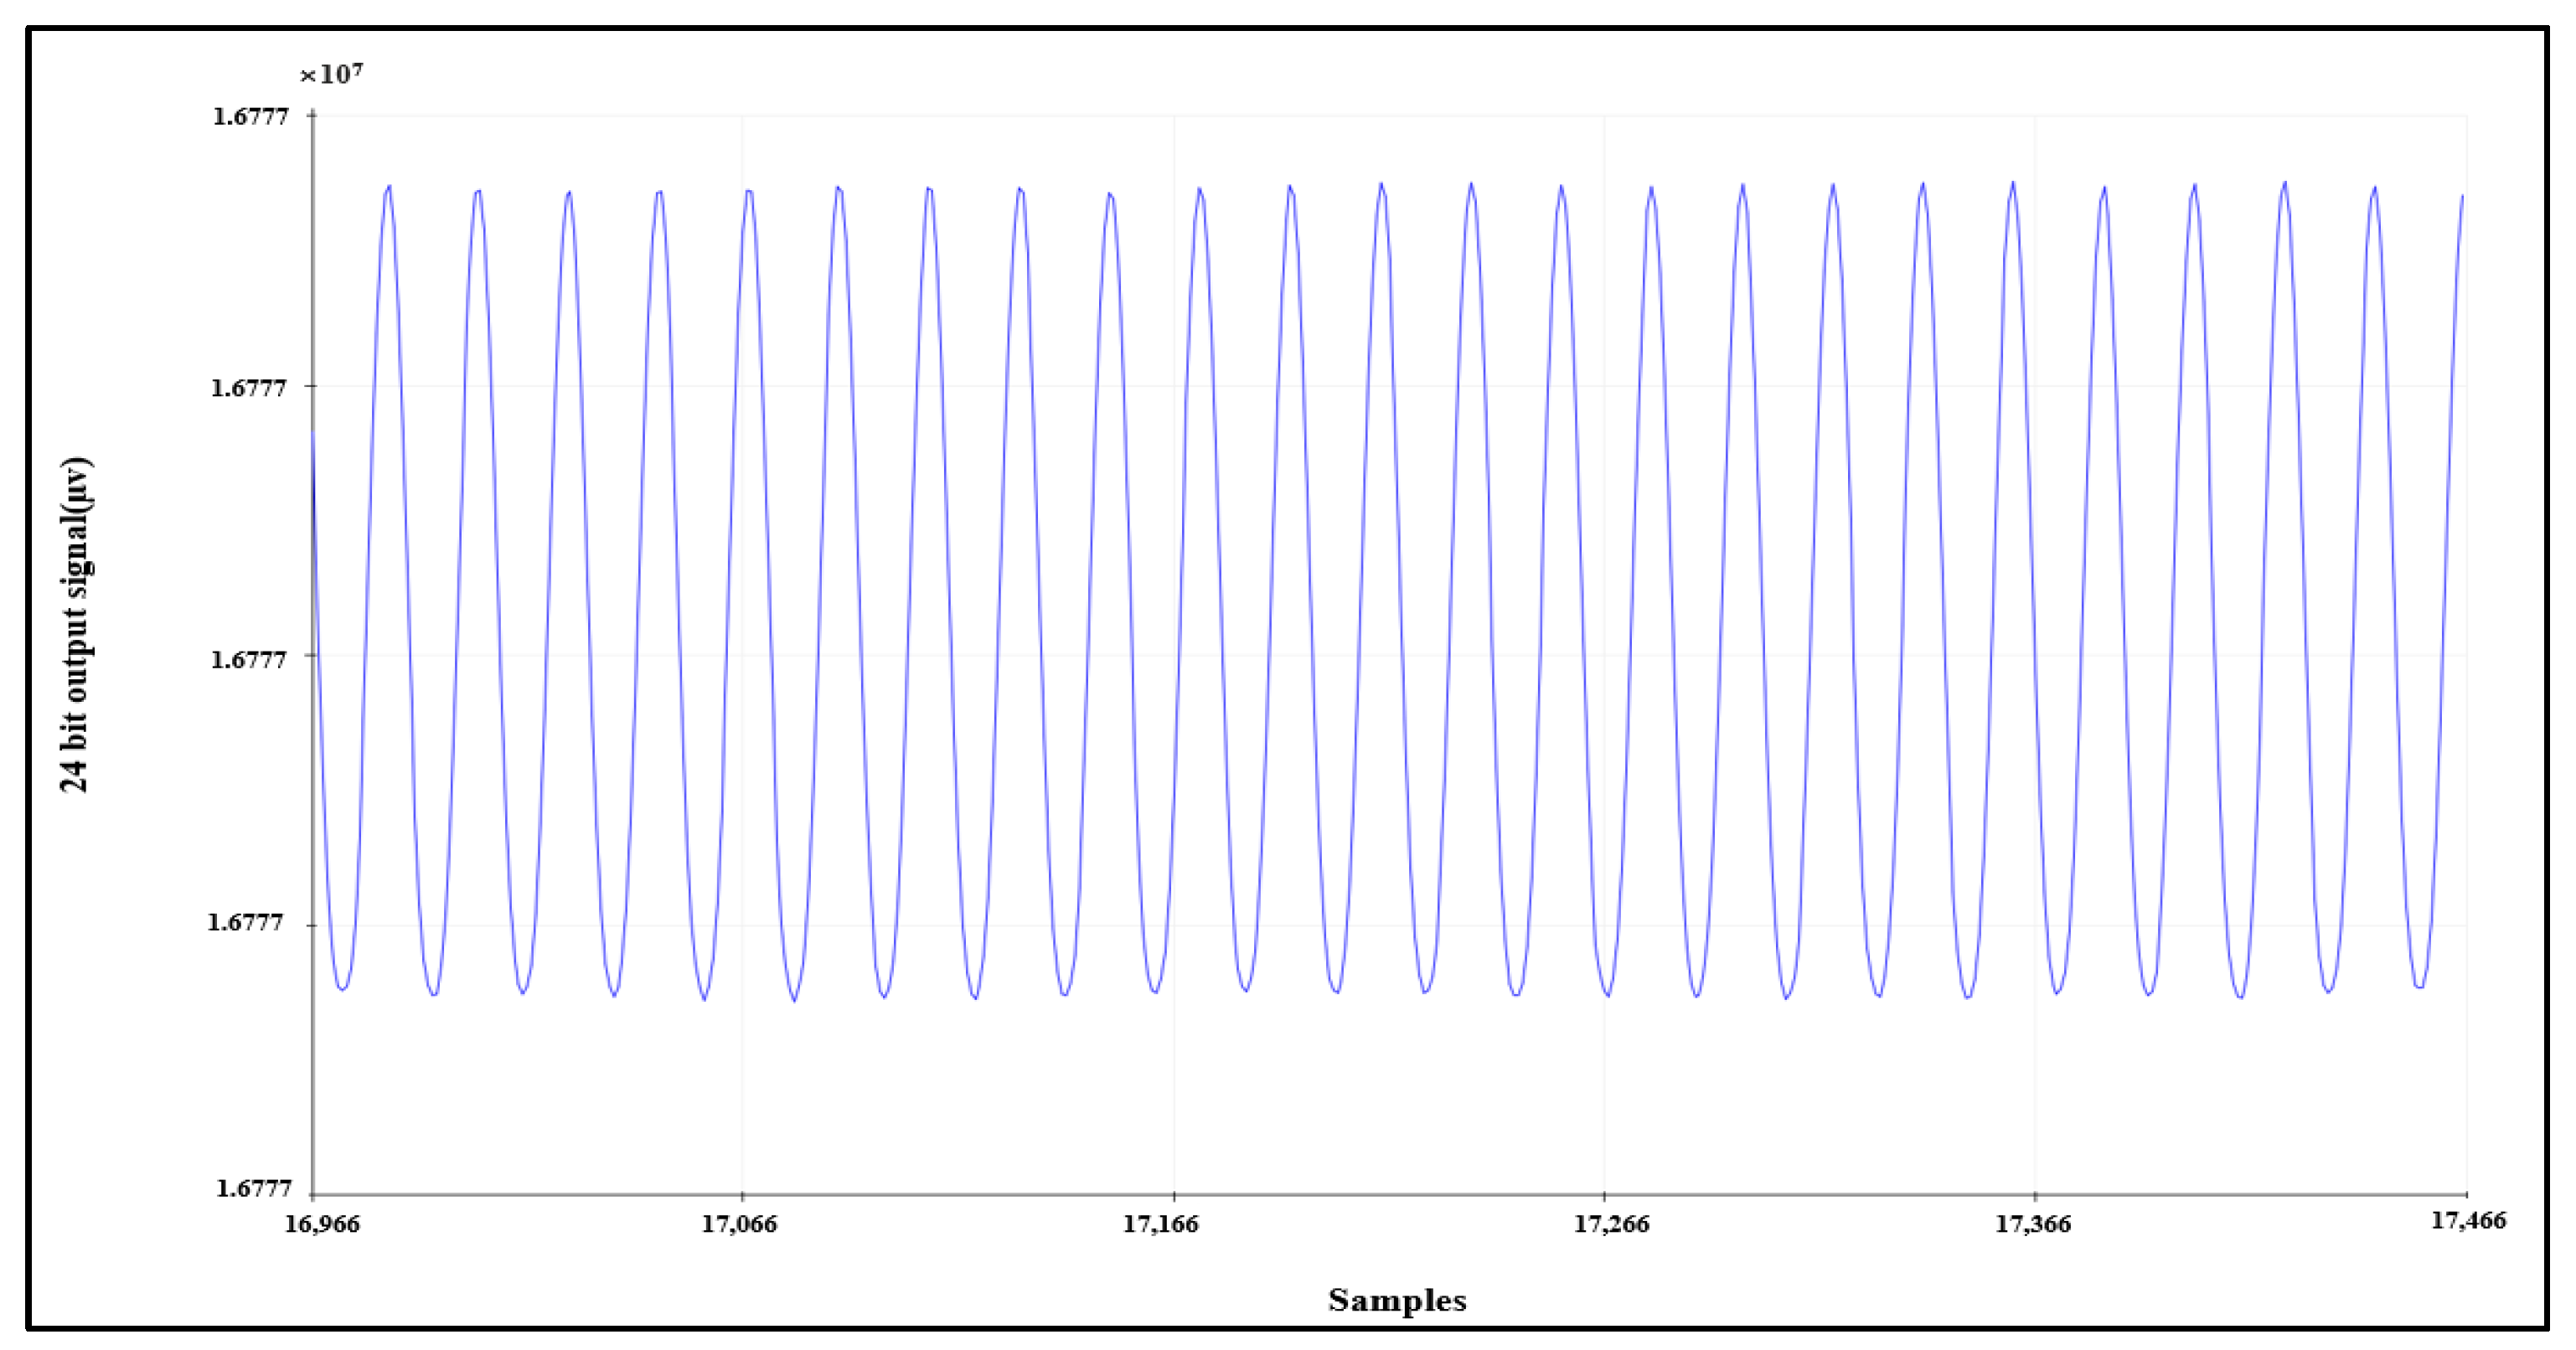
4.1.2. Sinusoidal Input Test Signal
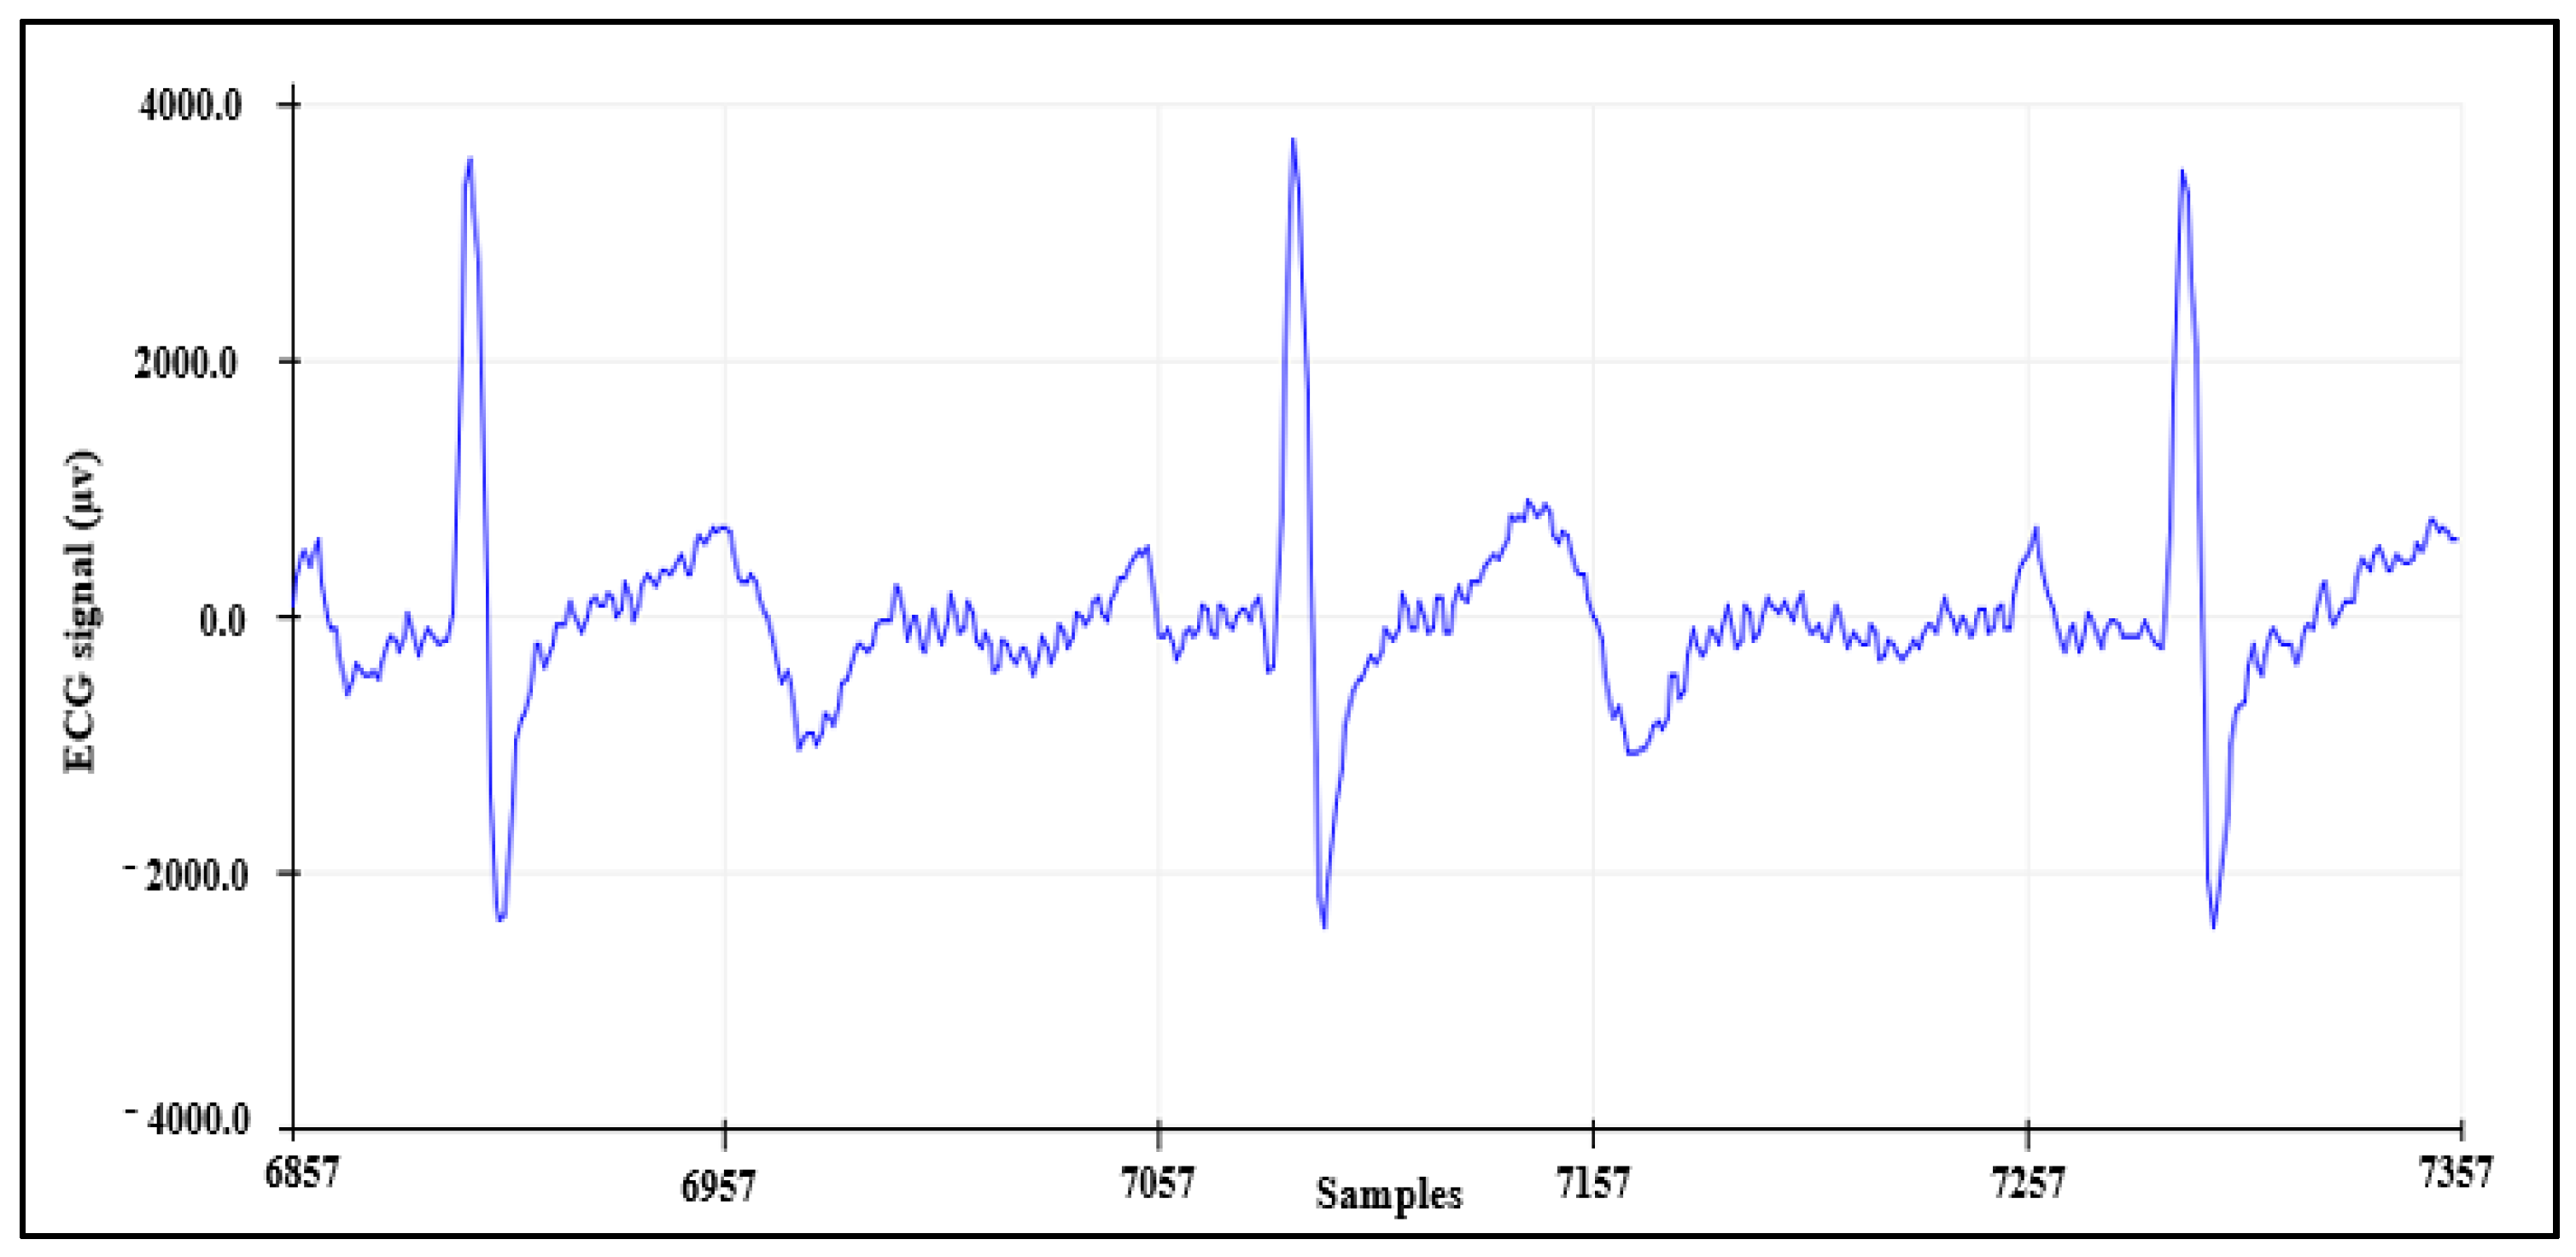
4.1.3. ECG Signal Detection
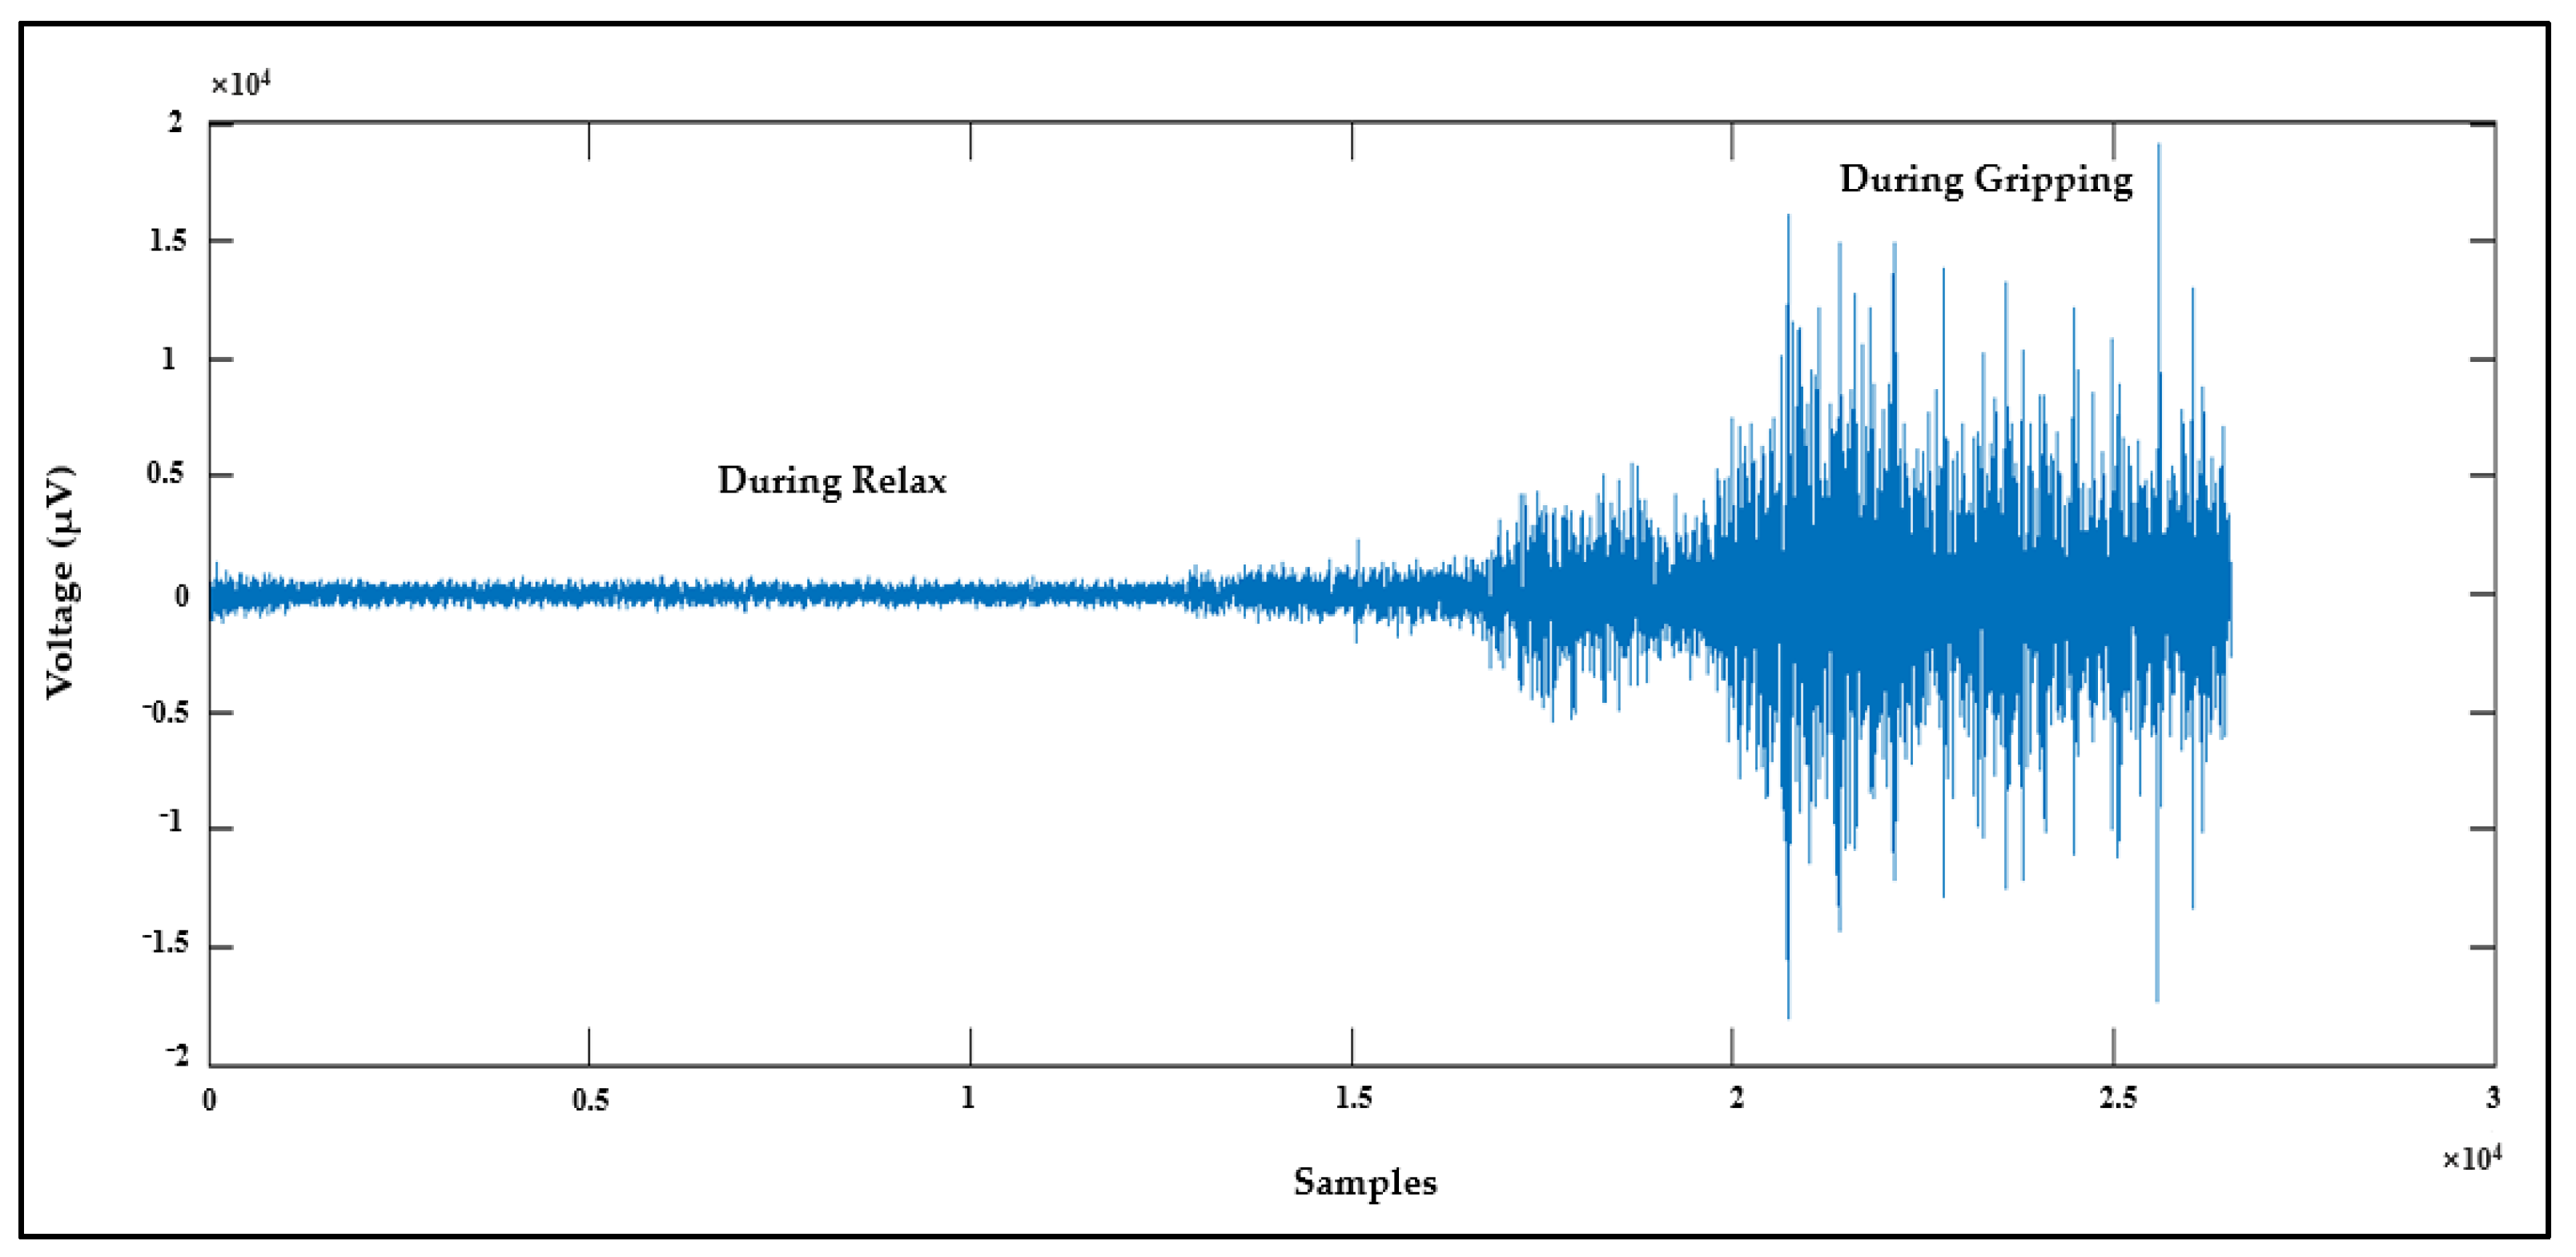
4.1.4. EMG Signal Detection
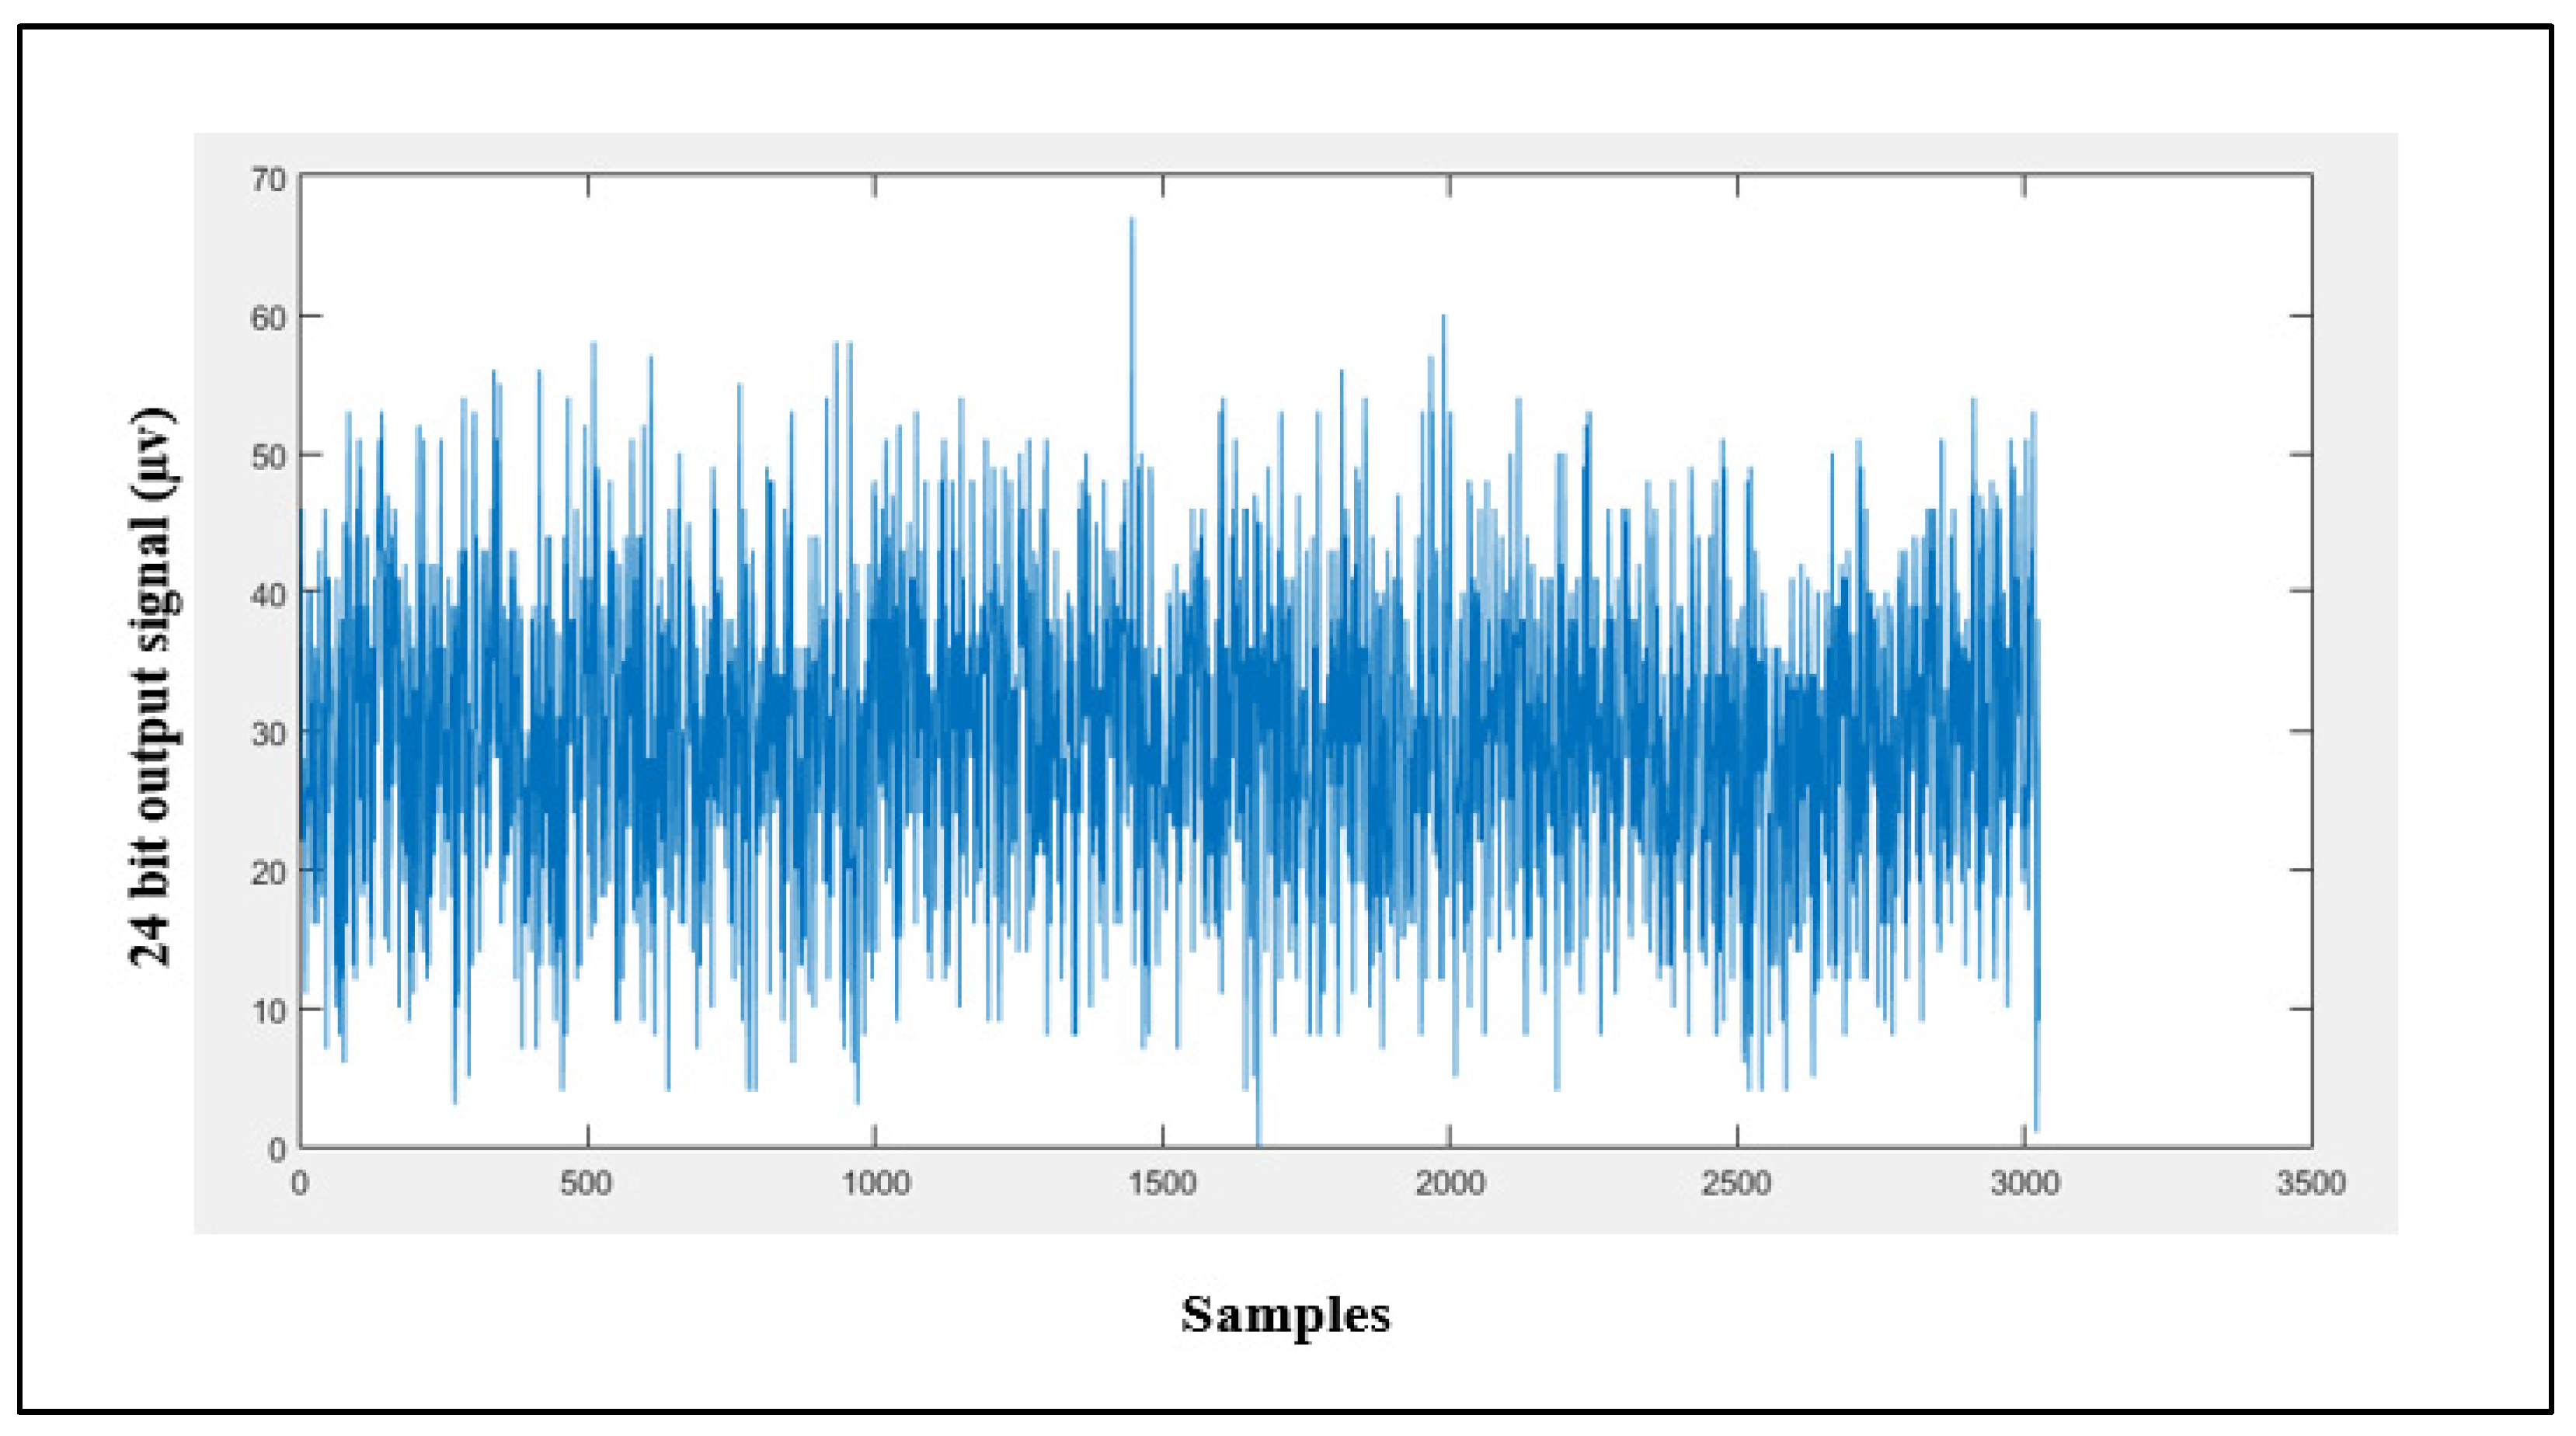
4.1.5. Input-Referred Noise
4.2. EEG Signal Recording Using EEG/fNIRS System
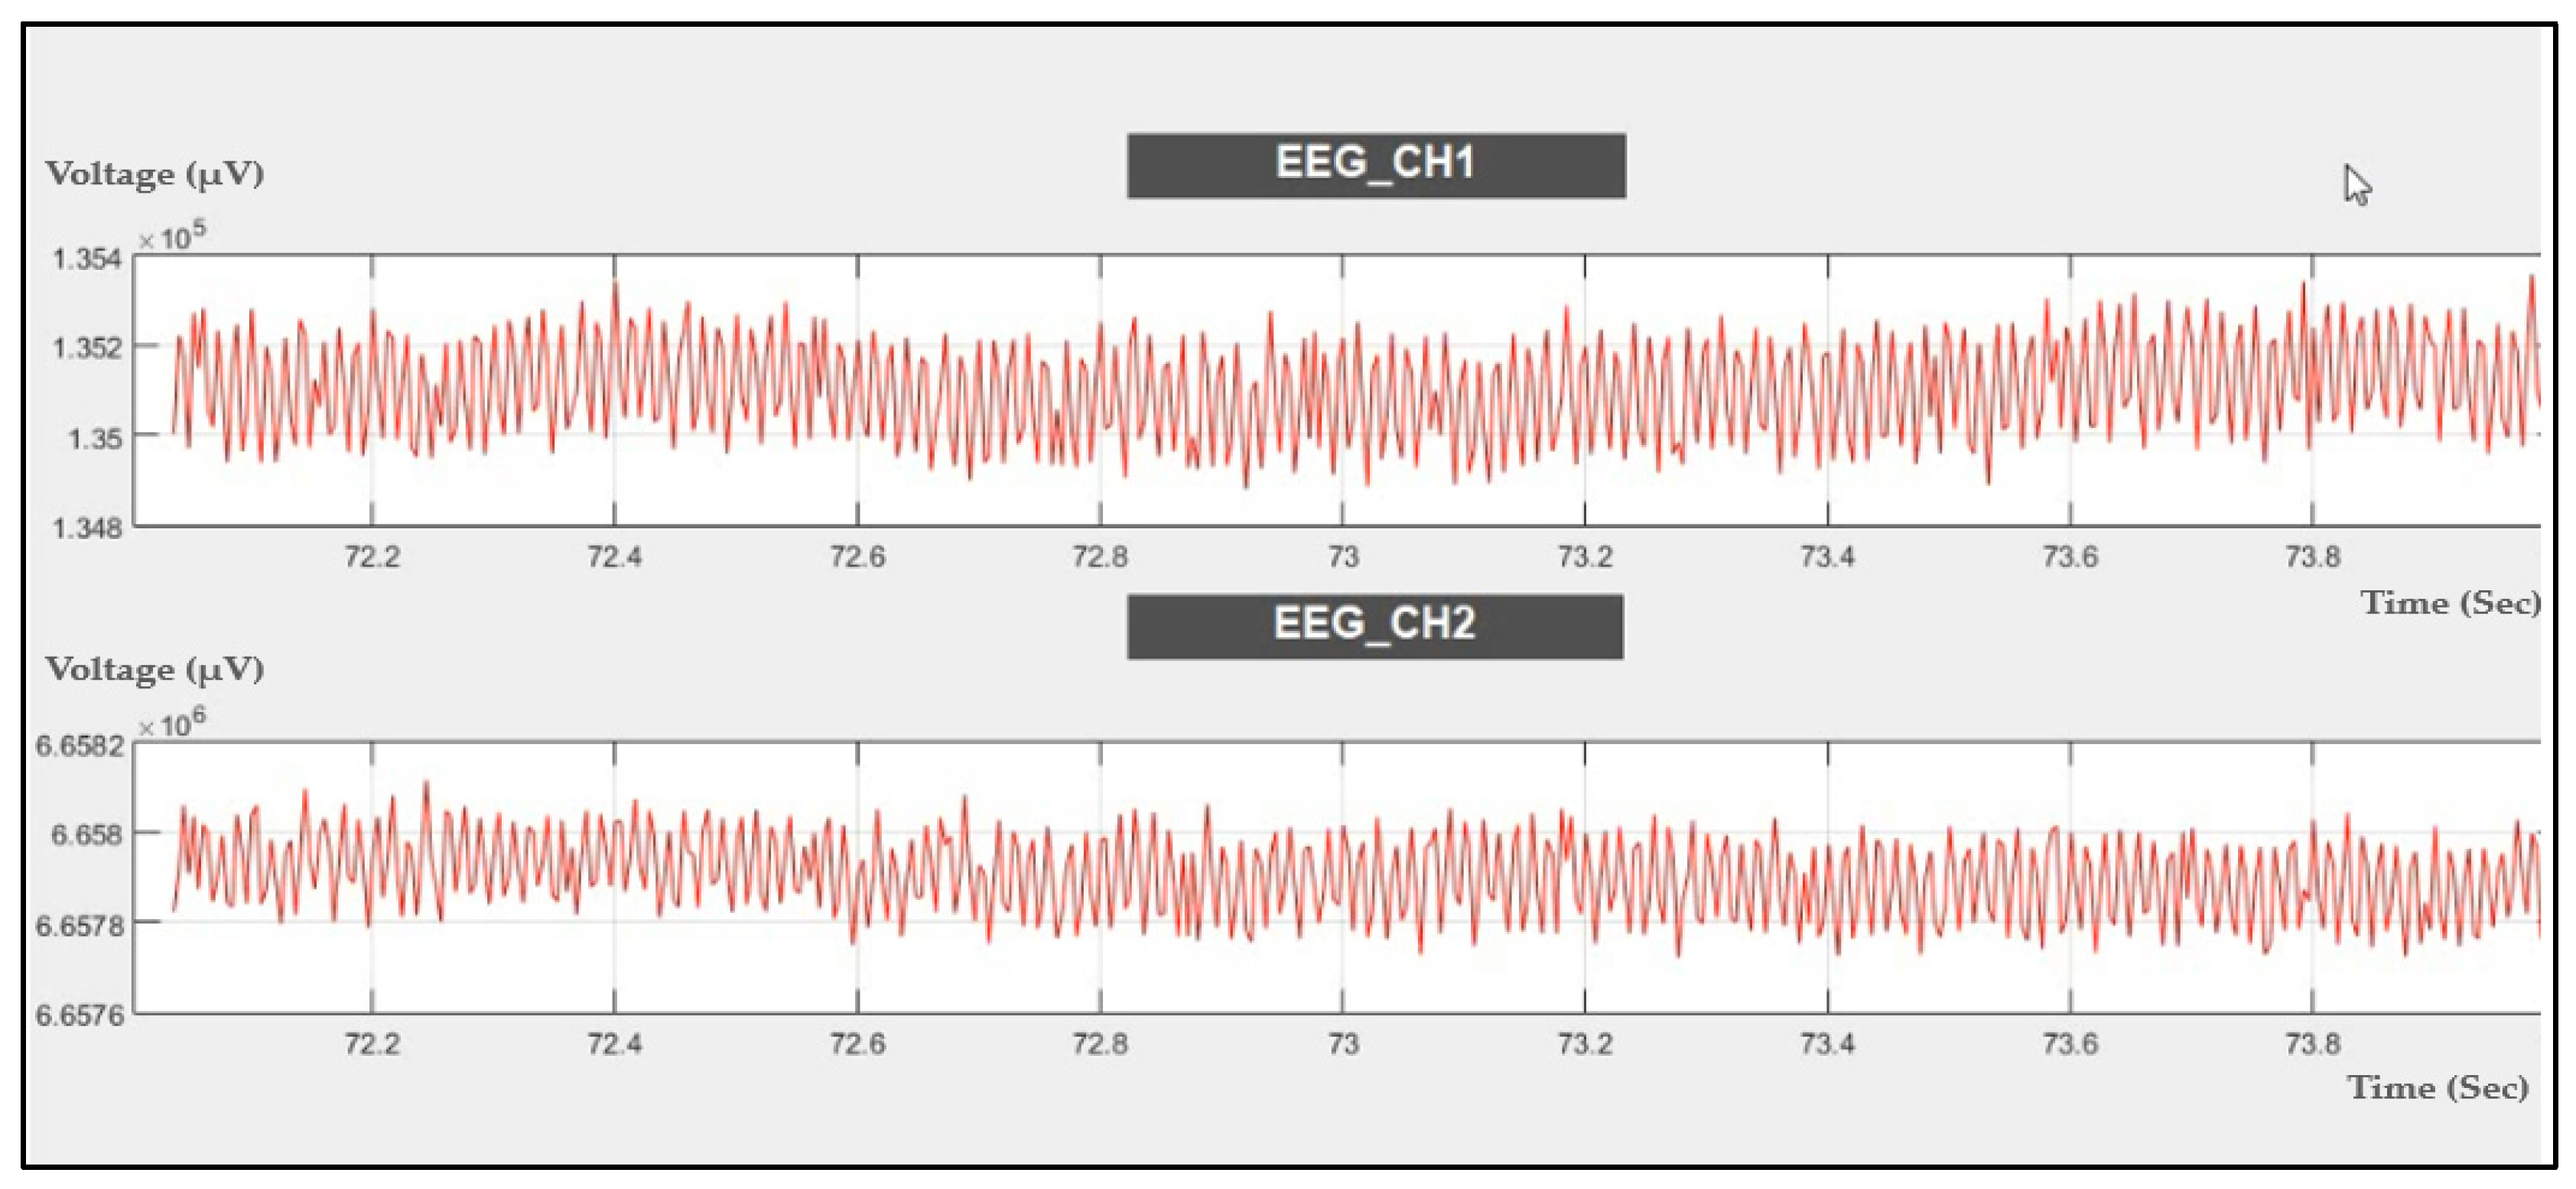
4.2.1. EEG Signal Recording
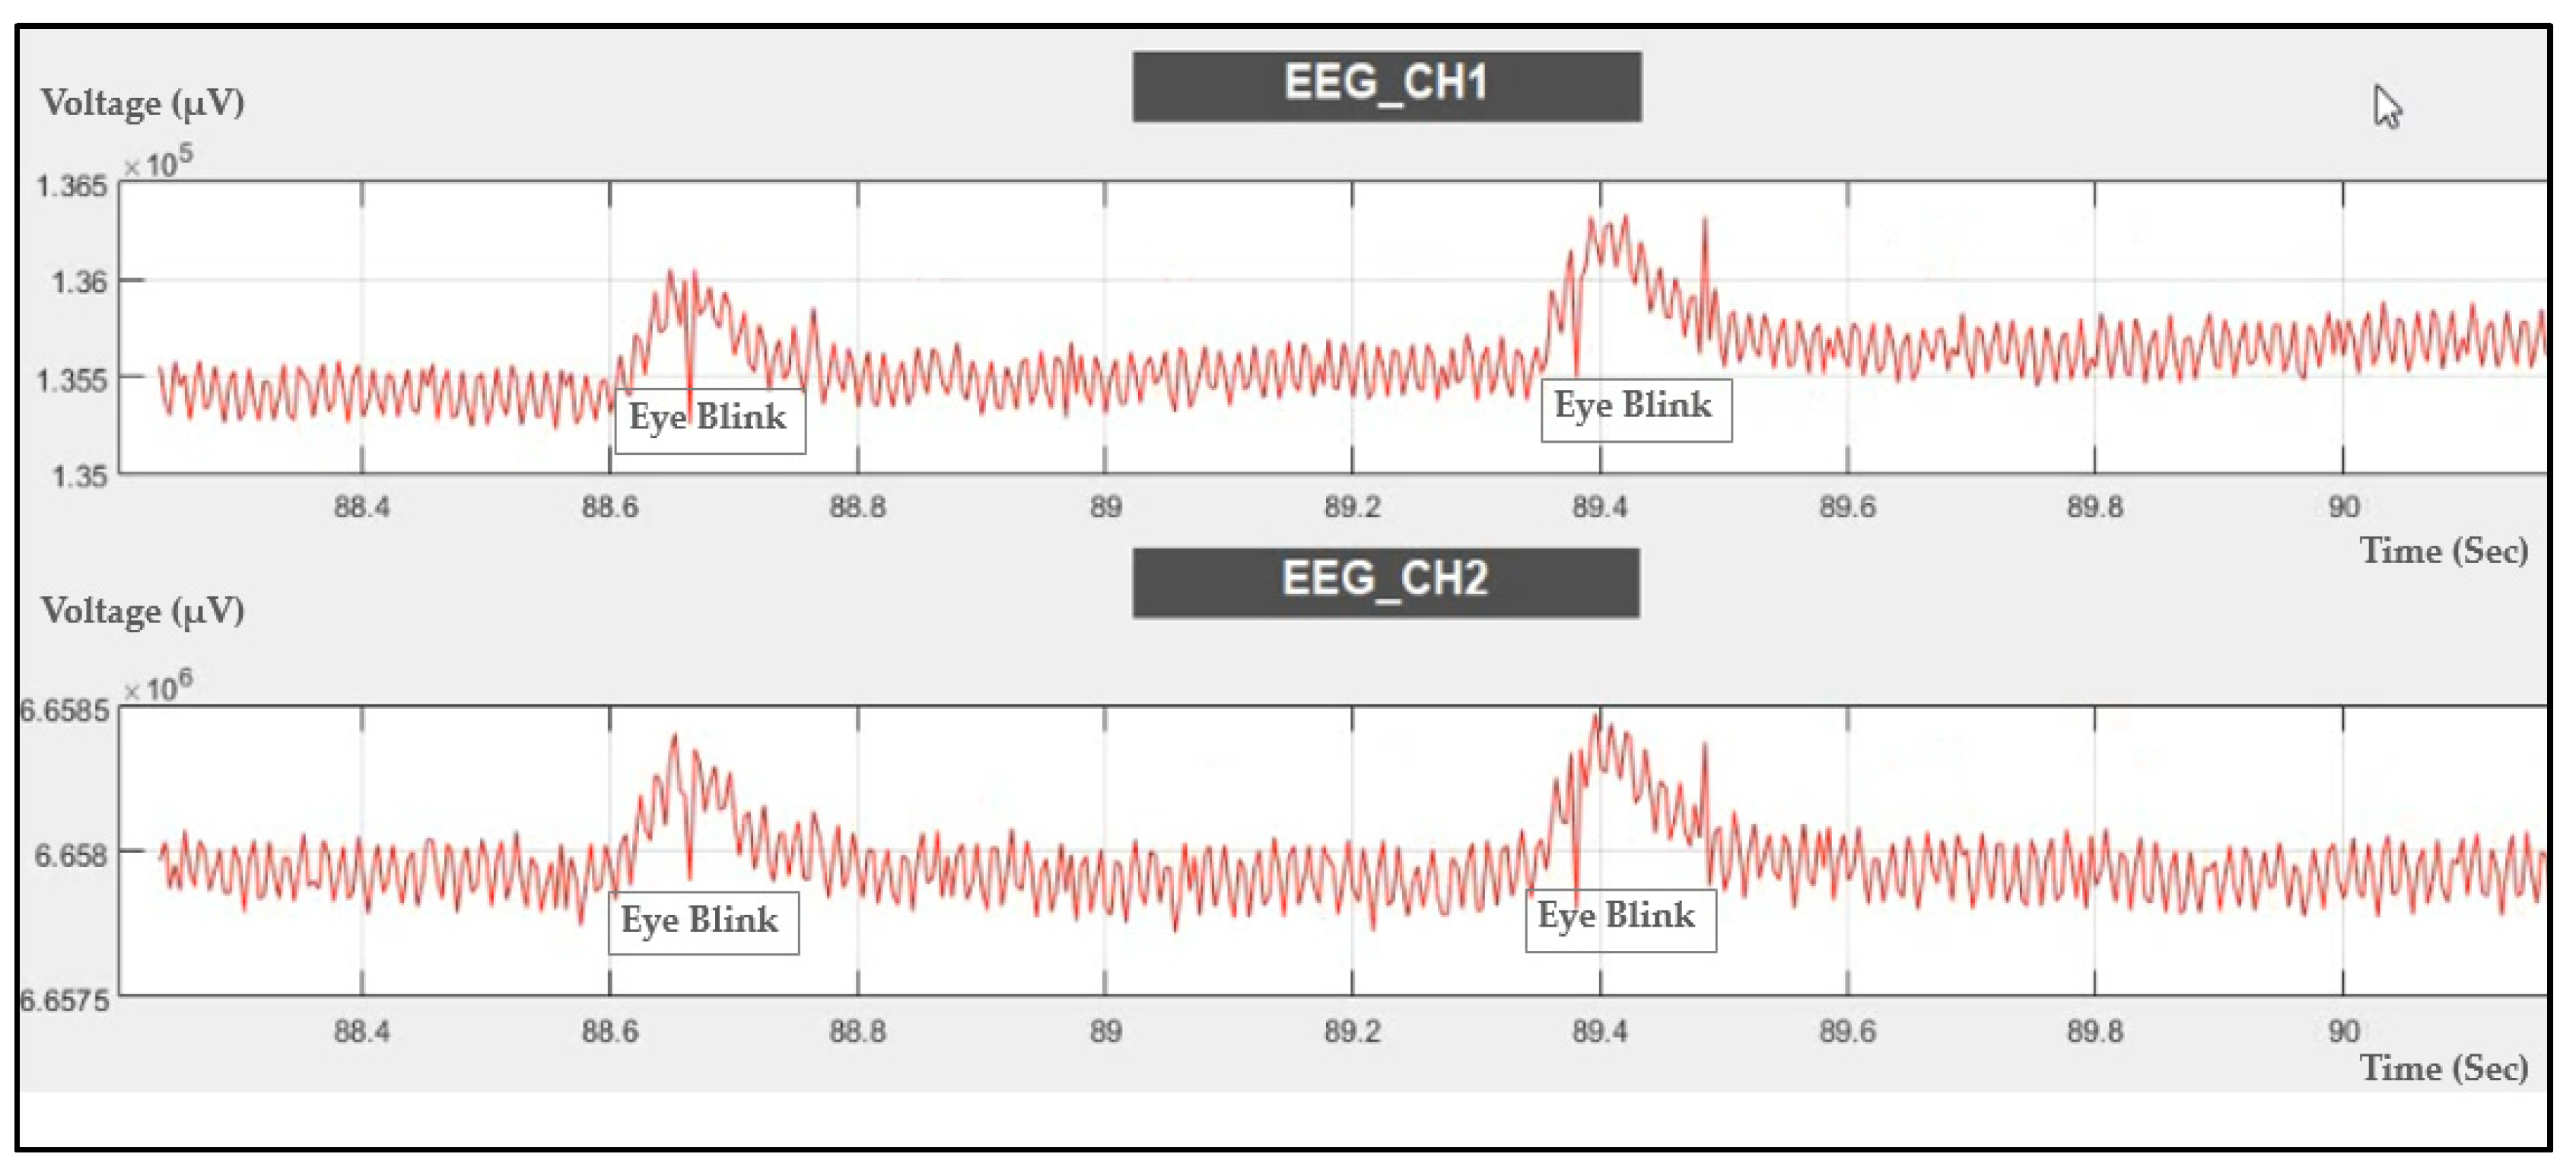
4.2.2. EEG Signal Recording during Eye Blink
4.2.3. EEG Signal Recording during Eyes Opened and Closed
4.3. FNIRS Signal Using EEG/fNIRS System
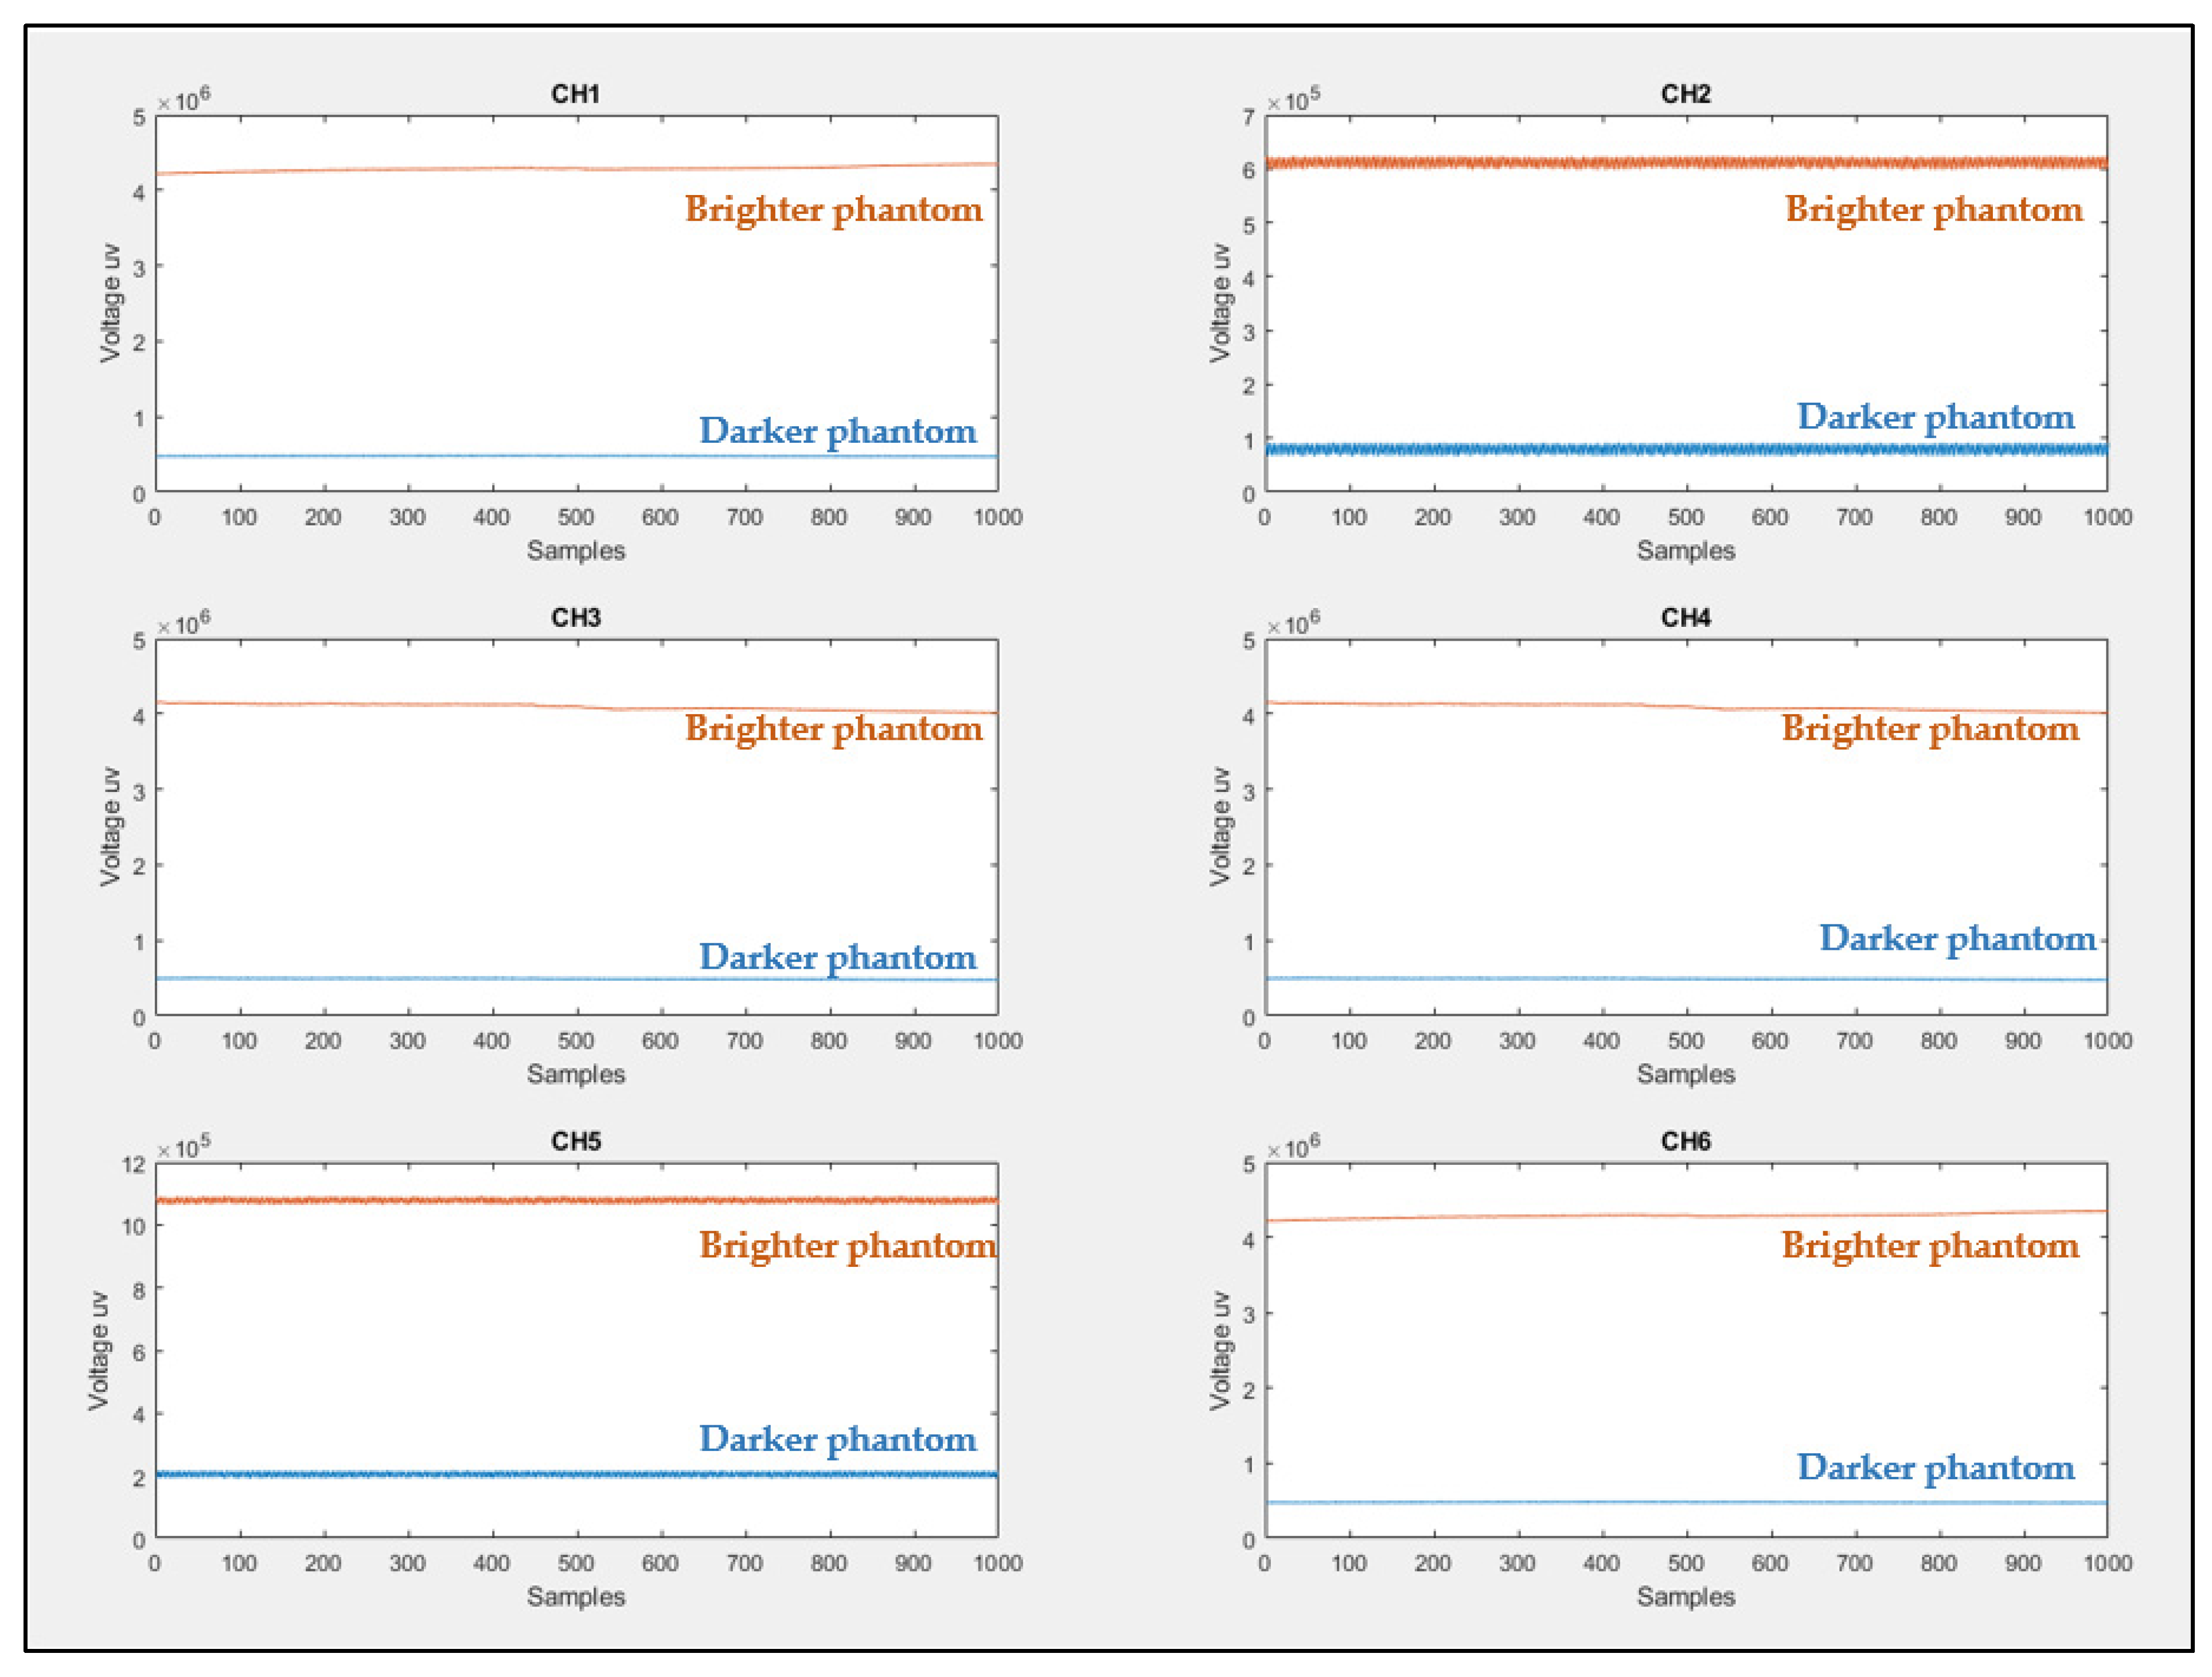
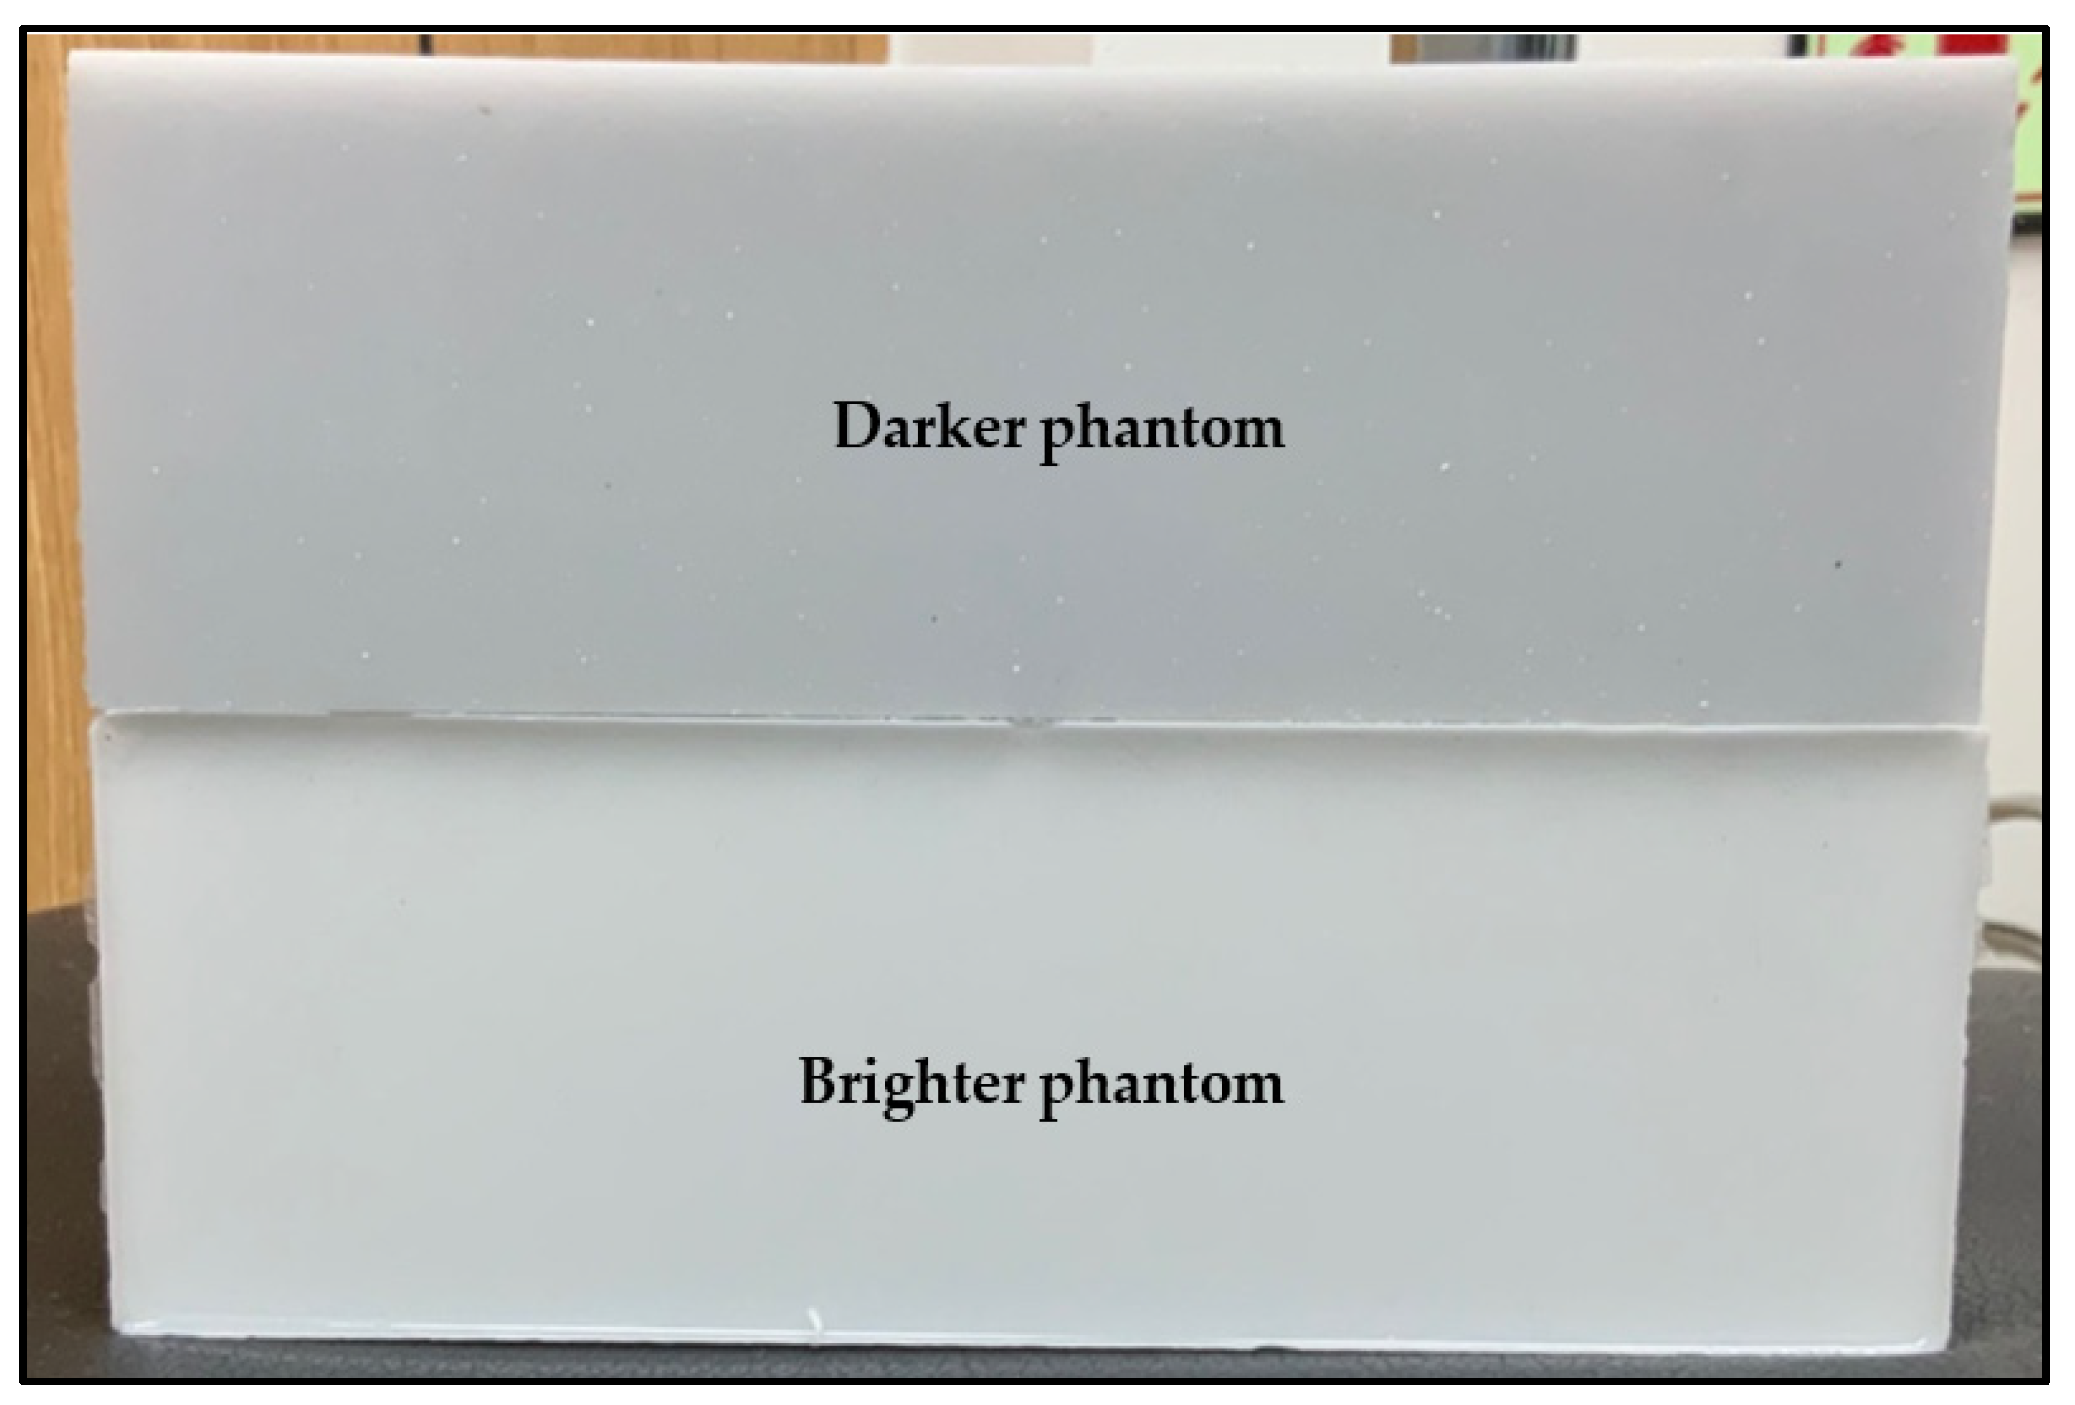
4.3.1. fNIRS Recording Using Solid Phantoms
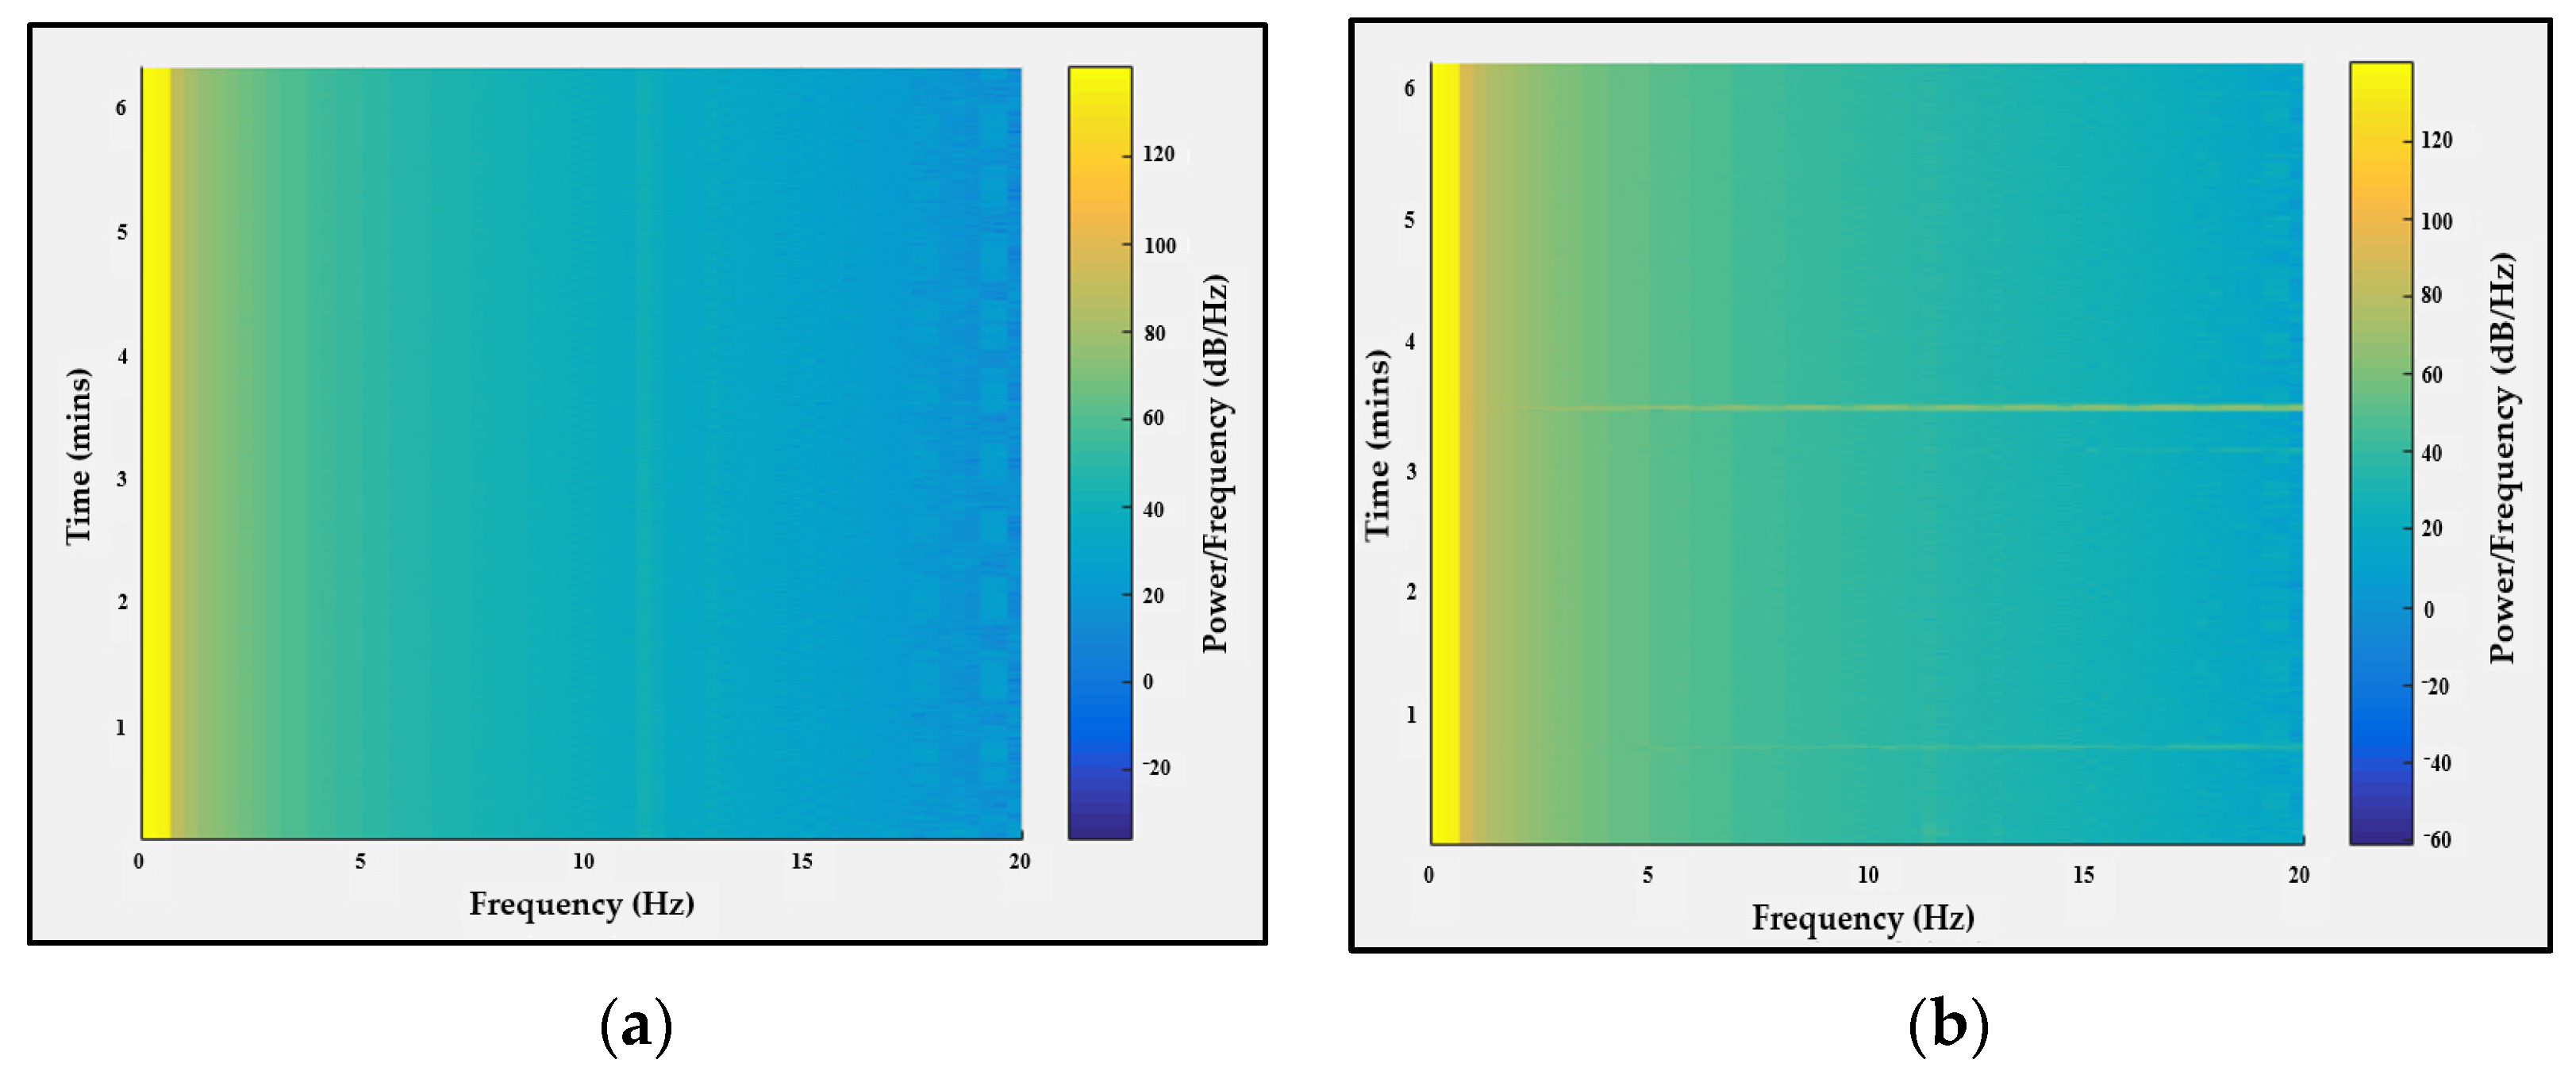
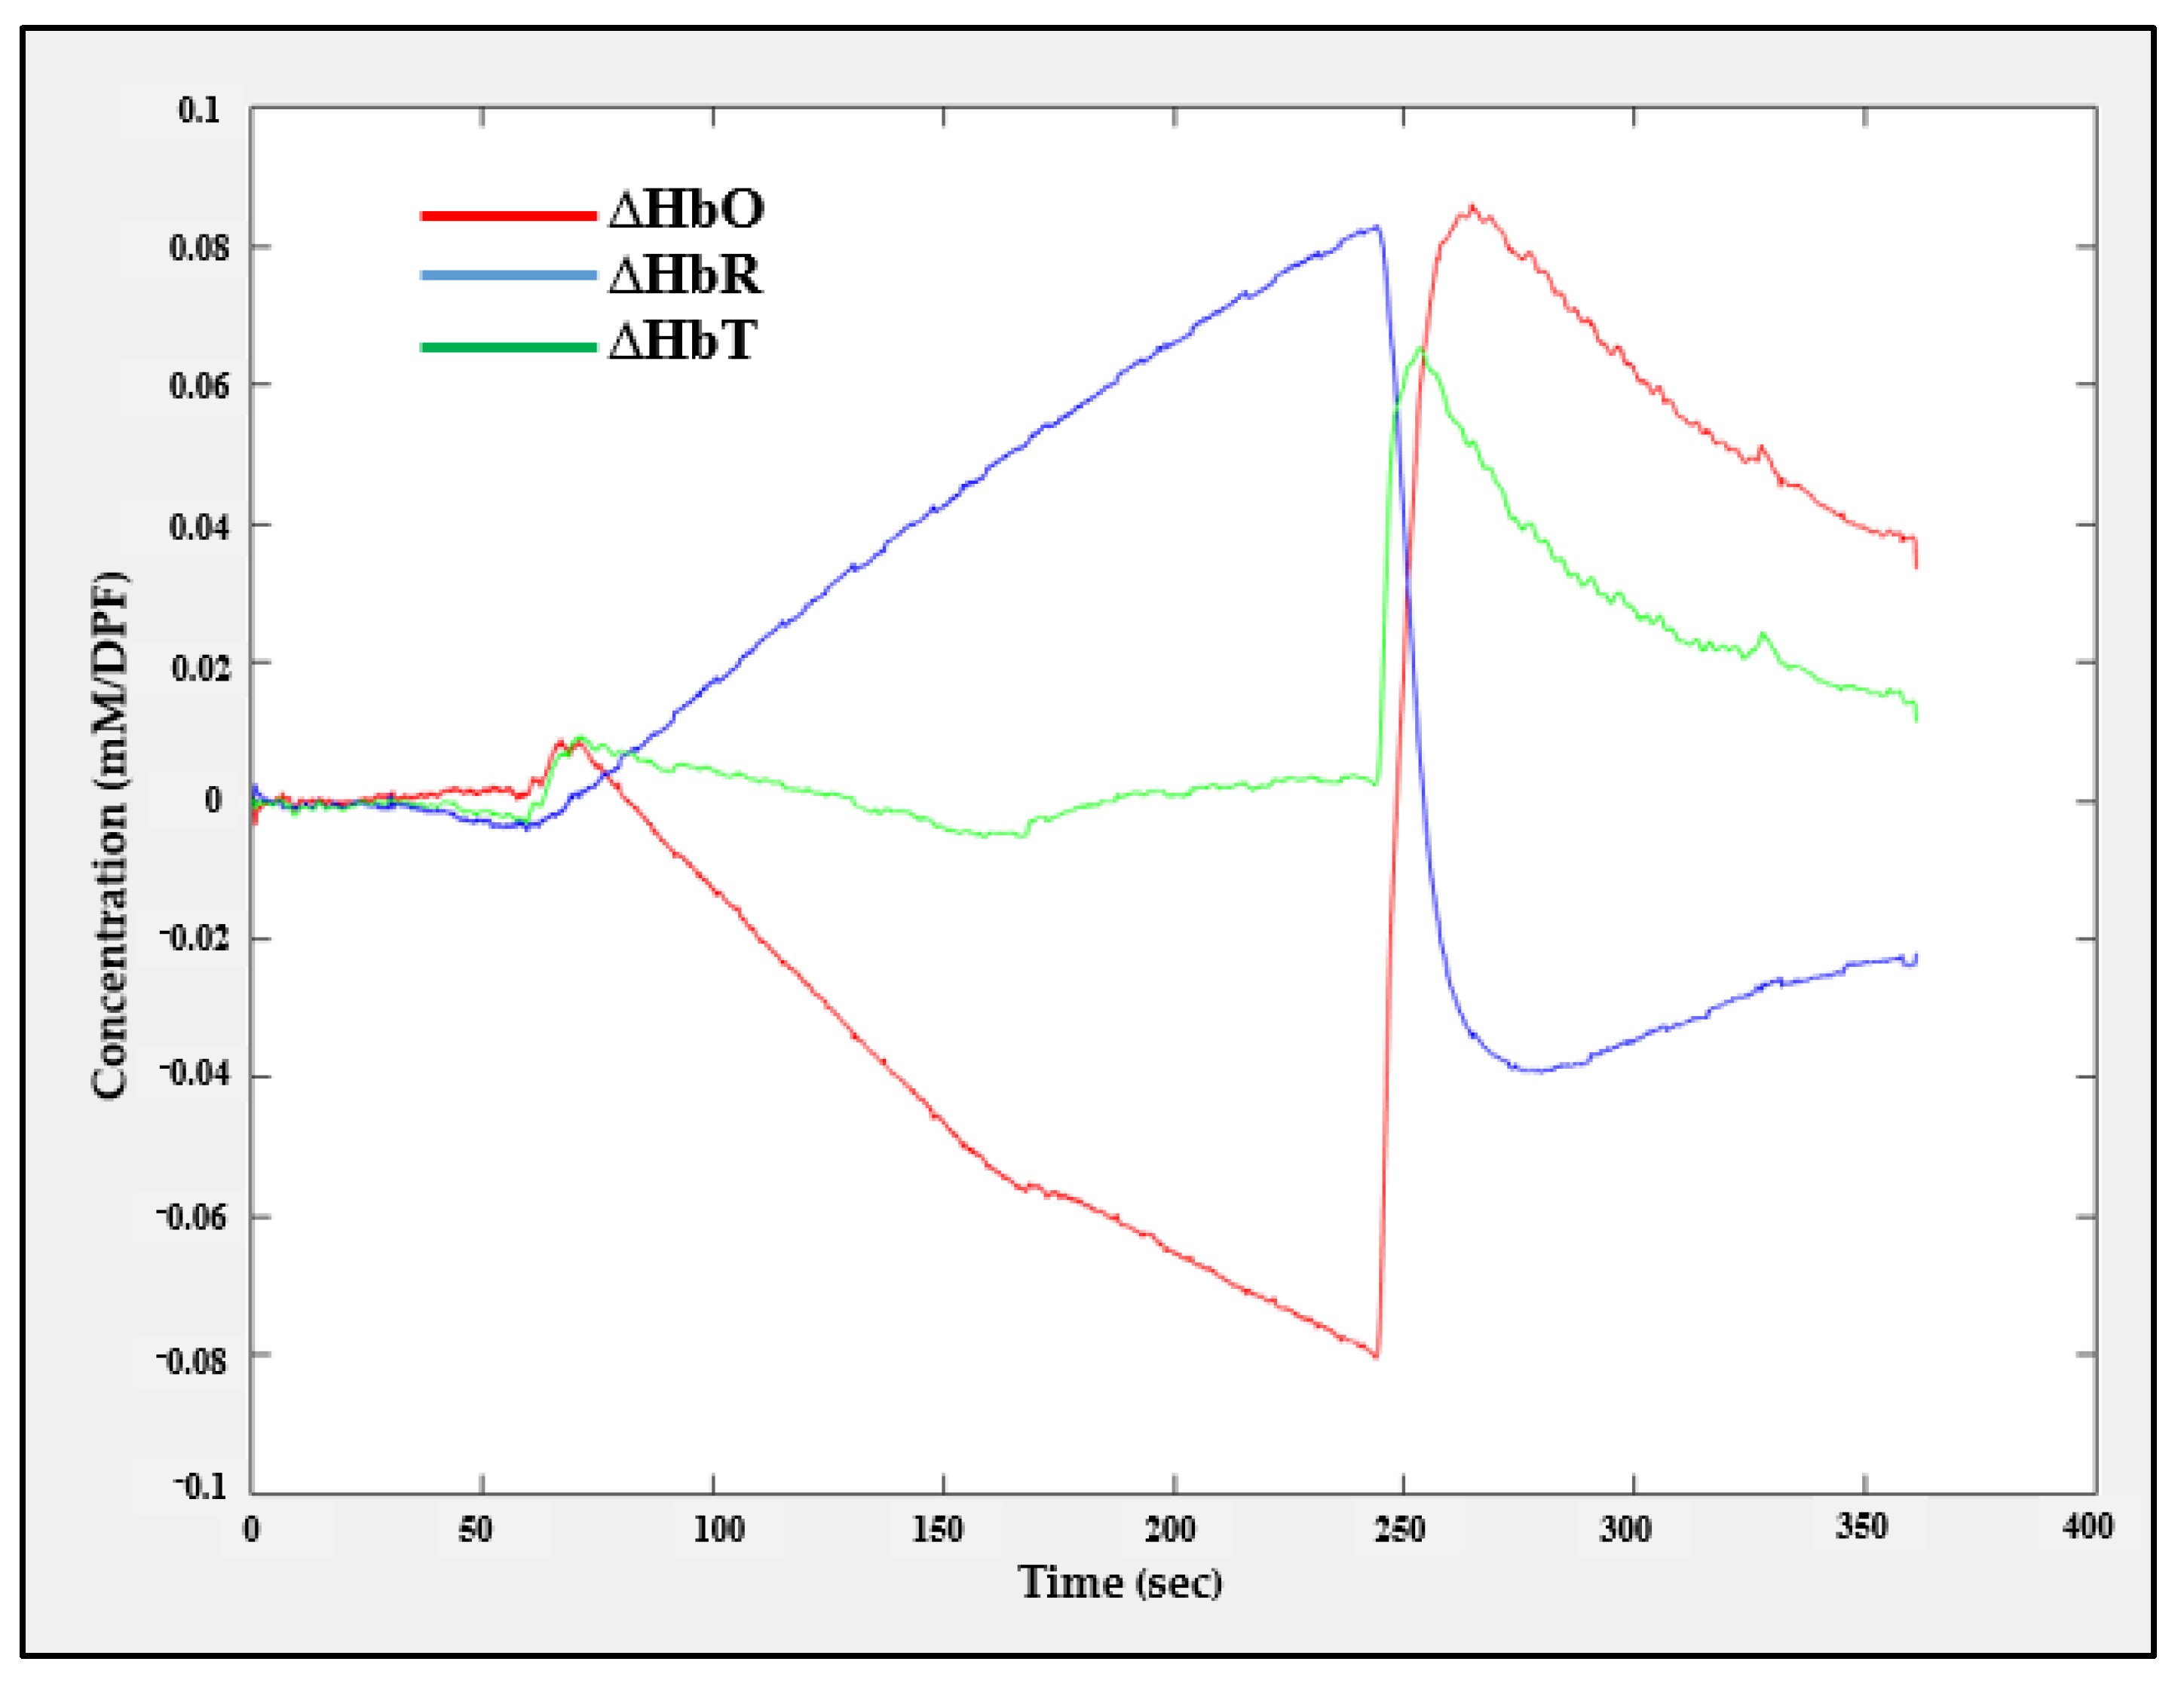
4.3.2. fNIRS Recording during Arterial Occlusion Experiment
4.4. Dark Noise and Dynamic Range of fNIRS Measurements
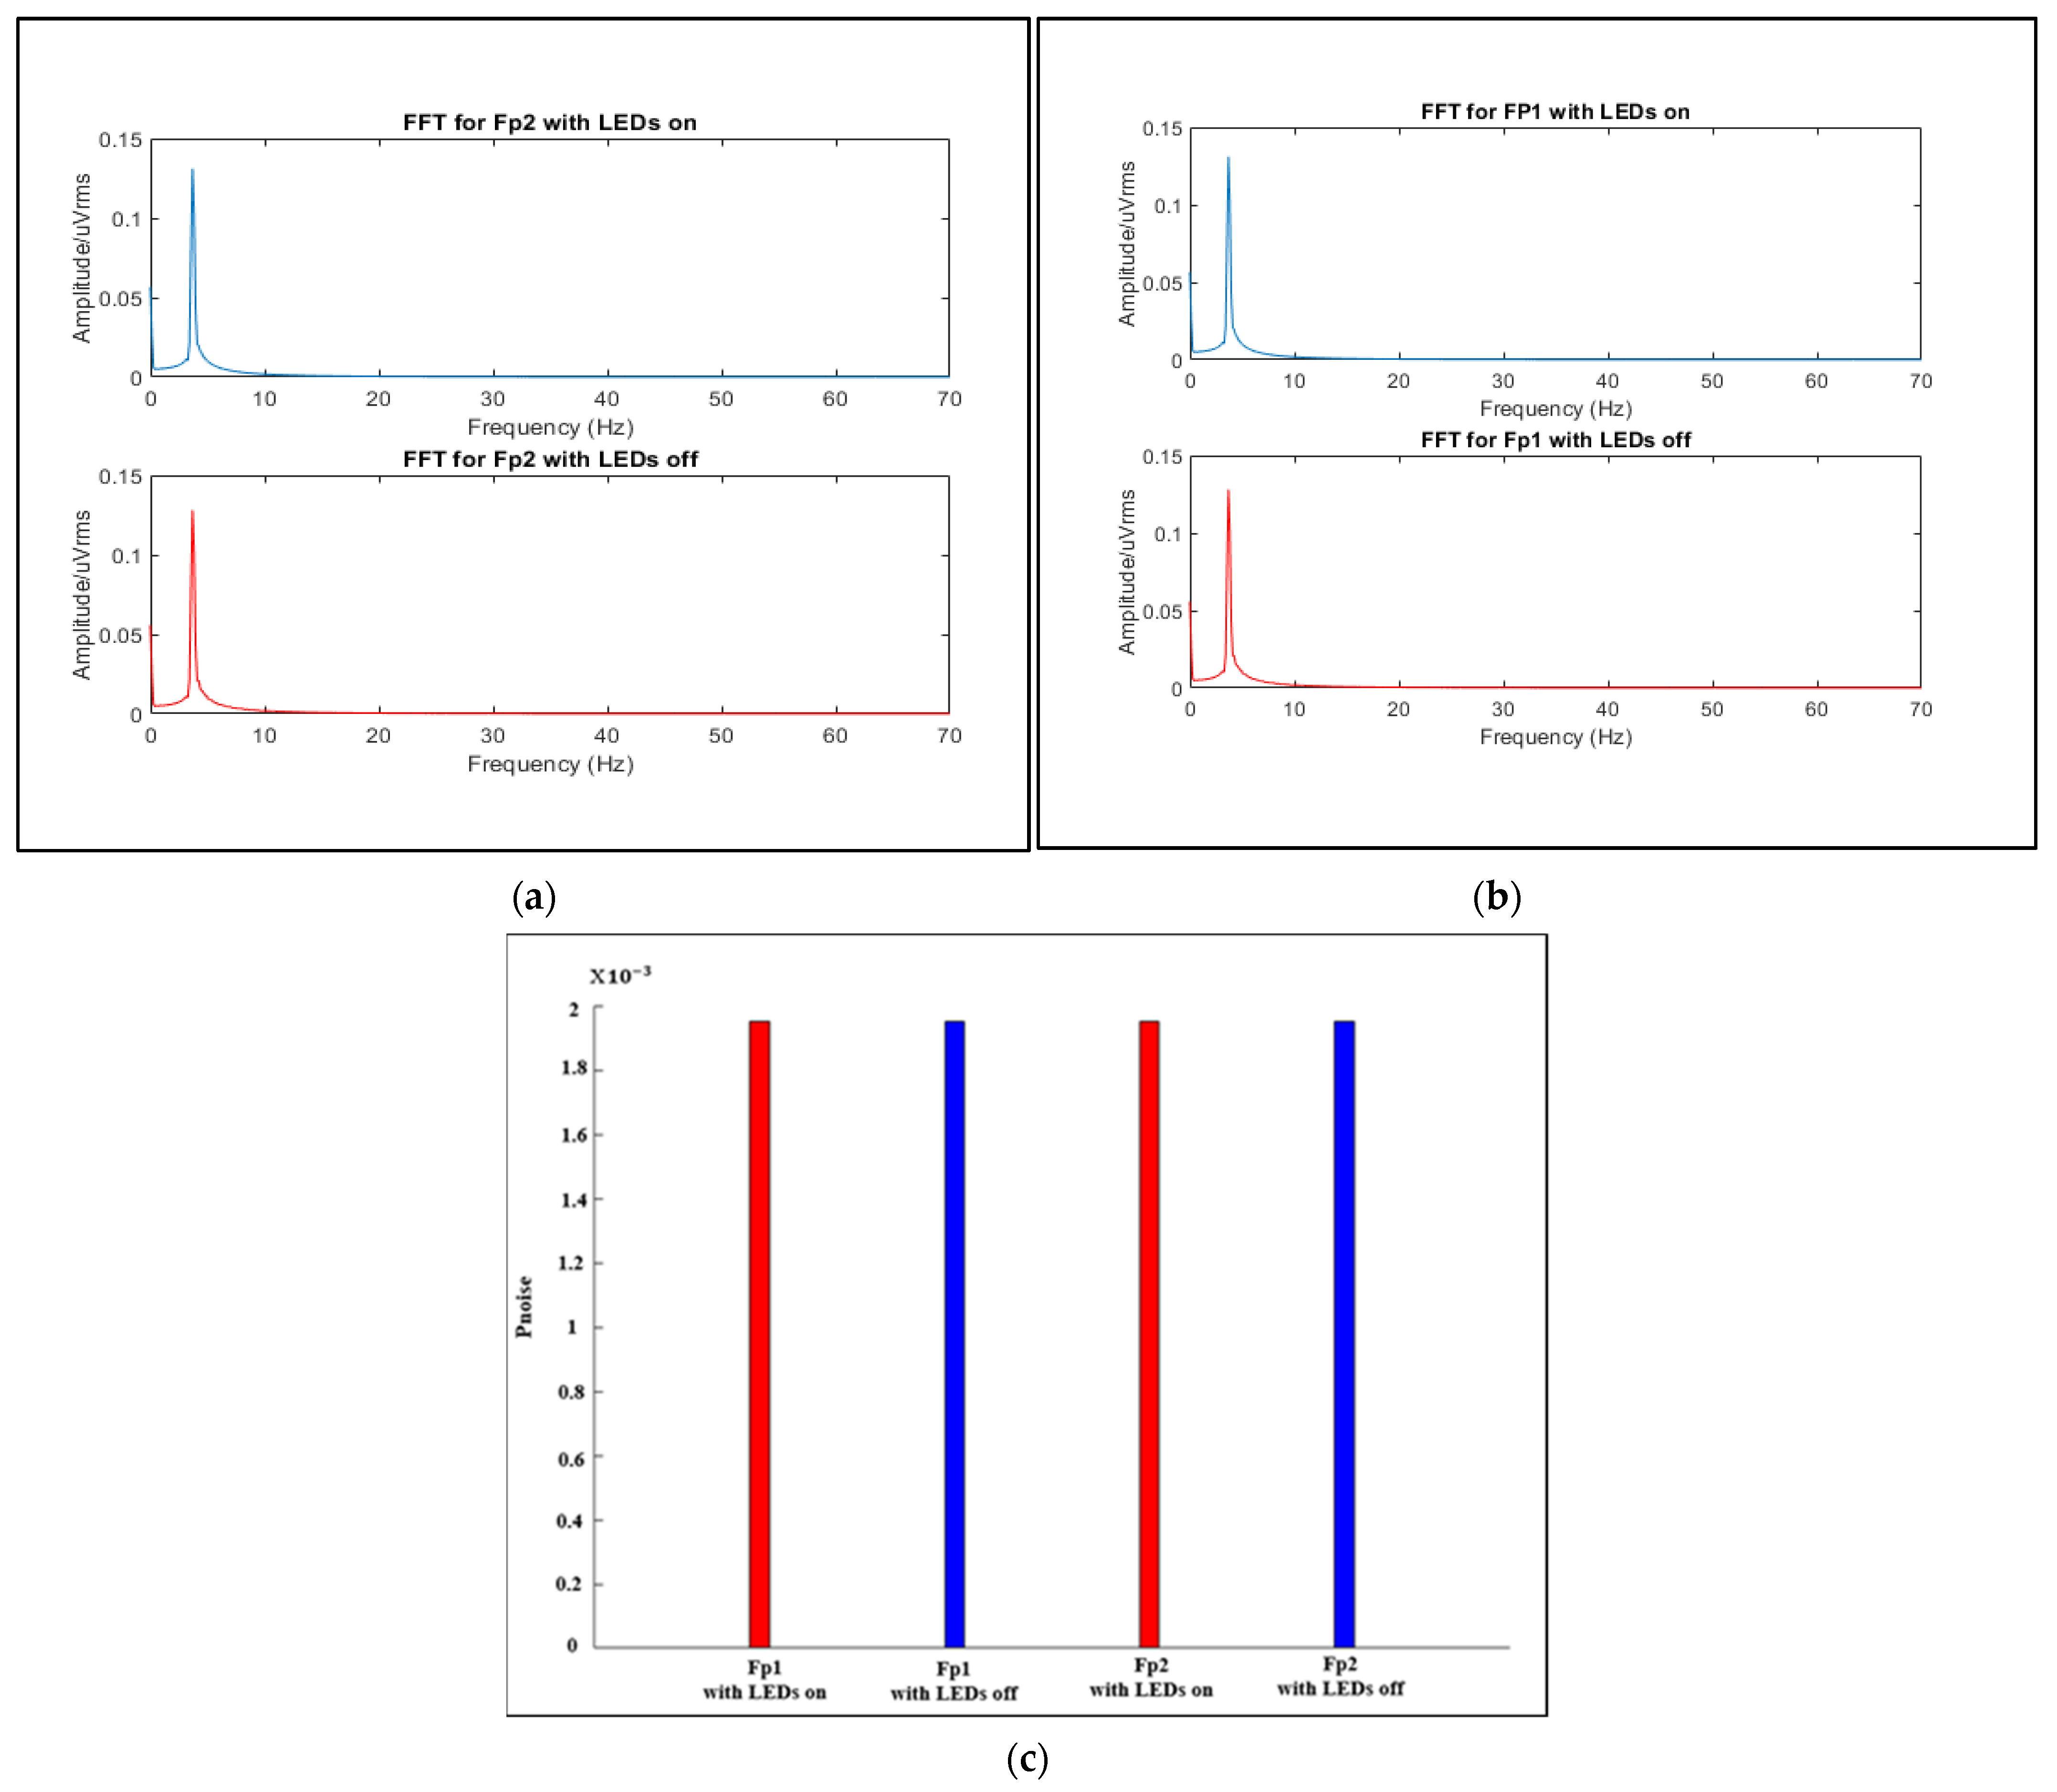
4.5. Electrical Crosstalk between EEG and fNIRS Signals
4.6. Mechanical Robustness of the Flexible EEG/fNIRS Probe
5. Discussion
6. Conclusions
Author Contributions
Funding
Institutional Review Board Statement
Informed Consent Statement
Data Availability Statement
Conflicts of Interest
References
- He, W.; Goodkind, D.; Kowal, P.R. An Aging World: 2015; United States Census Bureau: Washington, DC, USA, 2016.
- Kyu, H.H.; Abate, D.; Hassen Abate, K.; Abay, M.S.; Abbafati, C.; Abbasi, N.; Abbastabar, H.; Abd-Allah, F.; Abdela, J.; Abdelalim, A.; et al. Global, regional, and national disability-adjusted life-years (DALYs) for 359 diseases and injuries and healthy life expectancy (HALE) for 195 countries and territories, 1990–2017: A systematic analysis for the Global Burden of Disease Study 2017. Lancet 2018, 392, 1859–1922. [Google Scholar] [CrossRef] [Green Version]
- Chang, A.Y.; Skirbekk, V.F.; Tyrovolas, S.; Kassebaum, N.J.; Dieleman, J.L. Measuring population ageing: An analysis of the Global Burden of Disease Study 2017. Lancet Public Health 2019, 4, e159–e167. [Google Scholar] [CrossRef] [Green Version]
- Kehler, D.S. Age-related disease burden as a measure of population ageing. Lancet Public Health 2019, 4, e123–e124. [Google Scholar] [CrossRef] [Green Version]
- Uchitel, J.; Vidal-Rosas, E.E.; Cooper, R.J.; Zhao, H. Wearable, Integrated EEG–fNIRS Technologies: A Review. Sensors 2021, 21, 6106. [Google Scholar] [CrossRef] [PubMed]
- Abtahi, M.; Borgheai, S.B.; Jafari, R.; Constant, N.; Diouf, R.; Shahriari, Y.; Mankodiya, K. Merging fNIRS-EEG Brain Monitoring and Body Motion Capture to Distinguish Parkinsons Disease. IEEE Trans. Neural Syst. Rehabil. Eng. 2020, 28, 1246–1253. [Google Scholar] [CrossRef] [PubMed]
- Nguyen, T.; Kim, M.; Gwak, J.; Lee, J.J.; Choi, K.Y.; Lee, K.H.; Kim, J.G. Investigation of brain functional connectivity in patients with mild cognitive impairment: A functional near-infrared spectroscopy (fNIRS) study. J. Biophotonics 2019, 12, e201800298. [Google Scholar] [CrossRef]
- Bonilauri, A.; Sangiuliano Intra, F.; Pugnetti, L.; Baselli, G.; Baglio, F. A Systematic Review of Cerebral Functional Near-Infrared Spectroscopy in Chronic Neurological Diseases-Actual Applications and Future Perspectives. Diagnostics 2020, 10, 581. [Google Scholar] [CrossRef]
- Safaie, J.; Grebe, R.; Moghaddam, H.A.; Wallois, F. Toward a fully integrated wireless wearable EEG-NIRS bimodal acquisition system. J. Neural Eng. 2013, 10, 056001. [Google Scholar] [CrossRef] [PubMed]
- Sawan, M.; Salam, T.M.; Le Lan, J.; Kassab, A.; Gelinas, S.; Vannasing, P.; Lesage, F.; Lassonde, M.; Nguyen, K.D. Wireless recording systems: From noninvasive EEG-NIRS to invasive EEG devices. IEEE Trans. Biomed. Circuits Syst. 2013, 7, 186–195. [Google Scholar] [CrossRef]
- Kassab, A.; Le Lan, J.; Tremblay, J.; Vannasing, P.; Dehbozorgi, M.; Pouliot, P.; Gallagher, A.; Lesage, F.; Sawan, M.; Nguyen, K.D. Multichannel wearable fNIRS-EEG system for long-term clinical monitoring. Hum. Brain Mapp. 2018, 39, 7–23. [Google Scholar] [CrossRef] [PubMed] [Green Version]
- Lee, S.; Shin, Y.; Kumar, A.; Kim, M.; Lee, H.N. Dry Electrode-Based Fully Isolated EEG/fNIRS Hybrid Brain-Monitoring System. IEEE Trans. Biomed. Eng. 2019, 66, 1055–1068. [Google Scholar] [CrossRef]
- Chua, E.; Fang, W.C.; Chen, C.K.; Fu, C.C.; Tseng, S.Y.; Kang, S.; Hsieh, Z.H. A Highly-Integrated Biomedical Multiprocessor System for Portable Brain-Heart Monitoring. In Proceedings of the 2011 IEEE International Symposium of Circuits and Systems (ISCAS), Rio de Janeiro, Brazil, 15–18 May 2011. [Google Scholar]
- Ha, U.; Lee, J.; Kim, M.; Roh, T.; Choi, S.; Yoo, H.J. An EEG-NIRS Multimodal SoC for Accurate Anesthesia Depth Monitoring. IEEE J. Solid-State Circuits 2018, 53, 1830–1843. [Google Scholar] [CrossRef]
- Xu, J.; Konijnenburg, M.; Song, S.; Ha, H.; Van Wegberg, R.; Mazzillo, M.; Fallica, G.; Van Hoof, C.; De Raedt, W.; Van Helleputte, N. A 665 μW Silicon Photomultiplier-Based NIRS/EEG/EIT Monitoring ASIC for Wearable Functional Brain Imaging. IEEE Trans. Biomed. Circuits Syst. 2018, 12, 1267–1277. [Google Scholar] [CrossRef] [PubMed]
- Soundarapandian, K.; Berarducci, M. Analog Front-End Design for ECG Systems Using Delta-Sigma ADCs; Texas Instruments Incorporated: Dallas, TX, USA, 2010. [Google Scholar]
- ADS, A. Low-Power, 8-Channel, 24-Bit Analog Front-End for Biopotential Measurements; Texas Instruments Incorporated: Dallas, TX, USA, 2015. [Google Scholar]
- Chiarelli, A.M.; Perpetuini, D.; Croce, P.; Greco, G.; Mistretta, L.; Rizzo, R.; Vincigurrea, V.; Francesko Romeo, M.; Zappasodi, F.; Merla, A.; et al. Fiberless, Multi-Channel fNIRS-EEG System Based on Silicon Photomultipliers: Towards Sensitive and Ecological Mapping of Brain Activity and Neurovascular Coupling. Sensors 2020, 20, 2831. [Google Scholar] [CrossRef]
- Merletti, R.; Botter, A.; Troiano, A.; Merlo, E.; Minetto, M.A. Technology and instrumentation for detection and conditioning of the surface electromyographic signal: State of the art. Clin. Biomech. 2009, 24, 122–134. [Google Scholar] [CrossRef] [PubMed]
- Spinelli, E.M.; Martinez, N.H.; Mayosky, M.A. A transconductance driven-right-leg circuit. IEEE Trans. Biomed. Eng. 1999, 46, 1466–1470. [Google Scholar] [CrossRef] [PubMed]
- Uktveris, T.; Jusas, V. Development of a Modular Board for EEG Signal Acquisition. Sensors 2018, 18, 2140. [Google Scholar] [CrossRef] [Green Version]
- Funane, T.; Atsumori, H.; Katura, T.; Obata, A.N.; Sato, H.; Tanikawa, Y.; Okada, E.; Kiguchi, M. Quantitative evaluation of deep and shallow tissue layers’ contribution to fNIRS signal using multi-distance optodes and independent component analysis. NeuroImage 2014, 85, 150–165. [Google Scholar] [CrossRef] [PubMed]
- Gagnon, L.; Cooper, R.J.; Yücel, M.A.; Perdue, K.L.; Greve, D.N.; Boas, D.A. Short separation channel location impacts the performance of short channel regression in NIRS. NeuroImage 2012, 59, 2518–2528. [Google Scholar] [CrossRef] [PubMed] [Green Version]
- Meryem, A.Y.; Selb, J.; Aasted, C.M.; Petkov, M.P.; Becerra, L.; Borsook, D.; Boas, D.A. Short separation regression improves statistical significance and better localizes the hemodynamic response obtained by near-infrared spectroscopy for tasks with differing autonomic responses. Neurophotonics 2015, 2, 1–10. [Google Scholar]
- Kim, J.G.; Liu, H. Variation of haemoglobin extinction coefficients can cause errors in the determination of haemoglobin concentration measured by near-infrared spectroscopy. Phys. Med. Biol. 2007, 52, 6295–6322. [Google Scholar] [CrossRef] [PubMed]
- Kocsis, L.; Herman, P.; Eke, A. The modified Beer-Lambert law revisited. Phys. Med. Biol. 2006, 51, N91–N98. [Google Scholar] [CrossRef] [PubMed]
- Nemoto, E.M.; Harrison, E.M.; Pias, S.C.; Bragin, D.E.; Harrison, D.K.; LaManna, J.C. Oxygen Transport to Tissue XLII; Springer: Amsterdan, The Netherlands, 2021. [Google Scholar]
- von Lühmann, A.; Wabnitz, H.; Sander, T.; Müller, K.R. M3BA: A Mobile, Modular, Multimodal Biosignal Acquisition Architecture for Miniaturized EEG-NIRS-Based Hybrid BCI and Monitoring. IEEE Trans. Biomed. Eng. 2017, 64, 1199–1210. [Google Scholar] [CrossRef] [PubMed]
- von Lühmann, A.; Müller, K.-R. Why Build an Integrated EEG-NIRS? About the Advantages of Hybrid Bio-Acquisition Hardware. In Proceedings of the 39th Annual International Conference of the IEEE Engineering in Medicine and Biology Society (EMBC), Jeju Island, Korea, 11–15 July 2017; pp. 4475–4478. [Google Scholar]
- Khan, Y.; Garg, M.; Gui, Q.; Schadt, M.; Gaikwad, A.; Han, D.; Yamamoto, N.A.D.; Hart, P.; Welte, R.; Wilson, W.; et al. Flexible Hybrid Electronics: Direct Interfacing of Soft and Hard Electronics for Wearable Health Monitoring. Adv. Funct. Mater. 2016, 26, 8764–8775. [Google Scholar] [CrossRef]
- Lewis, R.S.; Weekes, N.Y.; Wang, T.H. The effect of a naturalistic stressor on frontal EEG asymmetry, stress, and health. Biol. Psychol. 2007, 75, 239–247. [Google Scholar] [CrossRef]
- Sulaiman, N.; Taib, M.N.; Aris, S.A.M.; Hamid, N.H.A.; Lias, S.; Murat, Z.H. Stress Features Identification from EEG Signals Using EEG Asymmetry & Spectral Centroids Techniques. In Proceedings of the IEEE EMBS Conference on Biomedical Engineering and Sciences (IECBES), Kuala Lumpur, Malaysia, 30 November–2 December 2010. [Google Scholar]
- Dharmawan, Z.; Rothkrantz, L. Analysis of Computer Game Player Stress Level Using EEG Data. In Proceedings of the 11th International Conference on Computer Games: AI, Animation, Mobile, Educational and Serious Games, La Rochelle, France, 21–23 November 2007. [Google Scholar]
- Wearable Sensing. DSI-Hybrid-EEG+fNIR. 2018. Available online: https://wearablesensing.com/products/dsi-hybrid-eegfnir/ (accessed on 21 October 2021).
- NIRx Medical Technologies. NIRSPORT2. Available online: https://nirx.net/nirsport (accessed on 21 October 2021).
- Artinis Medical Systems. fNIRS/EEG Artinis Package. 2021. Available online: https://www.artinis.com/nirs-eeg-package/?gclid=CjwKCAjwh5qLBhALEiwAioods0IcljvJvXiRG9qUICStiwDs1FdYmmAoA3NKgn4ht7VQXkFTX9I4hxoC6w0QAvD_BwE (accessed on 21 October 2021).


| No. | Item | Source | Unit Price (KRW) | Quantity | Total Price (KRW) |
|---|---|---|---|---|---|
| 1 | ADS1298IPAG | Mouser | 33,500 | 1 | 33,500 |
| 2 | TEENSY3.2 | Mouser | 32,000 | 1 | 32,000 |
| 3 | BQ24380DSGT | Mouser | 1200 | 1 | 1200 |
| 4 | MCP73811/2 | Mouser | 13,000 | 1 | 13,000 |
| 5 | TPS72301DBV T | Mouser | 2600 | 1 | 2600 |
| 6 | BQ29700DSET | Mouser | 7400 | 1 | 7400 |
| 7 | TPS73201DBV T | Mouser | 7400 | 1 | 7400 |
| 8 | LM2664M//NOPB | Mouser | 1500 | 2 | 1500 |
| 9 | Li-Polymer battery | Alibaba | 2200 | 1 | 2200 |
| 10 | 2N3904 | Mouser | 95 | 4 | 380 |
| 11 | Resistors, capacitors, etc. | Mouser | 50,000 | ||
| Total (KRW) | 150,895 | 151,180 |
| No. | Ref [9] | Ref [10] | Ref [11] | Ref [12] | Ref [13] | Ref [14] | Ref [15] | Current Study | |
|---|---|---|---|---|---|---|---|---|---|
| 1 | Year of the study | 2013 | 2013 | 2018 | 2019 | 2011 | 2017 | 2018 | 2021 |
| 2 | Fabrication process | discrete | discrete | discrete | discrete | Microchip based | Microchip based | Microchip based | Discrete |
| 3 | # of EEG channels | 8 | 8 | 32 | 16 | - | 2 | 1 | 2 |
| 4 | EEG electrode position | 10–10 standard | - | - | 10–20 standard | - | AF7 and FT9 | - | Fp1 and Fp2 |
| 5 | EEG electrode type | Active wet | - | - | Active dry | - | Active dry | Active dry | Active wet |
| 6 | EEG electrode material | Ag/AgCl | - | - | - | - | - | - | Ag/AgCl |
| 7 | EEG resolution (bit) | 16 | 16 | 16 | 24 | 10 | 12 | 15 | 24 |
| 8 | EEG sampling rate (SPS) | 1024 | 320 | 320 | 250 | 128 | 2000 | - | 250 |
| 9 | CMMR (dB) | - | - | - | −110 | - | >−110 | −100 | −115 |
| 10 | number of sources | 8 | 8 | 32 | 2 | 6 | 1 | 2 | 2 |
| 11 | Number of detectors | 4 | 8 | 32 | 6 | 12 | 1 | 2 | 5 |
| 12 | number of fNIRS channels | 32 | 32 | 128 | 8 | 24 | 1 | 4 | 6 |
| 13 | LED wavelength/s (nm) | 760,850 | 735,850 | 735,850 | 730,850 | 735,890 | 670,850 | 735,850 | 735,850 |
| 14 | source-detector separation (mm) | 20 to 63 | 31 | 30 | 27 | 14.14 | - | 30 | 30,5 |
| 15 | fNIRS resolution (bit) | 16 | 16 | 16 | 16 | 10 | 12 | 12 | 24 |
| 16 | fNIRS sampling rate (SPS) | 8 | 20 | 20 | 5 | 1 | 20–80 | 2–512 | 8 |
| 17 | ADC setting for EEG and fNIRS | separated | shared | separated | separated | separated | shared | separated | Shared |
| 18 | Power consumption (mW) | 400 | 2200 | 2600 | 18.8/ch | 3.6 for chip | 25.2 | 0.665 for chip | 0.75/ch |
| 19 | Size of probe/cap | 35 × 80 × 10 mm3 | 130 mm3 | 95 mm3 | - | - | 35 × 260 mm2 | - | 716 × 60 mm2 |
| 20 | Size of control unit | - | 160 × 130 × 82 mm3 | 120 × 90 × 70 mm3 | 70 × 70 mm2 × 2 | - | - | - | 84 × 62 mm2 |
| 21 | system weight (g) | 90 | 800 | 850 | - | - | <26 | - | 73.5 |
| 22 | System Cost (won) | - | - | - | - | - | - | - | 151,180 |
Publisher’s Note: MDPI stays neutral with regard to jurisdictional claims in published maps and institutional affiliations. |
© 2021 by the authors. Licensee MDPI, Basel, Switzerland. This article is an open access article distributed under the terms and conditions of the Creative Commons Attribution (CC BY) license (https://creativecommons.org/licenses/by/4.0/).
Share and Cite
Mohamed, M.; Jo, E.; Mohamed, N.; Kim, M.; Yun, J.-d.; Kim, J.G. Development of an Integrated EEG/fNIRS Brain Function Monitoring System. Sensors 2021, 21, 7703. https://doi.org/10.3390/s21227703
Mohamed M, Jo E, Mohamed N, Kim M, Yun J-d, Kim JG. Development of an Integrated EEG/fNIRS Brain Function Monitoring System. Sensors. 2021; 21(22):7703. https://doi.org/10.3390/s21227703
Chicago/Turabian StyleMohamed, Manal, Eunjung Jo, Nourelhuda Mohamed, Minhee Kim, Jeong-dae Yun, and Jae Gwan Kim. 2021. "Development of an Integrated EEG/fNIRS Brain Function Monitoring System" Sensors 21, no. 22: 7703. https://doi.org/10.3390/s21227703
APA StyleMohamed, M., Jo, E., Mohamed, N., Kim, M., Yun, J.-d., & Kim, J. G. (2021). Development of an Integrated EEG/fNIRS Brain Function Monitoring System. Sensors, 21(22), 7703. https://doi.org/10.3390/s21227703