
Analysis of Gait Characteristics Using Hip-Knee Cyclograms in Patients with Hemiplegic Stroke

 , and
, and
Abstract
:1. Introduction
2. Materials and Methods
2.1. Participants
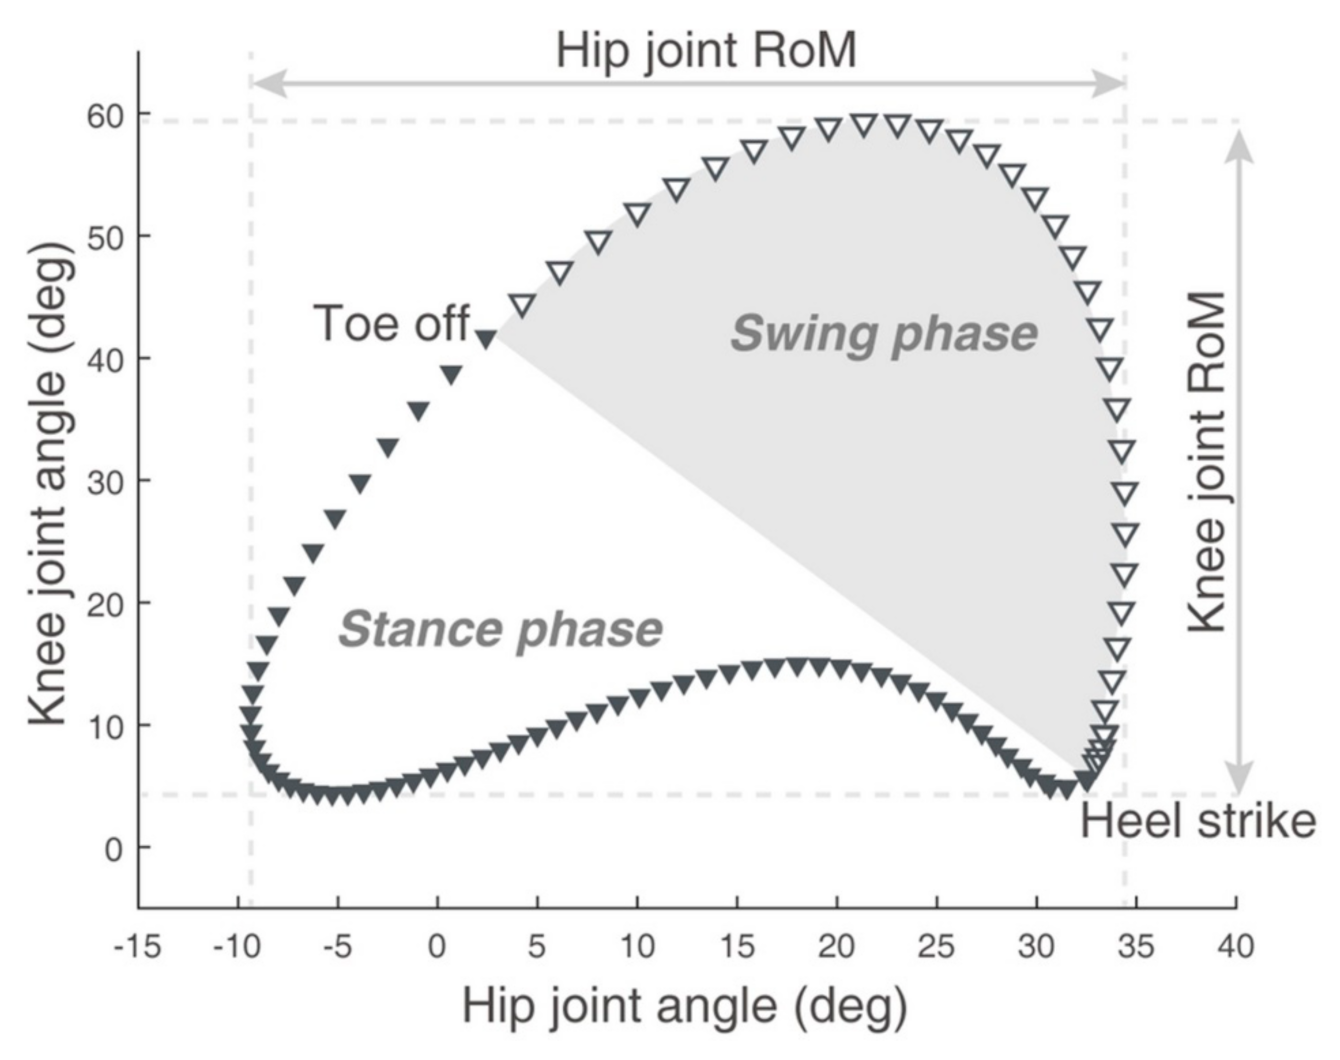
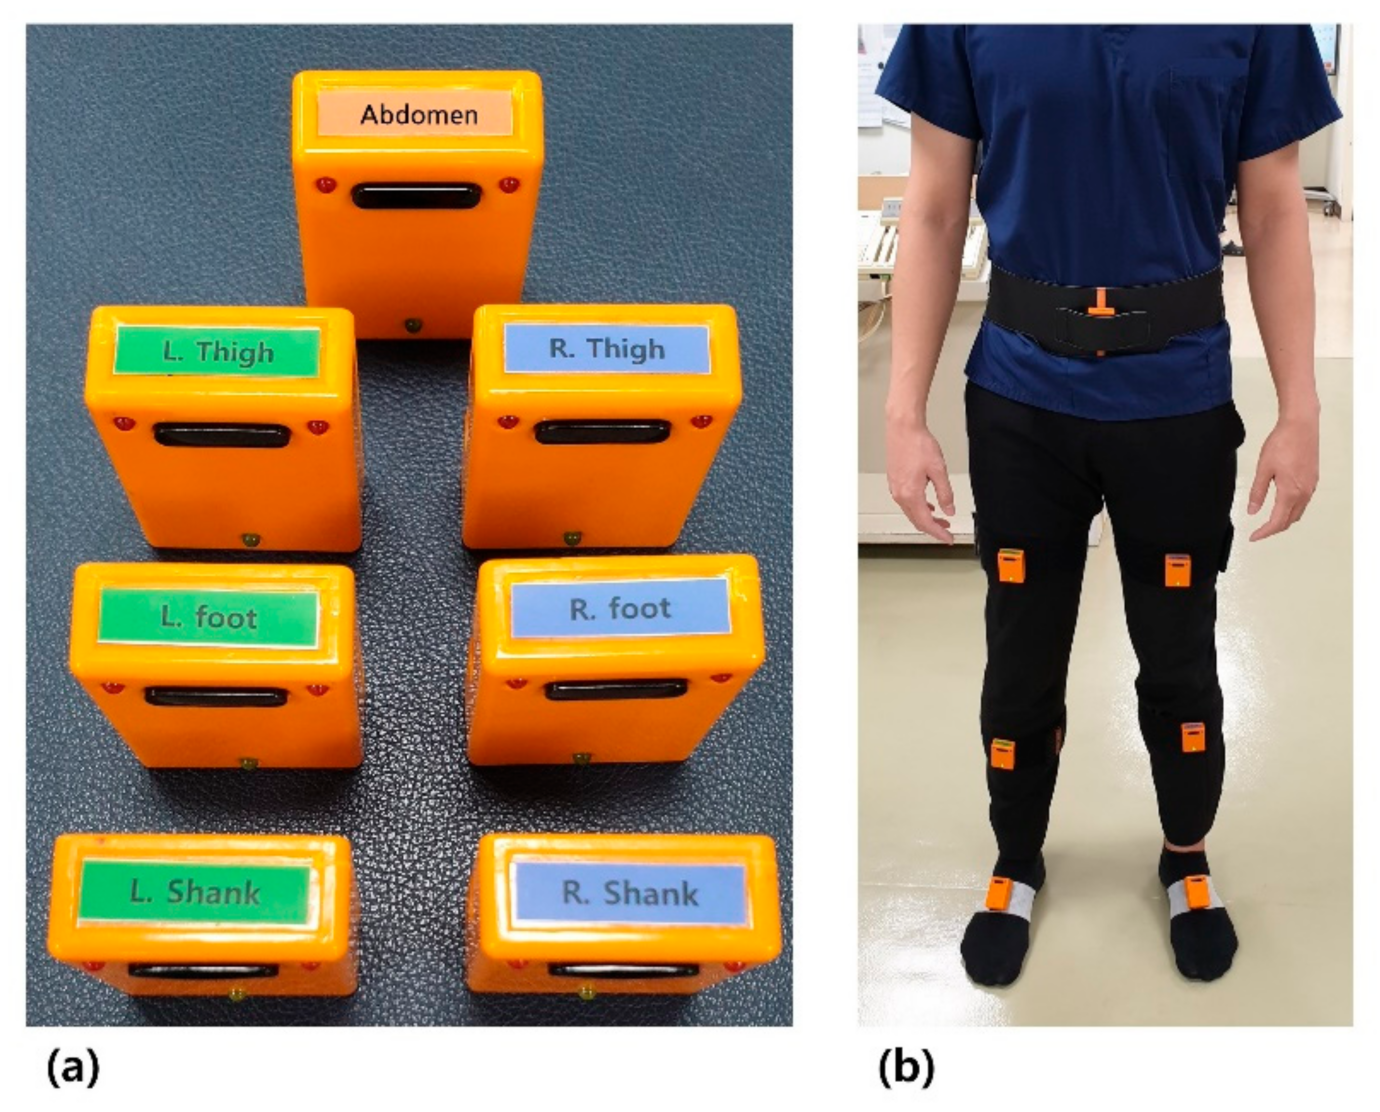
2.2. Gait Analysis
2.3. Statistical Analysis
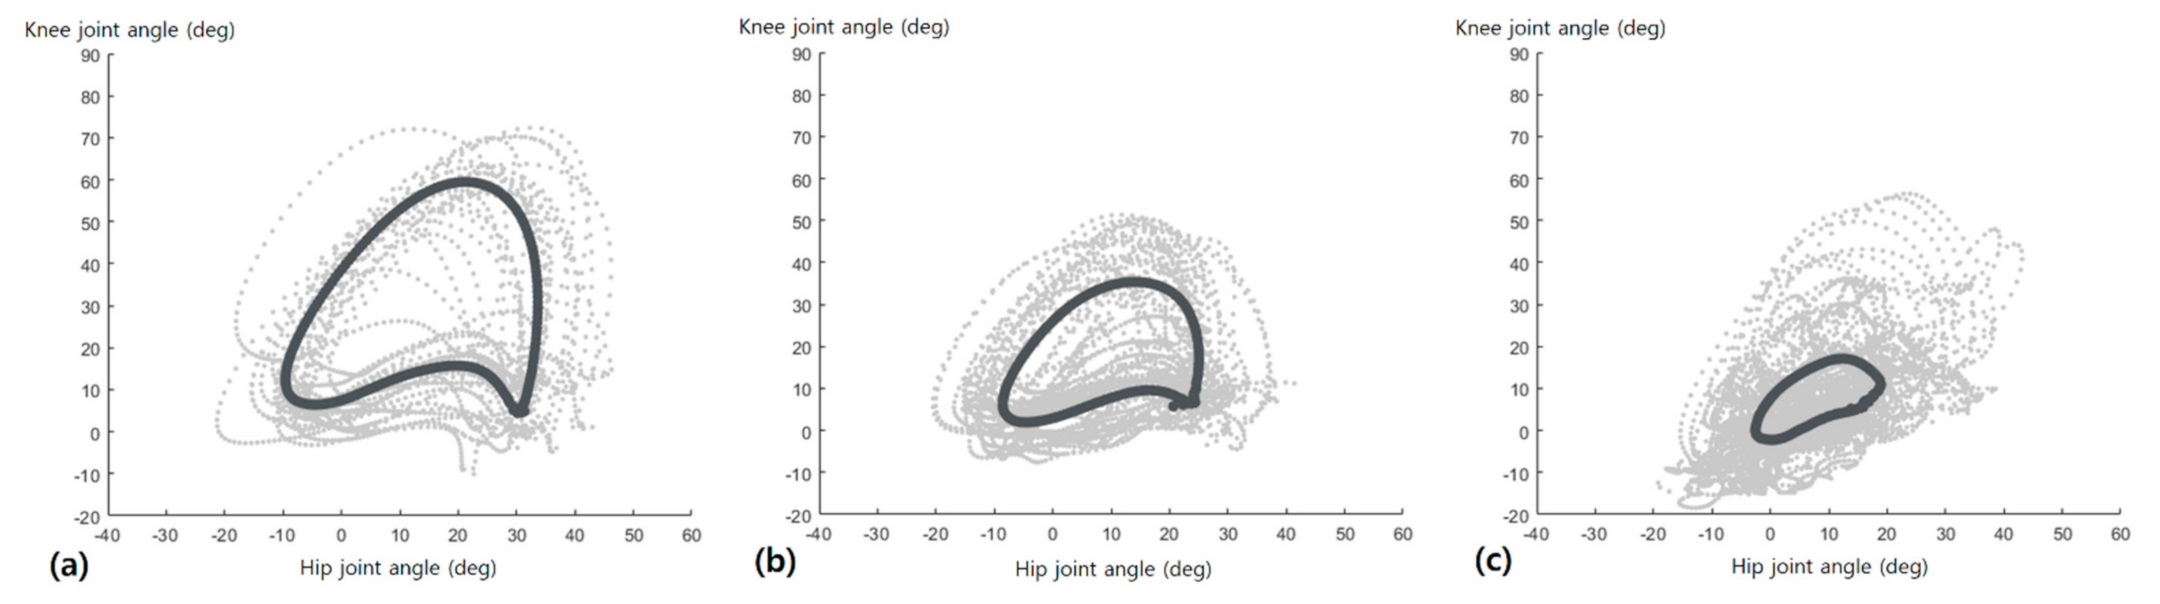
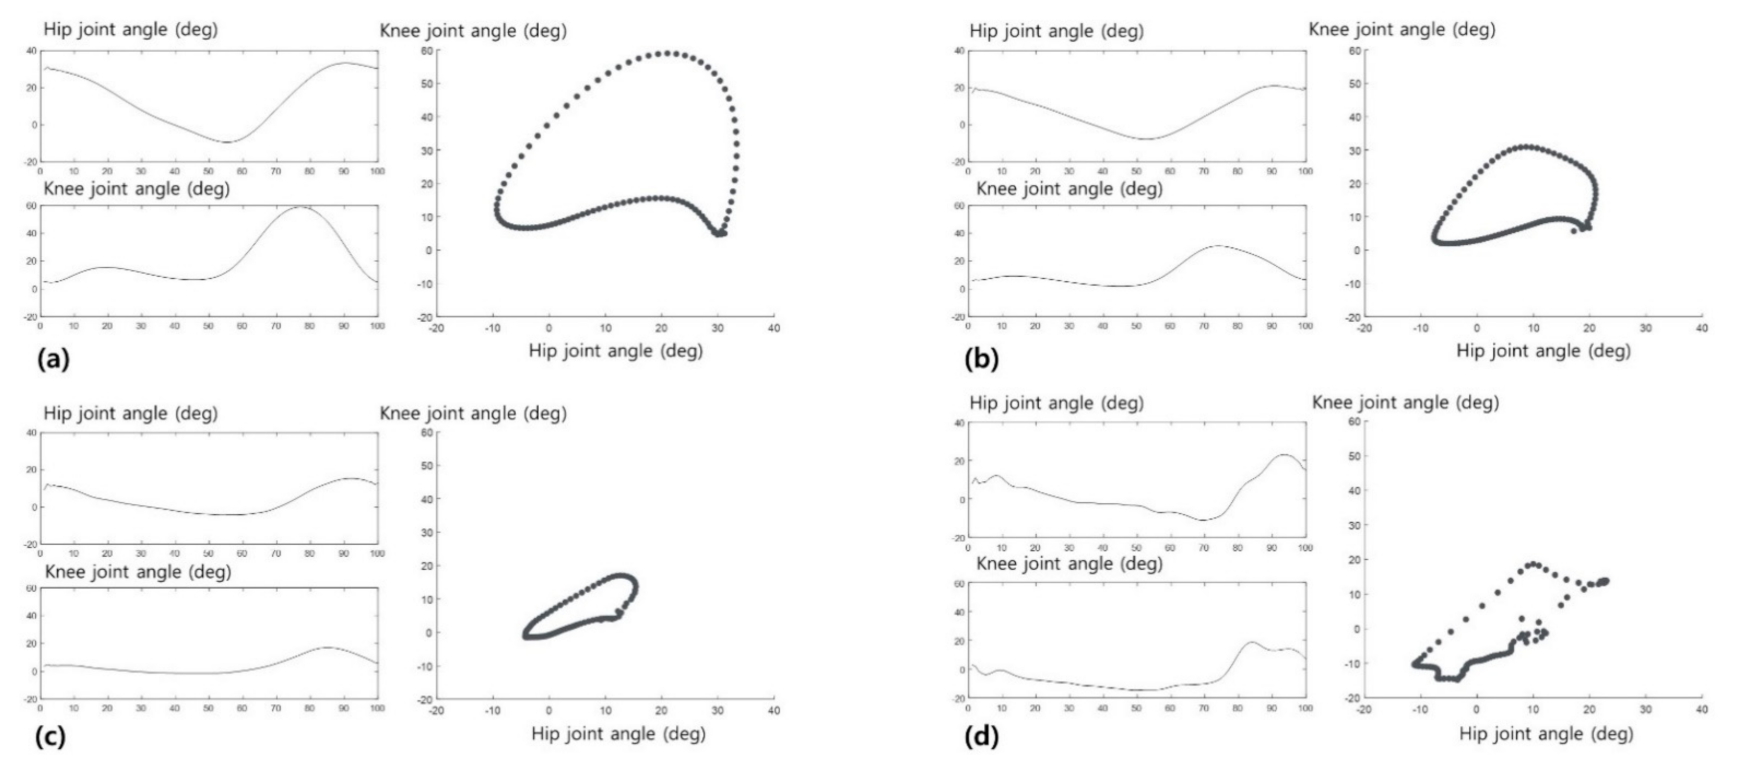
3. Results
3.1. Participants
3.2. Hip-Knee Cyclogram Parameters
3.3. The Coefficient of Variance (CV) for Hip-Knee Cyclogram Parameters
4. Discussion
5. Conclusions
Author Contributions
Funding
Institutional Review Board Statement
Informed Consent Statement
Data Availability Statement
Conflicts of Interest
References
- Virani, S.S.; Alonso, A.; Aparicio, H.J.; Benjamin, E.J.; Bittencourt, M.S.; Callaway, C.W.; Carson, A.P.; Chamberlain, A.M.; Cheng, S.; Delling, F.N. Heart disease and stroke statistics—2021 update: A report from the American Heart Association. Circulation 2021, 143, e254–e743. [Google Scholar] [CrossRef]
- Balaban, B.; Tok, F. Gait disturbances in patients with stroke. PM&R 2014, 6, 635–642. [Google Scholar] [CrossRef]
- Li, S.; Francisco, G.E.; Zhou, P. Post-stroke Hemiplegic Gait: New Perspective and Insights. Front. Physiol. 2018, 9, 1021. [Google Scholar] [CrossRef] [PubMed] [Green Version]
- Viteckova, S.; Kutilek, P.; Svoboda, Z.; Krupicka, R.; Kauler, J.; Szabo, Z. Gait symmetry measures: A review of current and prospective methods. Biomed. Signal Process. Control. 2018, 42, 89–100. [Google Scholar] [CrossRef]
- Boudarham, J.; Roche, N.; Pradon, D.; Bonnyaud, C.; Bensmail, D.; Zory, R. Variations in kinematics during clinical gait analysis in stroke patients. PLoS ONE 2013, 8, e66421. [Google Scholar] [CrossRef]
- Salbach, N.M.; Mayo, N.E.; Higgins, J.; Ahmed, S.; Finch, L.E.; Richards, C.L. Responsiveness and predictability of gait speed and other disability measures in acute stroke. Arch. Phys. Med. Rehabil. 2001, 82, 1204–1212. [Google Scholar] [CrossRef]
- Schmid, A.; Duncan, P.W.; Studenski, S.; Lai, S.M.; Richards, L.; Perera, S.; Wu, S.S. Improvements in speed-based gait classifications are meaningful. Stroke 2007, 38, 2096–2100. [Google Scholar] [CrossRef] [Green Version]
- Holden, M.K.; Gill, K.M.; Magliozzi, M.R.; Nathan, J.; Piehl-Baker, L. Clinical gait assessment in the neurologically impaired: Reliability and meaningfulness. Phys. Ther. 1984, 64, 35–40. [Google Scholar] [CrossRef] [PubMed]
- Mah, C.D.; Hulliger, M.; O’Callaghan, I.S.; Lee, R.G. Quantitative kinematics of gait patterns during the recovery period after stroke. J. Stroke Cerebrovasc. Dis. 1999, 8, 312–329. [Google Scholar] [CrossRef]
- Huitema, R.B.; Hof, A.L.; Mulder, T.; Brouwer, W.H.; Dekker, R.; Postema, K. Functional recovery of gait and joint kinematics after right hemispheric stroke. Arch. Phys. Med. Rehabil. 2004, 85, 1982–1988. [Google Scholar] [CrossRef] [Green Version]
- Perry, J.; Garrett, M.; Gronley, J.K.; Mulroy, S.J. Classification of walking handicap in the stroke population. Stroke 1995, 26, 982–989. [Google Scholar] [CrossRef] [PubMed]
- Goswami, A. A new gait parameterization technique by means of cyclogram moments: Application to human slope walking. Gait Posture 1998, 8, 15–36. [Google Scholar] [CrossRef]
- Hershler, C.; Milner, M. Angle--angle diagrams in the assessment of locomotion. Am. J. Phys. Med. 1980, 59, 109–125. [Google Scholar]
- Park, J.H.; Lee, H.; Cho, J.-s.; Kim, I.; Lee, J.; Jang, S.H. Effects of knee osteoarthritis severity on inter-joint coordination and gait variability as measured by hip-knee cyclograms. Sci. Rep. 2021, 11, 1–8. [Google Scholar] [CrossRef] [PubMed]
- Pilkar, R.; Ramanujam, A.; Chervin, K.; Forrest, G.F.; Nolan, K.J. Cyclogram-based joint symmetry assessment after utilization of a foot drop stimulator during post-stroke hemiplegic gait. J. Biomech. Eng. 2018, 140, 121005. [Google Scholar] [CrossRef] [PubMed]
- Mehrholz, J.; Wagner, K.; Rutte, K.; Meiβner, D.; Pohl, M. Predictive validity and responsiveness of the functional ambulation category in hemiparetic patients after stroke. Arch. Phys. Med. Rehabil. 2007, 88, 1314–1319. [Google Scholar] [CrossRef]
- Cho, Y.S.; Jang, S.H.; Cho, J.S.; Kim, M.J.; Lee, H.D.; Lee, S.Y.; Moon, S.B. Evaluation of Validity and Reliability of Inertial Measurement Unit-Based Gait Analysis Systems. Ann. Rehabil. Med. 2018, 42, 872–883. [Google Scholar] [CrossRef] [PubMed] [Green Version]
- Yang, J.H.; Park, J.H.; Jang, S.-H.; Cho, J. Novel Method of Classification in Knee Osteoarthritis: Machine Learning Application Versus Logistic Regression Model. Ann. Rehabil. Med. 2020, 44, 415. [Google Scholar] [CrossRef]
- Qiu, S.; Zhao, H.; Jiang, N.; Wu, D.; Song, G.; Zhao, H.; Wang, Z. Sensor network oriented human motion capture via wearable intelligent system. Int. J. Intell. Syst. 2021. Available online: https://onlinelibrary.wiley.com/doi/abs/10.1002/int.22689 (accessed on 1 November 2021).
- Sun, F.; Zang, W.; Gravina, R.; Fortino, G.; Li, Y. Gait-based identification for elderly users in wearable healthcare systems. Inf. Fusion 2020, 53, 134–144. [Google Scholar] [CrossRef]
- Celik, Y.; Stuart, S.; Woo, W.L.; Sejdic, E.; Godfrey, A. Multi-modal gait: A wearable, algorithm and data fusion approach for clinical and free-living assessment. Inf. Fusion 2022, 78, 57–70. [Google Scholar] [CrossRef]
- Madgwick, S.O. Automated Calibration of an Accelerometers, Magnetometers and Gyroscopes—A Feasibility Study; Tehc Rep, x-io Technologies Limited: Bristol, UK, 2010; Available online: http://www.x-io.co.uk/res/doc/automated_calibration_feasibility_study.pdf (accessed on 1 November 2021).
- Cloete, T.; Scheffer, C. Benchmarking of a full-body inertial motion capture system for clinical gait analysis. In Proceedings of the 2008 30th Annual International Conference of the IEEE Engineering in Medicine and Biology Society, Vancouver, BC, Canada, 20–25 August 2008; pp. 4579–4582. [Google Scholar]
- Lee, K.; Kang, S.; Cho, J.; Lim, D.; Lee, J.; Kim, I. Development of gait distance measurement system based on inertial measurement units. J. Rehabil. Welf. Eng. Assist. Technol. 2015, 9, 161–168. [Google Scholar]
- Hajný, O.; Farkašová, B. A study of gait and posture with the use of cyclograms. Acta Polytech. 2010, 50, 48–51. [Google Scholar] [CrossRef]
- Balasubramanian, C.K.; Neptune, R.R.; Kautz, S.A. Variability in spatiotemporal step characteristics and its relationship to walking performance post-stroke. Gait Posture 2009, 29, 408–414. [Google Scholar] [CrossRef] [PubMed] [Green Version]
- Hausdorff, J.M. Gait variability: Methods, modeling and meaning. J. Neuroeng. Rehabil. 2005, 2, 1–9. [Google Scholar] [CrossRef] [PubMed] [Green Version]
- Kiss, R.M. Effect of severity of knee osteoarthritis on the variability of gait parameters. J. Electromyogr. Kinesiol. 2011, 21, 695–703. [Google Scholar] [CrossRef]
- Zwillinger, D. CRC Standard Mathematical Tables and Formulas, 33th ed.; Chapman and Hall/CRC: Boca Raton, FL, USA, 2018. [Google Scholar]
- Olney, S.J.; Richards, C. Hemiparetic gait following stroke. Part I: Characteristics. Gait Posture 1996, 4, 136–148. [Google Scholar] [CrossRef]
- Longworth, J.A.; Chlosta, S.; Foucher, K.C. Inter-joint coordination of kinematics and kinetics before and after total hip arthroplasty compared to asymptomatic subjects. J. Biomech. 2018, 72, 180–186. [Google Scholar] [CrossRef]
- Mulroy, S.; Gronley, J.; Weiss, W.; Newsam, C.; Perry, J. Use of cluster analysis for gait pattern classification of patients in the early and late recovery phases following stroke. Gait Posture 2003, 18, 114–125. [Google Scholar] [CrossRef]
- Cooper, A.; Alghamdi, G.A.; Alghamdi, M.A.; Altowaijri, A.; Richardson, S. The relationship of lower limb muscle strength and knee joint hyperextension during the stance phase of gait in hemiparetic stroke patients. Physiother. Res. Int. 2012, 17, 150–156. [Google Scholar] [CrossRef]
- Geerars, M.; Minnaar-van der Feen, N.; Huisstede, B.M. Treatment of knee hyperextension in post-stroke gait. A systematic review. Gait Posture 2021, 91, 137–148. [Google Scholar] [CrossRef]
- Shorter, K.A.; Wu, A.; Kuo, A.D. The high cost of swing leg circumduction during human walking. Gait Posture 2017, 54, 265–270. [Google Scholar] [CrossRef] [Green Version]
- Woolley, S.M. Characteristics of gait in hemiplegia. Top. Stroke Rehabil. 2001, 7, 1–18. [Google Scholar] [CrossRef] [PubMed] [Green Version]
- Choo, Y.J.; Chang, M.C. Effectiveness of an ankle–foot orthosis on walking in patients with stroke: A systematic review and meta-analysis. Sci. Rep. 2021, 11, 1–12. [Google Scholar]
- Chang, M.C.; Chun, M.H. The effects of a short ankle-foot orthosis on gait in patients with post-stroke hemiplegia. Neurol. Asia 2019, 24, 103–107. [Google Scholar]


| Controls (n = 32) | Mild Stroke (n = 18) | Moderate Stroke (n = 29) | p-Value | |
|---|---|---|---|---|
| Age (years) | 63.81±7.8 | 63.27 ± 15.1 | 63.25 ± 13.1 | N.S. |
| Sex (M:F) | 14:18 | 10:8 | 13:16 | N.S. |
| Height (cm) | 162.8 ± 6.3 | 164.1 ± 8.4 | 163.4 ± 7.3 | N.S. |
| Weight (kg) | 64.0 ± 6.8 | 64.74 ± 9.9 | 63.35 ± 10.9 | N.S. |
| BMI (kg/m2) | 24.08 ± 2.8 | 23.94 ± 3.6 | 23.62 ± 3.2 | N.S. |
| FAC score | 4 (n = 10) or 5 (n = 8) | 2 (n = 9) or 3 (n = 20) | ||
| Gait speed (m/s) | 1.33 ± 0.2 | 1.04 ± 0.3 | 0.67 ± 0.4 | <0.0001 |
| Duration (days) | 215.11 ± 153.64 | 299.21 ± 227.95 | N.S. | |
| Orthosis (n) | 1 | 7 | N.S. |
| Controls (n = 32) | Mild Stroke (n = 18) | Moderate Stroke (n = 29) | p-Value | Multiple Comparisons | |||
|---|---|---|---|---|---|---|---|
| Controls vs. Mild | Control vs. Moderate | Mild vs. Moderate | |||||
| ROM (deg) | |||||||
| Hip | 45.51 ± 5.92 | 38.82 ± 6.09 | 27.75 ± 9.45 | <0.0001 | <0.0001 | <0.0001 | <0.0001 |
| Knee | 57.43 ± 8.31 | 40.62 ± 7.50 | 27.75 ± 12.02 | <0.0001 | <0.0001 | <0.0001 | <0.0001 |
| Perimeter (deg) | |||||||
| Stance phase | 73.05 ± 12.20 | 61.62 ± 13.25 | 49.13 ± 15.42 | <0.0001 | <0.0001 | <0.0001 | <0.0001 |
| Swing phase | 112.47 ± 12.76 | 82.40 ± 16.75 | 62.58 ± 25.00 | <0.0001 | <0.0001 | <0.0001 | <0.0001 |
| Total | 185.52 ± 21.93 | 144.03 ± 20.88 | 111.72 ± 33.58 | <0.0001 | <0.0001 | <0.0001 | <0.0001 |
| Area (deg2) | |||||||
| Stance phase | 213.10 ± 170.03 | 212.13 ± 212.27 | 86.36 ± 92.94 | <0.0001 | N.S. | <0.0001 | 0.0002 |
| Swing phase | 1468.67 ± 345.46 | 743.68 ± 274.92 | 277.24 ± 326.90 | <0.0001 | <0.0001 | <0.0001 | <0.0001 |
| Total | 1609.70 ± 431.78 | 895.30 ± 375.19 | 335.80 ± 364.28 | <0.0001 | <0.0001 | <0.0001 | <0.0001 |
| Controls (n = 32) | Mild Stroke (n = 18) | Moderate Stroke (n = 29) | p-Value | Multiple Comparisons | |||
|---|---|---|---|---|---|---|---|
| Controls vs. Mild | Control vs. Moderate | Mild vs. Moderate | |||||
| ROM (deg) | |||||||
| Hip | 5.03 ± 3.17 | 5.33 ± 3.94 | 11.38 ± 8.25 | <0.0001 | N.S. | <0.0001 | 0.0050 |
| Knee | 4.34 ± 2.79 | 6.82 ± 3.68 | 9.79 ± 8.25 | 0.0011 | N.S. | 0.0004 | N.S. |
| Perimeter (deg) | |||||||
| Stance phase | 6.39 ± 3.93 | 10.13 ± 6.16 | 16.79 ± 12.41 | <0.0001 | N.S. | <0.0001 | N.S. |
| Swing phase | 5.22 ± 2.41 | 10.11 ± 6.34 | 17.51 ± 17.40 | <0.0001 | 0.0031 | <0.0001 | N.S. |
| Total | 3.18 ± 1.85 | 5.37 ± 2.83 | 11.69 ± 11.29 | <0.0001 | 0.0078 | <0.0001 | 0.0021 |
| Area (deg2) | |||||||
| Stance phase | 51.51 ± 25.12 | 53.16 ± 23.29 | 57.38 ± 17.31 | N.S. | - | - | - |
| Swing phase | 11.00 ± 6.86 | 20.09 ± 16.73 | 39.81 ± 27.40 | <0.0001 | N.S. | <0.0001 | <0.0001 |
| Total | 9.55 ± 5.88 | 14.27 ± 5.33 | 34.23 ± 23.30 | <0.0001 | 0.0020 | <0.0001 | 0.0028 |
Publisher’s Note: MDPI stays neutral with regard to jurisdictional claims in published maps and institutional affiliations. |
© 2021 by the authors. Licensee MDPI, Basel, Switzerland. This article is an open access article distributed under the terms and conditions of the Creative Commons Attribution (CC BY) license (https://creativecommons.org/licenses/by/4.0/).
Share and Cite
Lee, H.S.; Ryu, H.; Lee, S.-U.; Cho, J.-s.; You, S.; Park, J.H.; Jang, S.-H. Analysis of Gait Characteristics Using Hip-Knee Cyclograms in Patients with Hemiplegic Stroke. Sensors 2021, 21, 7685. https://doi.org/10.3390/s21227685
Lee HS, Ryu H, Lee S-U, Cho J-s, You S, Park JH, Jang S-H. Analysis of Gait Characteristics Using Hip-Knee Cyclograms in Patients with Hemiplegic Stroke. Sensors. 2021; 21(22):7685. https://doi.org/10.3390/s21227685
Chicago/Turabian StyleLee, Ho Seok, Hokyoung Ryu, Shi-Uk Lee, Jae-sung Cho, Sungmin You, Jae Hyeon Park, and Seong-Ho Jang. 2021. "Analysis of Gait Characteristics Using Hip-Knee Cyclograms in Patients with Hemiplegic Stroke" Sensors 21, no. 22: 7685. https://doi.org/10.3390/s21227685
APA StyleLee, H. S., Ryu, H., Lee, S.-U., Cho, J.-s., You, S., Park, J. H., & Jang, S.-H. (2021). Analysis of Gait Characteristics Using Hip-Knee Cyclograms in Patients with Hemiplegic Stroke. Sensors, 21(22), 7685. https://doi.org/10.3390/s21227685