
Fabrication Quality Assessment Based on the Coupling of a Dual-Core Microstructured Polymer Optical Fiber


Abstract
:1. Introduction
2. Materials and Methods
2.1. Materials
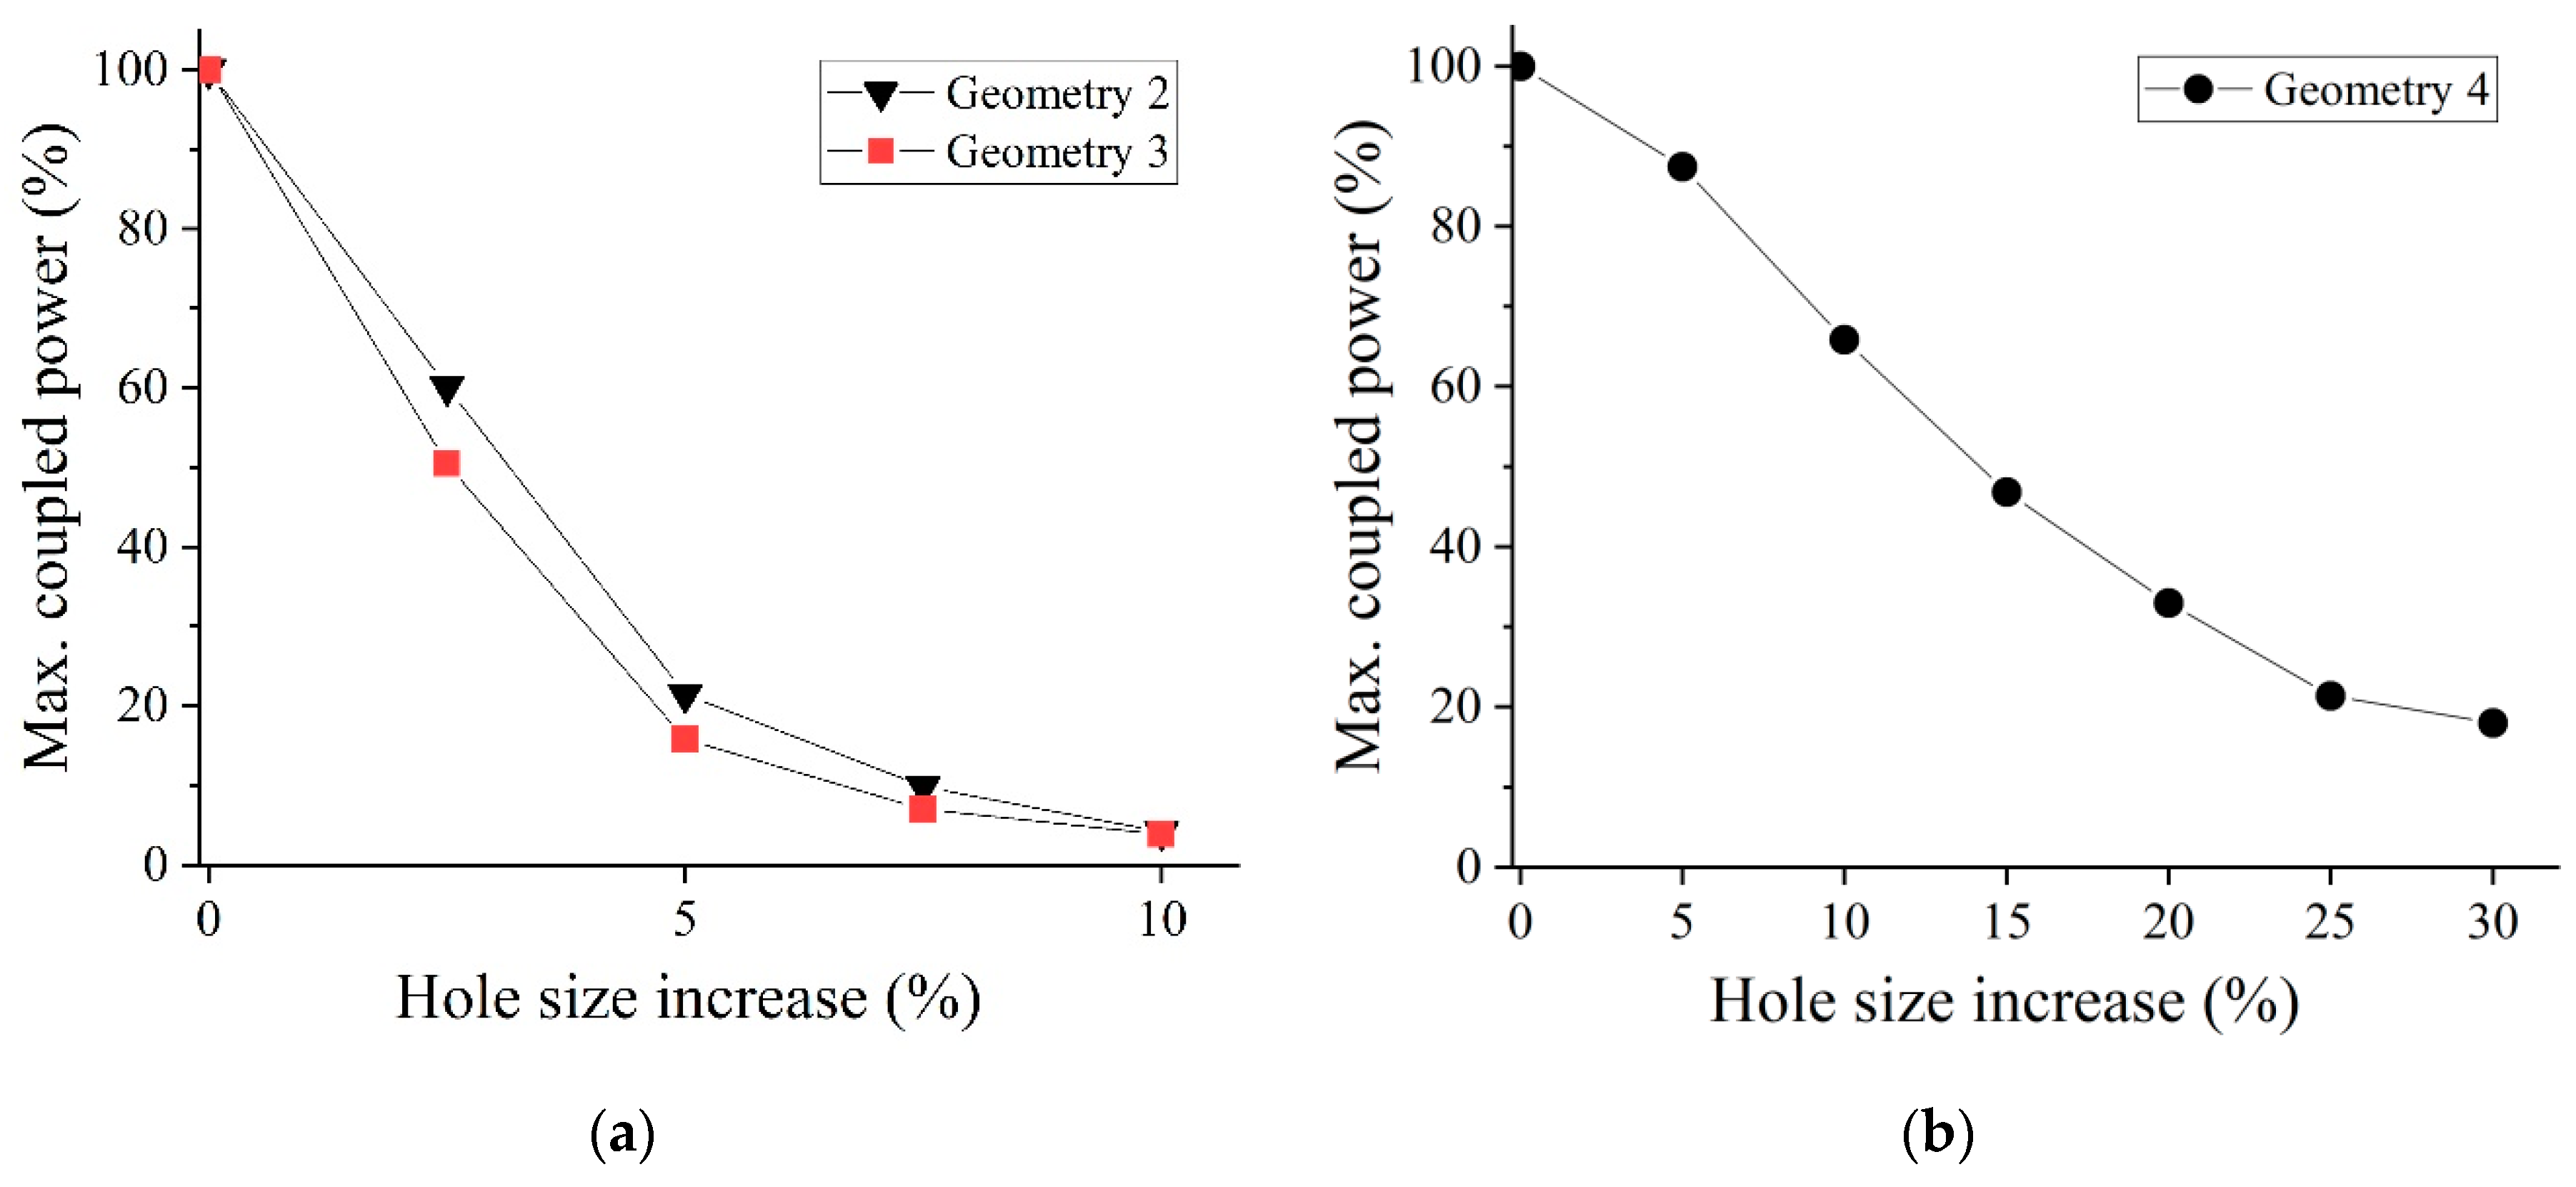
2.2. Fabrication
2.3. Coupled-Mode Theory
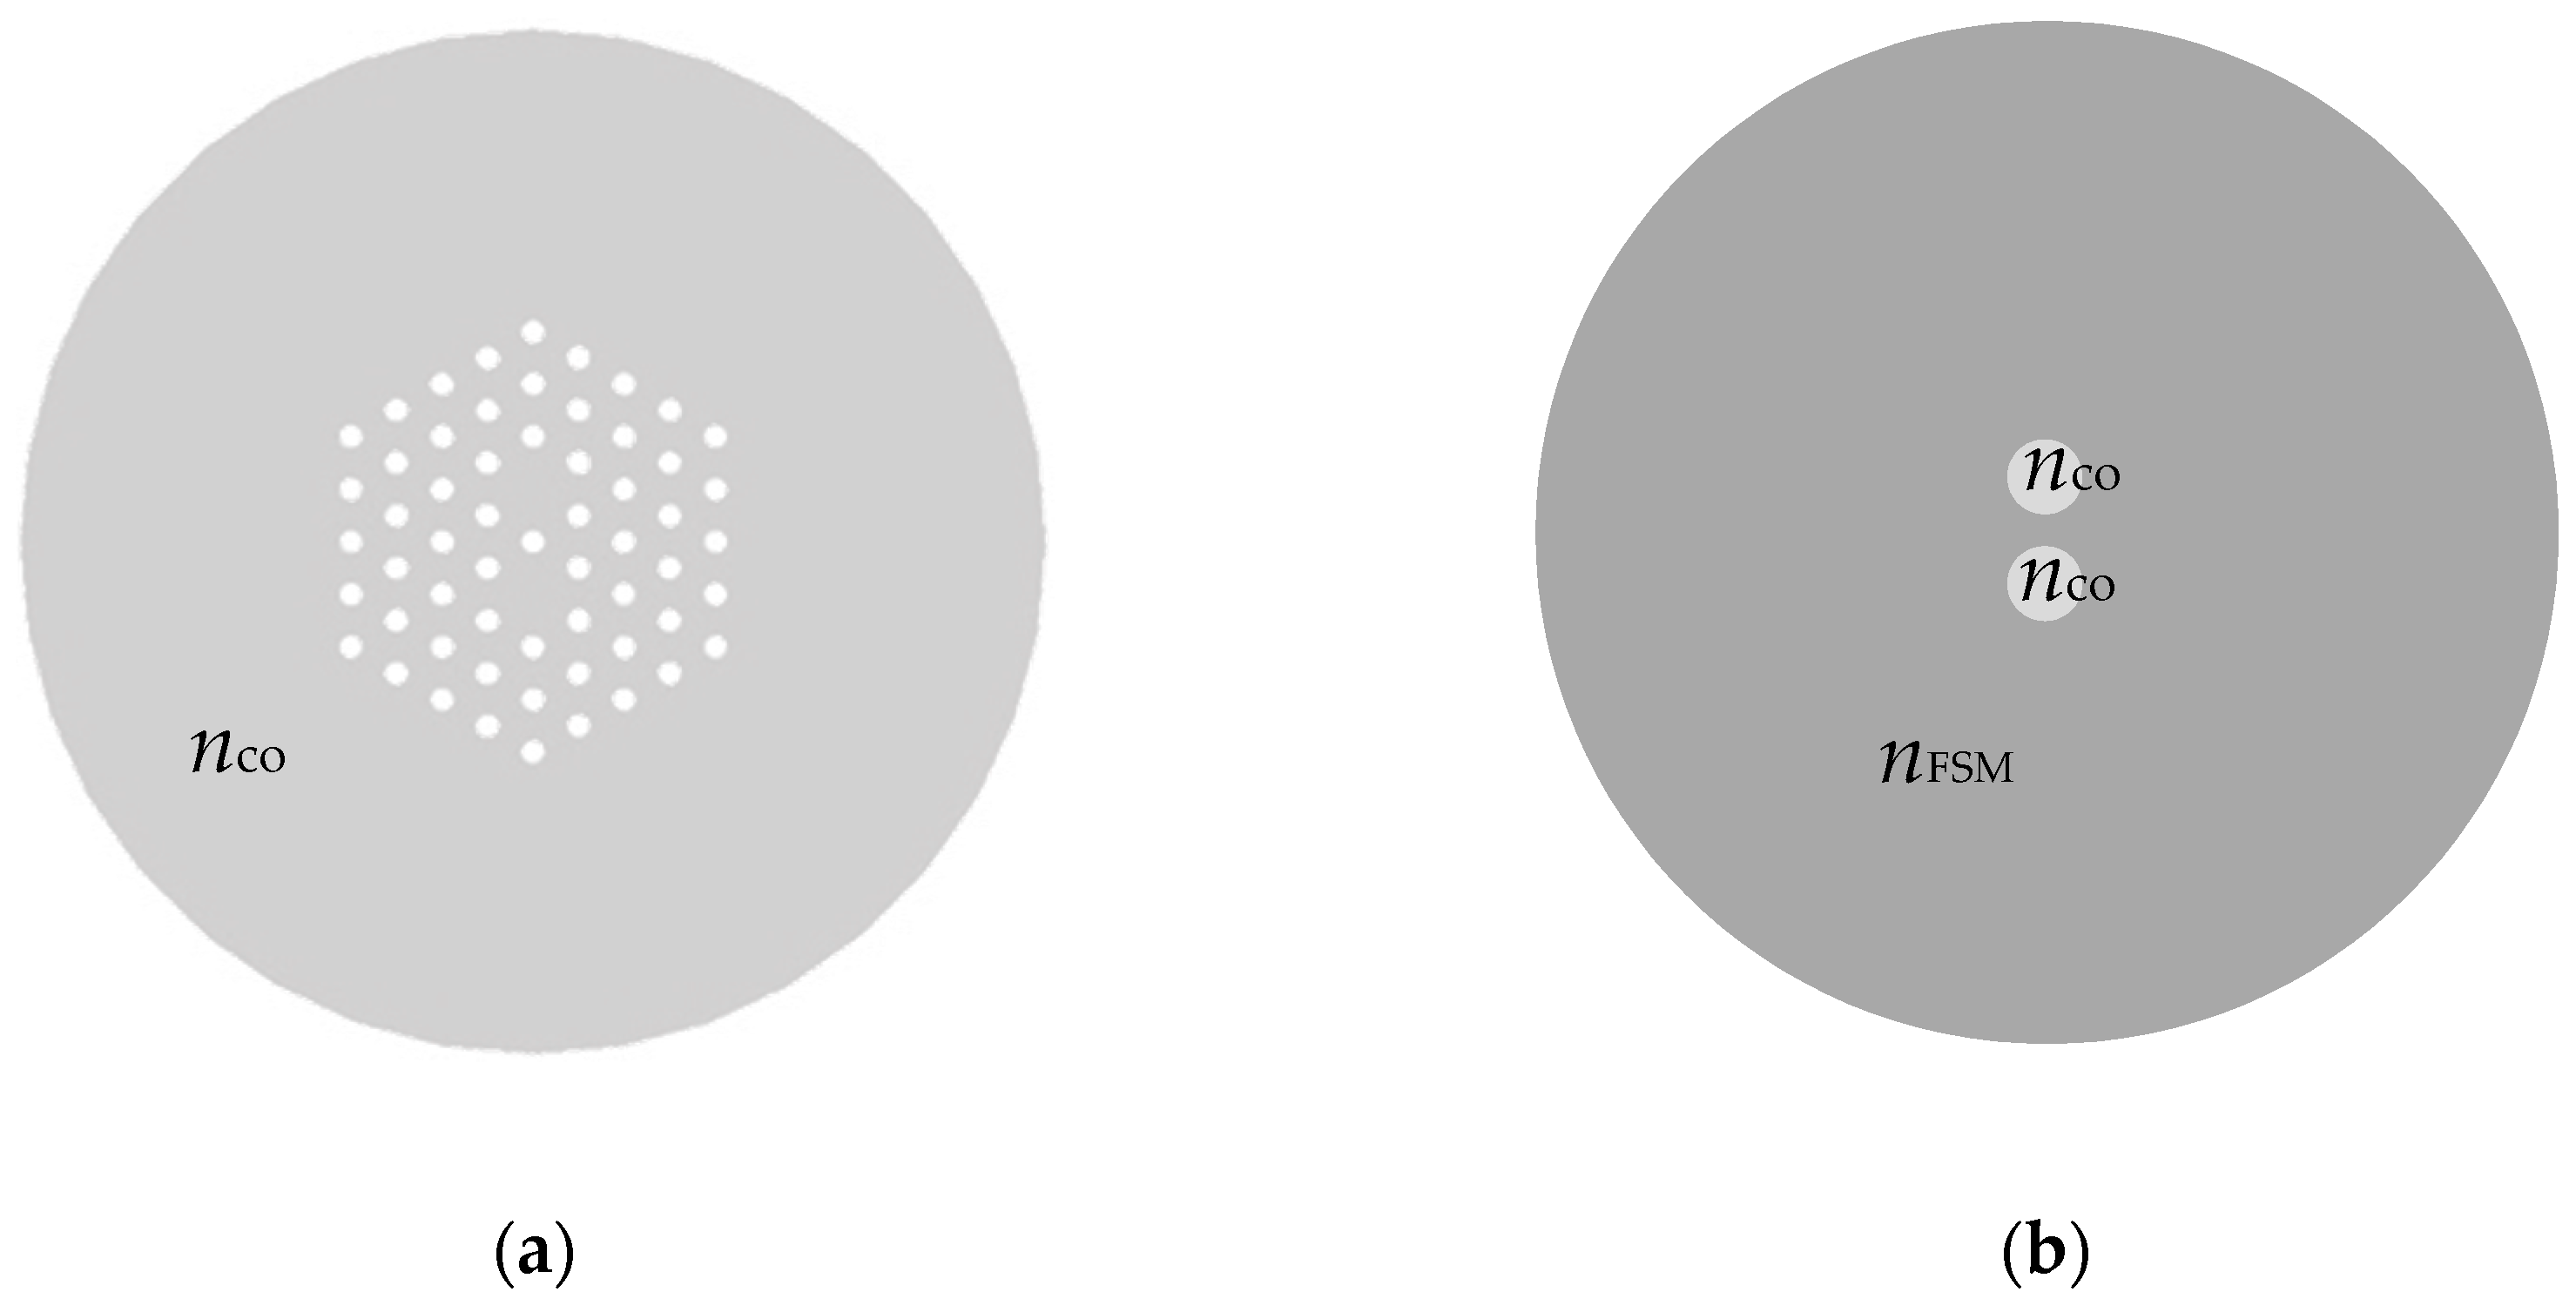
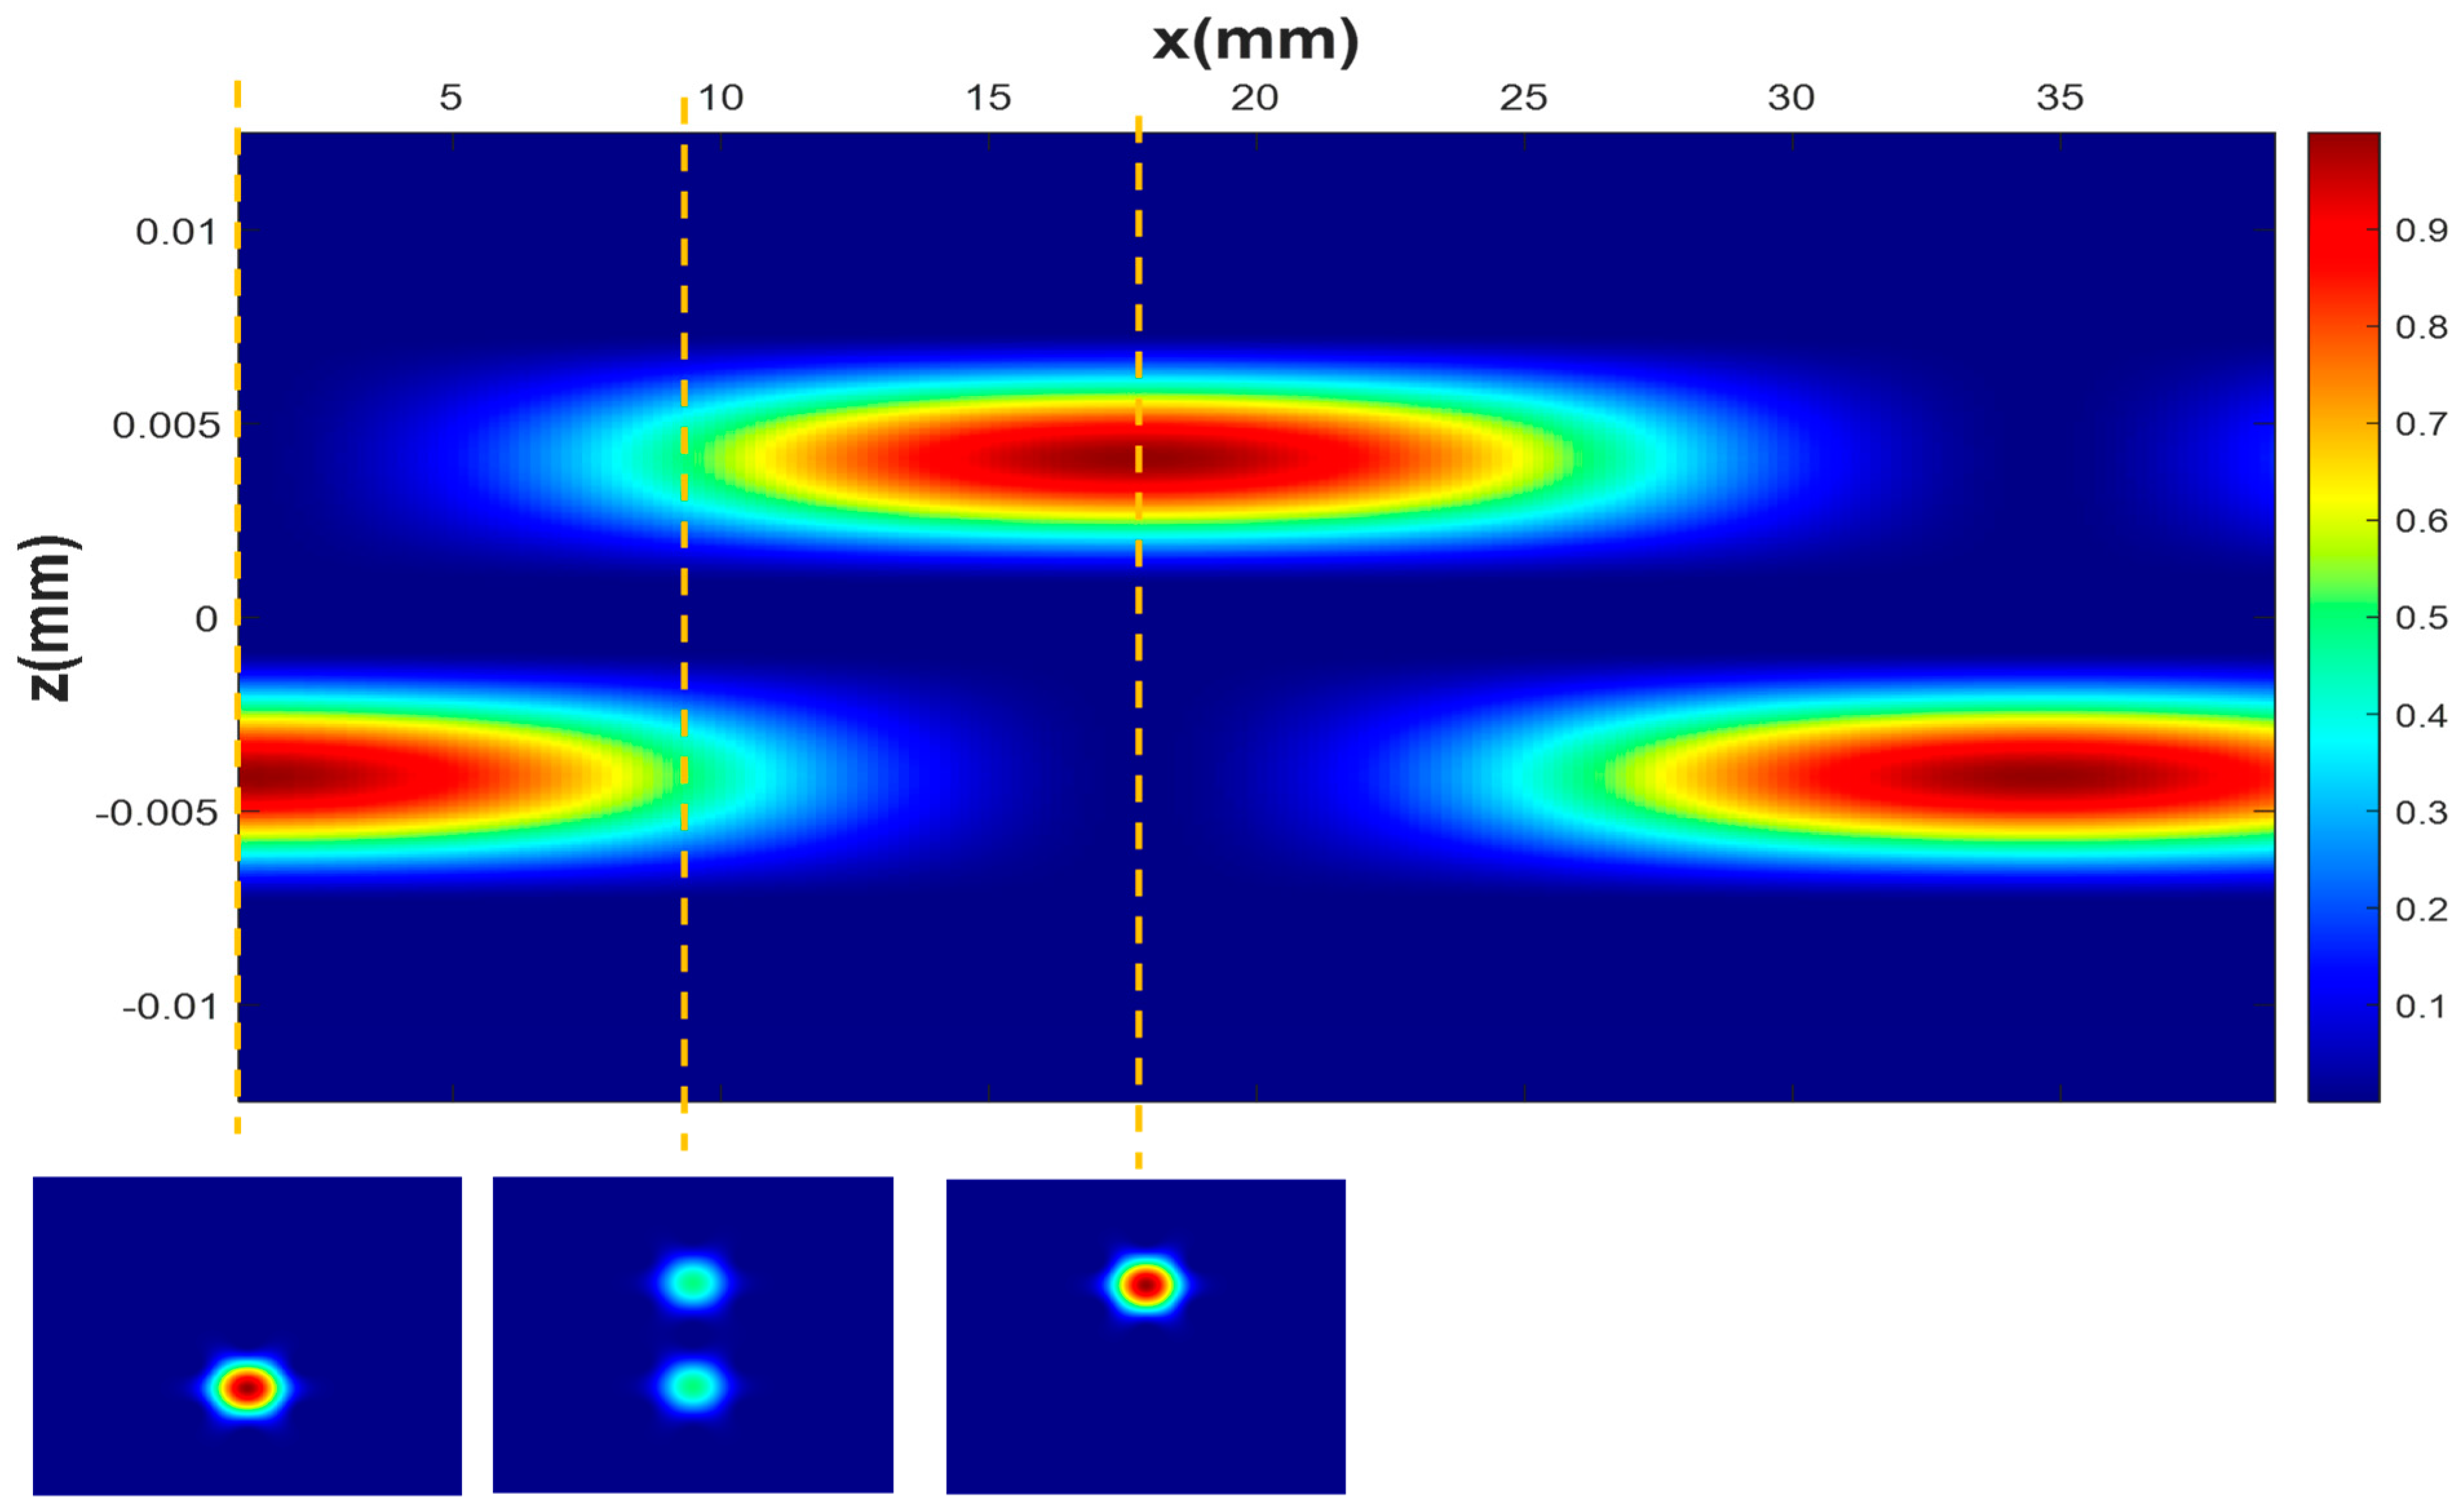
2.4. Numerical Simulations
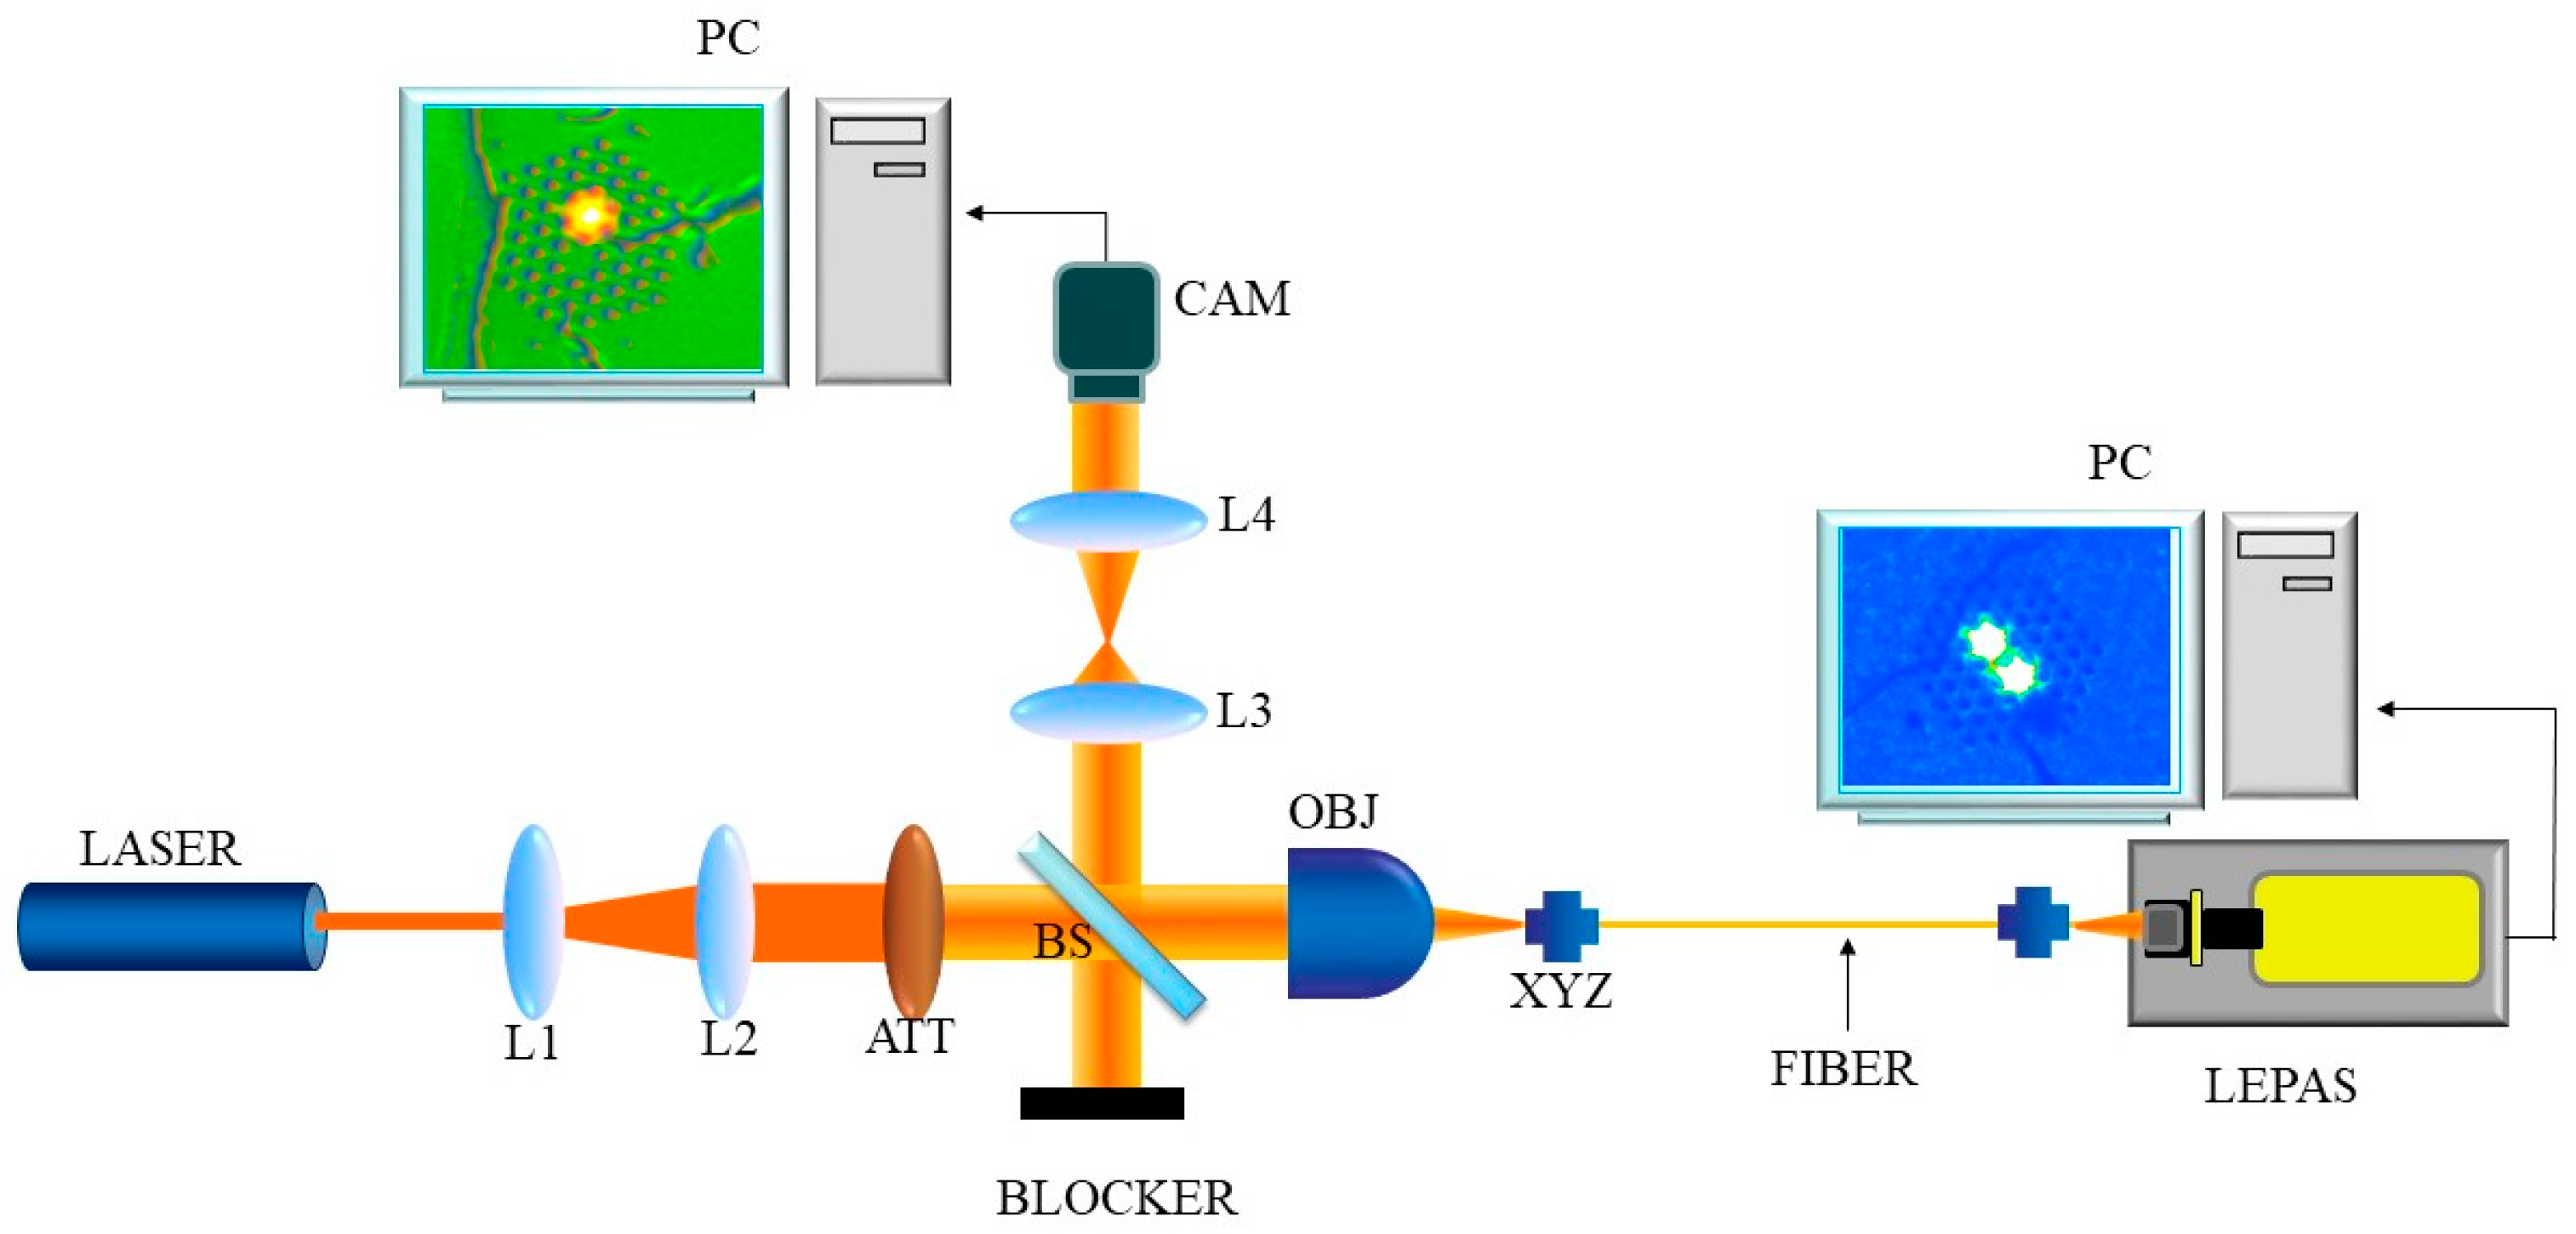
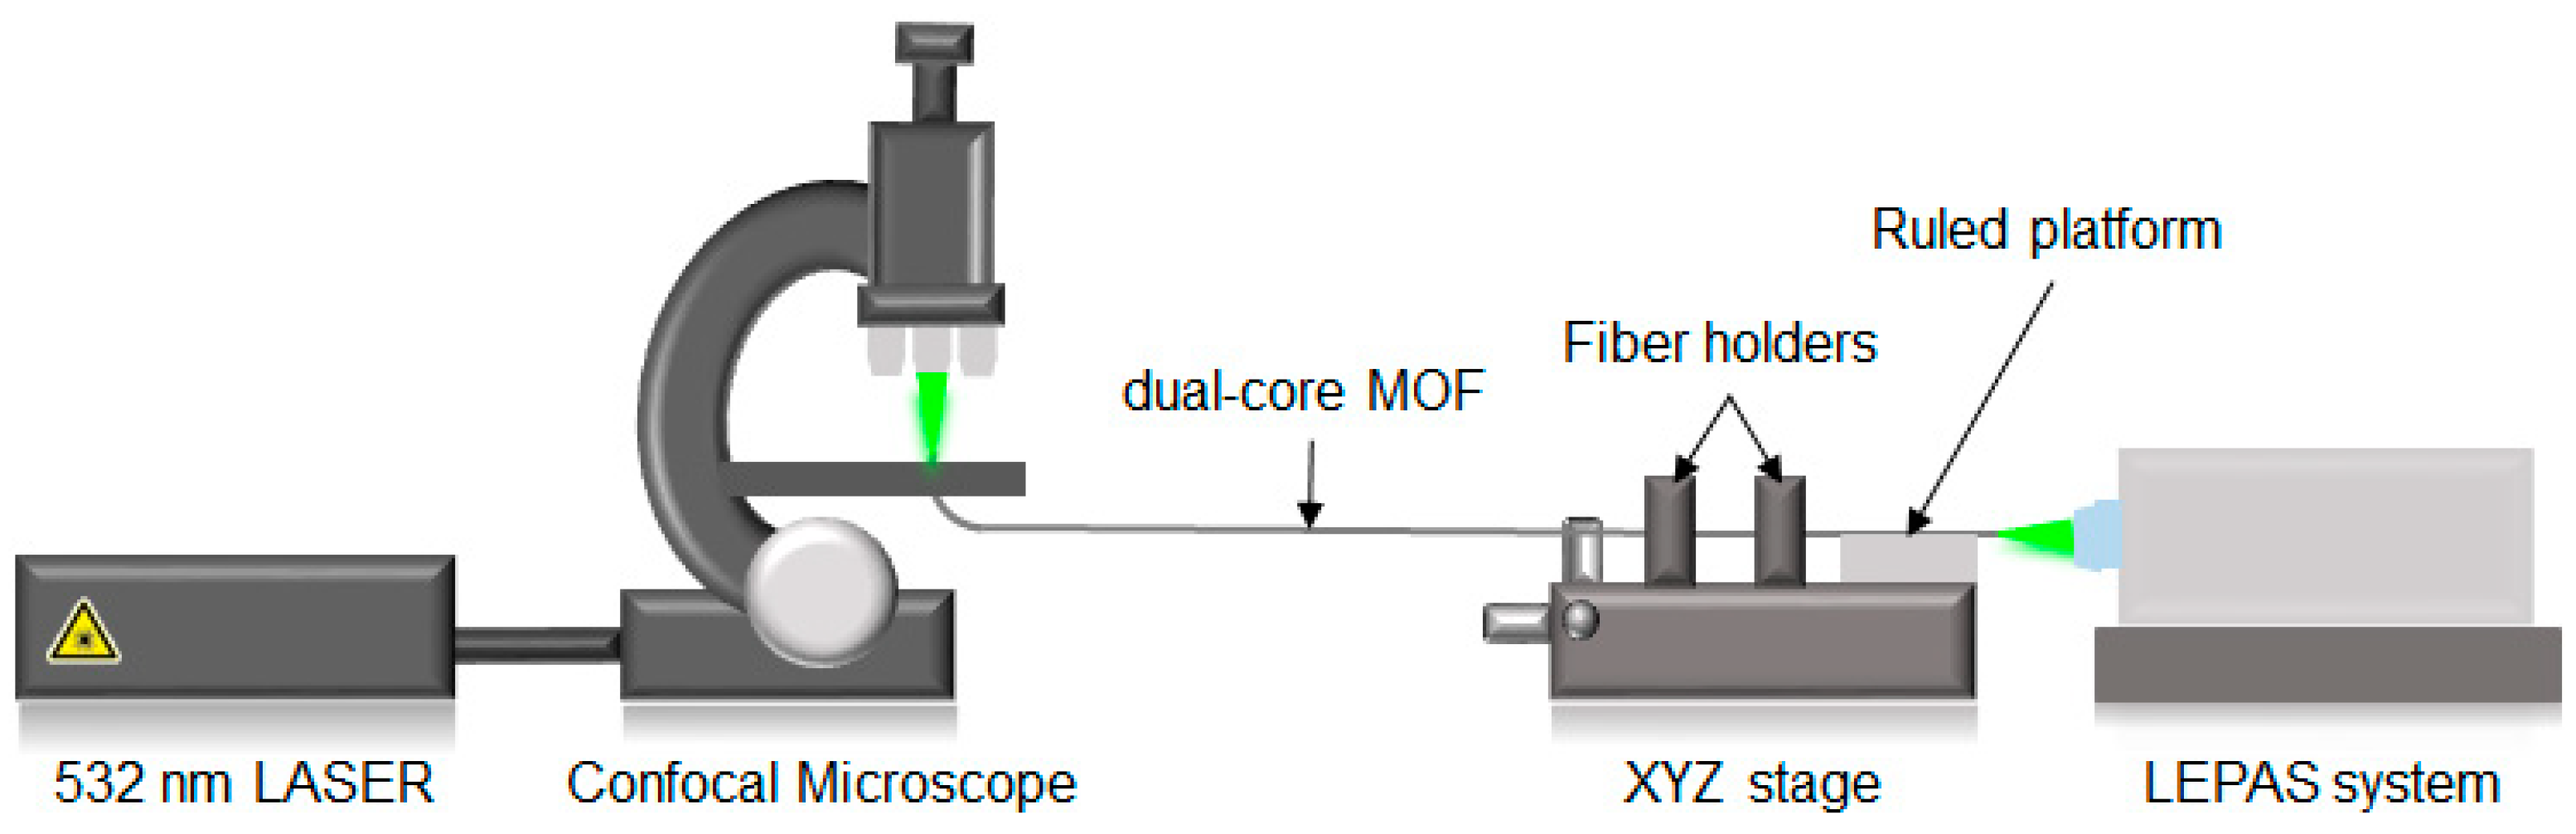
2.5. Experimental Set-Up
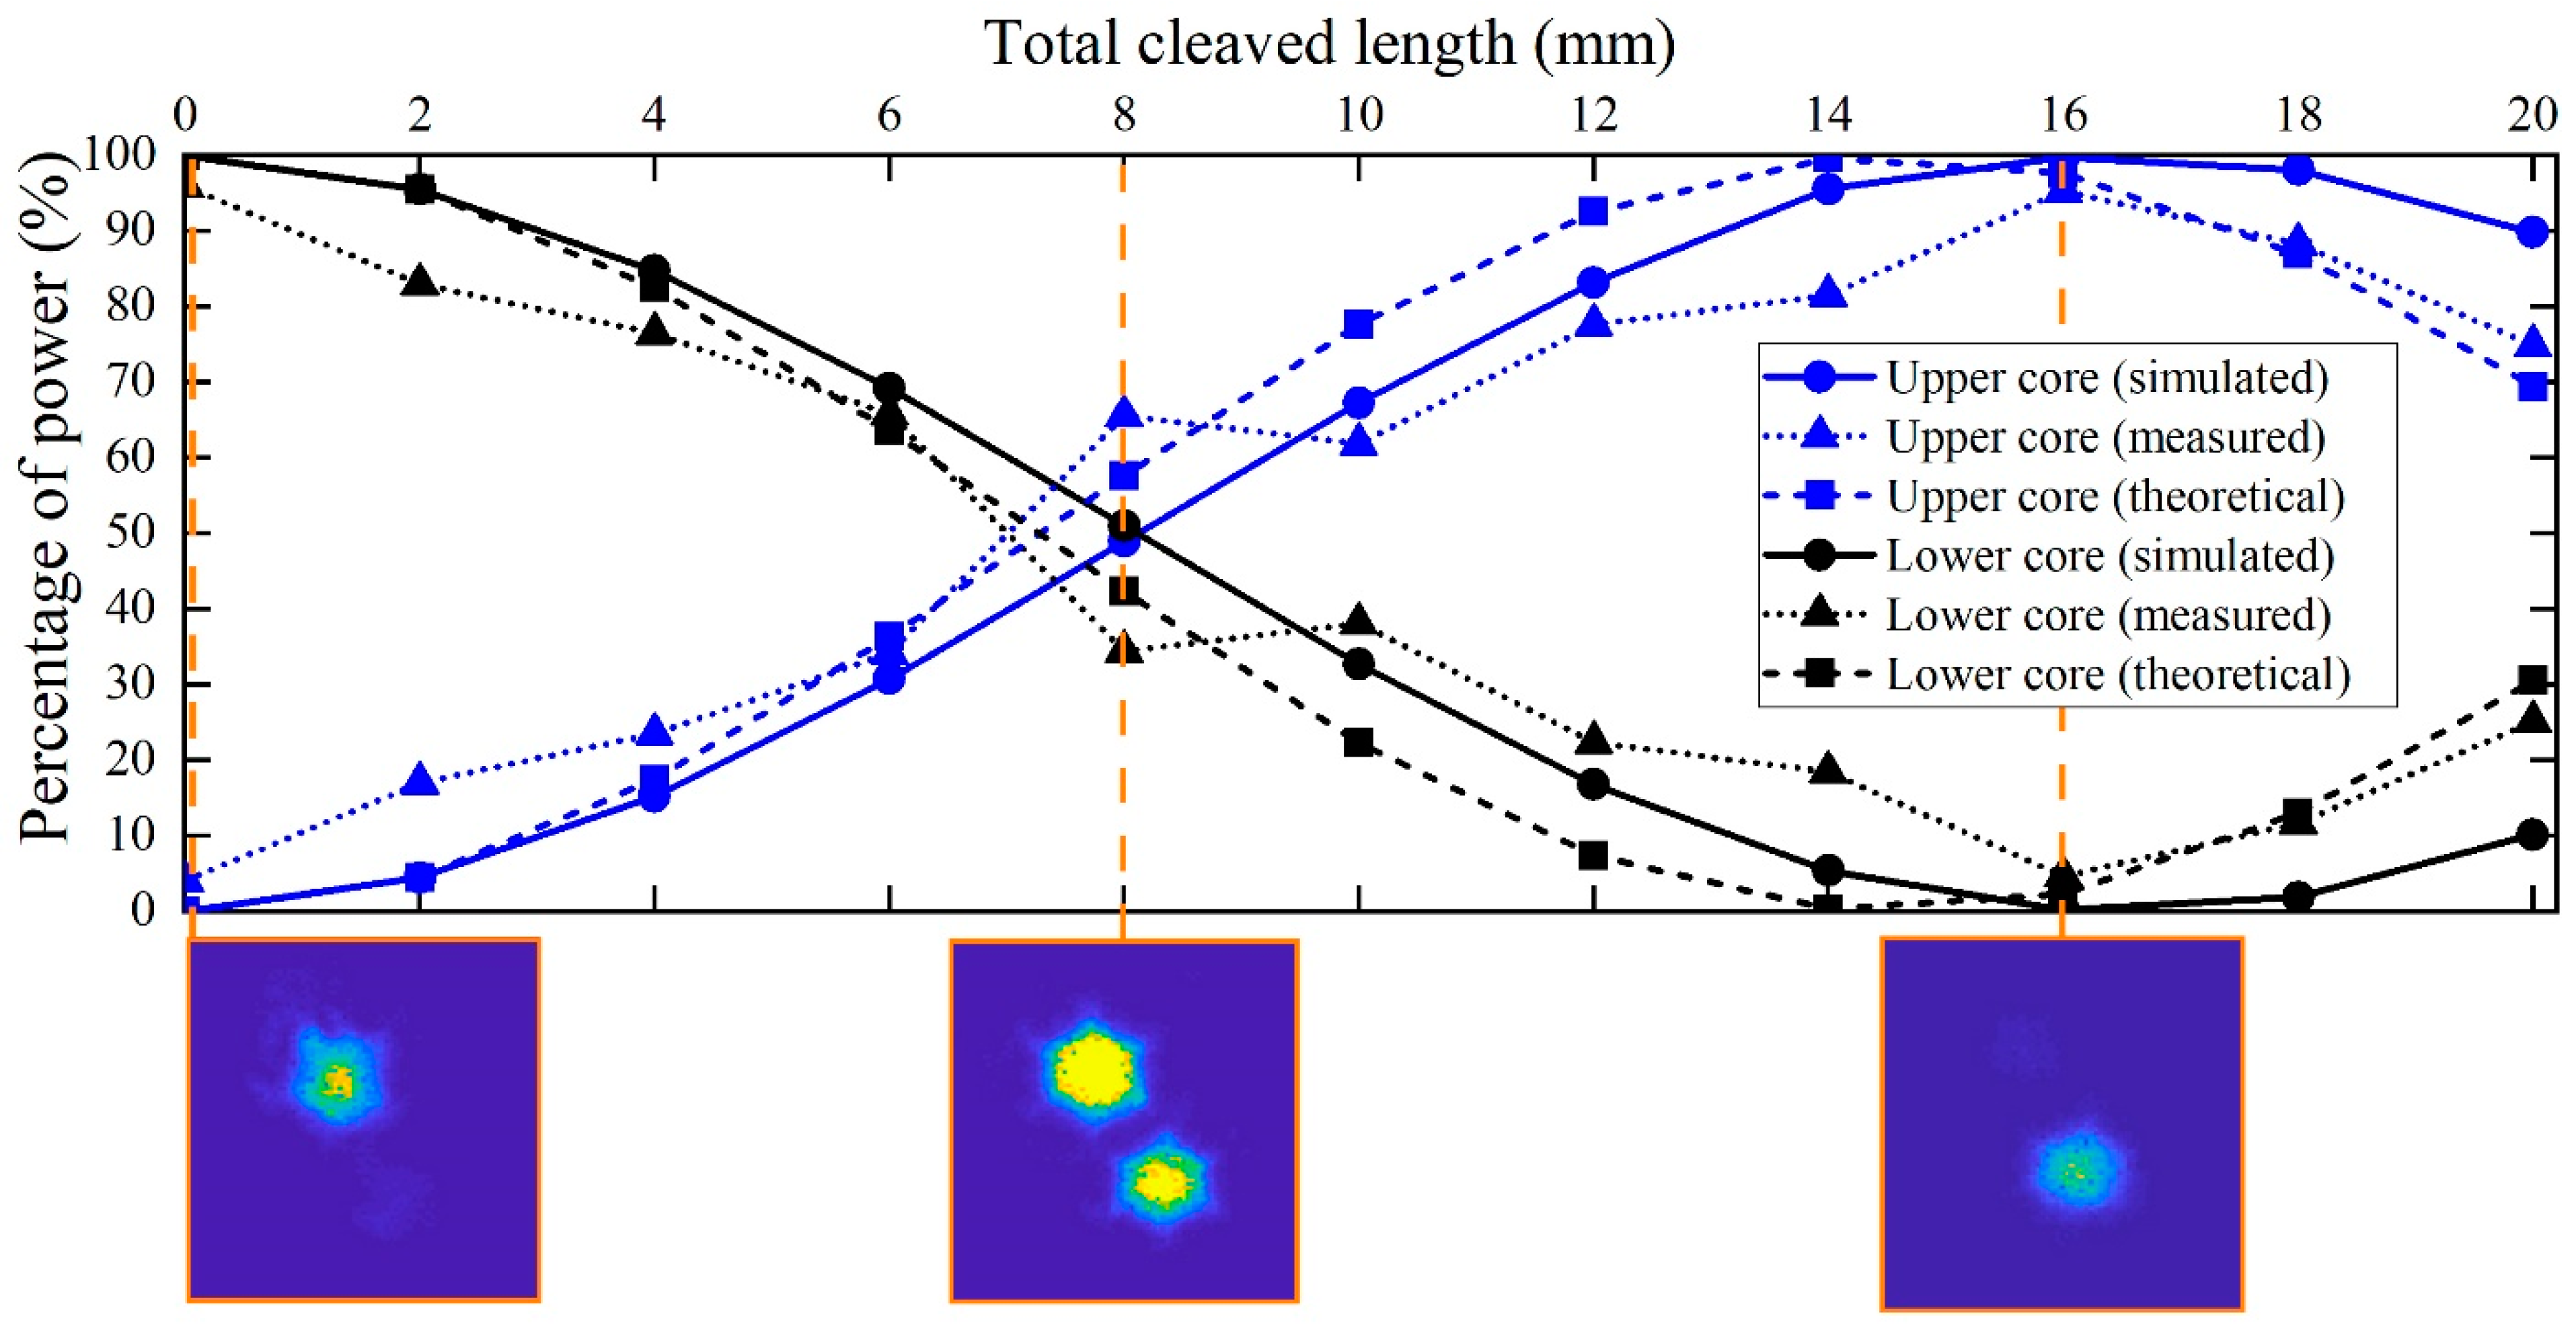
2.5.1. Coupling Length Measurement
2.5.2. Selective Excitation of the mPOF
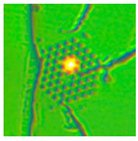
3. Results and Discussion
3.1. Theoretical Results
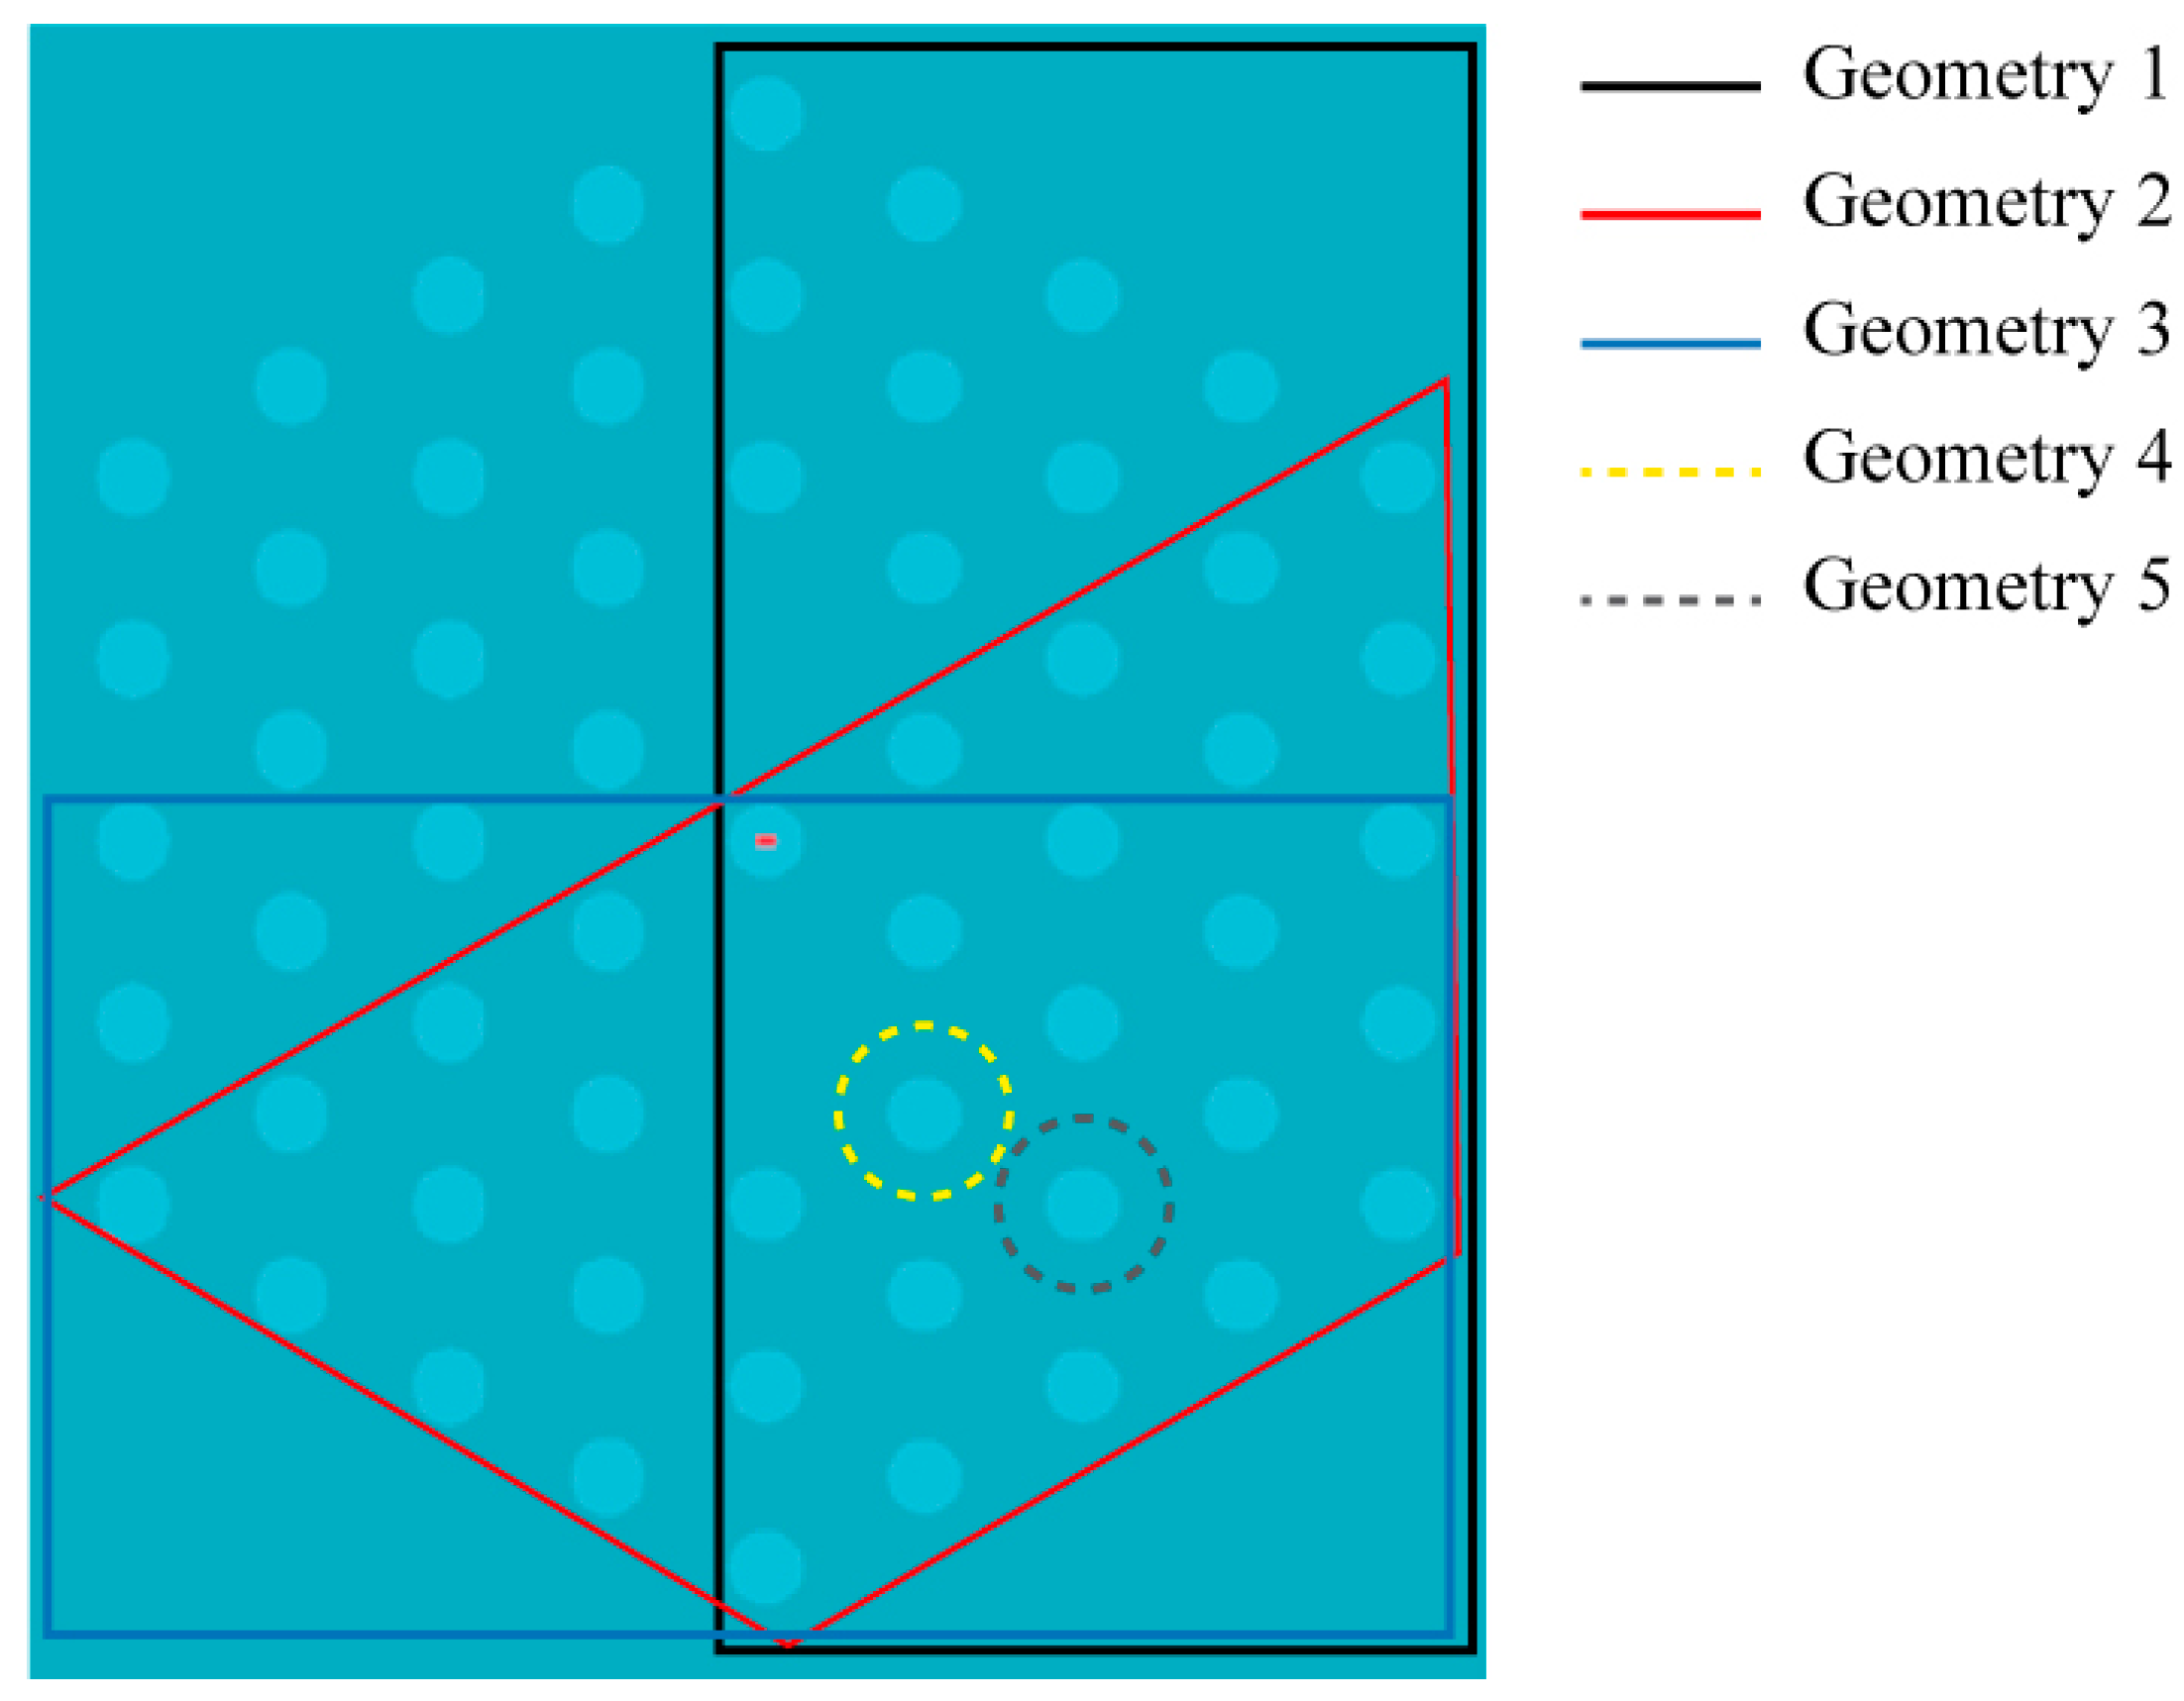
3.2. Simulation Results
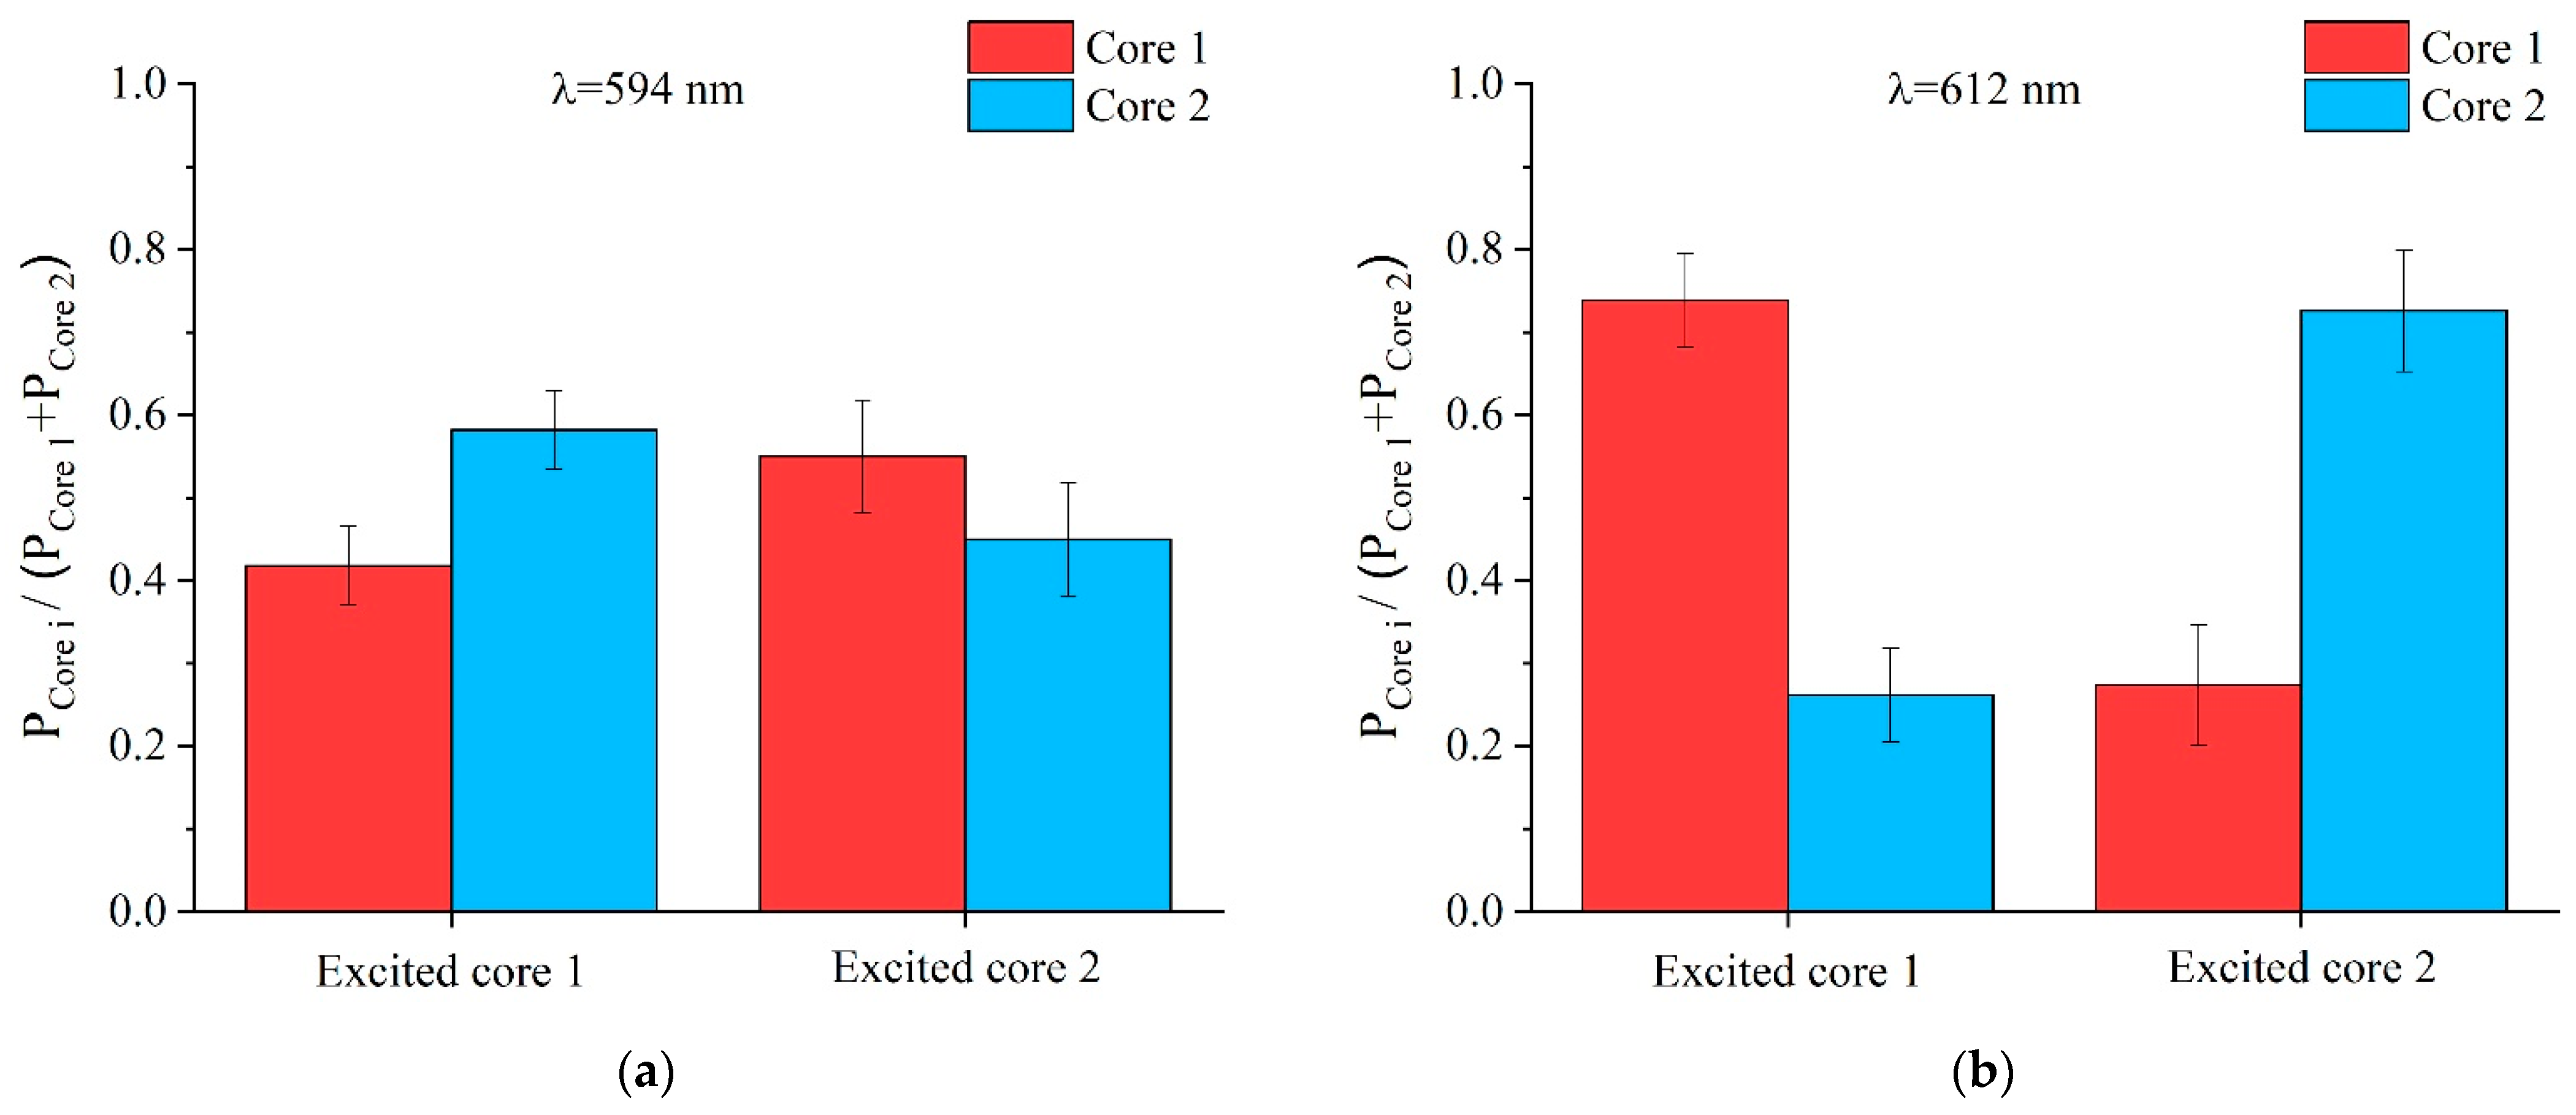
3.3. Experimental Results
4. Conclusions
Author Contributions
Funding
Institutional Review Board Statement
Informed Consent Statement
Data Availability Statement
Acknowledgments
Conflicts of Interest
References
- Azkune, M.; Arrospide, E.; Berganza, A.; Bikandi, I.; Aldabaldetreku, G.; Durana, G.; Zubia, J. A novel liquid-filled microstructured polymer optical fiber as bio-sensing platform for Raman spectroscopy. In Progress in Biomedical Optics and Imaging—Proceedings of SPIE; SPIE: Bellingham, WA, USA, 2018; Volume 10488. [Google Scholar]
- Villatoro, J.; Zubia, J. New perspectives in photonic crystal fibre sensors. Opt. Laser Technol. 2016, 78, 67–75. [Google Scholar] [CrossRef]
- Cubillas, A.M.; Unterkofler, S.; Euser, T.G.; Etzold, B.J.M.; Jones, A.C.; Sadler, P.J.; Wasserscheid, P.; Russell, P.S.J. Photonic crystal fibres for chemical sensing and photochemistry. Chem. Soc. Rev. 2013, 42, 8629–8648. [Google Scholar] [CrossRef] [Green Version]
- Hu, G.; Chen, D. Side-hole dual-core photonic crystal fiber for hydrostatic pressure sensing. J. Light. Technol. 2012, 30, 2382–2387. [Google Scholar] [CrossRef]
- Azman, M.F.; Wong, W.R.; Cader, M.H.M.A.; Aoni, R.A.; Mahdiraji, G.A.; Mahamd Adikan, F.R. Twin-core sunflower-type photonic quasicrystal fibers incorporated gold, silver, and copper microwire: An ultrashort and broad bandwidth polarization splitter. Opt. Quantum Electron. 2019, 51, 164. [Google Scholar] [CrossRef]
- Wang, E.L.; Jiang, H.M.; Xie, K.; Chen, C.; Hu, Z.J. Polarization splitter based on dual core liquid crystal-filled holey fiber. J. Appl. Phys. 2016, 120, 114501. [Google Scholar] [CrossRef]
- Jiang, H.; Wang, E.; Zhang, J.; Hu, L.; Mao, Q.; Li, Q.; Xie, K. Polarization splitter based on dual-core photonic crystal fiber. Opt. Express 2014, 22, 30461. [Google Scholar] [CrossRef] [PubMed]
- Malka, D.; Peled, A. Power splitting of 1 × 16 in multicore photonic crystal fibers. Appl. Surf. Sci. 2017, 417, 34–39. [Google Scholar] [CrossRef]
- Pytel, A.; Napierała, M.; Szostkiewicz, Ł.; Ostrowski, Ł.; Murawski, M.; Mergo, P.; Nasiłowski, T. Optical power 1 × 7 splitter based on multicore fiber technology. Opt. Fiber Technol. 2017, 37, 1–5. [Google Scholar] [CrossRef]
- Padden, W.E.P.; Van Eijkelenborg, M.A.; Argyros, A.; Issa, N.A. Coupling in a Twin-Core Microstructured Polymer Optical Fiber. Appl. Phys. Lett. 2004, 84, 1689–1691. [Google Scholar] [CrossRef] [Green Version]
- Large, M.C.J.; Poladian, L.; Barton, G.W.; Van Eijkelenborg, M.A. Microstructured Polymer Optical Fibres; Springer: Berlin/Heidelberg, Germany, 2008; ISBN 9780387312736. [Google Scholar]
- Knight, J.C. Photonic crystal fibres. Nature 2003, 424, 847–851. [Google Scholar] [CrossRef]
- Vasko, K.; Debord, B.; Rosa, L.; Vincetti, L.; Benabid, F. Hybrid inhibited-coupling and photonic bandgap hollow core fiber for telecom wavelength range. In Proceedings of the Conference on Lasers and Electro-Optics (2021), San Jose, CA, USA, 9–14 May 2021; The Optical Society of America: Washington, DC, USA, 2021; p. JW1A.28. [Google Scholar]
- Belardi, W.; Knight, J.C. Hollow antiresonant fibers with reduced attenuation. Opt. Lett. 2014, 39, 1853. [Google Scholar] [CrossRef] [PubMed] [Green Version]
- Beckers, M.; Schlüter, T.; Gries, T.; Seide, G.; Bunge, C.A. Fabrication techniques for polymer optical fibres. In Polymer Optical Fibres; Woodhead Publishing: Amsterdam, The Netherlands, 2016; pp. 187–199. [Google Scholar] [CrossRef]
- Cook, K.; Canning, J.; Leon-Saval, S.; Reid, Z.; Hossain, M.A.; Comatti, J.-E.; Luo, Y.; Peng, G.-D. Air-structured optical fiber drawn from a 3D-printed preform. Opt. Lett. 2015, 40, 3966. [Google Scholar] [CrossRef] [PubMed] [Green Version]
- Talataisong, W.; Ismaeel, R.; Marques, T.H.R.; Abokhamis Mousavi, S.; Beresna, M.; Gouveia, M.A.; Sandoghchi, S.R.; Lee, T.; Cordeiro, C.M.B.; Brambilla, G. Mid-IR Hollow-core microstructured fiber drawn from a 3D printed PETG preform. Sci. Rep. 2018, 8, 1–8. [Google Scholar] [CrossRef] [Green Version]
- Feng, X.; Monro, T.; Petropoulos, P.; Finazzi, V.; Hewak, D. Solid microstructured optical fiber. Opt. Express 2003, 11, 2225. [Google Scholar] [CrossRef] [PubMed] [Green Version]
- Arrospide, E.; Bikandi, I.; Larrañaga, I.; Cearsolo, X.; Zubia, J.; Durana, G. Harnessing Deep-Hole Drilling to Fabricate Air-Structured Polymer Optical Fibres. Polymers 2019, 11, 1739. [Google Scholar] [CrossRef] [Green Version]
- Zubia, J.; Arrue, J. Plastic optical fibers: An introduction to their technological processes and applications. Opt. Fiber Technol. 2001, 7, 101–140. [Google Scholar] [CrossRef]
- Koike, Y.; Koike, K. Progress in low-loss and high-bandwidth plastic optical fibers. J. Polym. Sci. Part B Polym. Phys. 2011, 49, 2–17. [Google Scholar] [CrossRef]
- Sójka, L.; Pajewski, L.; Śliwa, M.; Mergo, P.; Benson, T.M.; Sujecki, S.; Bereś-Pawlik, E. Multicore microstructured optical fibre for sensing applications. Opt. Commun. 2015, 344, 71–76. [Google Scholar] [CrossRef]
- Antonio-Lopez, J.E.; Eznaveh, Z.S.; LiKamWa, P.; Schülzgen, A.; Amezcua-Correa, R. Multicore fiber sensor for high-temperature applications up to 1000 °C. Opt. Lett. 2014, 39, 4309. [Google Scholar] [CrossRef]
- Kowal, D.; Urbanczyk, W.; Mergo, P. Twin-Core Fiber-Based Mach Zehnder Interferometer for Simultaneous Measurement of Strain and Temperature. Sensors 2018, 18, 915. [Google Scholar] [CrossRef] [Green Version]
- Feng, S.; Li, H.; Xu, O.; Lu, S.; Jian, S. Compact in-fiber Mach-Zehnder interferometer using a twin-core fiber. In Proceedings of the 2009 Asia Communications and Photonics Conference and Exhibition (ACP), Shanghai, China, 2–6 November 2009. [Google Scholar] [CrossRef]
- Rugeland, P.; Margulis, W. Revisiting twin-core fiber sensors for high-temperature measurements. Appl. Opt. 2012, 51, 6227–6232. [Google Scholar] [CrossRef]
- Zhou, A.; Guan, C.; Li, G.; Yang, J.; Yuan, L.; Zhang, Y.; Wang, Y. Asymmetrical Twin-Core Fiber Based Michelson Interferometer for Refractive Index Sensing. J. Light. Technol. 2011, 29, 2985–2991. [Google Scholar] [CrossRef]
- Plexiglas-Shop. Available online: https://www.plexiglas.de/files/plexiglas-content/pdf/technische-informationen/211-1-EN-PLEXIGLAS-GS-XT.pdf (accessed on 8 November 2021).
- Argyros, A. Microstructures in Polymer Fibres for Optical Fibres, THz Waveguides, and Fibre-Based Metamaterials. ISRN Opt. 2013, 2013, 785162. [Google Scholar] [CrossRef]
- Arrospide, E.; Durana, G.; Azkune, M.; Aldabaldetreku, G.; Bikandi, I.; Ruiz-Rubio, L.; Zubia, J. Polymers beyond standard optical fibres—fabrication of microstructured polymer optical fibres. Polym. Int. 2018, 67, 1155–1163. [Google Scholar] [CrossRef]
- Single Flute Gundrill—Botek. Available online: https://www.botek.de/en/products/single-flute-gundrill/ (accessed on 8 July 2021).
- Biermann, D.; Heilmann, M.; Kirschnera, M. Analysis of the influence of tool geometry on surface integrity in single-lip deep hole drilling with small diameters. Procedia Eng. 2011, 19, 16–21. [Google Scholar] [CrossRef] [Green Version]
- Kuhlmey, B.T.; McPhedran, R.C.; de Sterke, C.M. Modal cutoff in microstructured optical fibers. Opt. Lett. 2002, 27, 1684. [Google Scholar] [CrossRef] [PubMed]
- Snyder, A.W.; Love, J.D. Modes of perturbed fibers. In Optical Waveguide Theory; Springer: Berlin/Heidelberg, Germany, 1983; pp. 374–406. [Google Scholar]
- Li, Y.; Wang, C.; Chen, Y.; Hu, M.; Liu, B.; Chai, L. Solution of the fundamental space-filling mode of photonic crystal fibers: Numerical method versus analytical approaches. Appl. Phys. B Lasers Opt. 2006, 85, 597–601. [Google Scholar] [CrossRef]
- Zolla, F.; Renversez, G.; Nicolet, A.; Kuhlmey, B.; Guenneau, S.; Felbacq, D. Foundations of Photonic Crystal Fibres; Imperial College Press: London, UK, 2005; ISBN 9781860946547. [Google Scholar]
- Yu, X.; Liu, M.; Chung, Y.; Yan, M.; Shum, P. Coupling coefficient of two-core microstructured optical fiber. Opt. Commun. 2006, 260, 164–169. [Google Scholar] [CrossRef]
- Optical Waveguide Design Software—Lumerical MODE. Available online: https://www.lumerical.com/products/mode/ (accessed on 13 July 2021).
- Laser Beam Profiler LEPAS 12. Available online: https://usermanual.wiki/m/64d5c1a117c8a5c8159343b27869d6908026cd9551ea478dbafc3f538c94f074.pdf (accessed on 8 November 2021).


| Excited Core | λ = 594 nm | λ = 612 nm |
|---|---|---|
 | 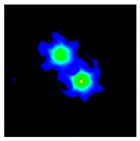 |  |
 |  | 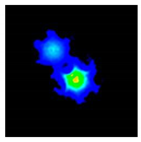 |
Publisher’s Note: MDPI stays neutral with regard to jurisdictional claims in published maps and institutional affiliations. |
© 2021 by the authors. Licensee MDPI, Basel, Switzerland. This article is an open access article distributed under the terms and conditions of the Creative Commons Attribution (CC BY) license (https://creativecommons.org/licenses/by/4.0/).
Share and Cite
Berganza, A.; Arrospide, E.; Amorebieta, J.; Zubia, J.; Durana, G. Fabrication Quality Assessment Based on the Coupling of a Dual-Core Microstructured Polymer Optical Fiber. Sensors 2021, 21, 7435. https://doi.org/10.3390/s21227435
Berganza A, Arrospide E, Amorebieta J, Zubia J, Durana G. Fabrication Quality Assessment Based on the Coupling of a Dual-Core Microstructured Polymer Optical Fiber. Sensors. 2021; 21(22):7435. https://doi.org/10.3390/s21227435
Chicago/Turabian StyleBerganza, Amaia, Eneko Arrospide, Josu Amorebieta, Joseba Zubia, and Gaizka Durana. 2021. "Fabrication Quality Assessment Based on the Coupling of a Dual-Core Microstructured Polymer Optical Fiber" Sensors 21, no. 22: 7435. https://doi.org/10.3390/s21227435
APA StyleBerganza, A., Arrospide, E., Amorebieta, J., Zubia, J., & Durana, G. (2021). Fabrication Quality Assessment Based on the Coupling of a Dual-Core Microstructured Polymer Optical Fiber. Sensors, 21(22), 7435. https://doi.org/10.3390/s21227435