
Application of Laser-Induced, Deep UV Raman Spectroscopy and Artificial Intelligence in Real-Time Environmental Monitoring—Solutions and First Results

 , , , and
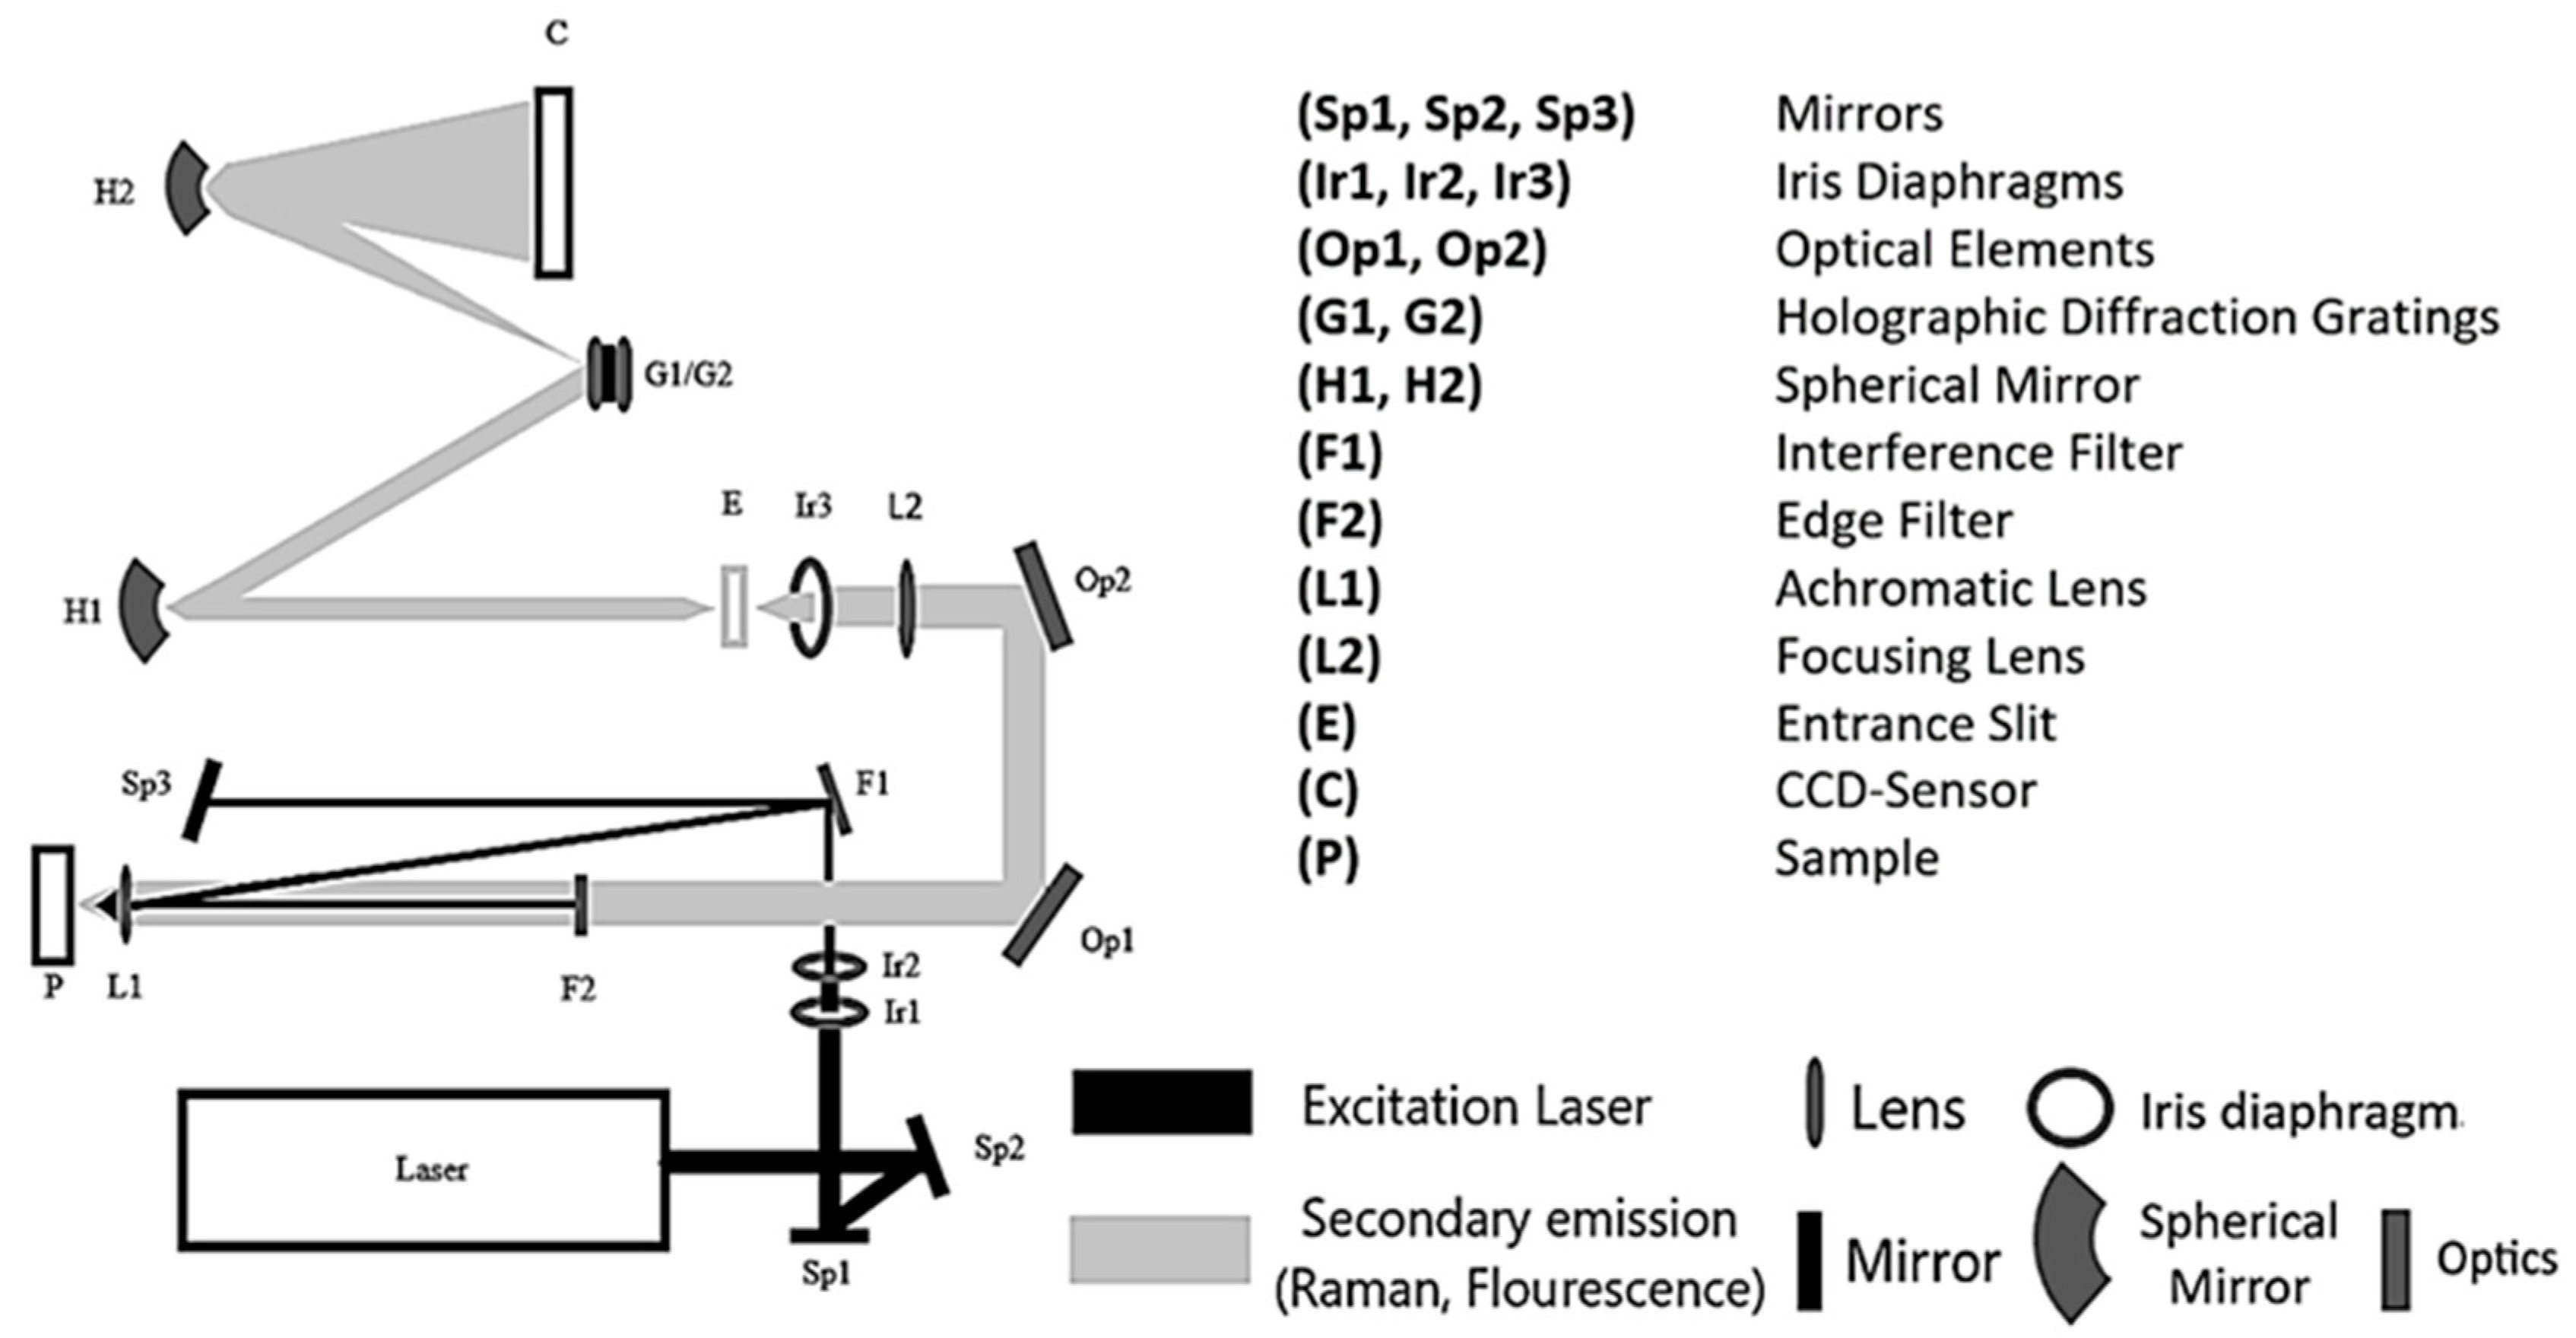
Abstract
1. Introduction
2. Laser-Induced DUV Raman/Fluorescence Spectroscopy
3. Material and Methods
3.1. Substances of Interest
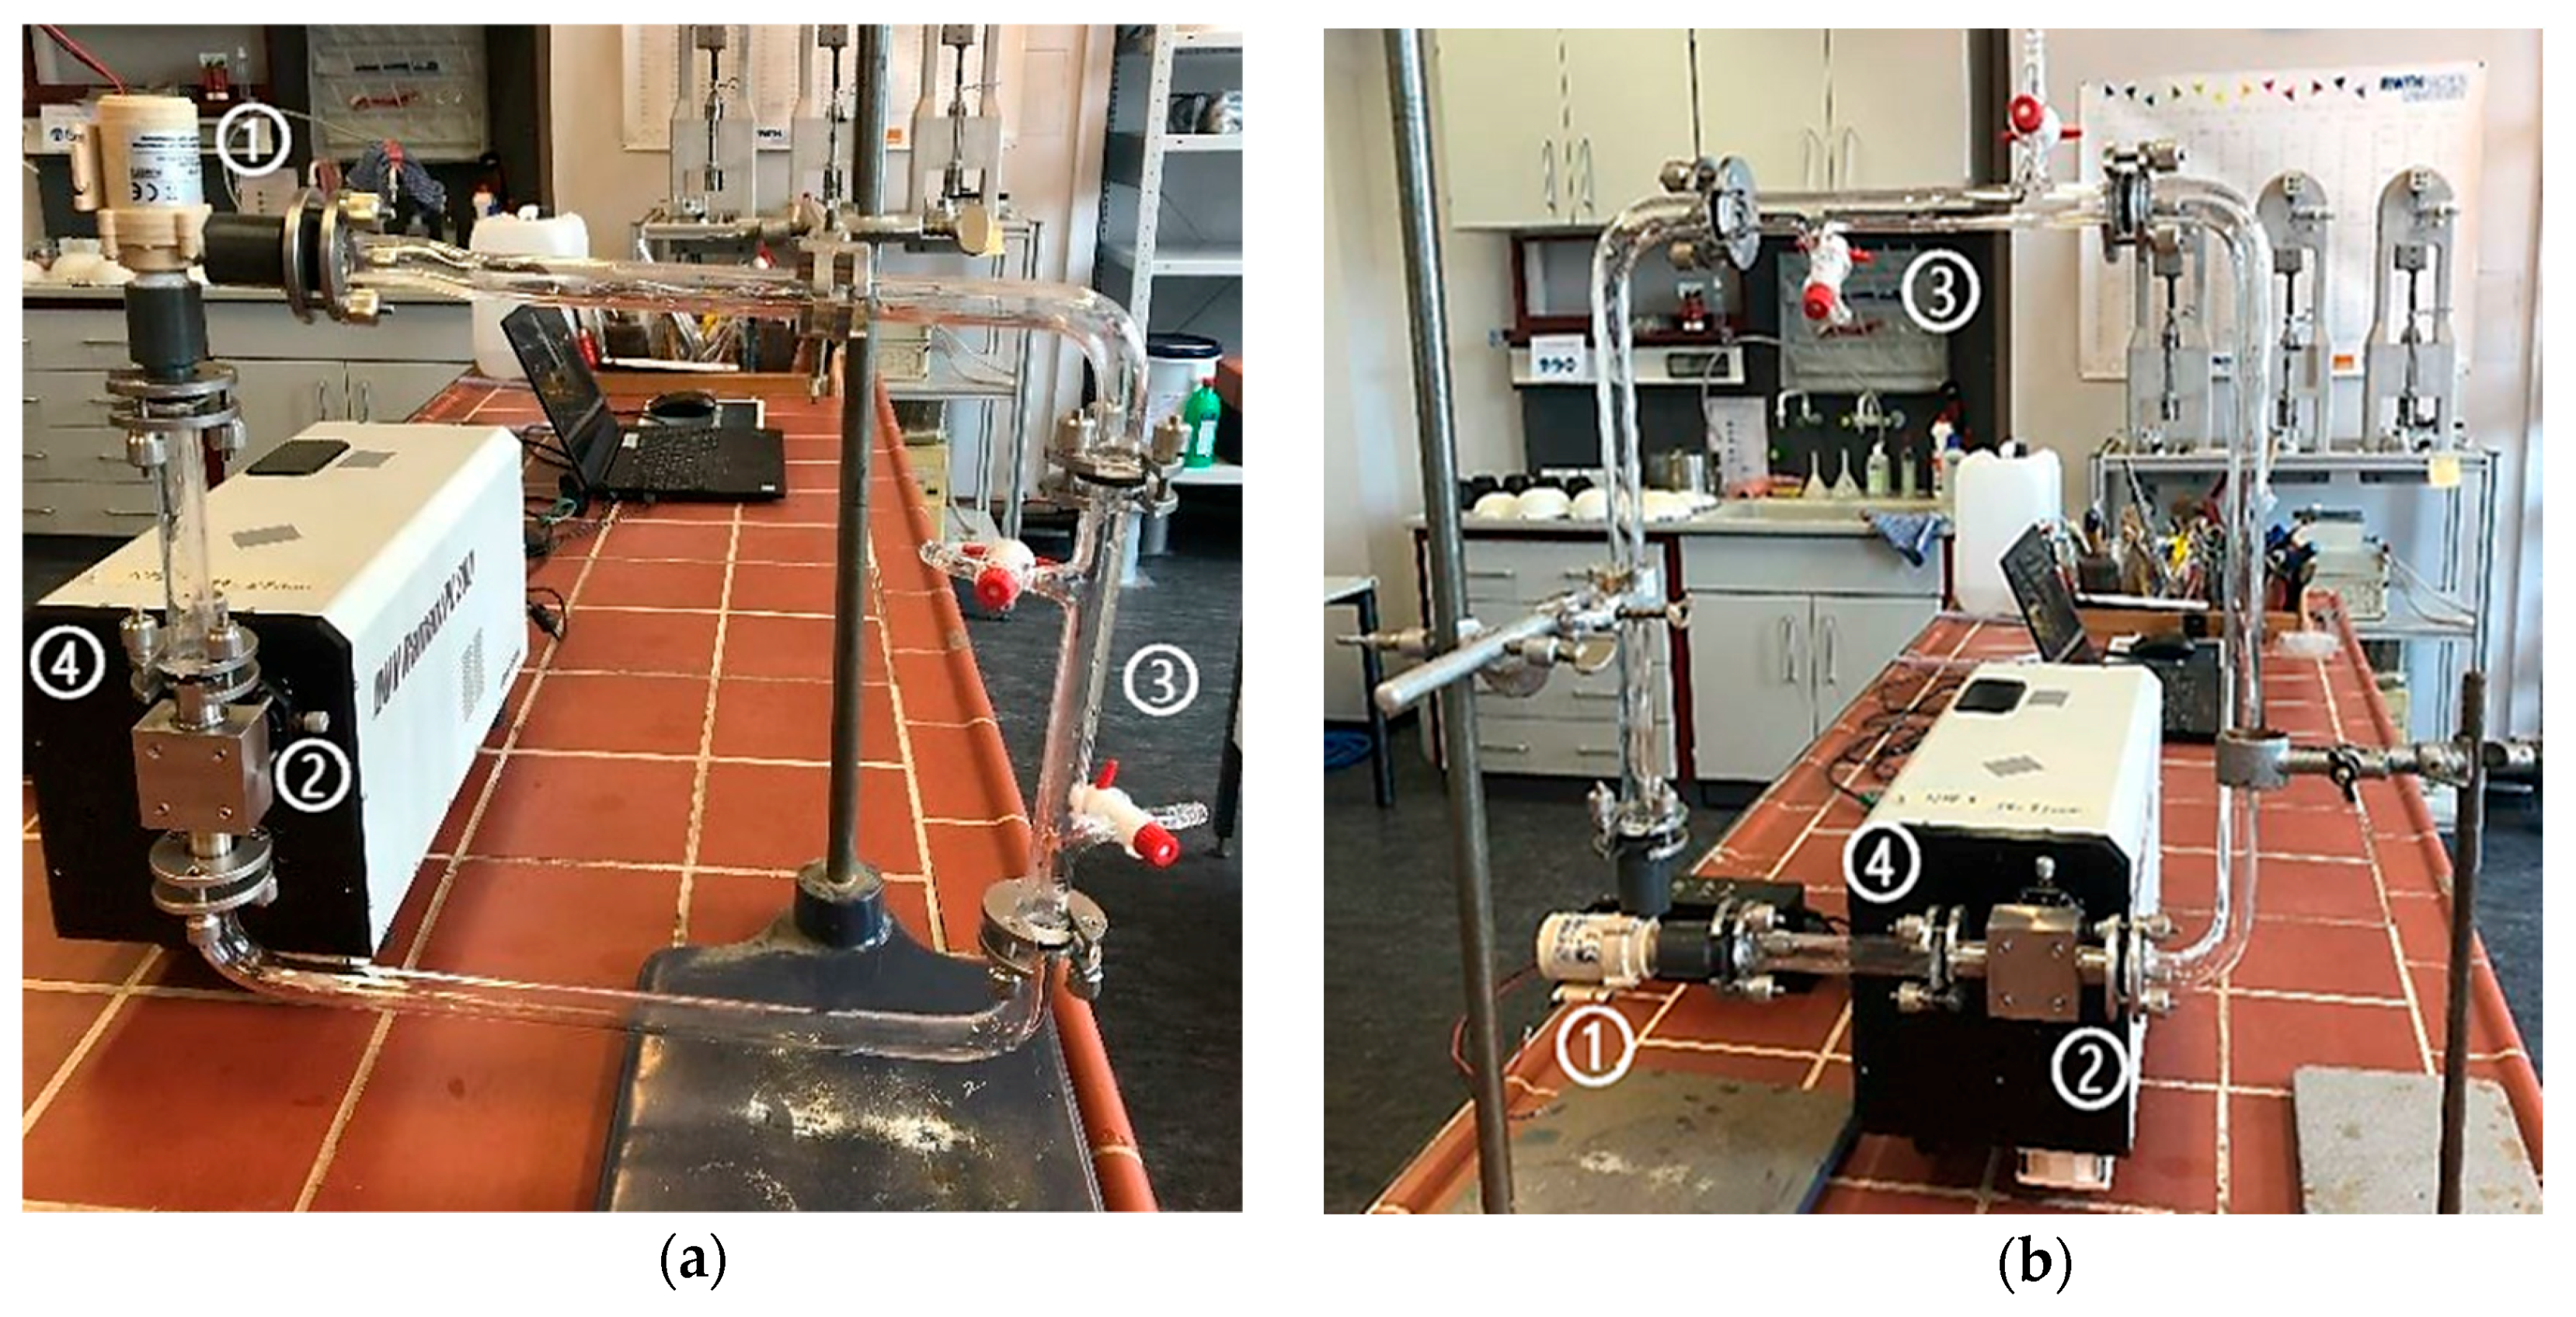
3.2. Measurement, Preparation, and Experimental Strategy
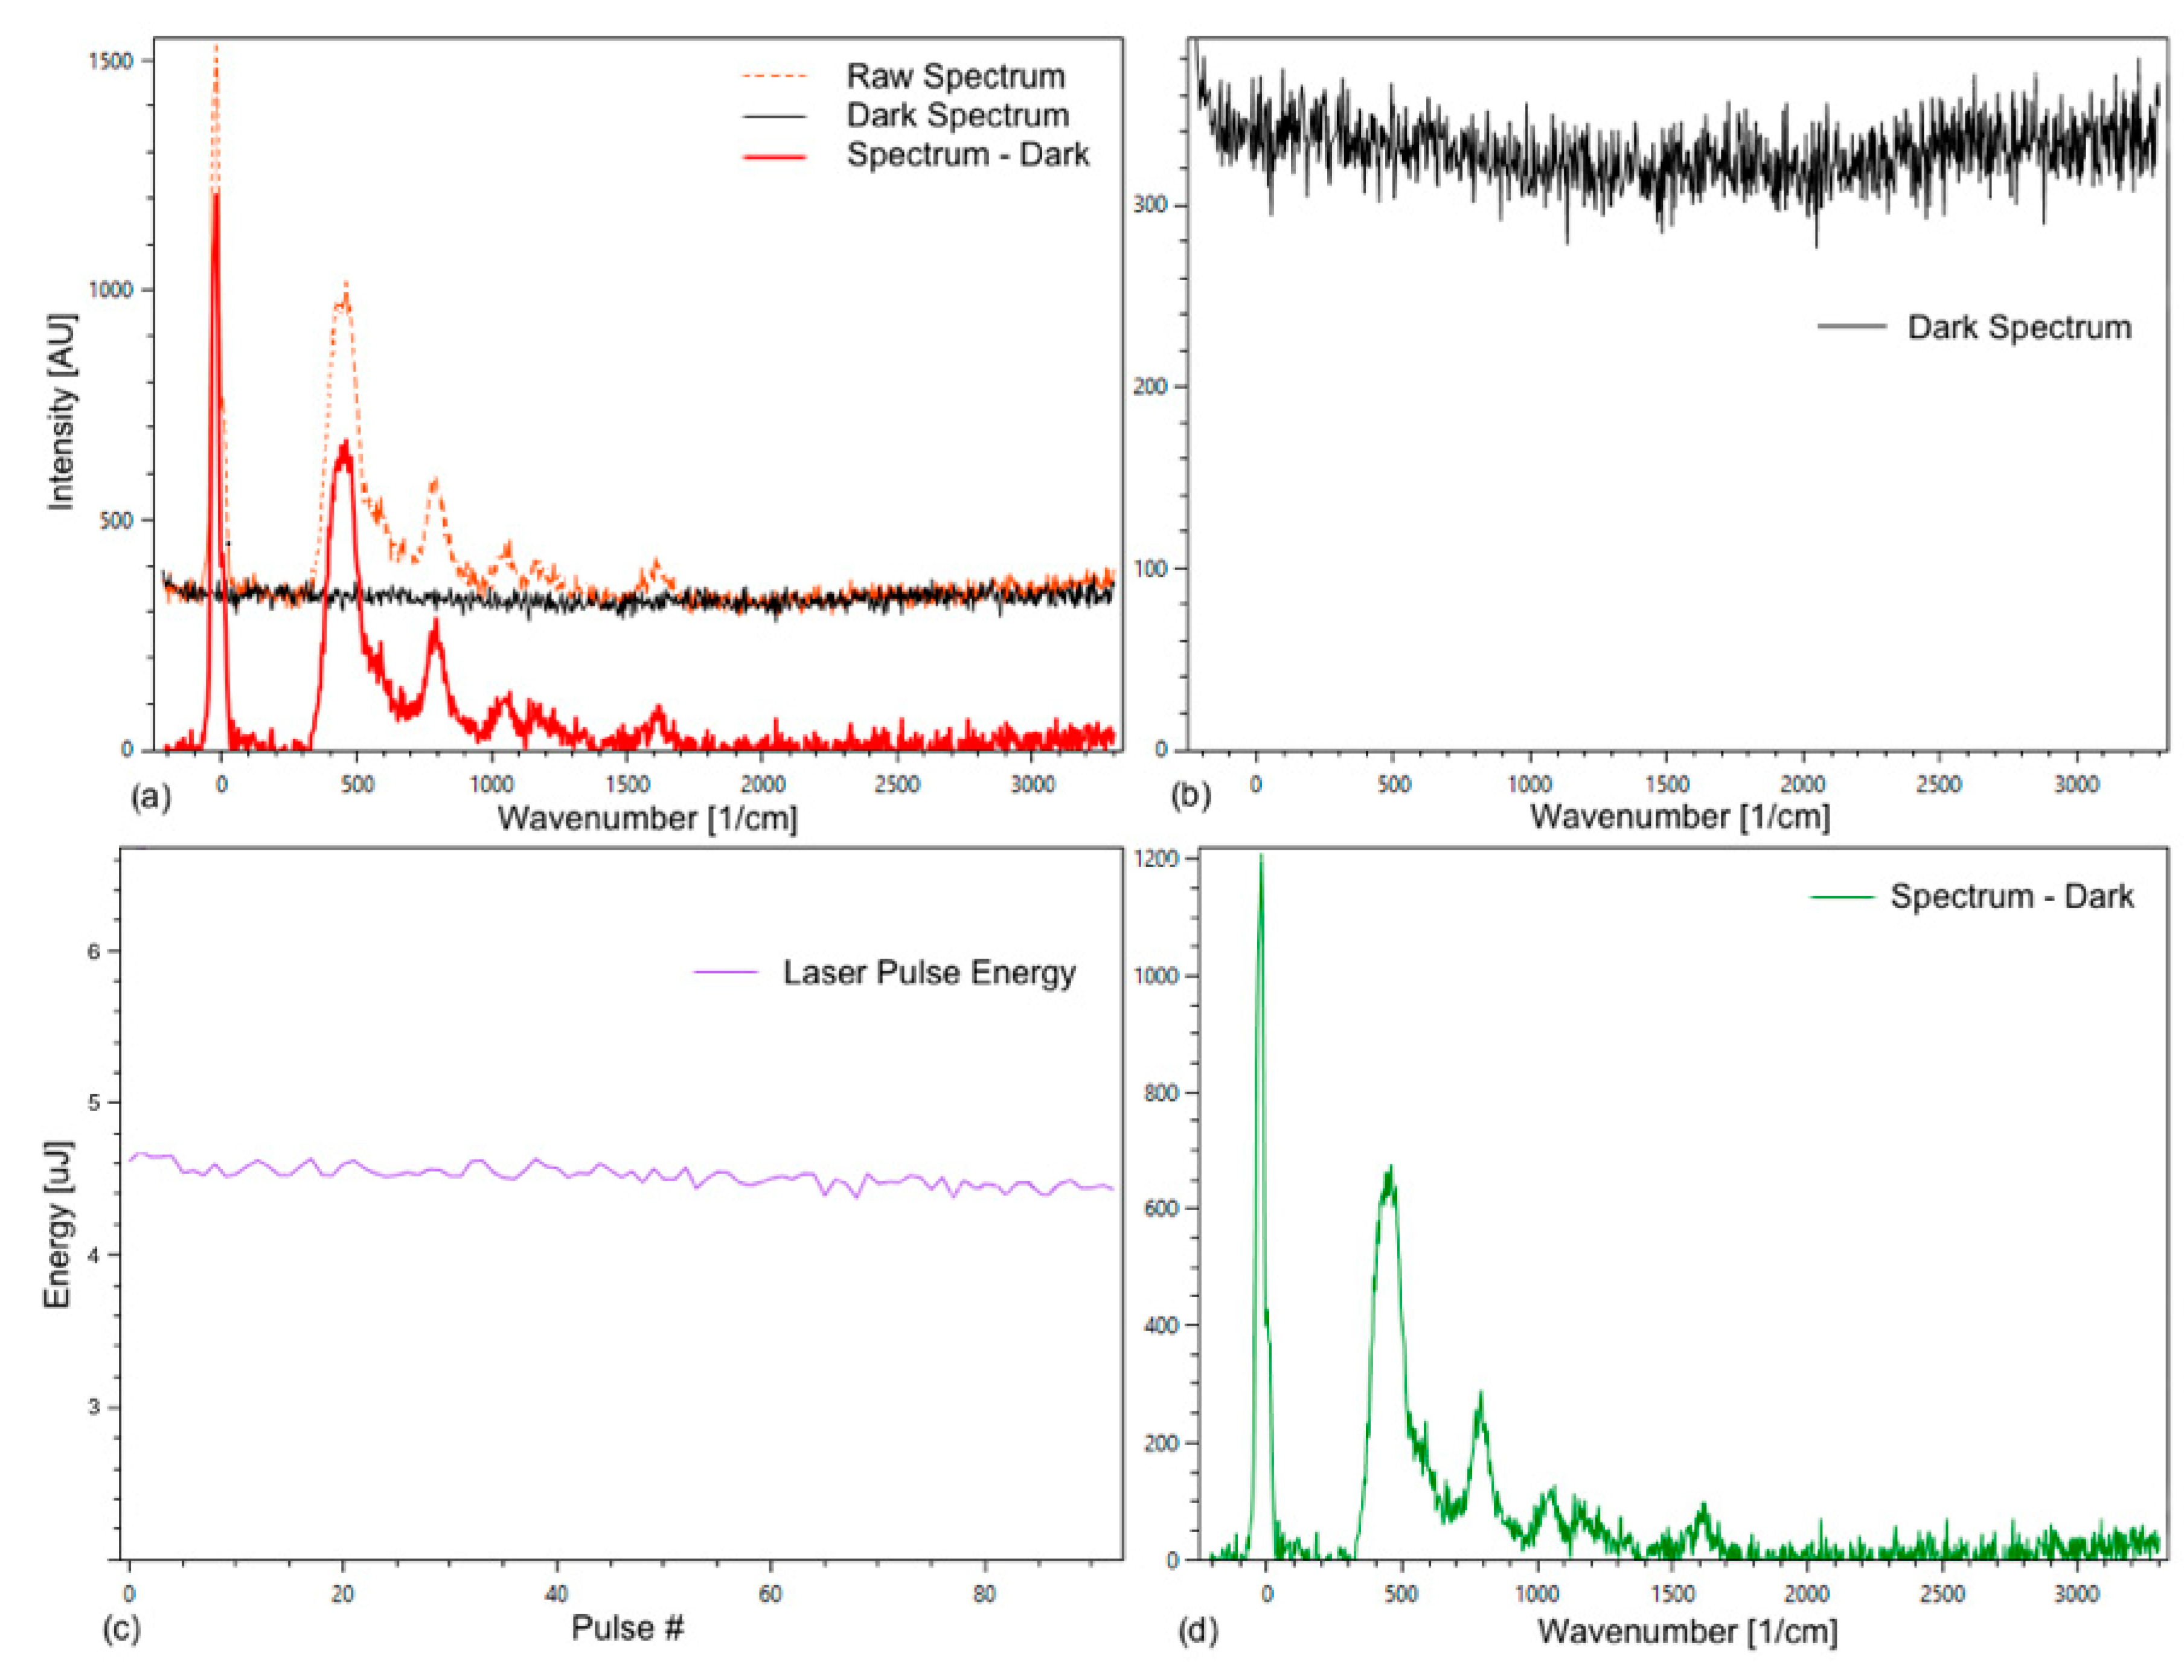
4. Data Processing
Machine Learning
5. Results and Discussion
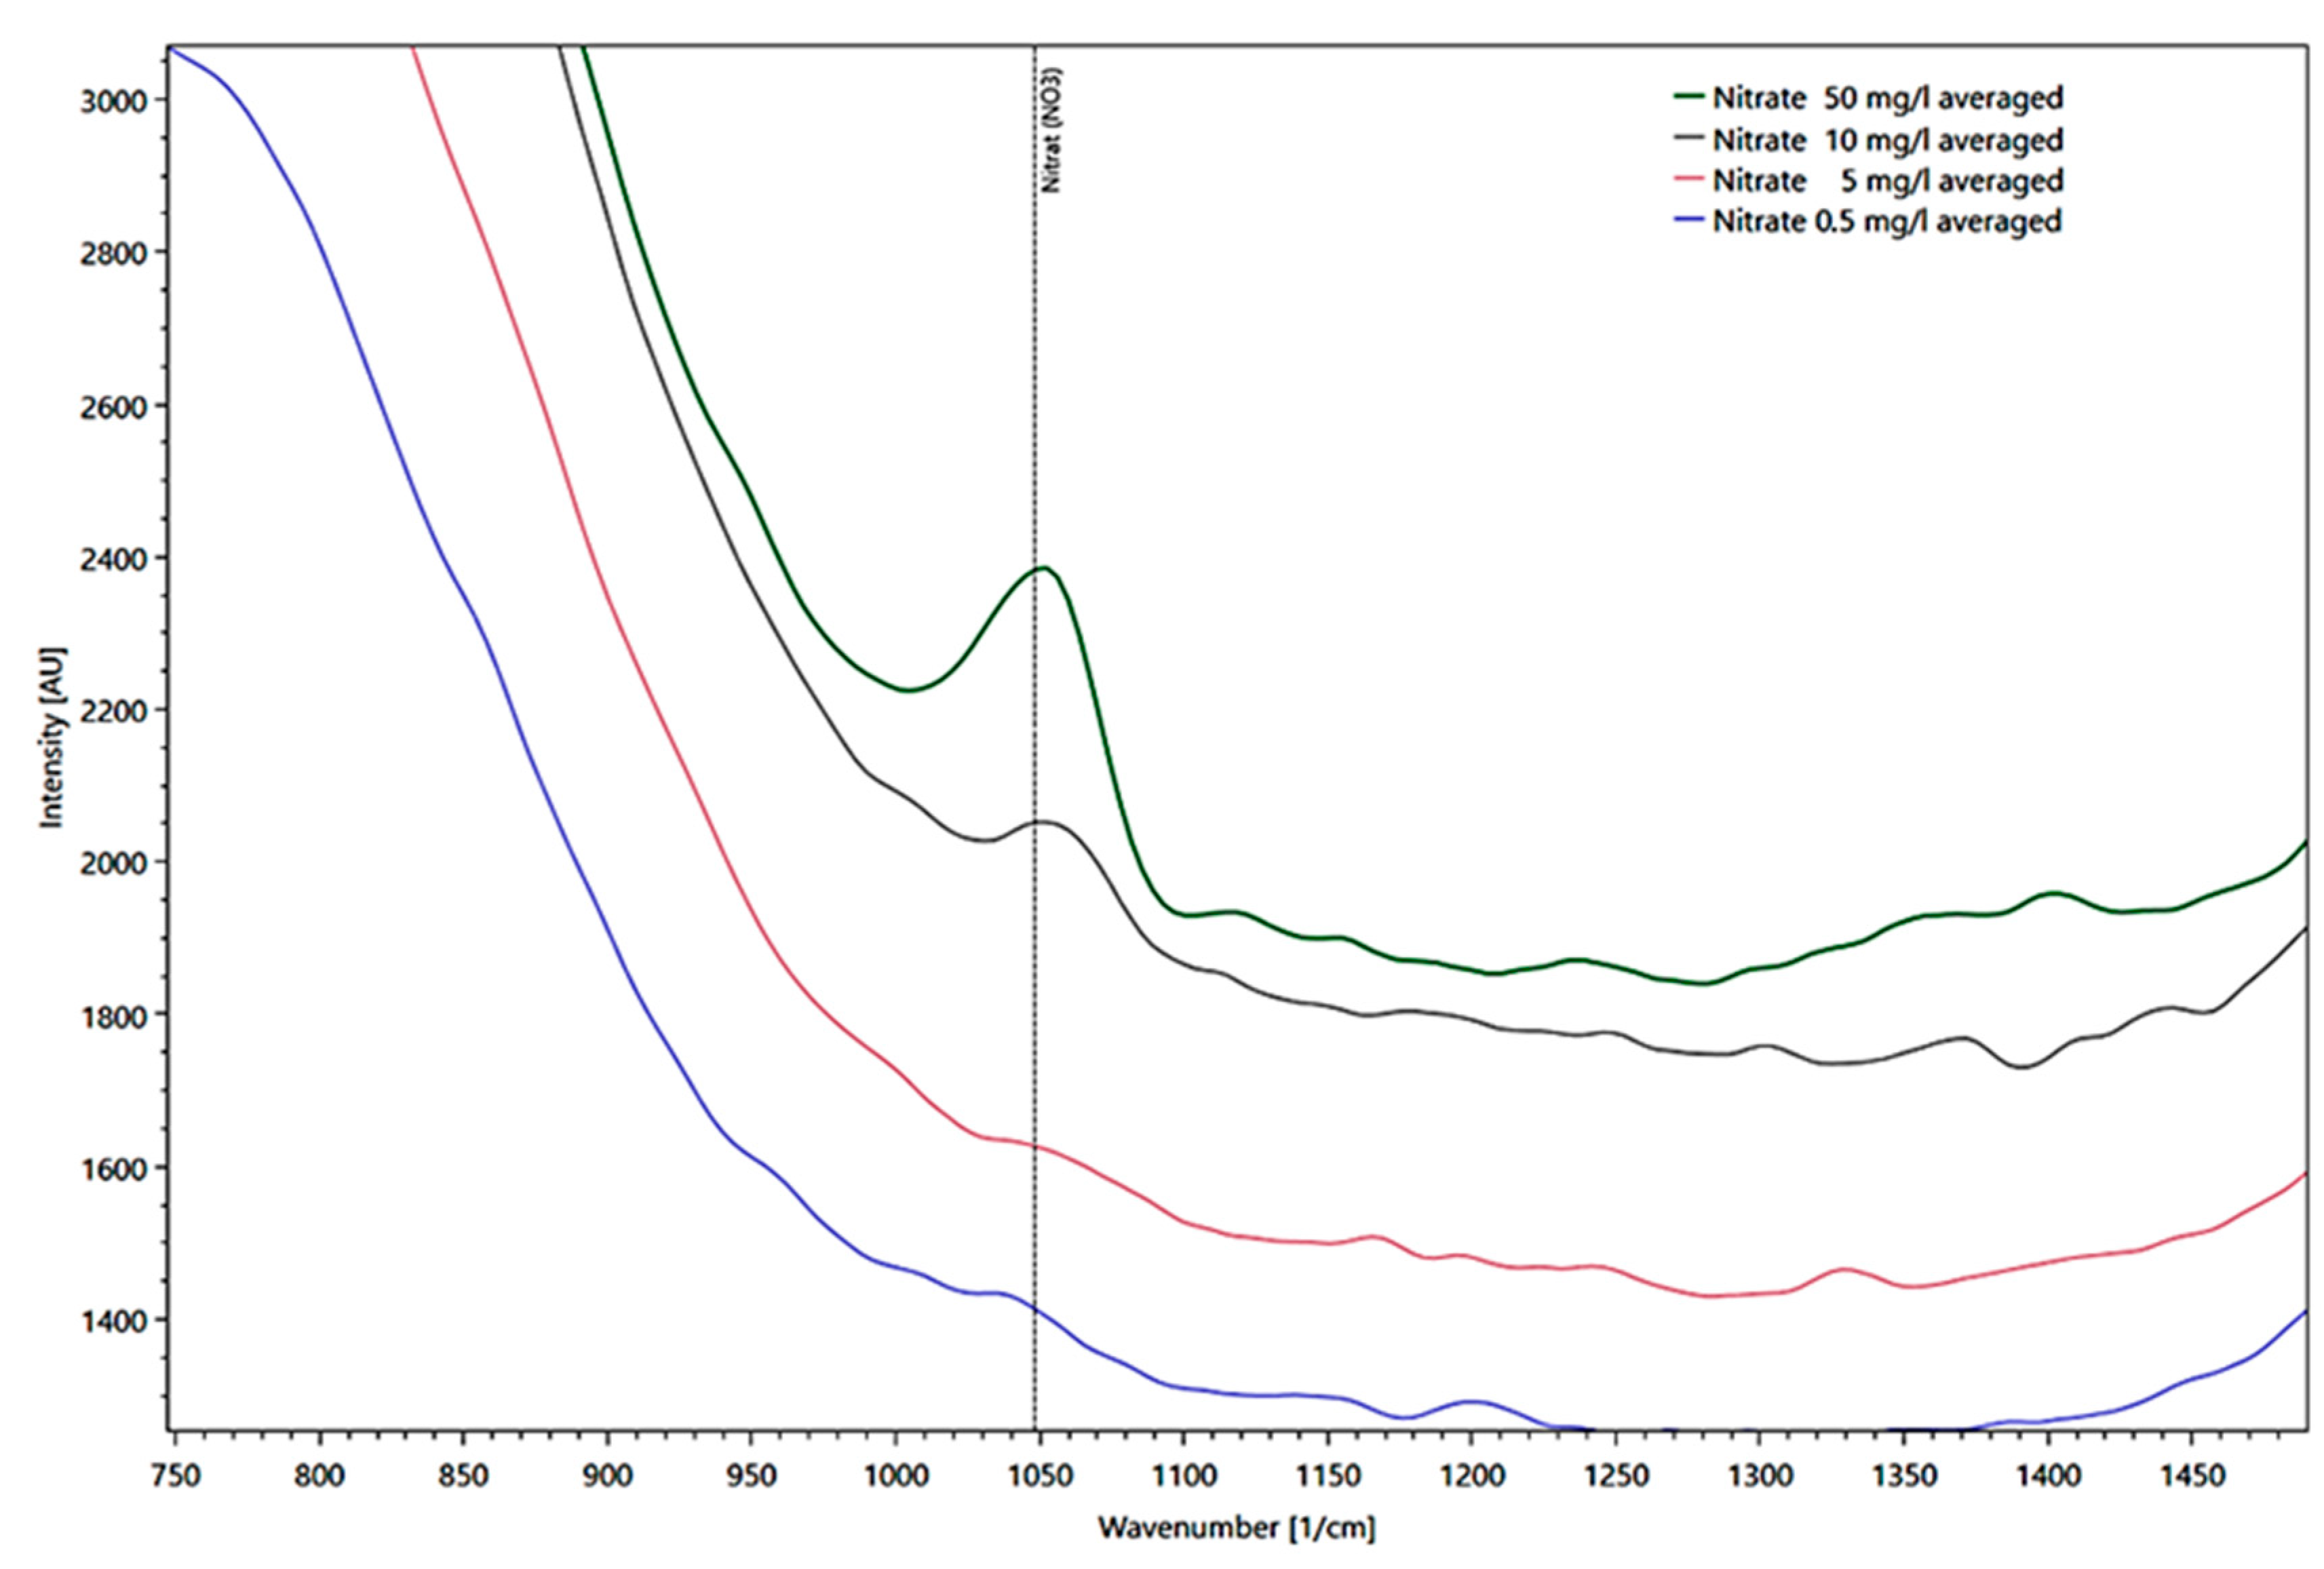
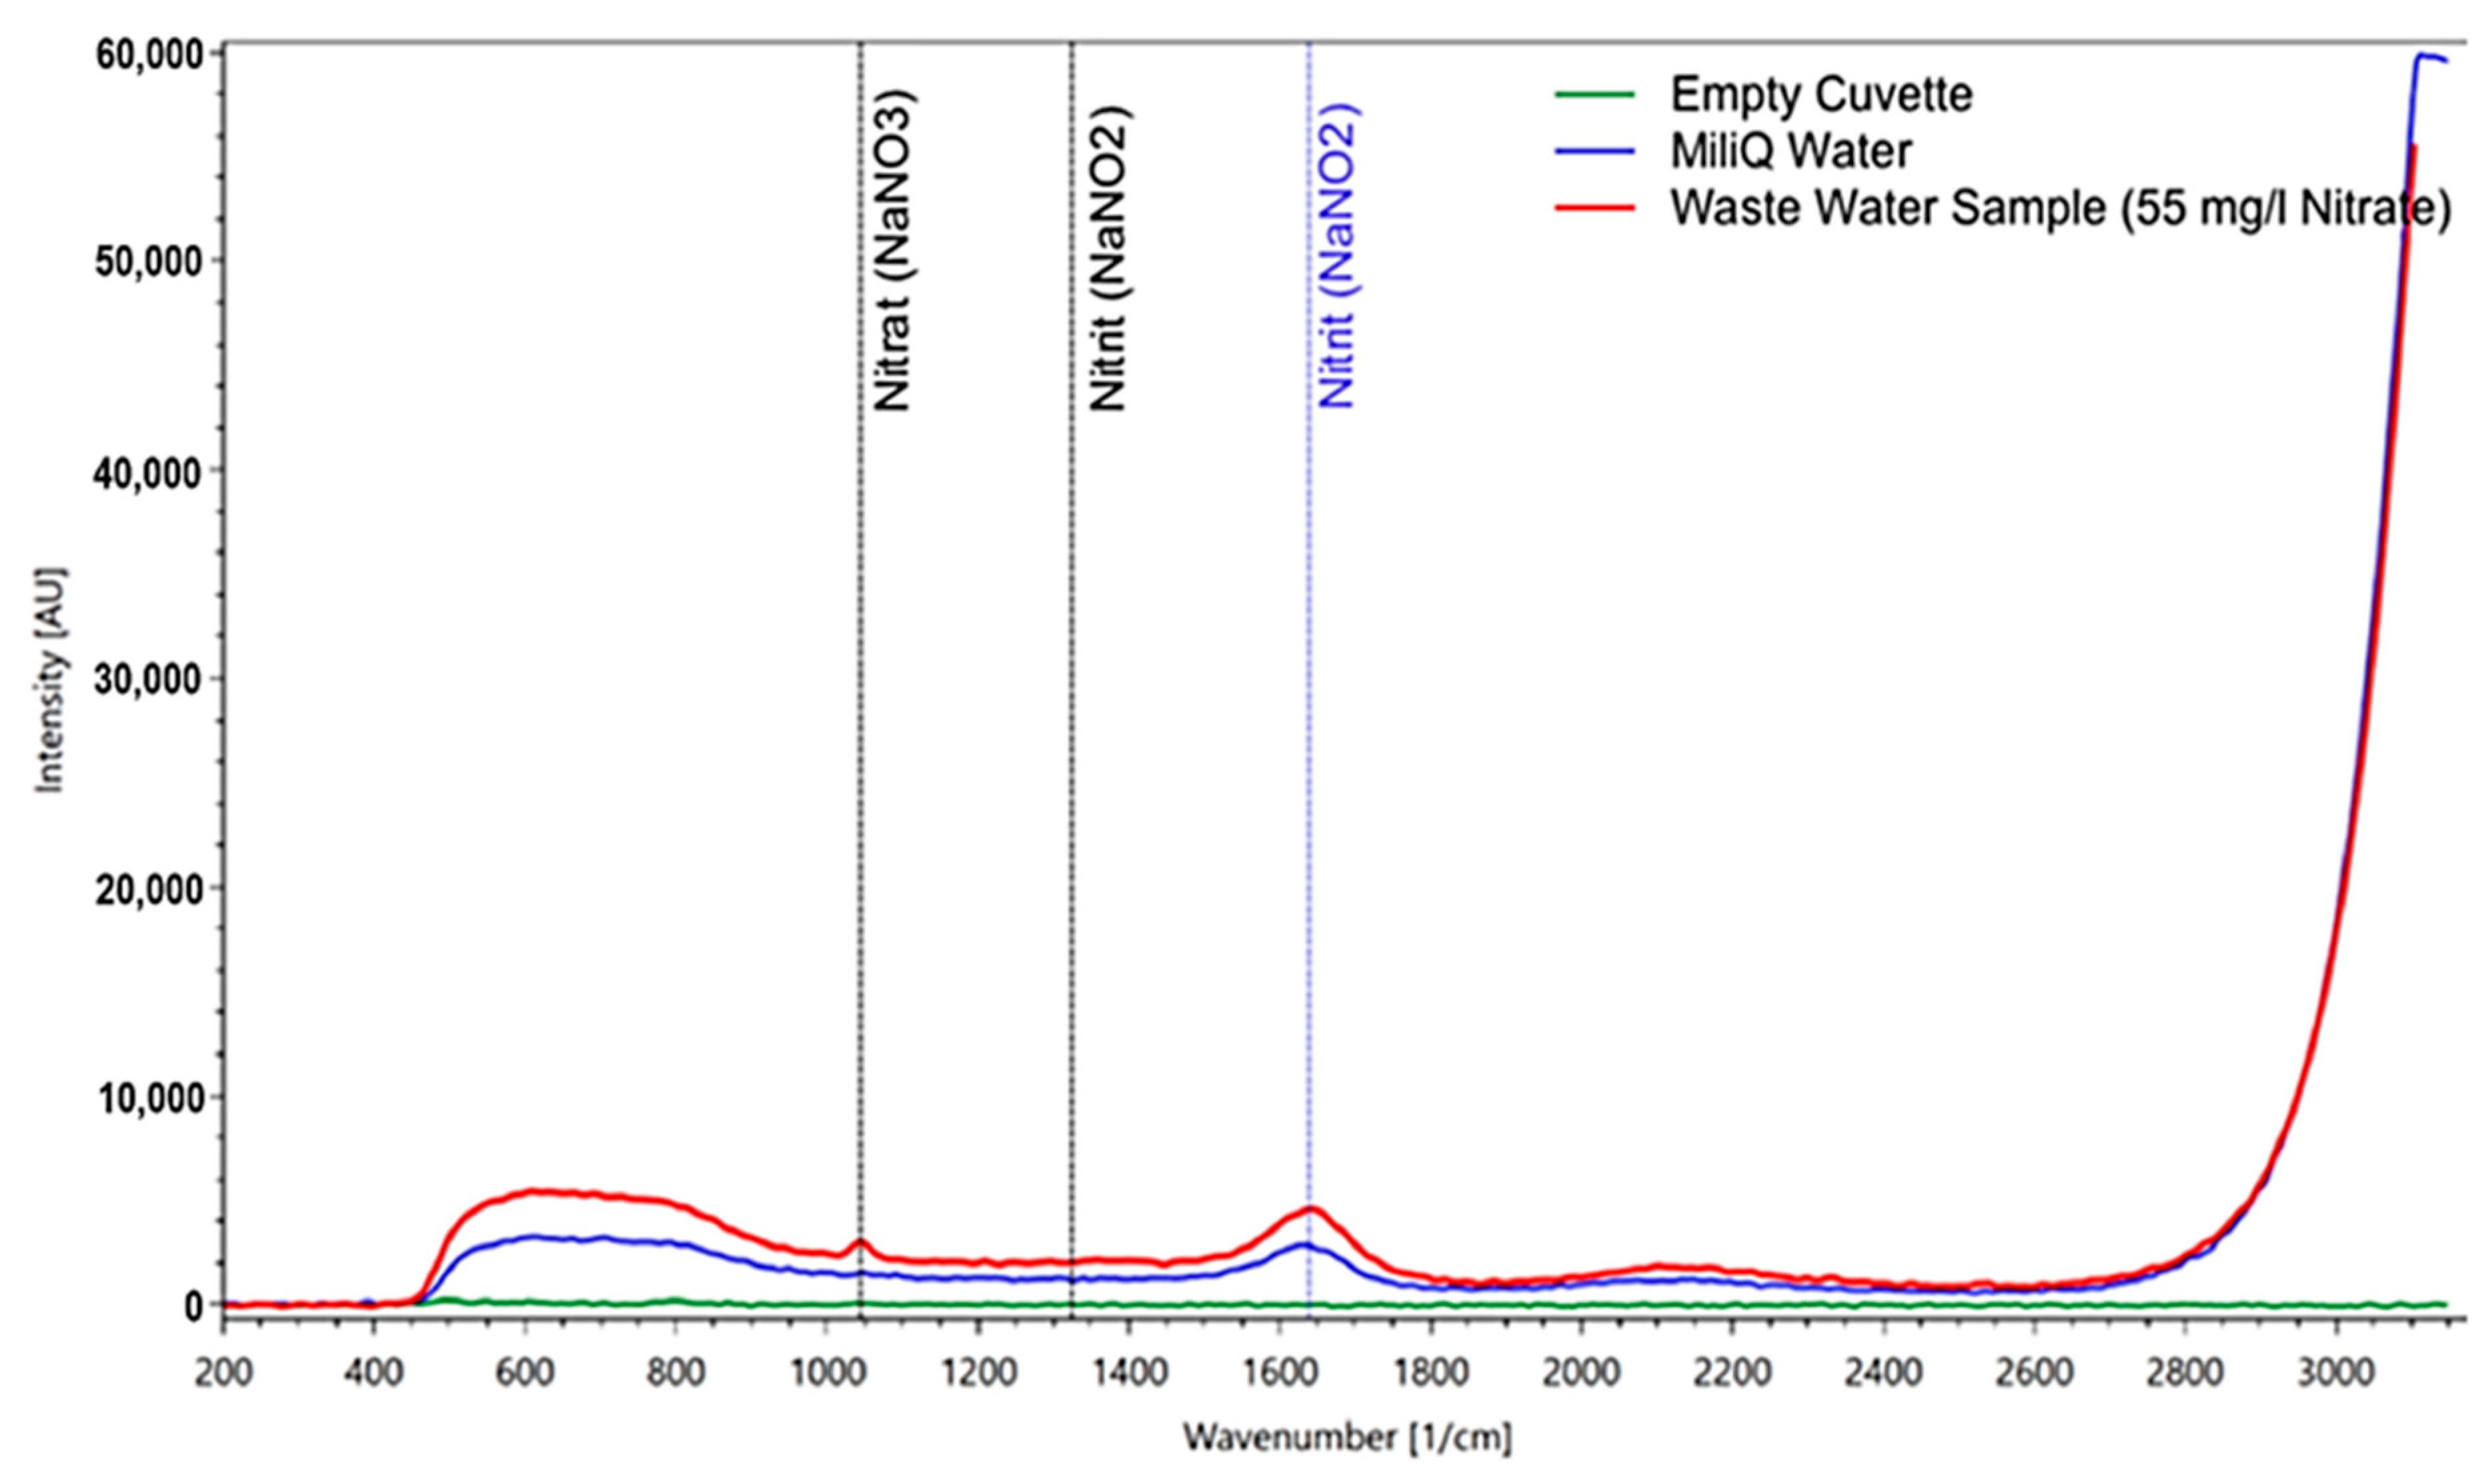
5.1. Results from Nitrates/Nitrites
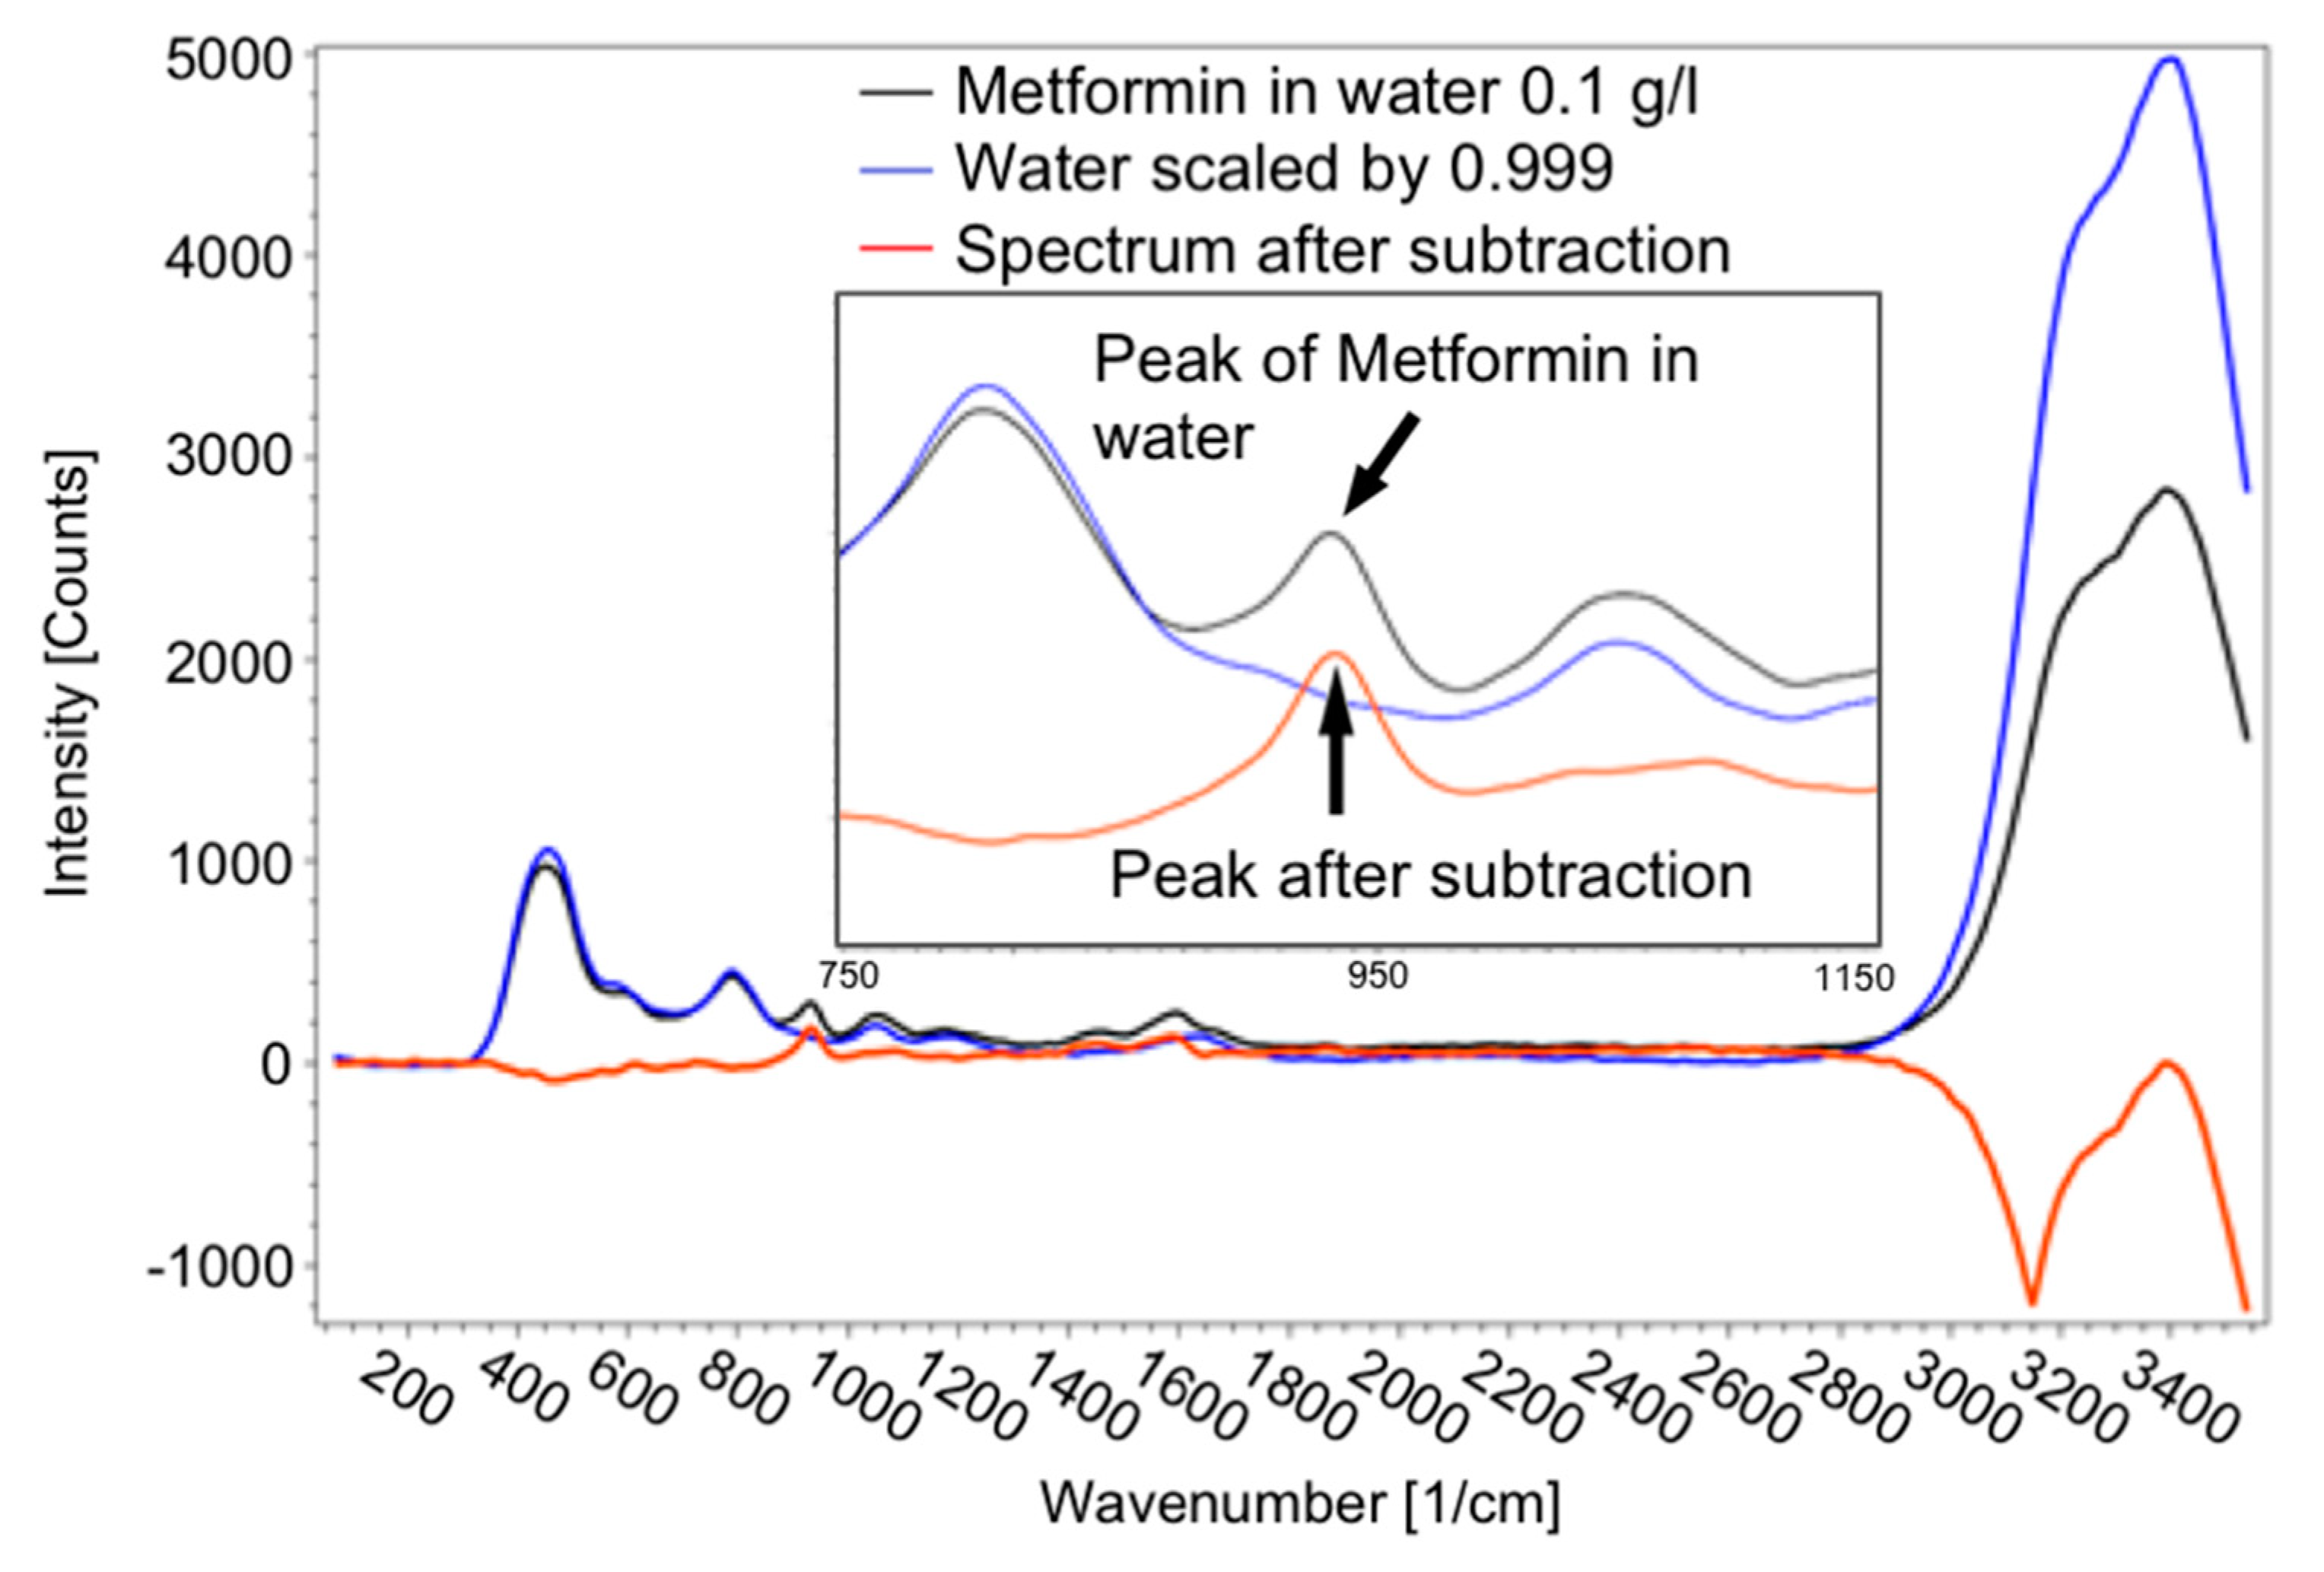
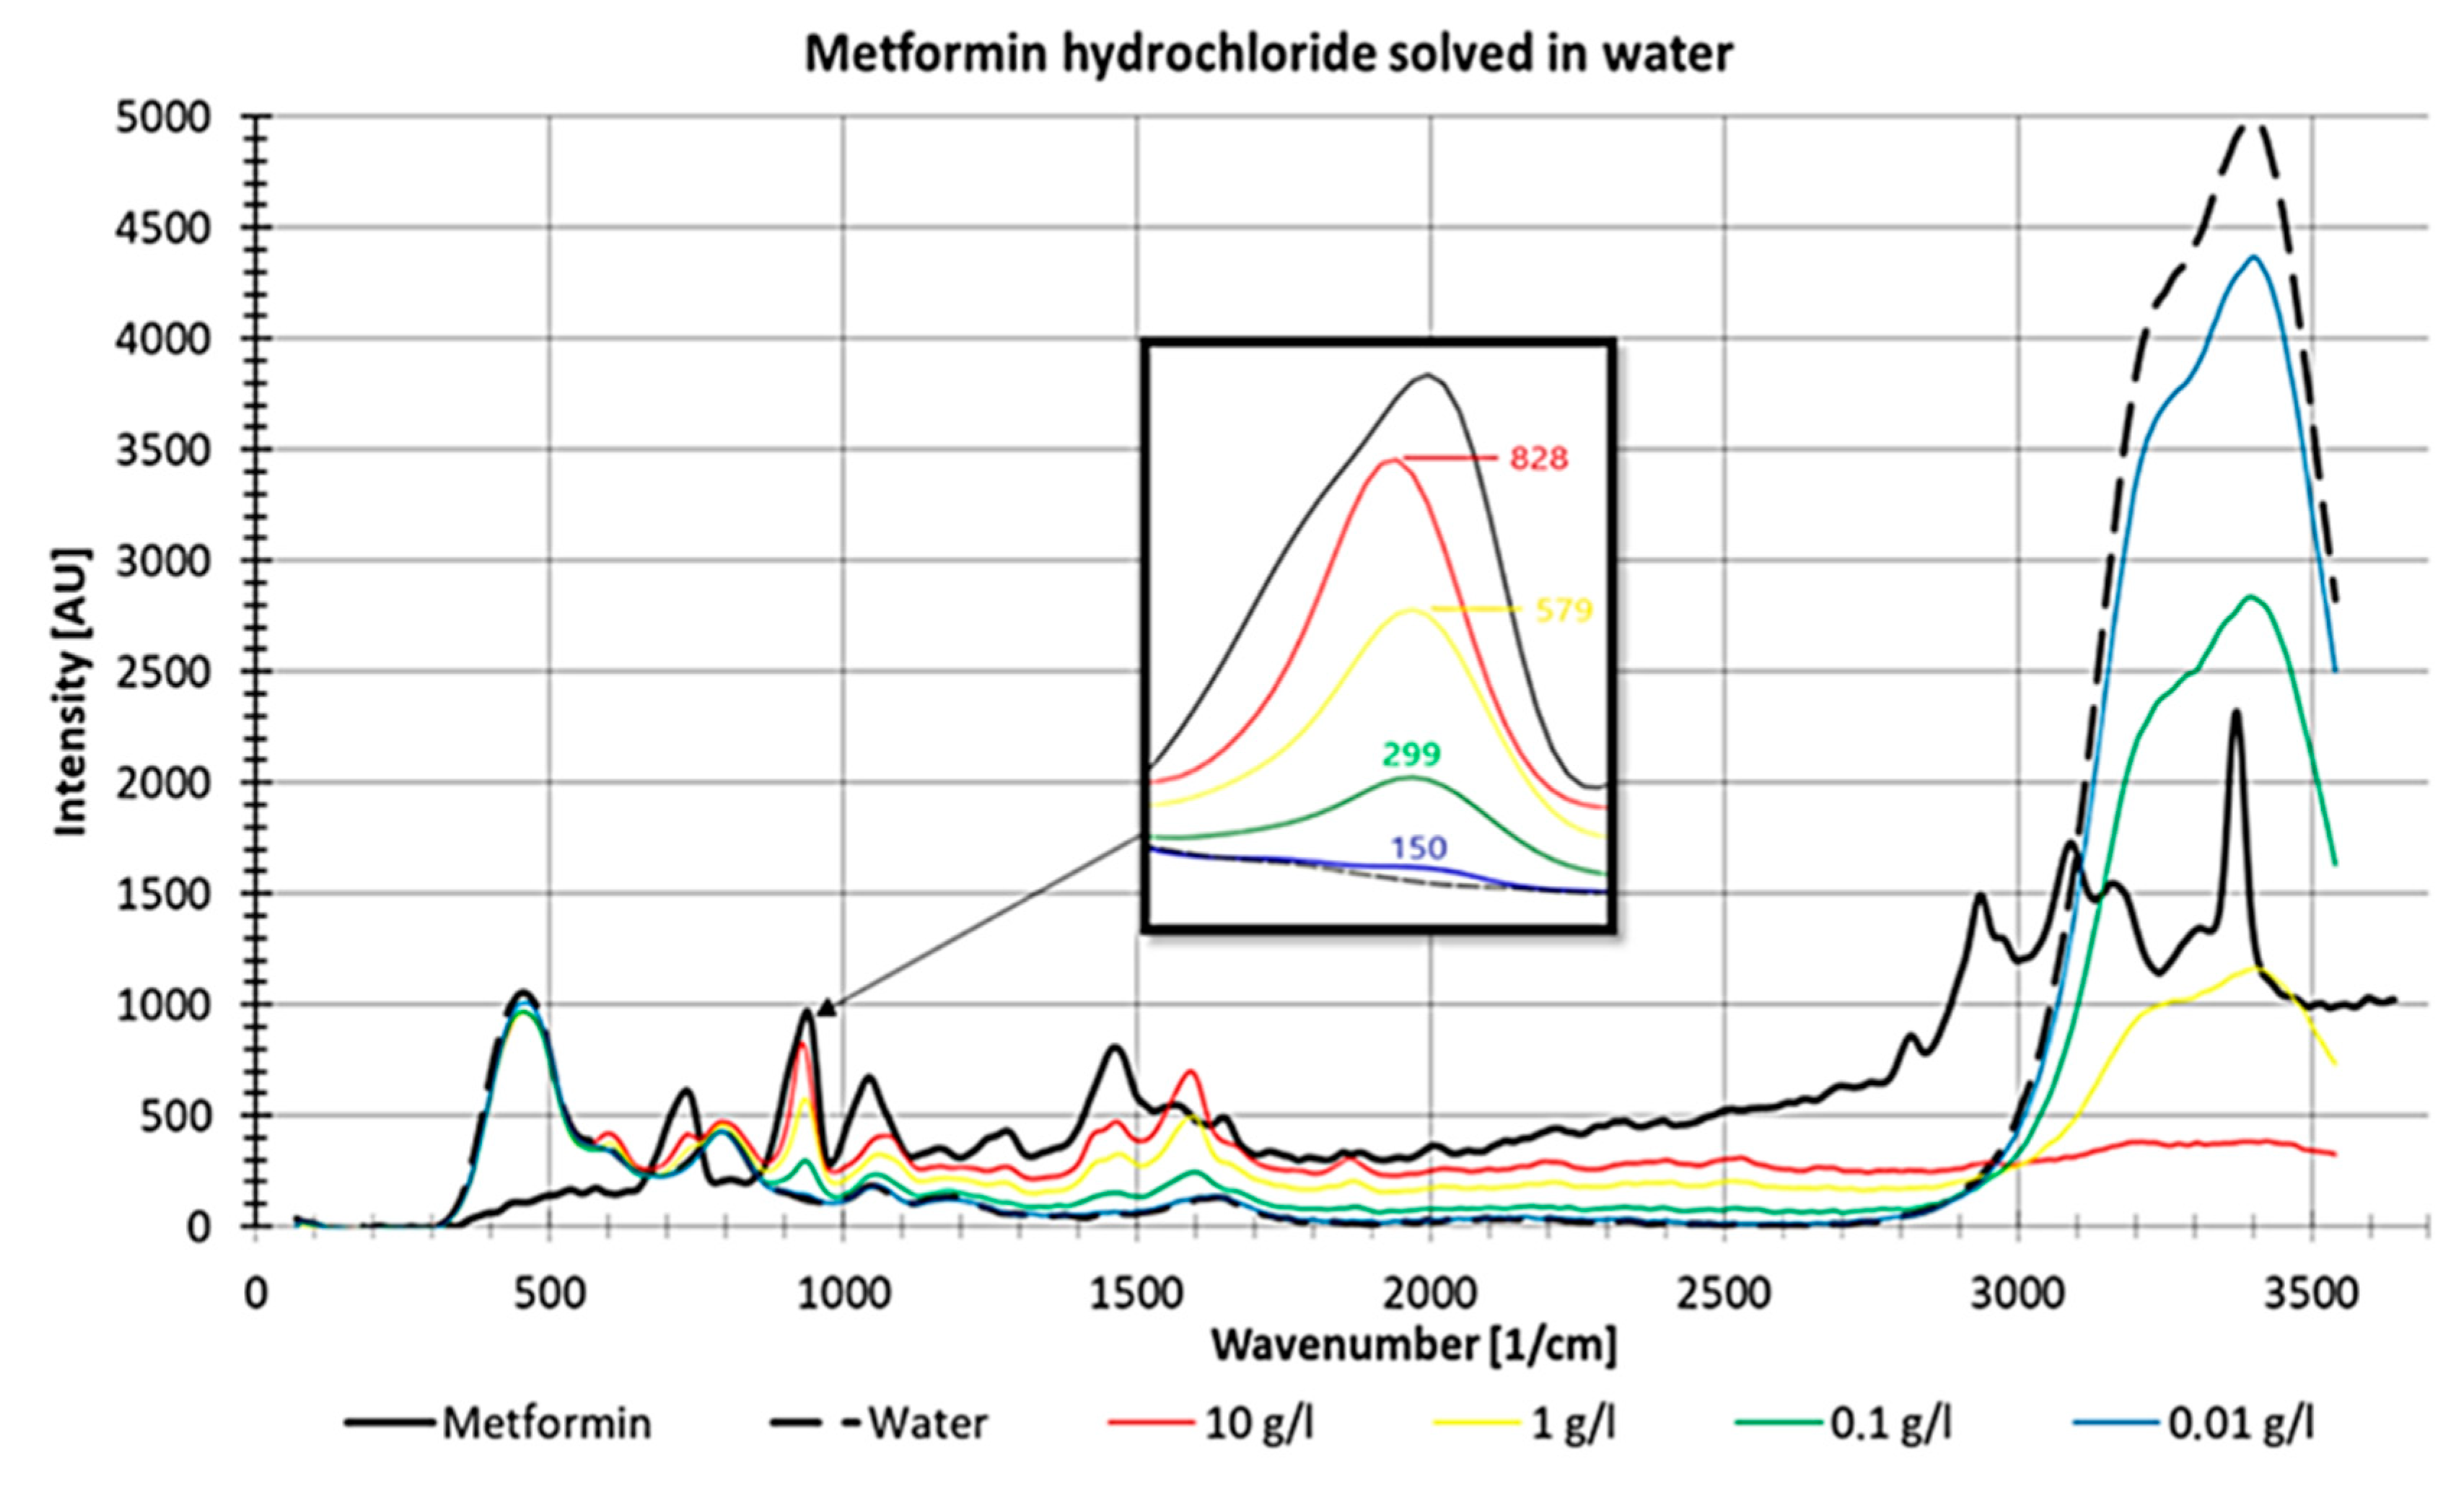
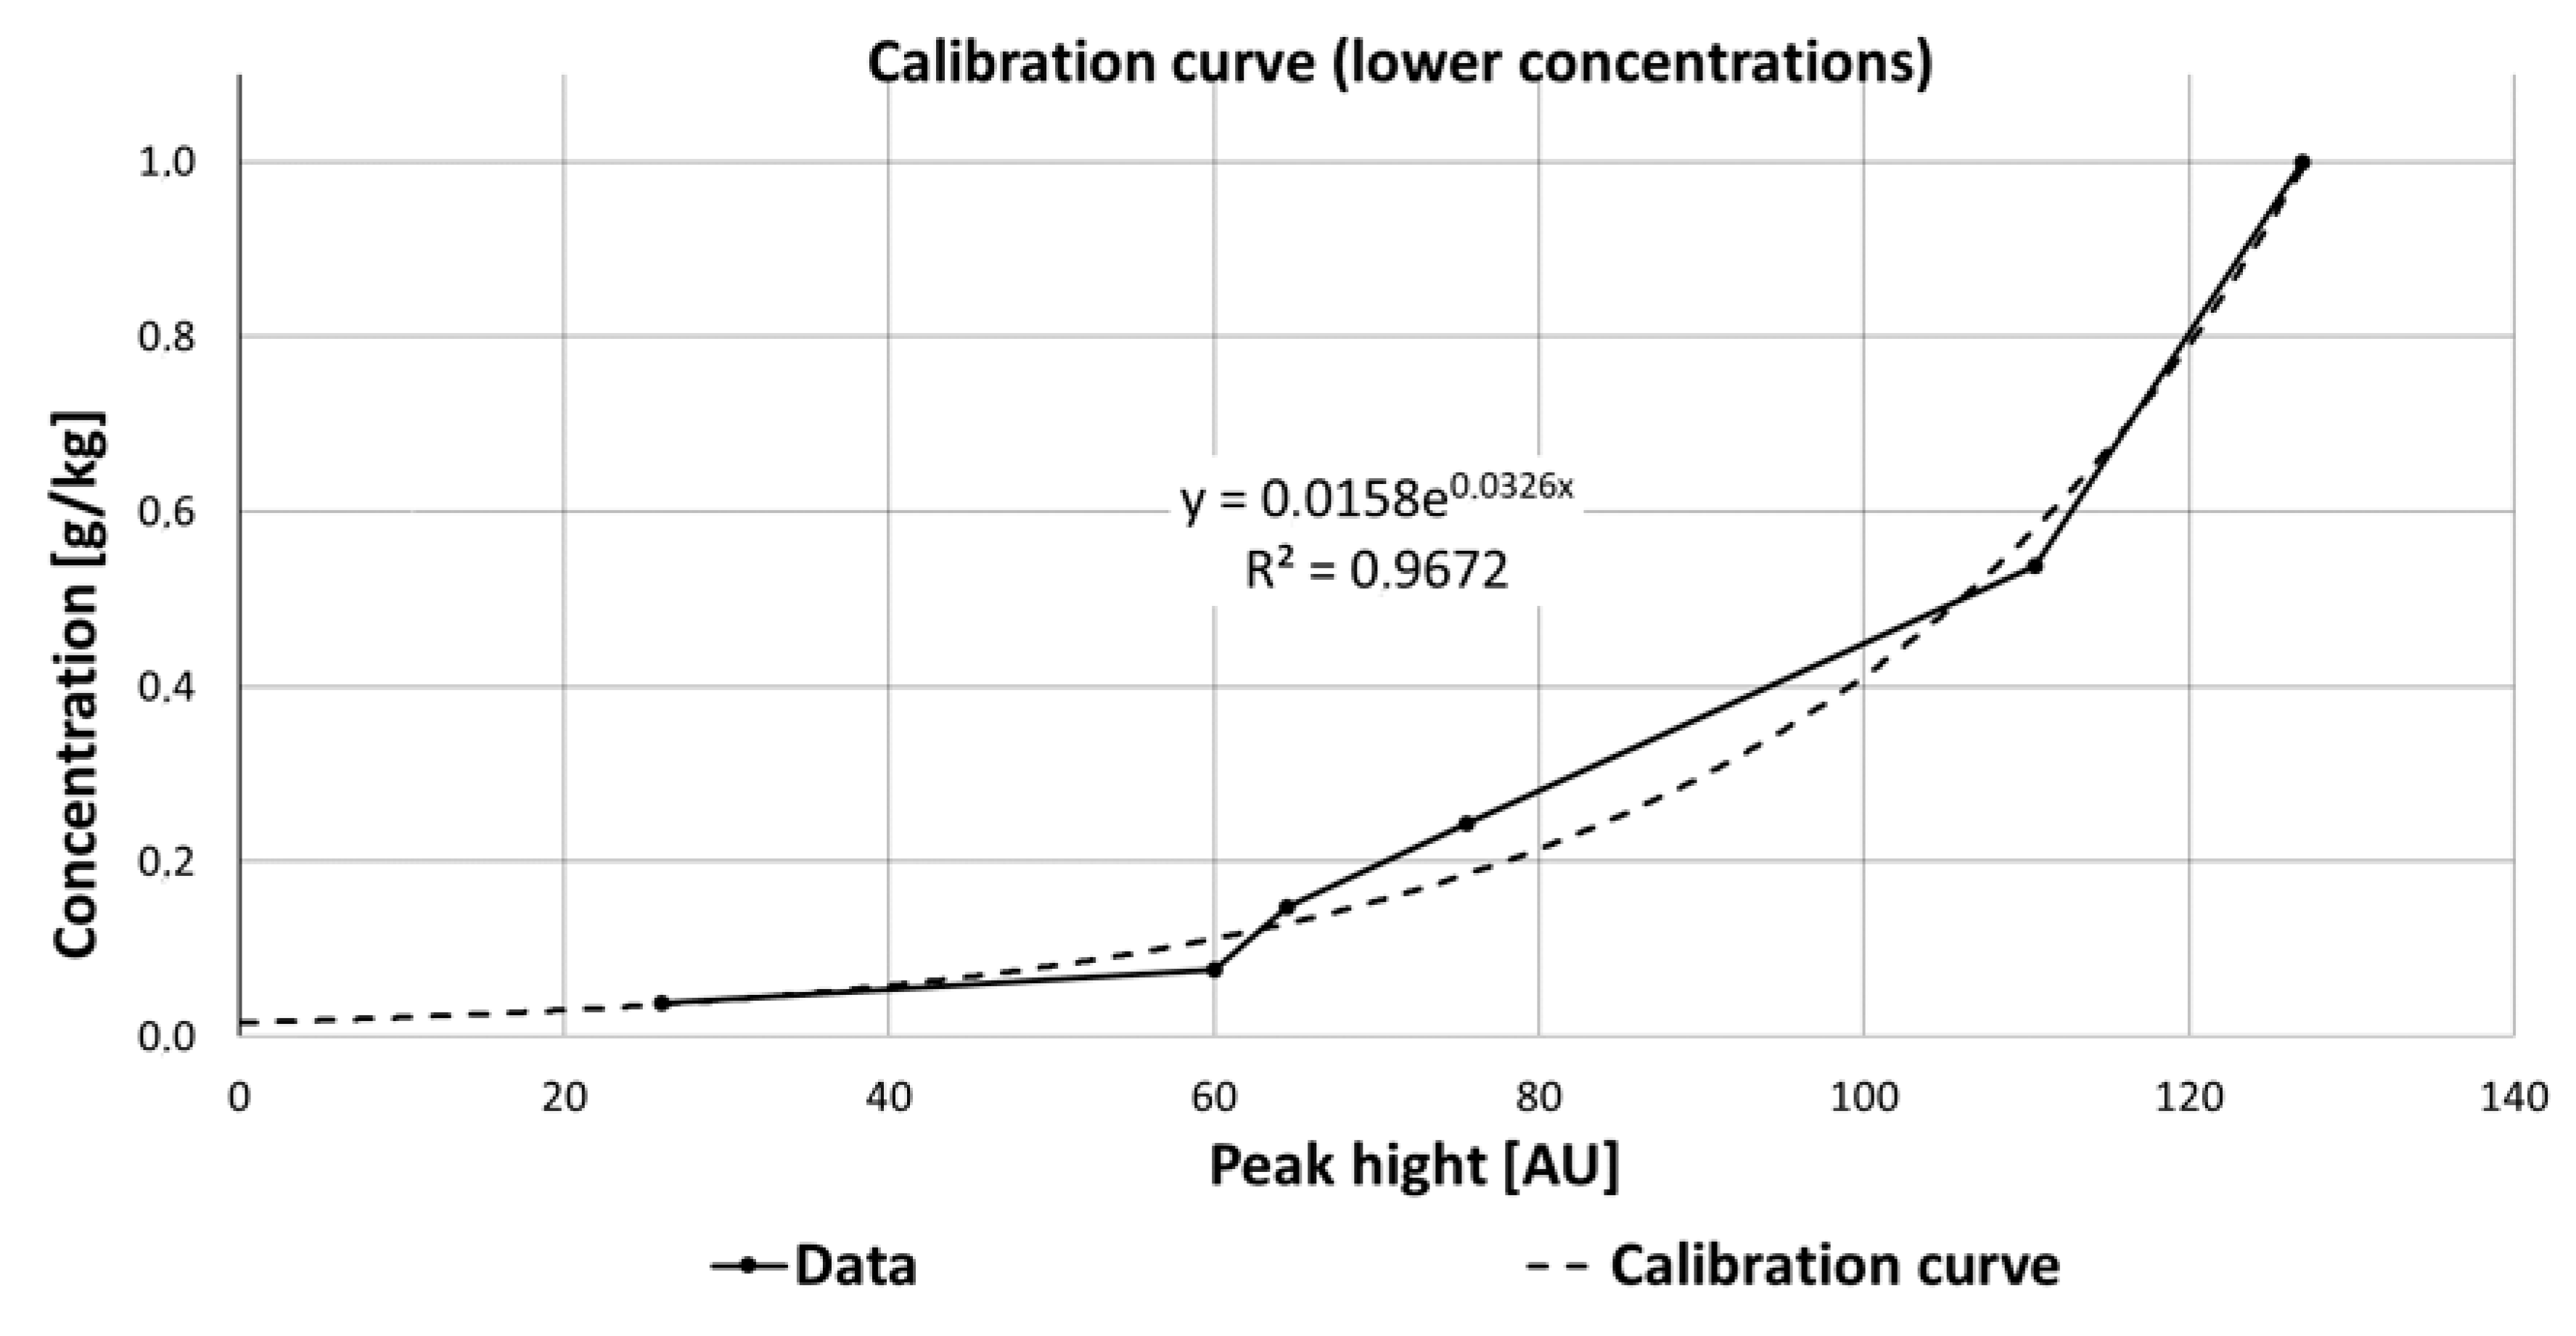
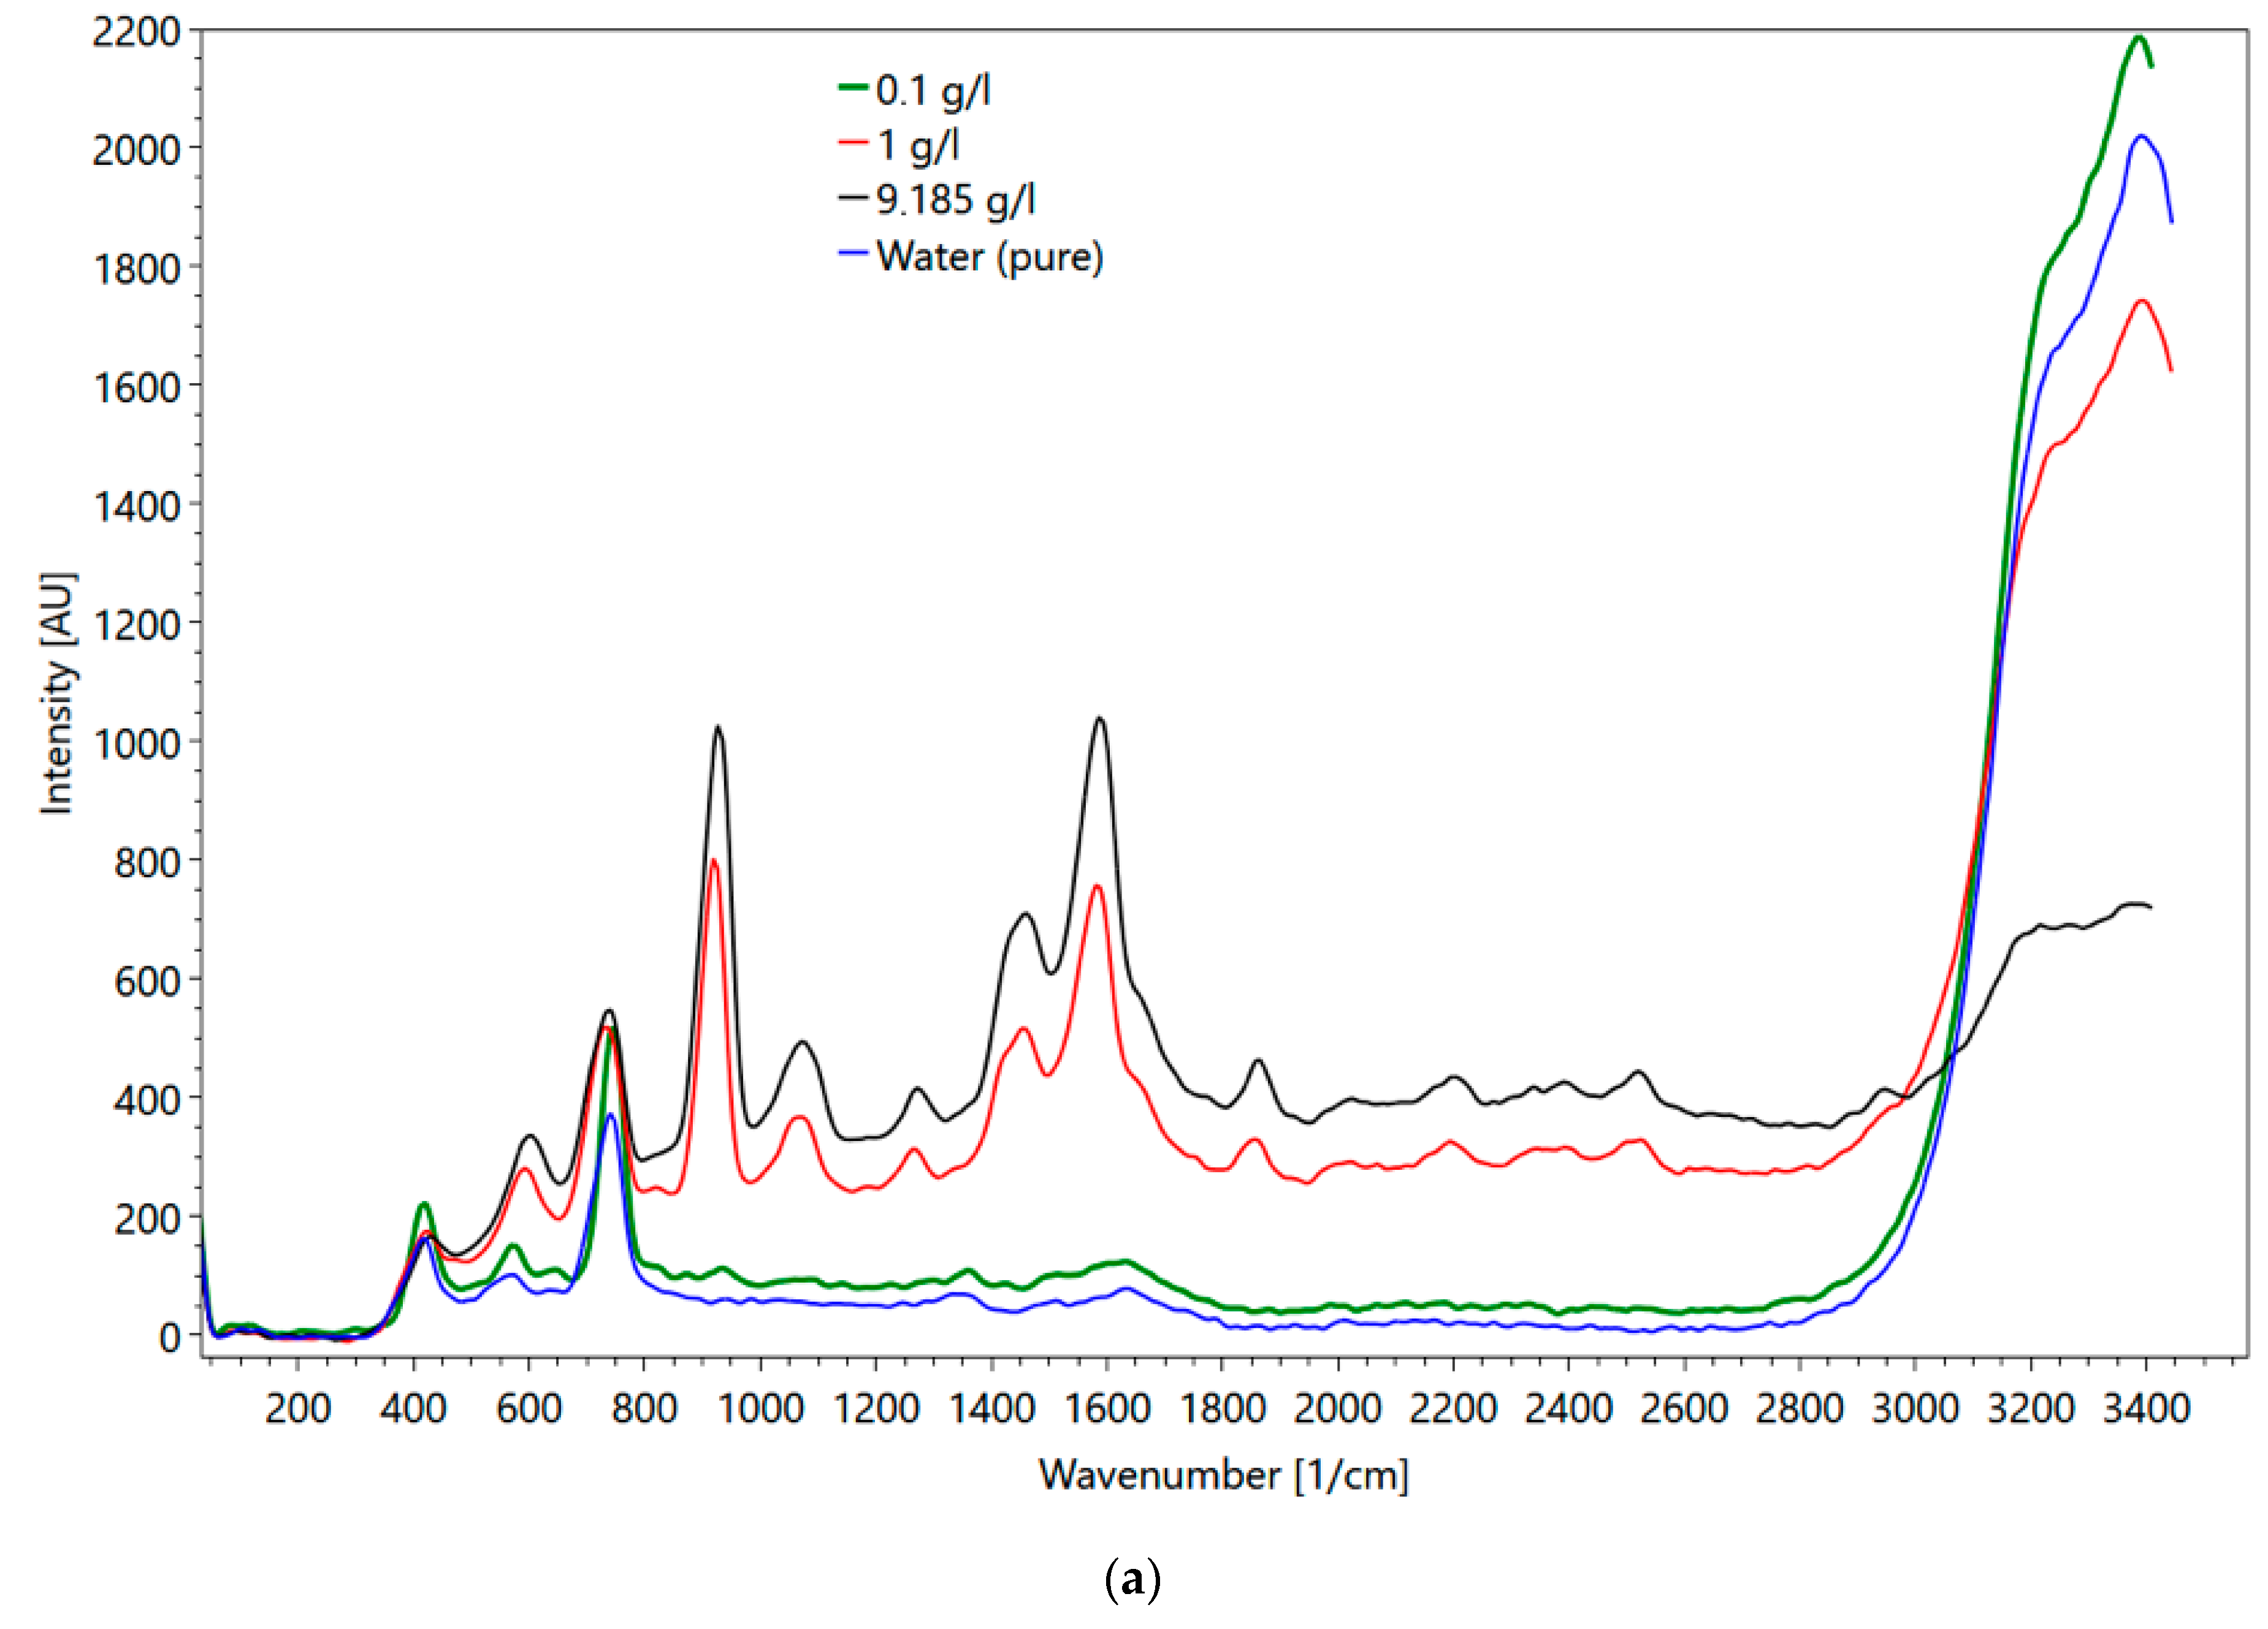
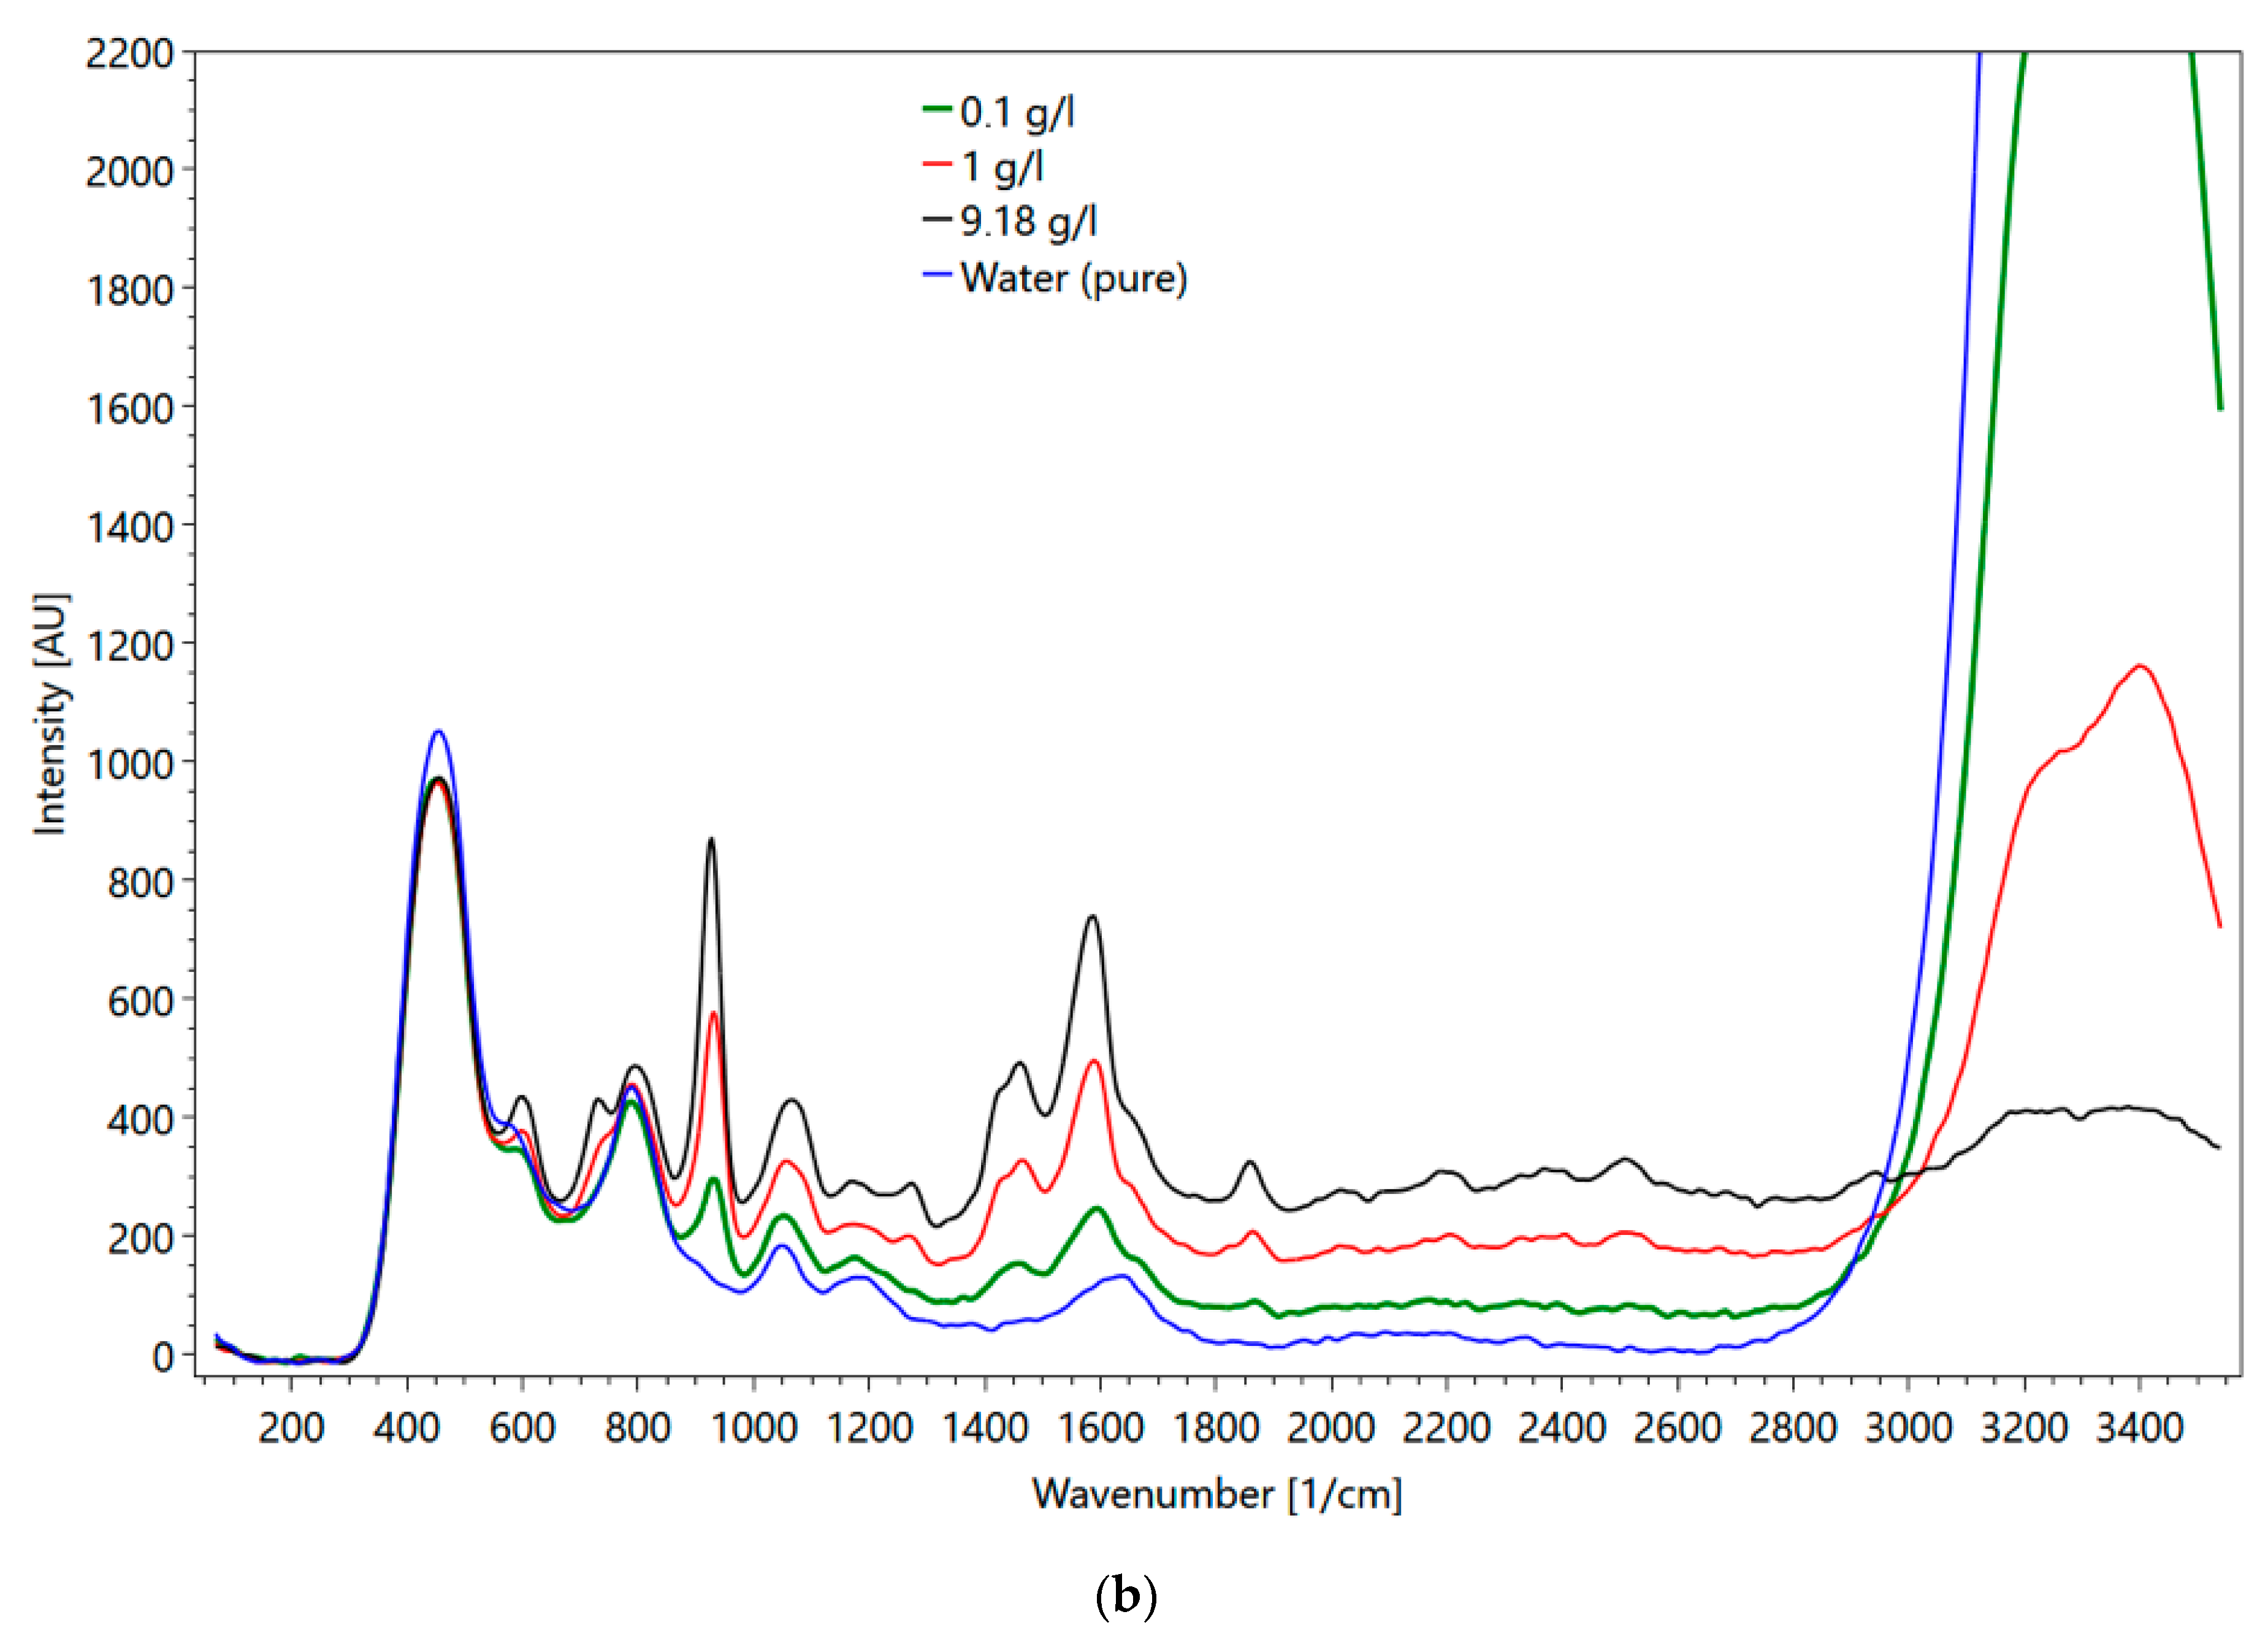
5.2. Results of the Pharmaceutical Substances
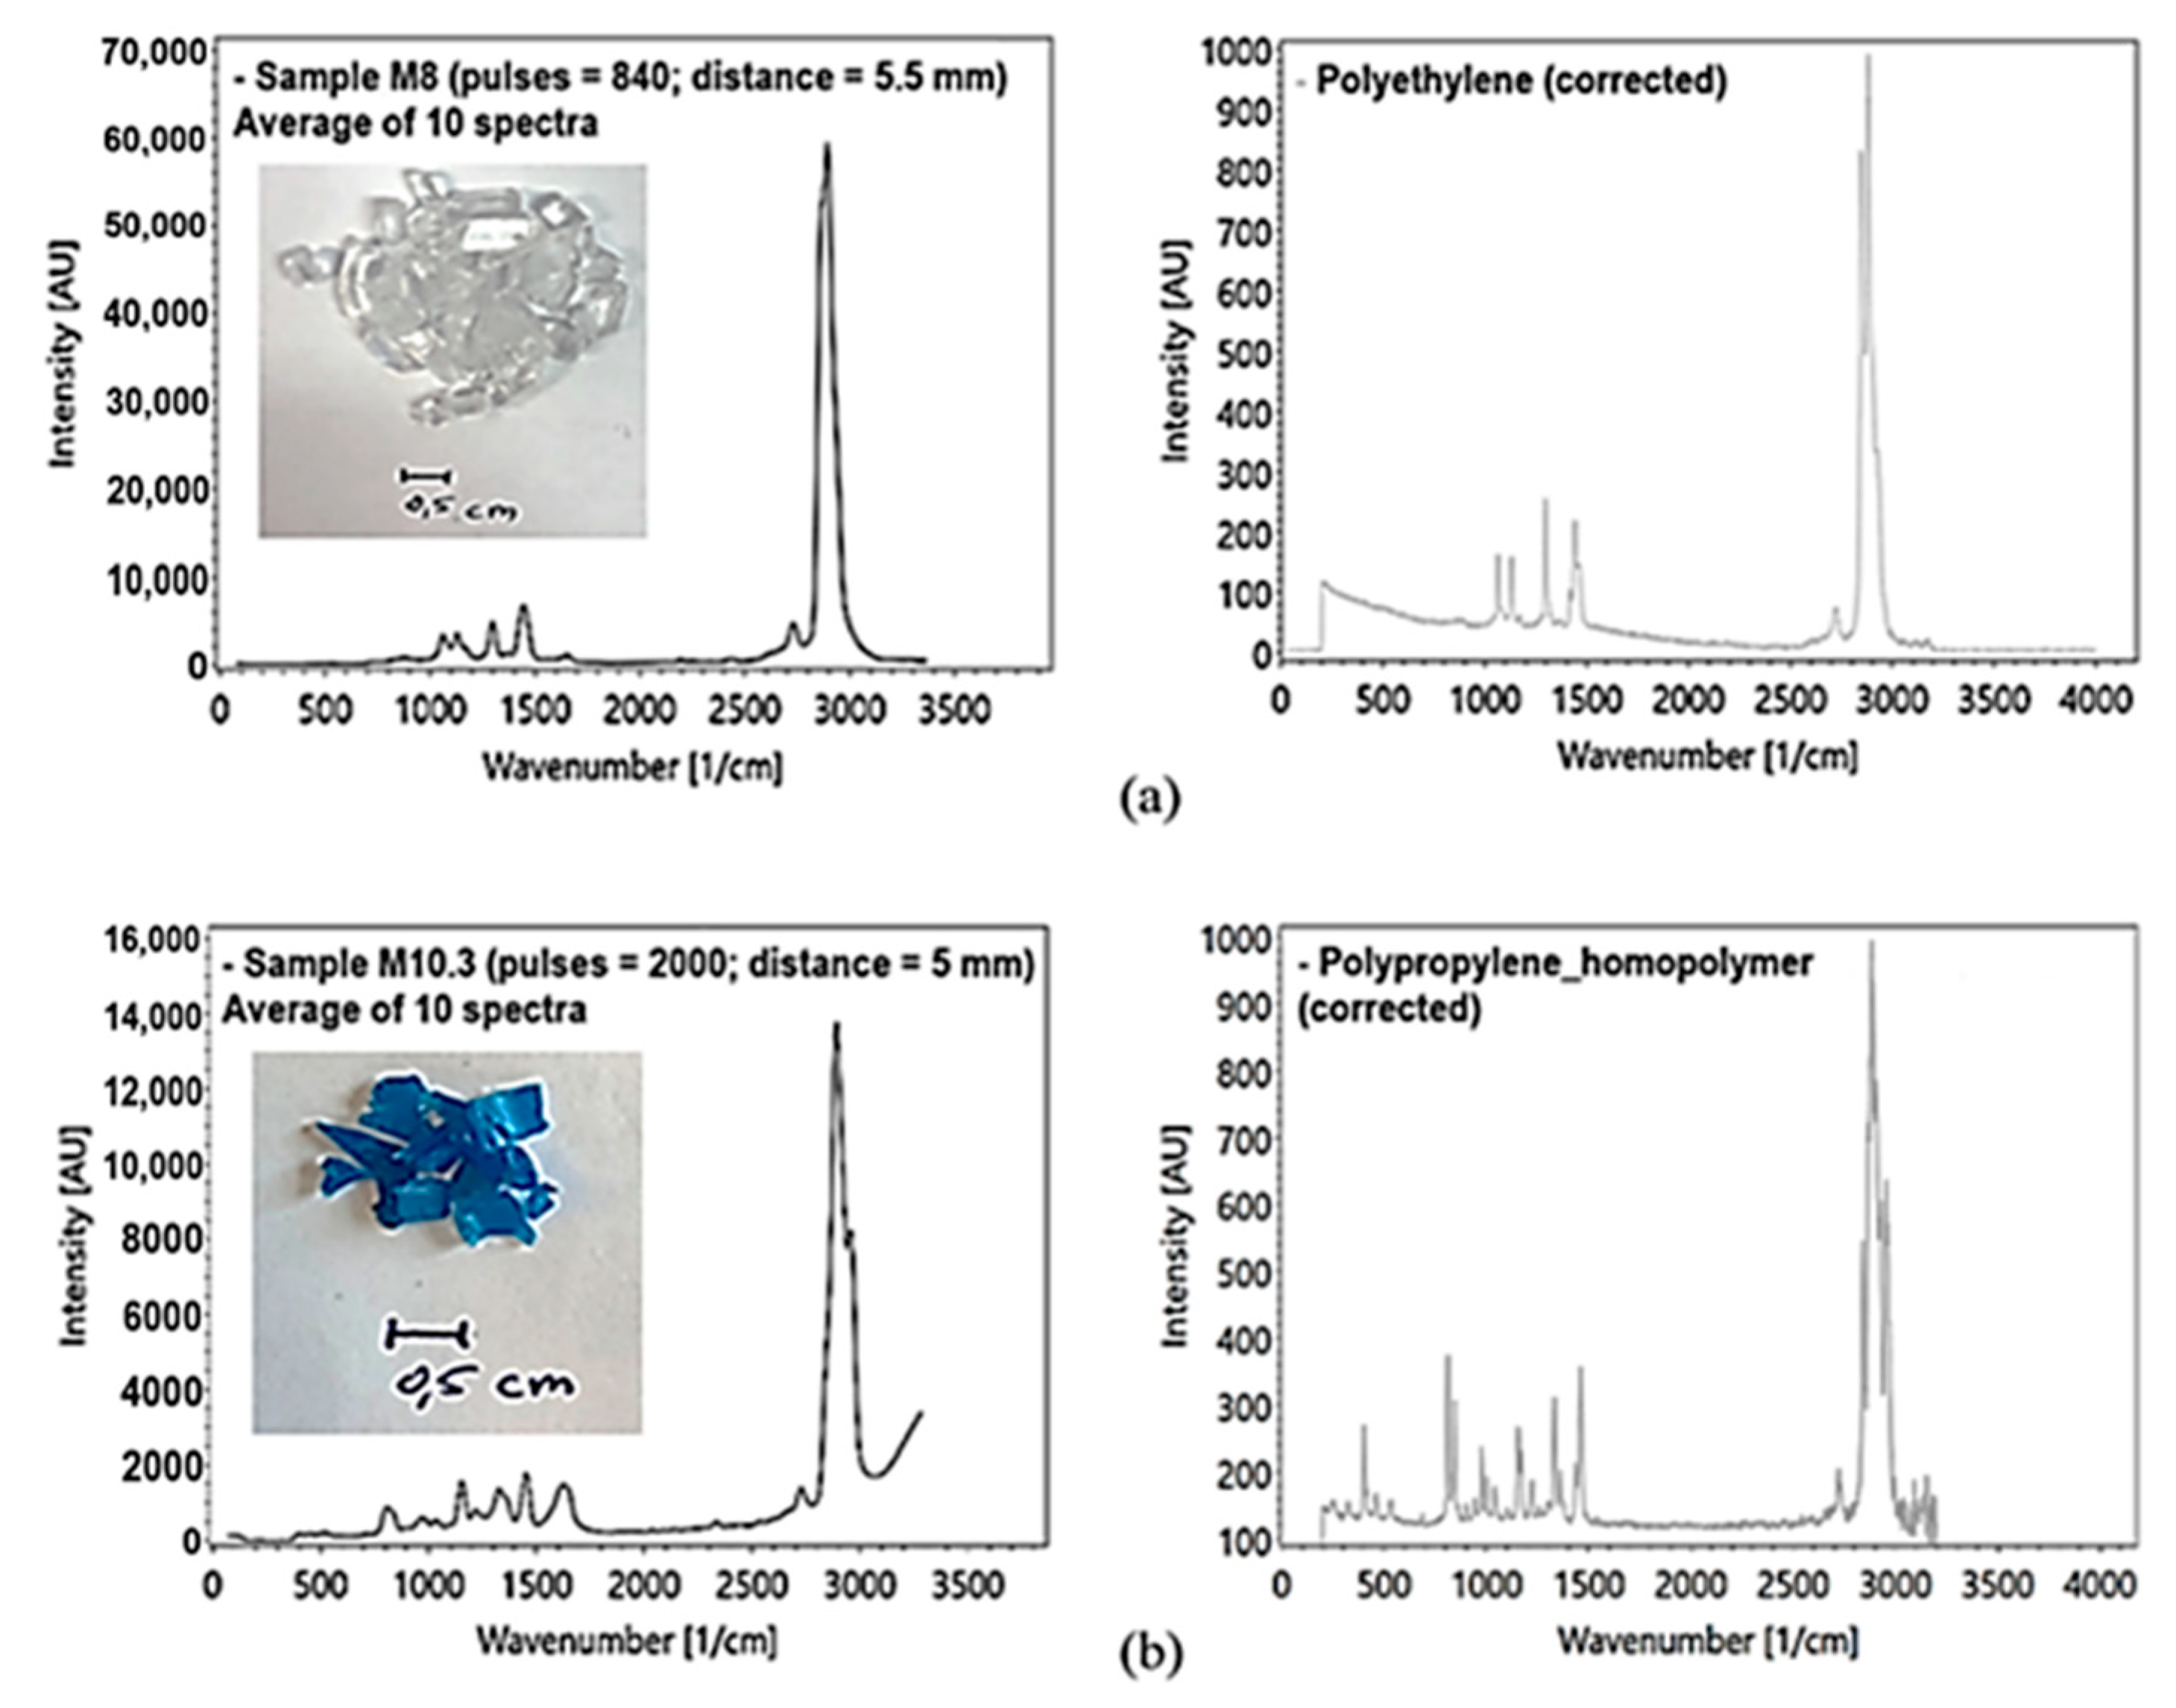
5.3. Results of Microplastics (MP)
6. Conclusions and Outlook
Author Contributions
Funding
Institutional Review Board Statement
Informed Consent Statement
Data Availability Statement
Conflicts of Interest
References
- Goldsmith, A.B. Monitoring for Conservation and Ecology, 1st ed.; Springer: Dordrecht, The Netherlands, 1991. [Google Scholar]
- Ryan, P.G.; Moore, C.J.; van Franeker, J.A.; Moloney, C.L. Monitoring marine plastics—Will we know if we are making a difference? S. Afr. J. Sci. 2020, 116, 1–9. [Google Scholar] [CrossRef]
- Gomes, P.I.A.; Wai, O.W.H. Investigation of Long-Term River Water Quality Trends in Hong Kong to Identify Role of Urbanization, Seasons and Pollution Sources. Water Air Soil Pollut. 2020, 231, 137. [Google Scholar] [CrossRef]
- Pivetta, R.C.; Rodrigues-Silva, C.; Ribeiro, A.R.; Rath, S. Tracking the occurrence of psychotropic pharmaceuticals in Brazilian wastewater treatment plants and surface water, with assessment of environmental risks. Sci. Total Environ. 2020, 727, 138661. [Google Scholar] [CrossRef] [PubMed]
- Palmer, J.A.; Law, J.; Soupir, M.L. Spatial and temporal distribution of E. coli contamination on three inland lake and recreational beach systems in the upper Midwestern United States. Sci. Total Environ. 2020, 722, 137846. [Google Scholar] [CrossRef]
- Farkas, K.; Walker, D.I.; Adriaenssens, E.M.; McDonald, J.E.; Hillary, L.S.; Malham, S.K.; Jones, D.L. Viral indicators for tracking domestic wastewater contamination in the aquatic environment. Water Res. 2020, 181, 115926. [Google Scholar] [CrossRef] [PubMed]
- Ryan, P.G.; Moore, C.J.; van Franeker, J.A.; Moloney, C.L. Monitoring the abundance of plastic debris in the marine environment. Philos. Trans. R. Soc. B 2009, 364, 1999–2012. [Google Scholar] [CrossRef]
- Maes, T.; Barry, J.; Leslie, H.A.; Vethaak, A.D.; Nicolaus, E.E.M.; Law, R.J. Below the surface. Twenty-five years of seafloor litter monitoring in coastal seas of North West Europe (1992–2017). Sci. Total Environ. 2018, 630, 790–798. [Google Scholar] [CrossRef]
- Blettler, M.C.M.; Ulla, M.A.; Rabuffetti, A.P.; Garello, N. Plastic pollution in freshwater ecosystems: Macro-, meso-, and microplastic debris in a floodplain lake. Environ. Monit. Assess. 2017, 189, 581. [Google Scholar] [CrossRef] [PubMed]
- Harthun, M.; Hopf, T.; Mußbach, J.; Schilling, E. Flussgebietsübergreifende Stellungsnahme des NABU zu den Bewirtschaftungsplänen und den Maßnahmenprogrammen der Wasserrahmenrichtlinie; NABU Naturschutz Deutschland e.V., 2015; Available online: https://www.nabu.de/imperia/md/content/nabude/lebendigefluesse/150622-nabu-stellungnahme_wrrl.pdf (accessed on 3 June 2021).
- Wierzbicka, E. Novel methods of nitrate and nitrite determination—A review. J. Elem. 2020, 25, 97–106. [Google Scholar] [CrossRef]
- Madikizela, L.M.; Ncube, S.; Chimuka, L. Analysis, occurrence and removal of pharmaceuticals in African water resources: A current status. J. Environ. Manag. 2020, 253, 109741. [Google Scholar] [CrossRef]
- Waldschläger, K.; Lechthaler, S.; Stauch, G.; Schüttrumpf, H. The way of microplastic through the environment—Application of the source-pathway-receptor model (review). Sci. Total Environ. 2020, 713, 136584. [Google Scholar] [CrossRef]
- Li, Z.; Deen, M.; Kumar, S.; Selvaganapathy, P. Raman spectroscopy for in-line water quality monitoring—Instrumentation and potential. Sensors 2014, 14, 17275–17303. [Google Scholar] [CrossRef] [PubMed]
- Sarfo, D.; Sivanesan, A.; Emad, I.; Godwin, A. Rapid detection of mercury contamination in water by surface enhanced Raman spectroscopy. RSC Adv. 2017, 7, 21567–21575. [Google Scholar] [CrossRef]
- Li, D.; Zhai, W.; Li, Y. Recent progress in surface enhanced Raman spectroscopy for the detection of environmental pollutants. Microchim. Acta 2014, 181, 23–43. [Google Scholar] [CrossRef]
- Pfannkuche, J.; Lubecki, L.; Schmidt, H.; Kowalewska, G.; Kronfeldt, H. The use of surface-enhanced Raman scattering (SERS) for detection of PAHs in the Gulf of Gdańsk (Baltic Sea). Mar. Pollut. Bull. 2012, 64, 614–626. [Google Scholar] [CrossRef] [PubMed]
- Ong, T.; Blanch, E.; Jones, O. Surface Enhanced Raman Spectroscopy in environmental analysis, monitoring and assessment. Sci. Total Environ. 2020, 720, 137601. [Google Scholar] [CrossRef]
- Li, G.; Chen, M.; Wei, T. Application of Raman Spectroscopy to Detecting Organic Contaminant in Water. In Proceedings of the IITA International Conference on Control, Automation and Systems Engineering, Zhangjiajie, China, 11–12 July 2009. [Google Scholar]
- Hug, W.F.; Bhartia, R.; Tsapin, A.; Lane, A.; Conrad, P.; Sijapati, K.; Reid, R.D. Water & surface contamination monitoring using deep UV laser induced native fluorescence and Raman spectroscopy. In Proceedings of the SPIE, 6378, Chemical and Biological Sensors for Industrial and Environmental Monitoring II, Boston, MA, USA, 25 October 2006. [Google Scholar]
- Araujo, C.; Nolasco, M.; Ribeiro, A.; Ribeiro-Claro, P. Identification of microplastics using Raman spectroscopy: Latest developments and future prospects. Water Res. 2018, 142, 426–440. [Google Scholar] [CrossRef]
- Persichetti, G.; Bernini, R. Water monitoring by optofluidic Raman spectroscopy for in situ applications. Talanta 2016, 155, 145–152. [Google Scholar] [CrossRef] [PubMed]
- Lussier, F.; Thibault, V.; Charron, B.; Wallace, G.; Masson, J. Deep learning and artificial intelligence methods for Raman andsurface-enhanced Raman scattering. TrAC Trends Anal. Chem. 2020, 124, 115796. [Google Scholar] [CrossRef]
- Smith, E.; Dent, G. Modern Raman Spectroscopy—A Practical Approach, 1st ed.; Wiley & Sons: Chichester, UK, 2004. [Google Scholar]
- Asher, S.A.; Johnson, C.R. A new selective technique for characterization of polycyclic aromatic hydrocarbons in complex samples: UV resonance Raman spectroscopy of coal liquids. Anal. Chem. 1984, 56, 2258–2261. [Google Scholar]
- Hug, W.F.; Reid, M.R.; Nguyen, Q.; Bhartia, R.; Reid, R.D. A new, hand-held, 1 to 5 m standoff analyzer for real-time detection of trace chemical, biological, and explosives substances on surfaces, SPIE Defense & Commercial Sensing. In Proceedings of the SPIE Defense & Commercial Sensing, Vol. 11010, Chemical, Biological, Radiological, Nuclear, and Explosives (CBRNE) Sensing XX, 110100L, Baltimore, MD, USA, 15 May 2019. [Google Scholar]
- Ianoul, A.; Coleman, T.; Asher, S. UV Resonance Raman Spectroscopic Detection of Nitrate and Nitrite in Wastewater Treatment Processes. Anal. Chem. 2002, 74, 1458–1461. [Google Scholar] [CrossRef] [PubMed]
- DUV Raman PL200: Fully Integrated, Lab Model Deep UV Resonance Raman & Photoluminescence Spectrometer, with Microscopic Imaging. Available online: https://photonsystems.com/wp-content/uploads/2019/02/DUV-RamanPL200-Data-Sheet-V12-Web.pdf (accessed on 23 March 2020).
- Liu, C. Implementation of Deep Ultraviolet Raman Spectroscopy. Ph.D.Thesis, Technical University of Denmark, Kongens Lyngby, Denmark, 2011. [Google Scholar]
- Photon Systems Inc. New Deep UV Raman & Photoluminescence Spectrometer System: The DUV Raman/PL 200. In Proceedings of the SPIE DCS 2018, Orlando, FL, USA, 16 April 2018. [Google Scholar]
- Fused Fluorescence and Raman. Available online: https://photonsystems.com/technology/fused-fluorescence-and-raman/ (accessed on 9 March 2020).
- Pohling, R. Chemische Reaktionen in der Wasseranalyse, 1st ed.; Springer Spektrum: Berlin/Heidelberg, Germany, 2015. [Google Scholar]
- Beek, T.; Weber, F.; Bergmann, A. Pharmaceuticals in the Environment: Global Occurrence and Potential Cooperative Action under the Strategic Approach to International Chemicals Management (SAICM); Umweltbundesamt Texte, 67; 2016; Available online: https://www.umweltbundesamt.de/en/publikationen/pharmaceuticals-in-the-environment-global (accessed on 3 June 2021).
- Dusi, E.; Rybicki, M.; Jungmann, D. The Database “Pharmaceuticals in the Environment”—Update and New Analysis; Umweltbundesamt Texte 67; 2019; Available online: https://www.umweltbundesamt.de/publikationen/the-database-pharmaceuticals-in-the-environment (accessed on 3 June 2021).
- Bergmann, A.; Fohrmann, F.; Weber, F.A. Zusammenstellung von Monitoringdaten zu Umweltkonzentrationen von Arzneimitteln; Umweltbundesamt Texte 66; 2011; Available online: https://www.umweltbundesamt.de/publikationen/zusammenstellung-von-monitoringdaten-zu (accessed on 3 June 2021).
- Fatta, D.; Achilleos, A.; Nikolaou, A. Analytical methods for tracing pharmaceutical residues in water and wastewater. Trends Anal. Chem. 2007, 26, 515–533. [Google Scholar] [CrossRef]
- Wiesben, C.A. Raman-Mikrospektroskopie zur Analyse von Organischen Bodensubstanzen und Mikroplastik. Ph.D. Thesis, Technische Universität München, München, Germany, 2017. [Google Scholar]
- Tetralog. Available online: www.tetralog.com (accessed on 6 May 2021).
- Artha Vision, X. Available online: https://www.artha-x.com/ (accessed on 21 December 2020).
- Kniggendorf, A.K.; Wetzel, C.; Roth, B. Microplastics Detection in Streaming Tap Water with Raman Spectroscopy. Sensors 2019, 19, 1839. [Google Scholar] [CrossRef]
- Heß, M.; Diehl, P.; Mayer, J.; Rahm, H.; Reifenhäuser, W.; Stark, J.; Schwaiger, J. Mikroplastik in Binnengewässern Süd- und Westdeutschlands. Teil 1: Kunststoffpartikel in der Oberflächennahen Wasserphase; LUBW/LfU Bayern/HLNUG/LANUV/LfU Rheinland-Pfalz: Karlsruhe, Germany; Augsburg, Germany; Wiesbaden, Germany; Recklinghausen, Germany; Mainz, Germany, 2018. [Google Scholar]
- Hidalgo-Ruz, V.; Gutow, L.; Thompson, R.; Thiel, M. Microplastics in the marine environment: A review of the methods used for identification and quantification. Environ. Sci. Technol. 2012, 46, 3060–3075. [Google Scholar] [CrossRef] [PubMed]
- Liu, Y.; Upadhyaya, B.; Naghedolfeizi, M. Chemometric Data Analysis Using Artificial Neural Networks. Appl. Spectrosc. 1993, 47, 12–23. [Google Scholar] [CrossRef]
- Berghian-Grosan, C.; Magdas, D. Application of Raman spectroscopy and Machine Learning algorithms for fruit distillates discrimination. Sci. Rep. 2020, 10, 1–9. [Google Scholar] [CrossRef]
- Liu, J.; Osadchy, M.; Ashton, L.; Foster, M.; Solomone, C.; Gibson, S. Deep convolutional networks for Raman spectrum recognition: A unified solution. Analyst 2017, 142, 4067–4074. [Google Scholar] [CrossRef]
- TensorFlow: An end-to-end Open Source Machine Learning Platform. Available online: https://www.tensorflow.org (accessed on 21 December 2020).
- KnowItAll Spectroscopy Edition. Available online: https://sciencesolutions.wiley.com/knowitall-spectroscopy-software (accessed on 21 December 2020).
- Free Spectral Database. Available online: https://spectrabase.com (accessed on 21 December 2020).


Publisher’s Note: MDPI stays neutral with regard to jurisdictional claims in published maps and institutional affiliations. |
© 2021 by the authors. Licensee MDPI, Basel, Switzerland. This article is an open access article distributed under the terms and conditions of the Creative Commons Attribution (CC BY) license (https://creativecommons.org/licenses/by/4.0/).
Share and Cite
Post, C.; Brülisauer, S.; Waldschläger, K.; Hug, W.; Grüneis, L.; Heyden, N.; Schmor, S.; Förderer, A.; Reid, R.; Reid, M.; et al. Application of Laser-Induced, Deep UV Raman Spectroscopy and Artificial Intelligence in Real-Time Environmental Monitoring—Solutions and First Results. Sensors 2021, 21, 3911. https://doi.org/10.3390/s21113911
Post C, Brülisauer S, Waldschläger K, Hug W, Grüneis L, Heyden N, Schmor S, Förderer A, Reid R, Reid M, et al. Application of Laser-Induced, Deep UV Raman Spectroscopy and Artificial Intelligence in Real-Time Environmental Monitoring—Solutions and First Results. Sensors. 2021; 21(11):3911. https://doi.org/10.3390/s21113911
Chicago/Turabian StylePost, Claudia, Simon Brülisauer, Kryss Waldschläger, William Hug, Luis Grüneis, Niklas Heyden, Sebastian Schmor, Aaron Förderer, Ray Reid, Michael Reid, and et al. 2021. "Application of Laser-Induced, Deep UV Raman Spectroscopy and Artificial Intelligence in Real-Time Environmental Monitoring—Solutions and First Results" Sensors 21, no. 11: 3911. https://doi.org/10.3390/s21113911
APA StylePost, C., Brülisauer, S., Waldschläger, K., Hug, W., Grüneis, L., Heyden, N., Schmor, S., Förderer, A., Reid, R., Reid, M., Bhartia, R., Nguyen, Q., Schüttrumpf, H., & Amann, F. (2021). Application of Laser-Induced, Deep UV Raman Spectroscopy and Artificial Intelligence in Real-Time Environmental Monitoring—Solutions and First Results. Sensors, 21(11), 3911. https://doi.org/10.3390/s21113911