
A People-Counting and Speed-Estimation System Using Wi-Fi Signals


Abstract
1. Introduction
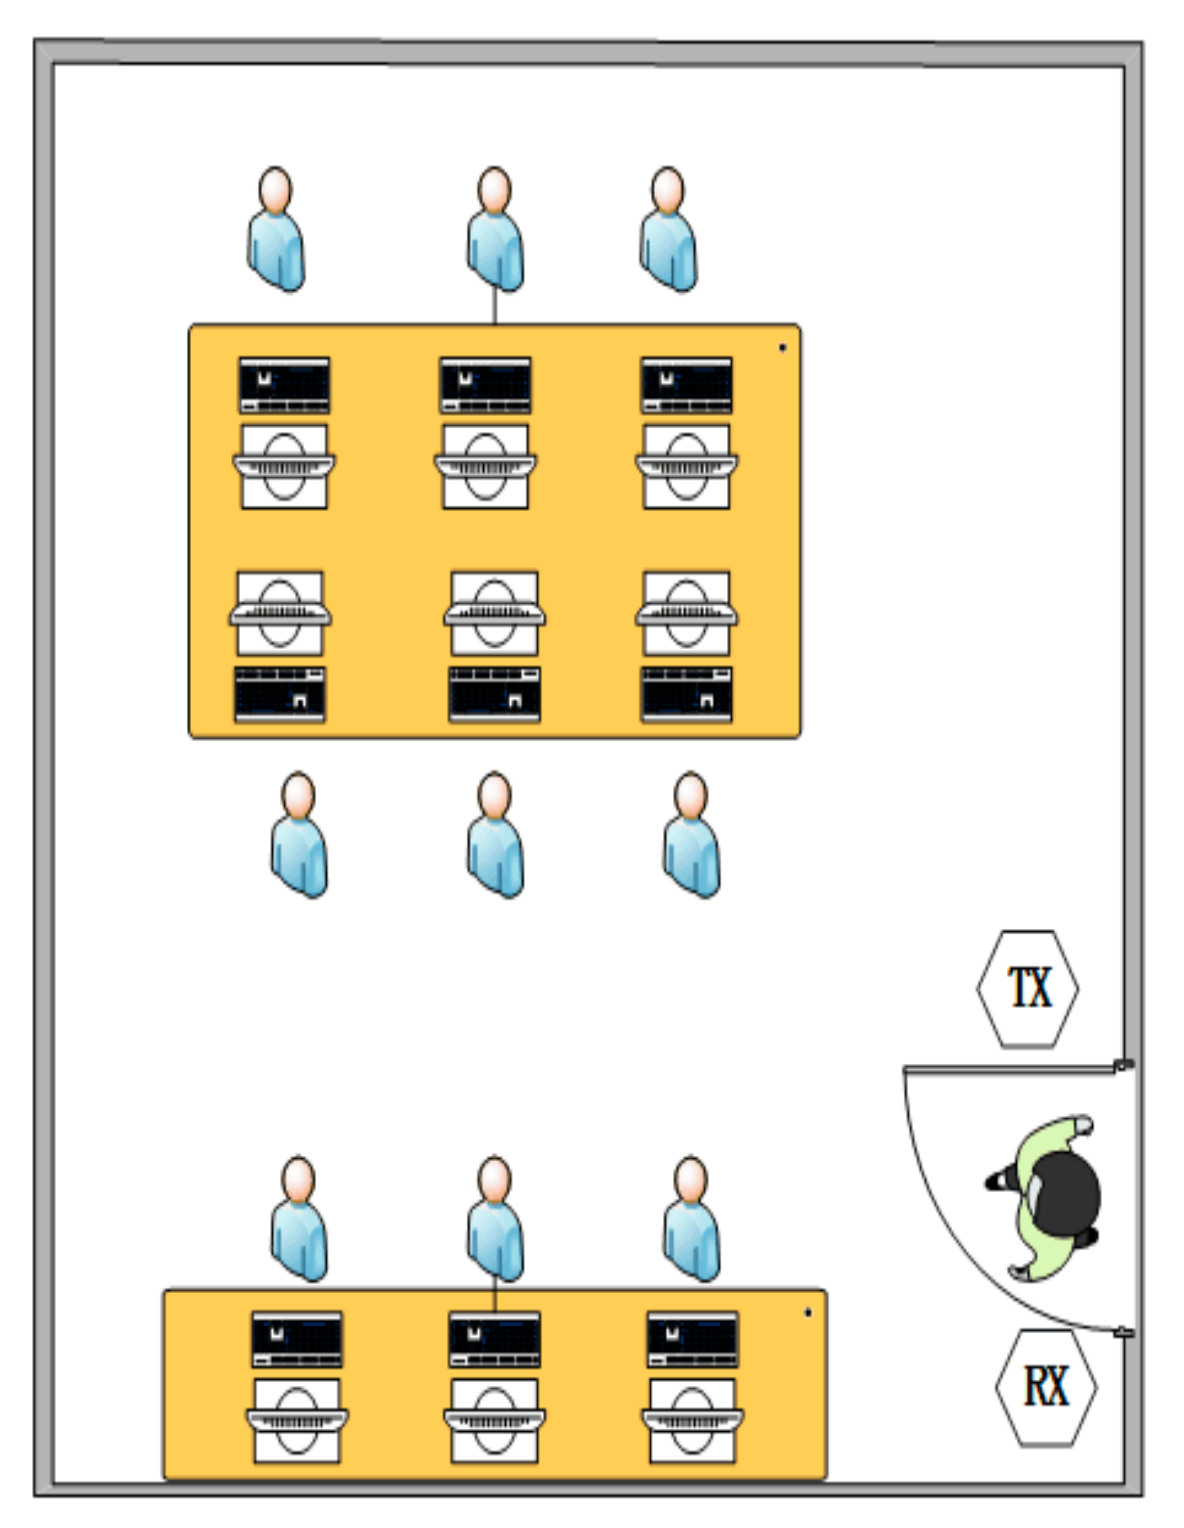
- (a)
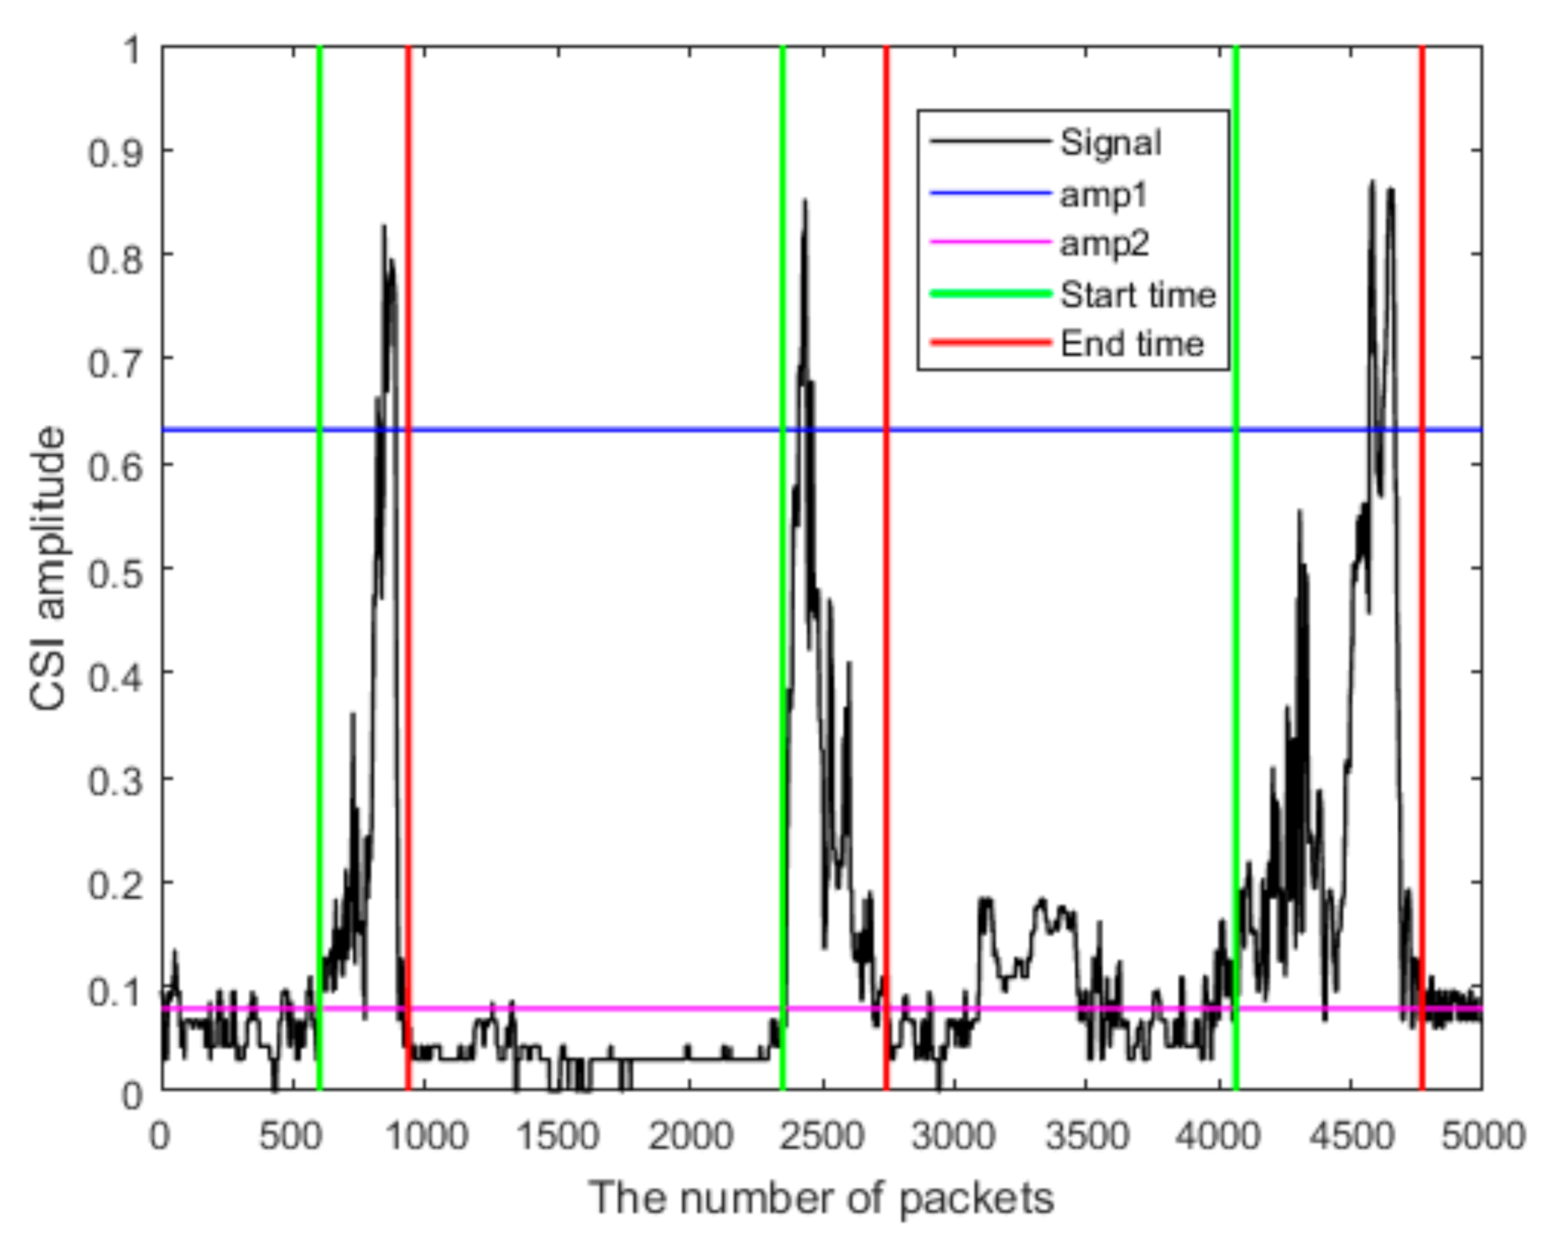
- A double threshold technique is proposed to detect the start and end times of entering or leaving a room. It overcomes the issues of inaccuracy and large computational expenditures that are associated with the conventional manual algorithm described in [29] and the sliding variance method.
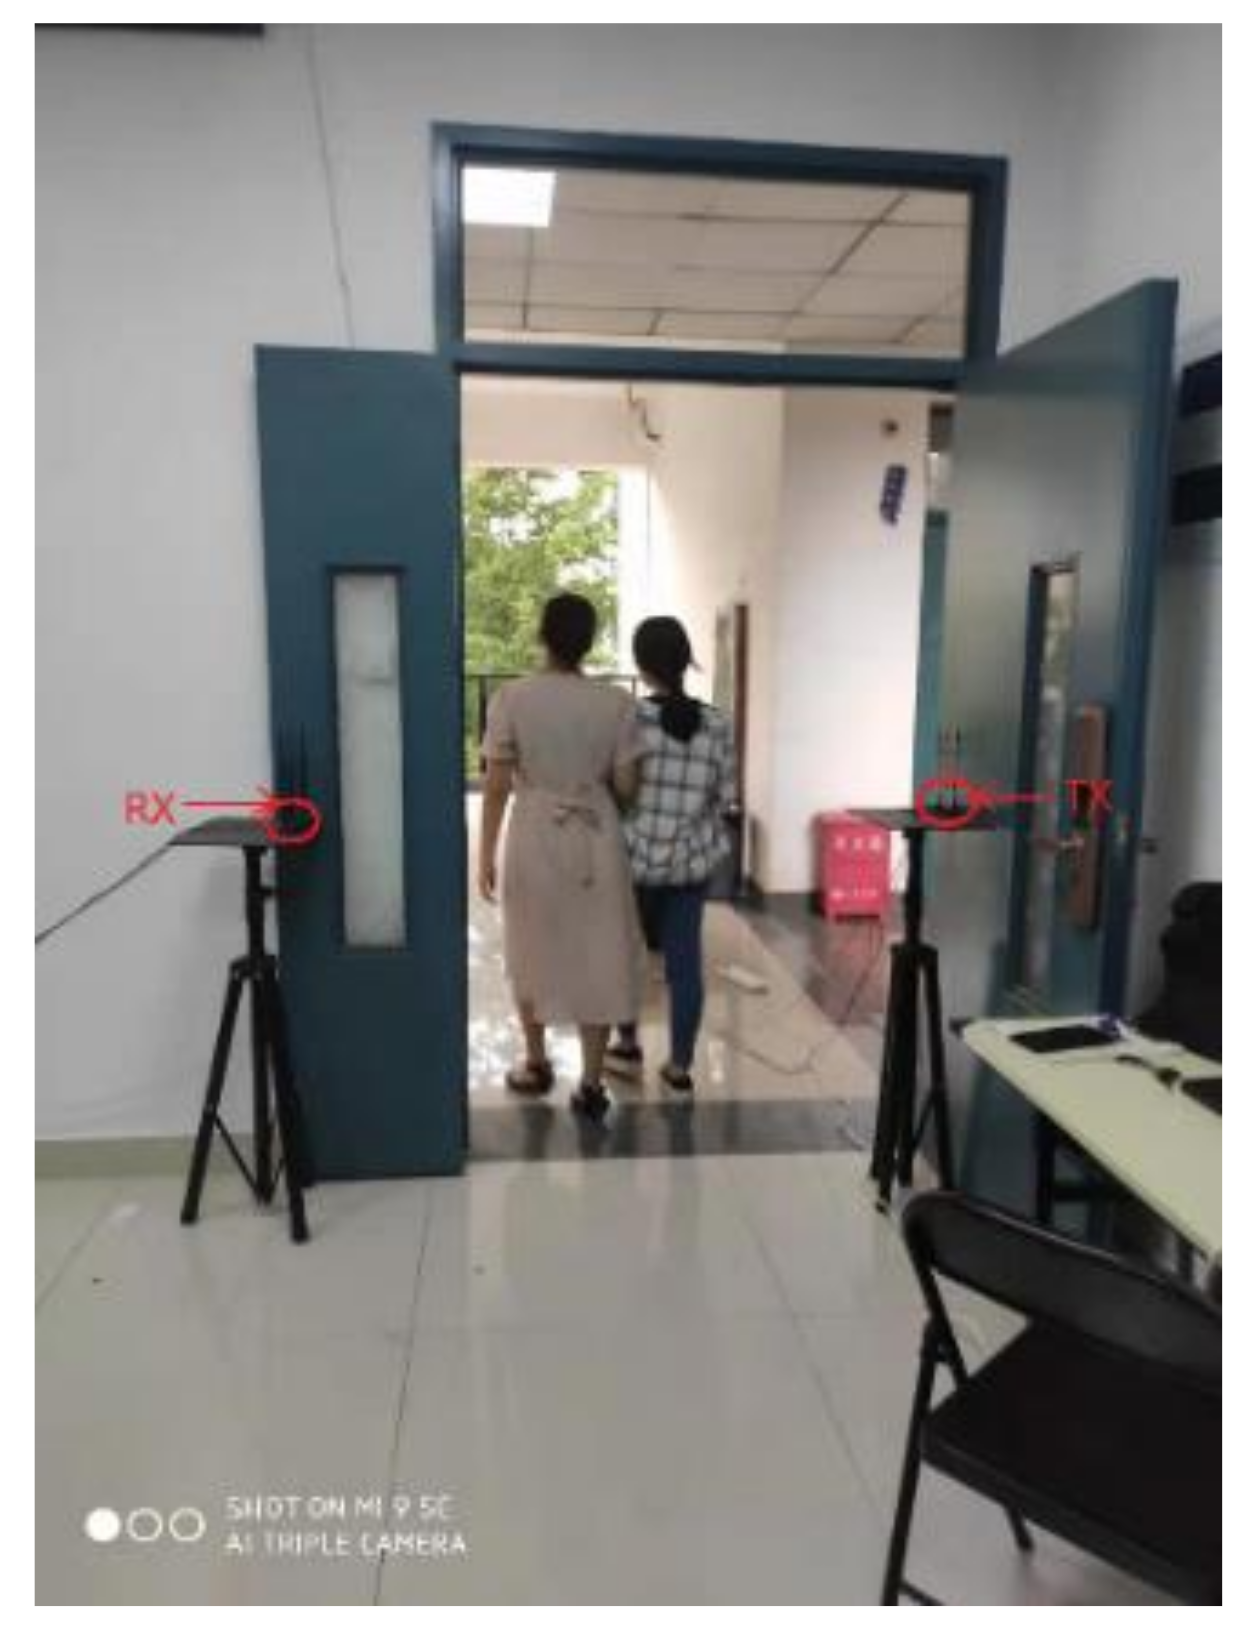
- (b)
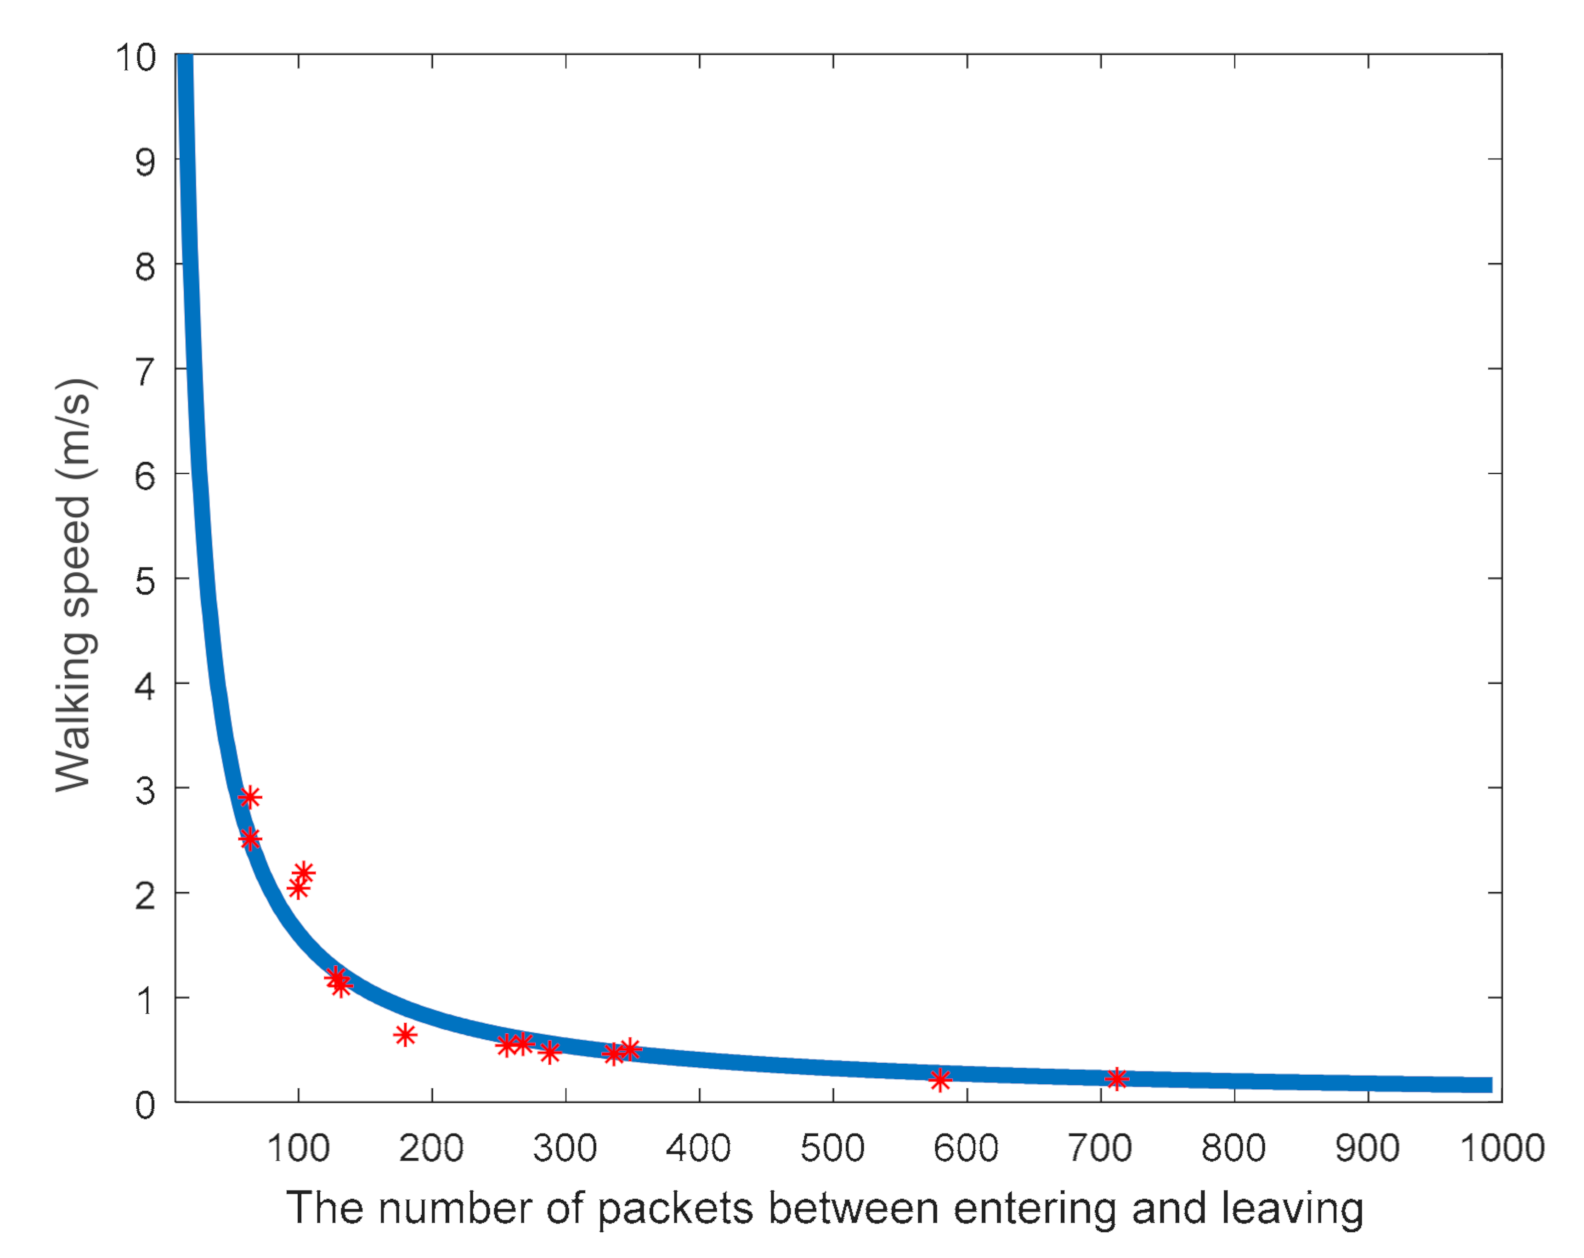
- An estimation method is developed for the walking speeds of a person with a nonlinear curve-fitting technique.
- (c)
- A detection method is developed to determine the number of people entering or leaving a room. Unlike the deep learning algorithm, such as the door monitoring method presented in [28], this method requires no data training, but a predeveloped sample database.
- (d)
- A variance method is proposed to determine the states of entering or leaving. It utilizes the differences between the signal variances inside and outside a room—a feature that has not been explored or reported in the literature so far. It leads to a relatively simple computation algorithm that requires only one receiving antenna (unlike the two-antenna approach presented in [28]).
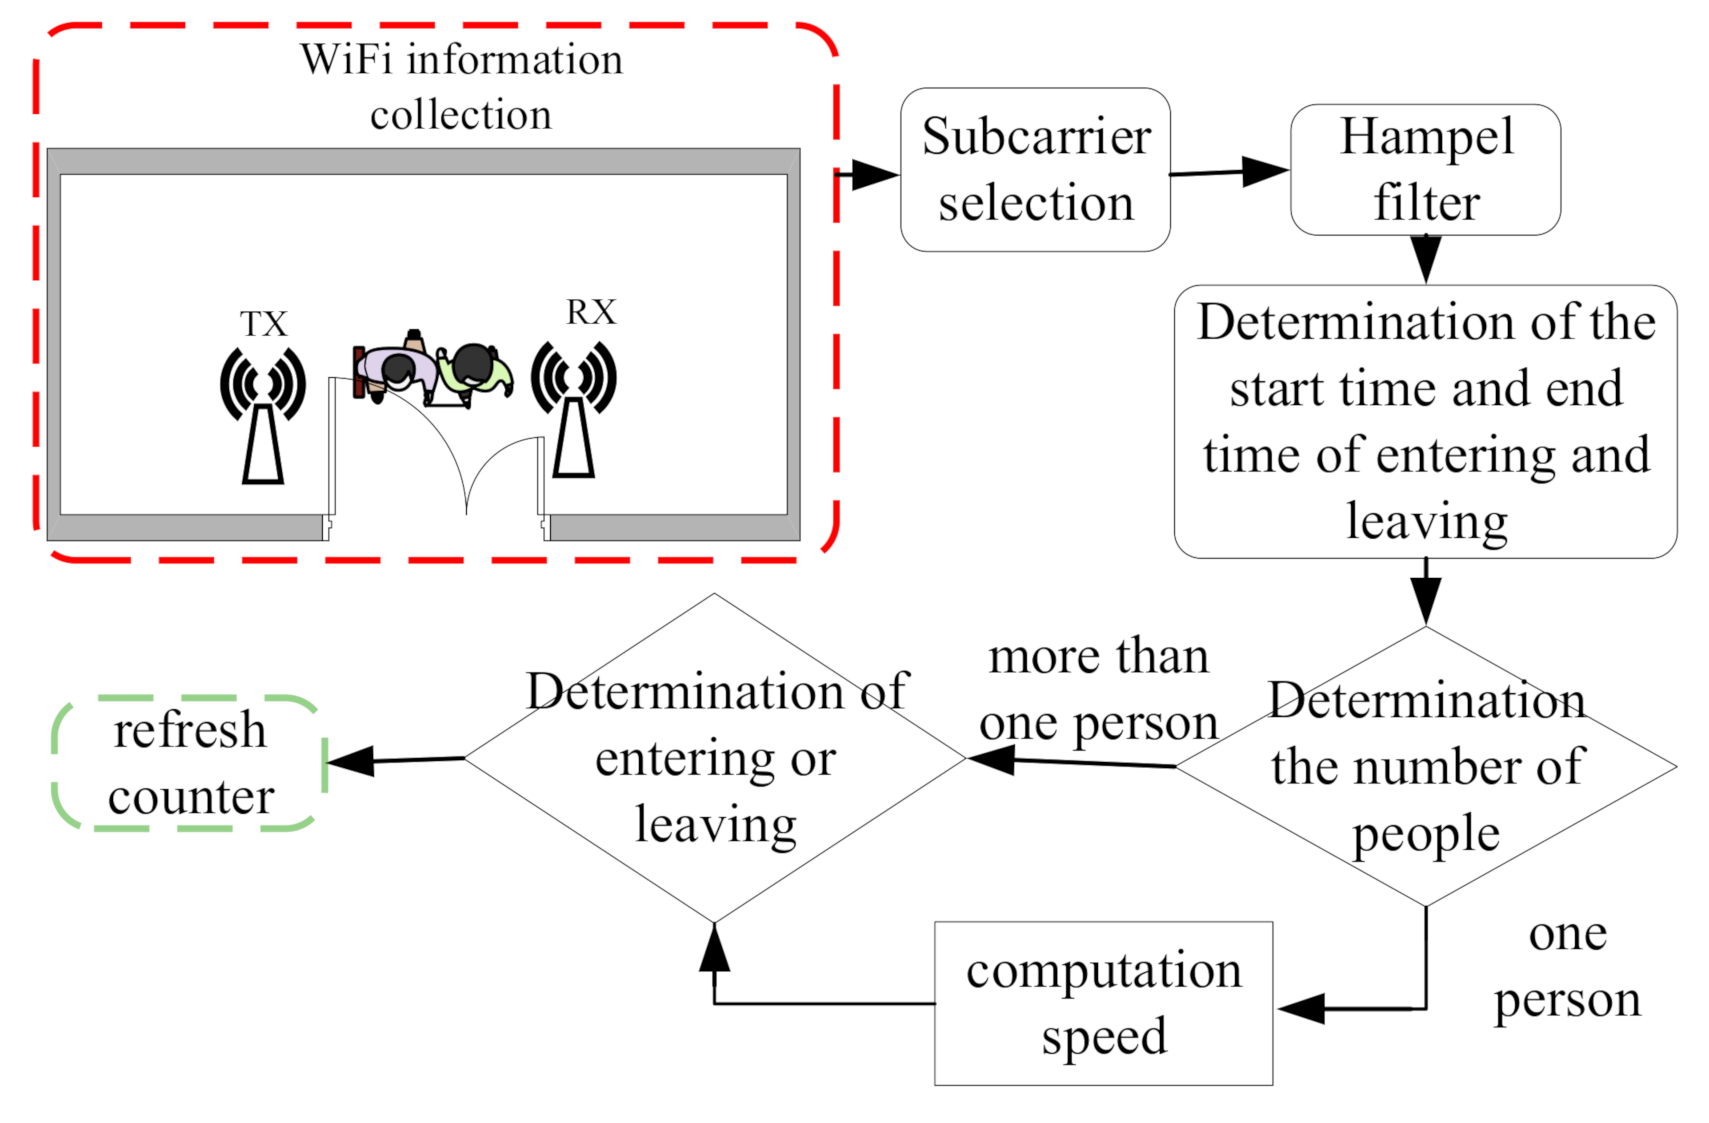
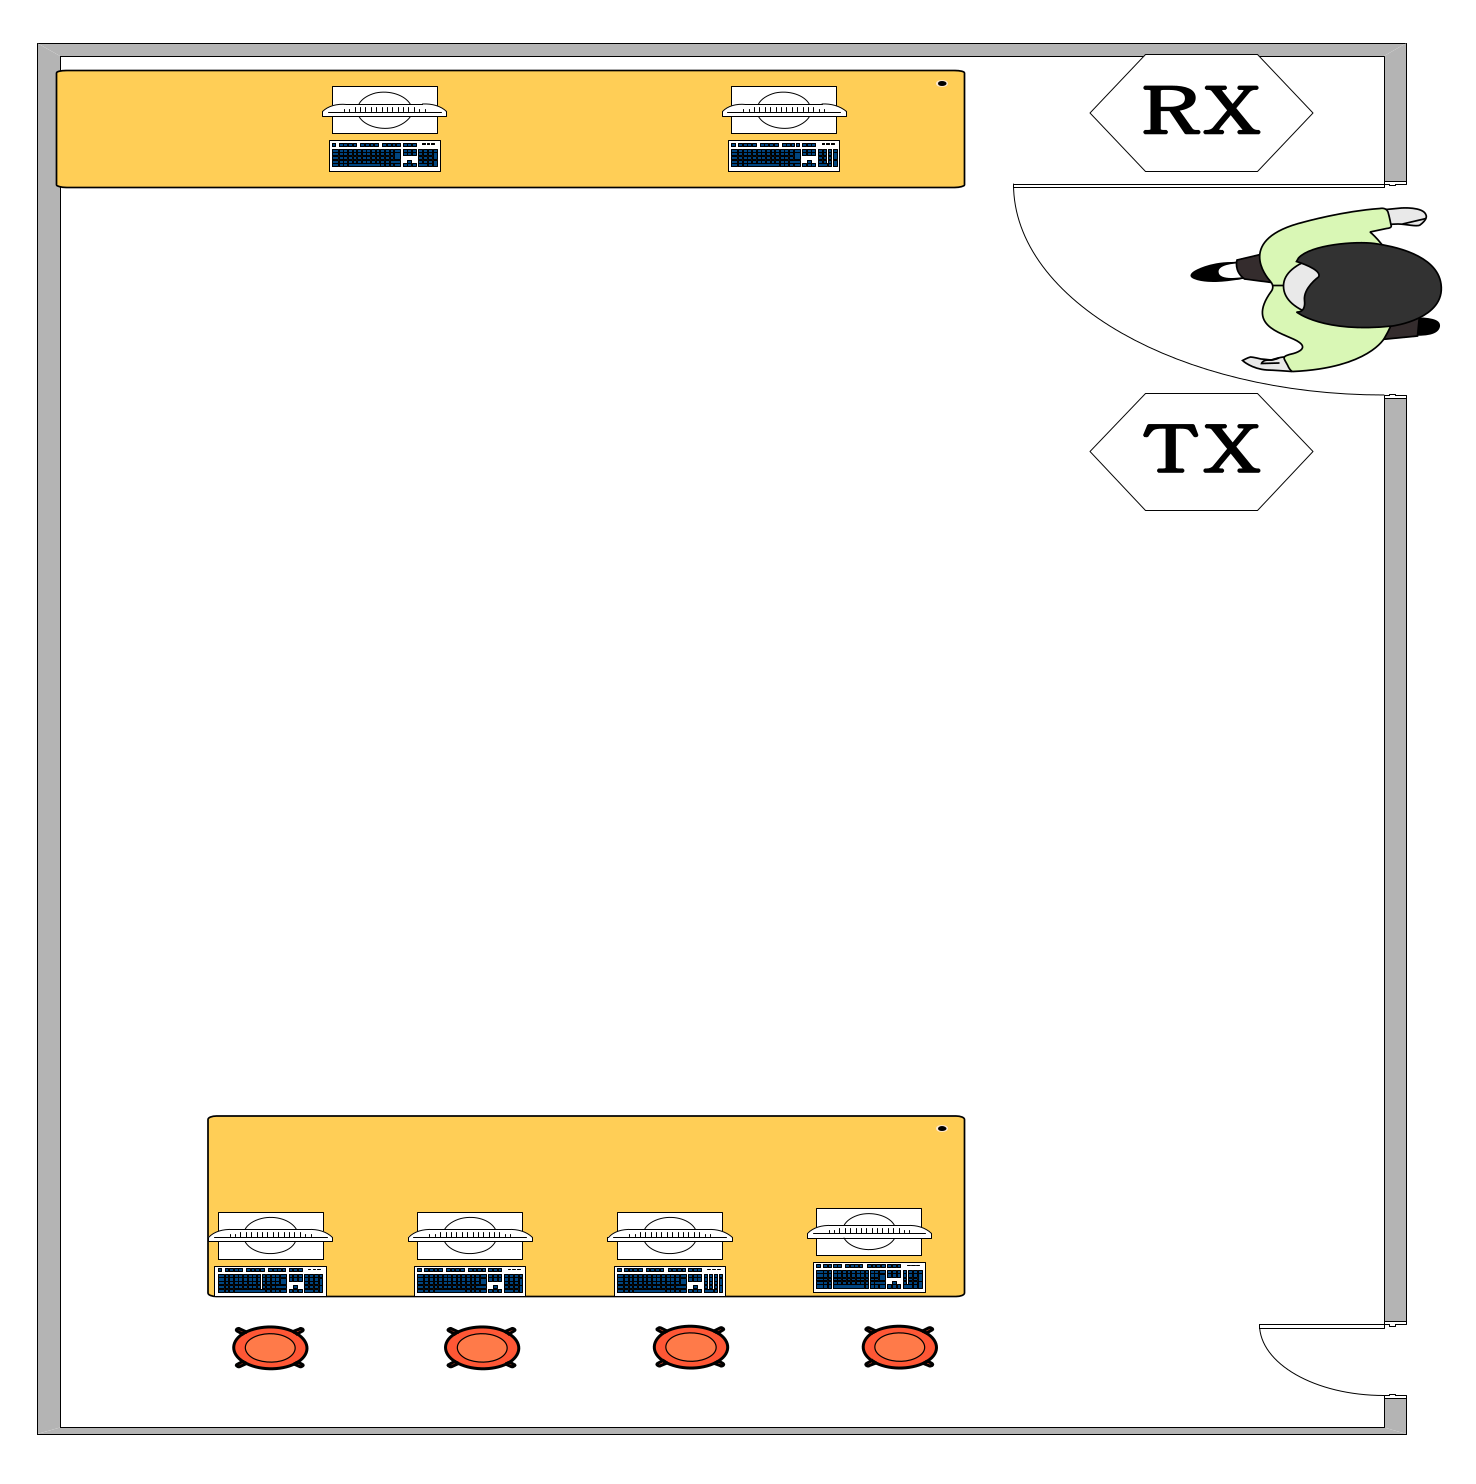
2. Materials and Methods
2.1. Selection and Filtering of the Subcarriers
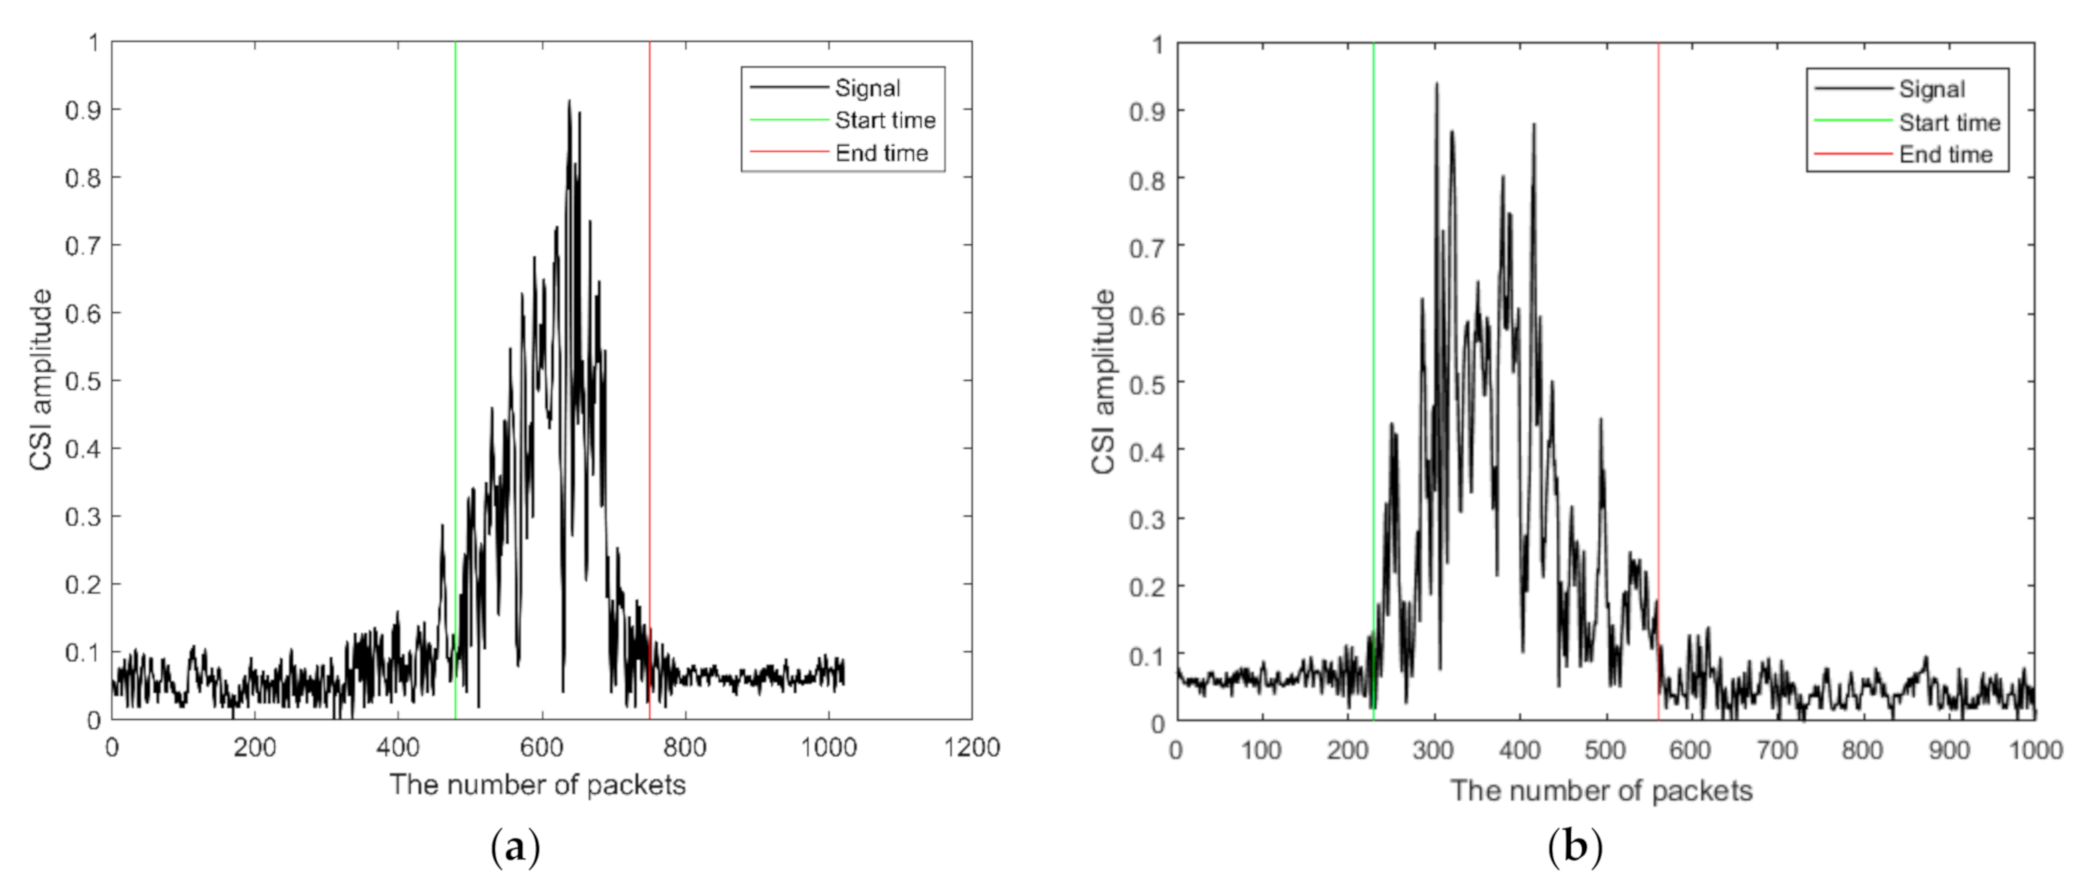
2.2. Determination of the Start and End Times
| Algorithm 1: Determination of the start and end times. |
| Input: amp, amp1, amp2, Output: v_Begin, v_End for n = 1: length(amp) switch status case {0, 1} If amp(n) > amp1 Identify the entering and leaving stage; else if amp(n) > amp2 May be the entering and leaving stage; else No one entering and leaving; End if case 2 if amp(n) > amp2 Keep entering and leaving stage; else entering and leaving stage will end; else End of entering and leaving stage; End if case 3 Record the current stage and look for the next stage End switch end for |
2.3. Determination of the Number of People
2.4. Determination of the State of Entering and Leaving
2.5. Determination of the Velocity
3. Results
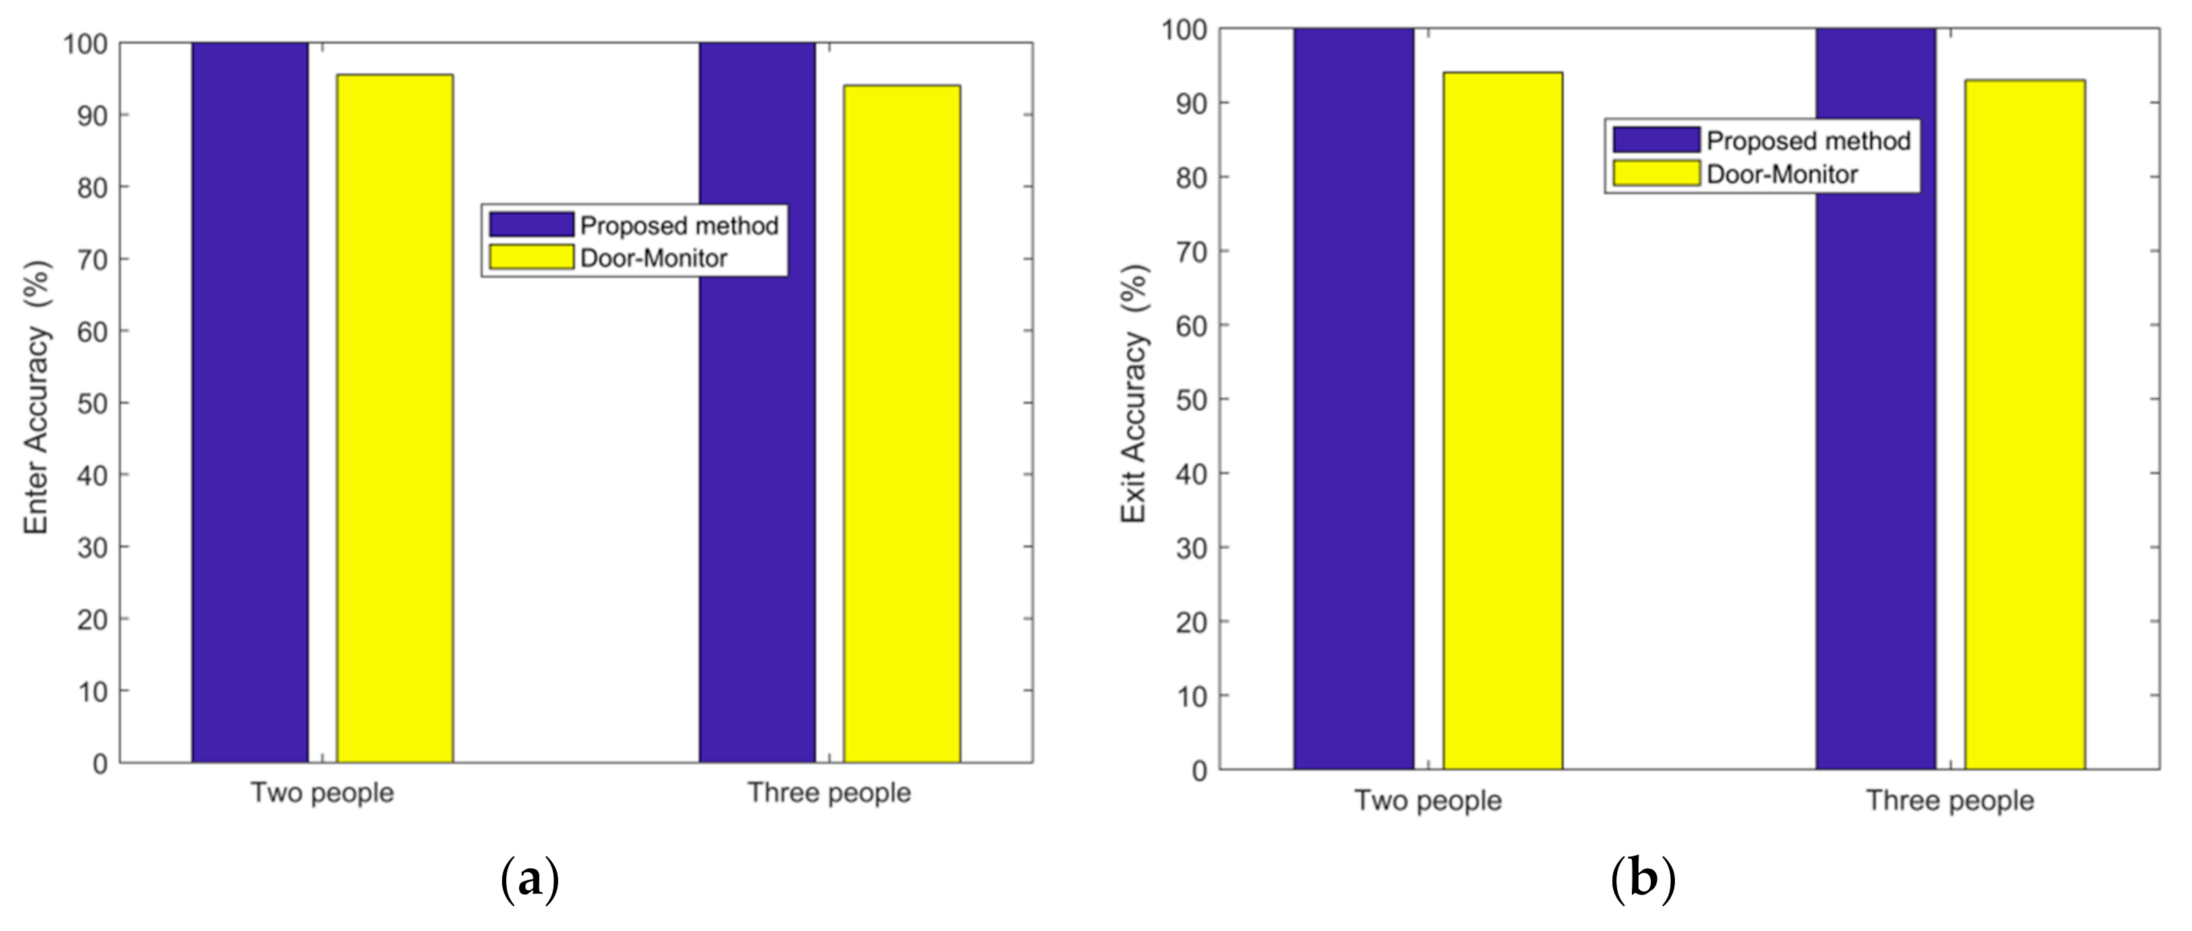
3.1. Detection of Passing Directions: Entering or Leaving (Exiting)
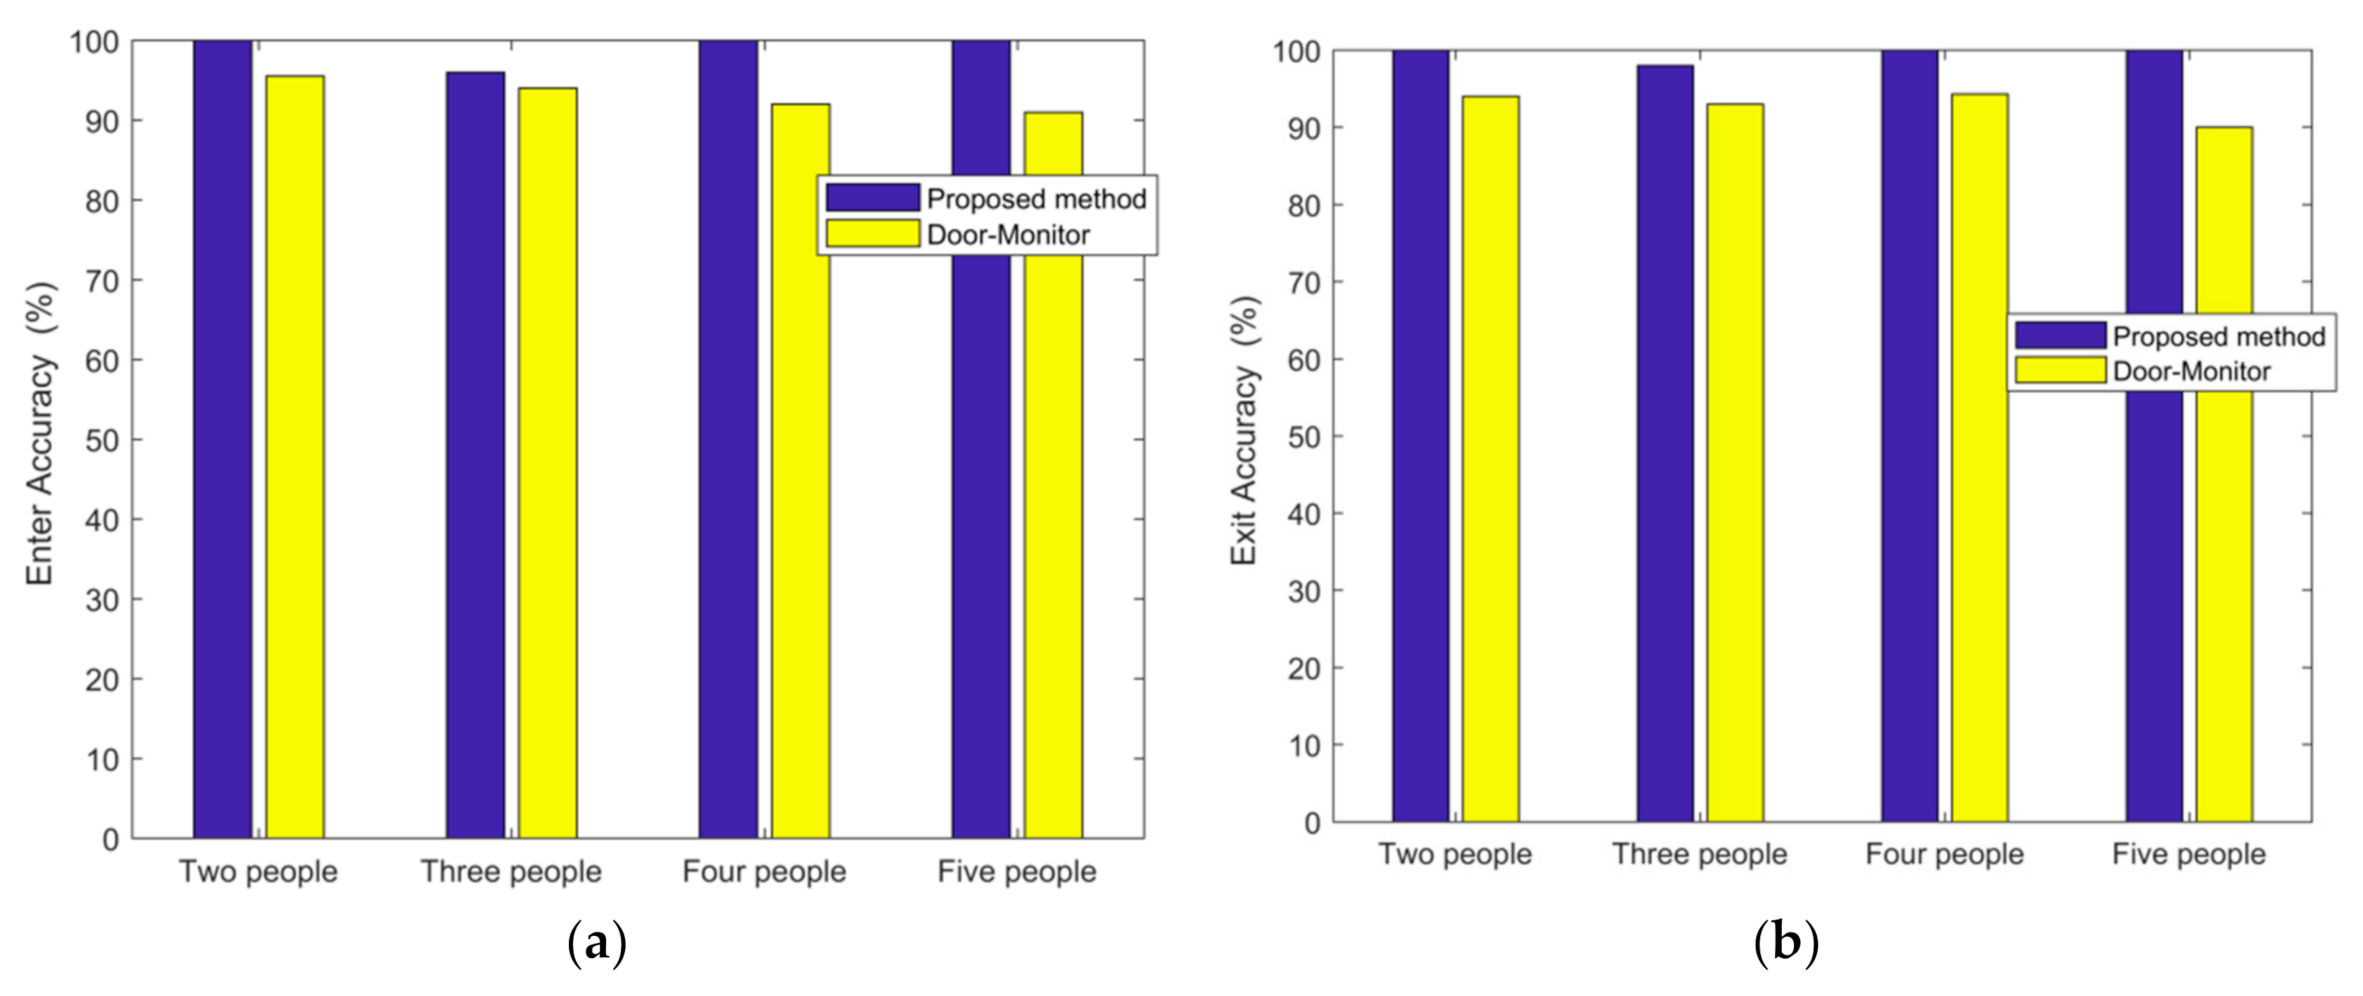
3.2. Determination of the Number of People
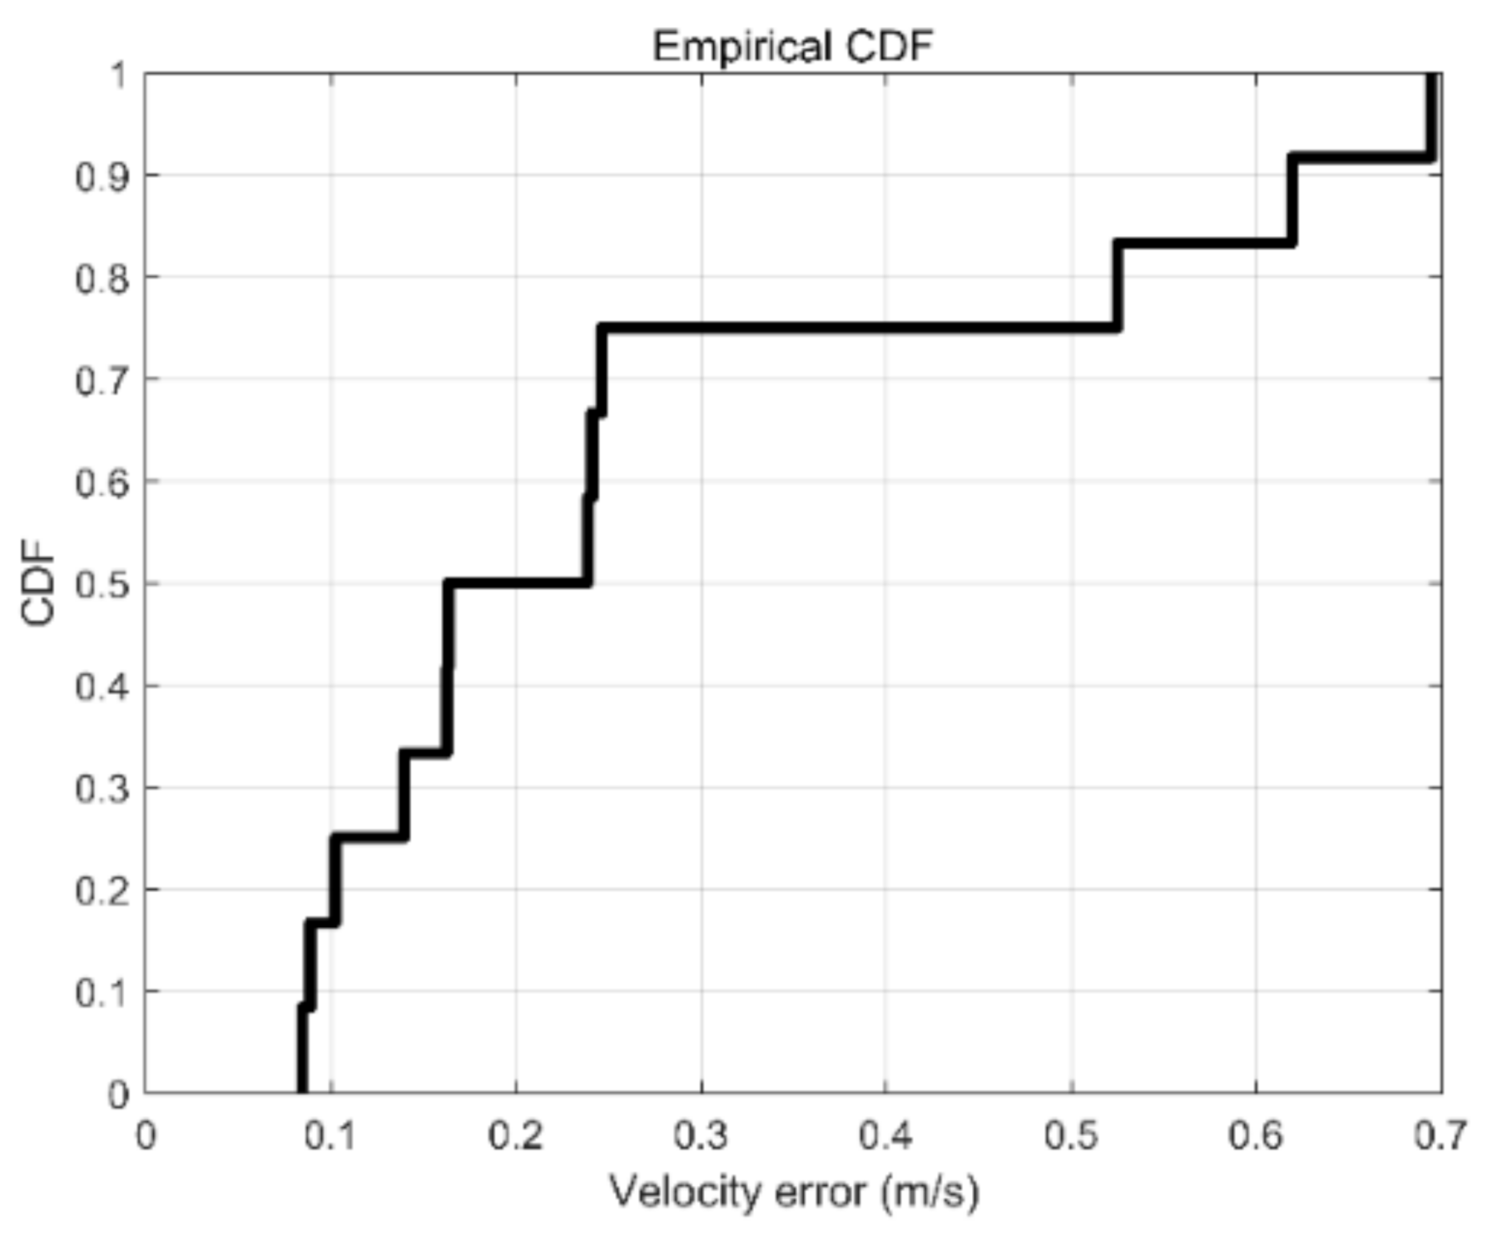
3.3. Estimation of the Walking Speed
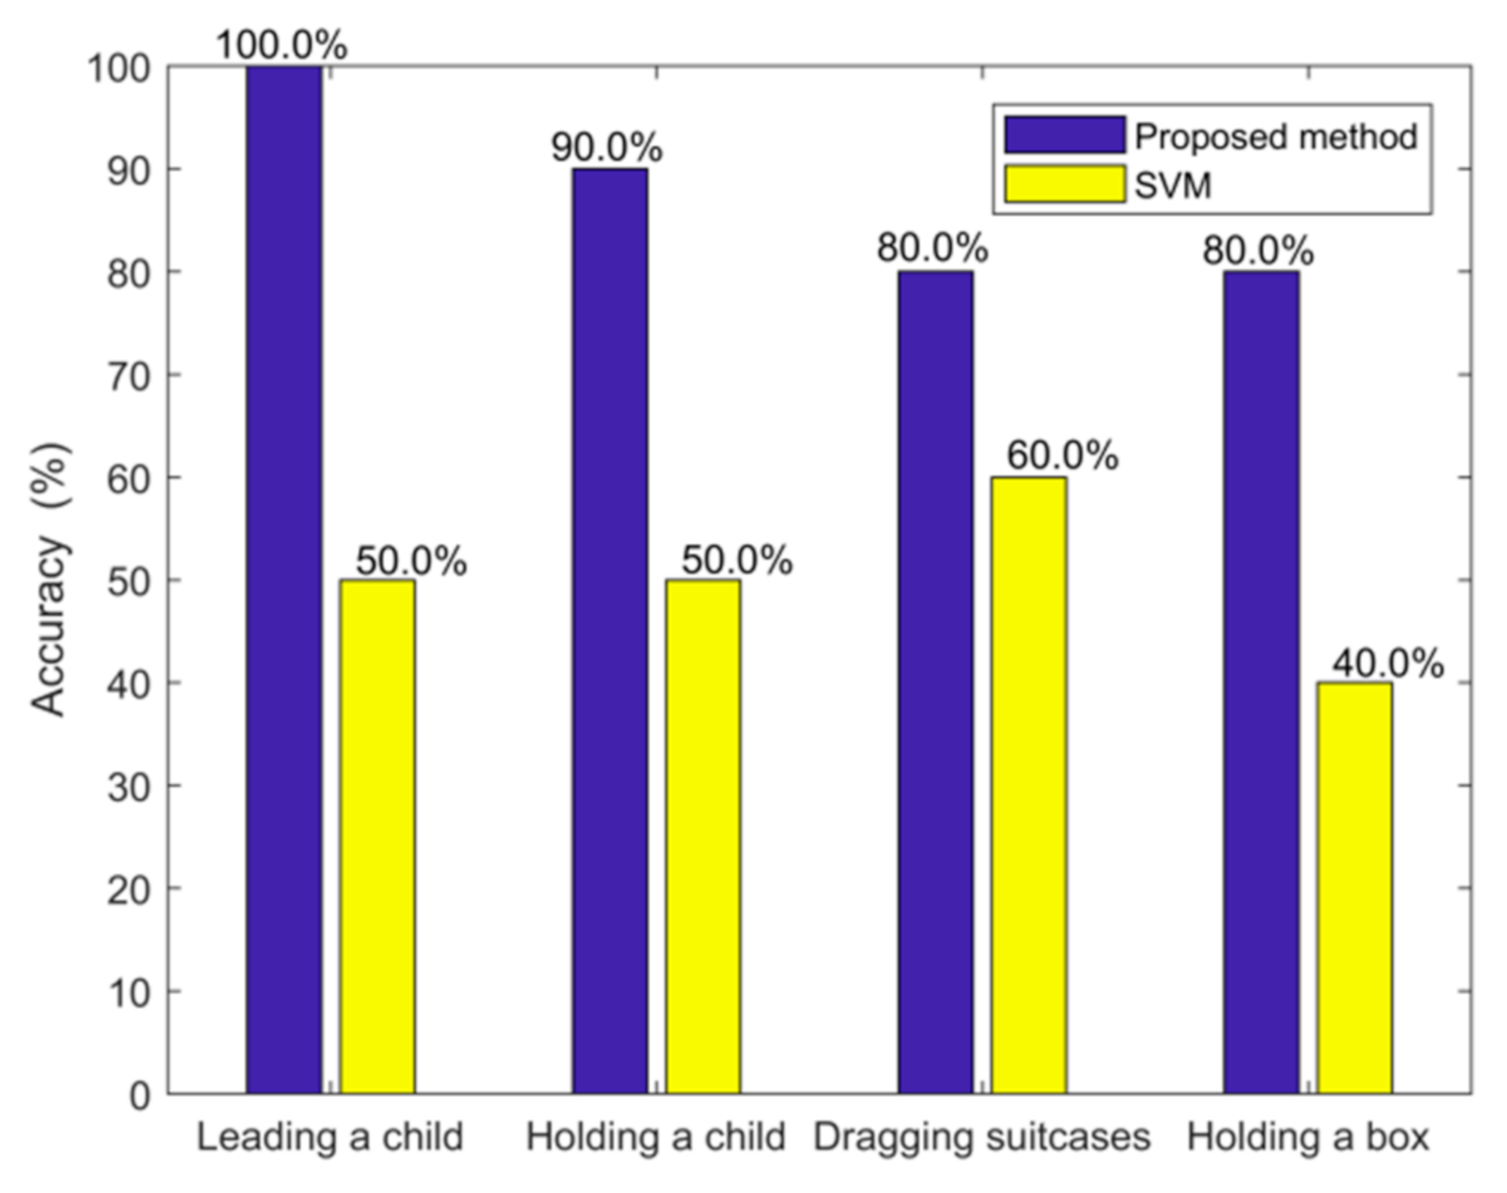
3.4. Impact of the Sizes of the Objects Carried
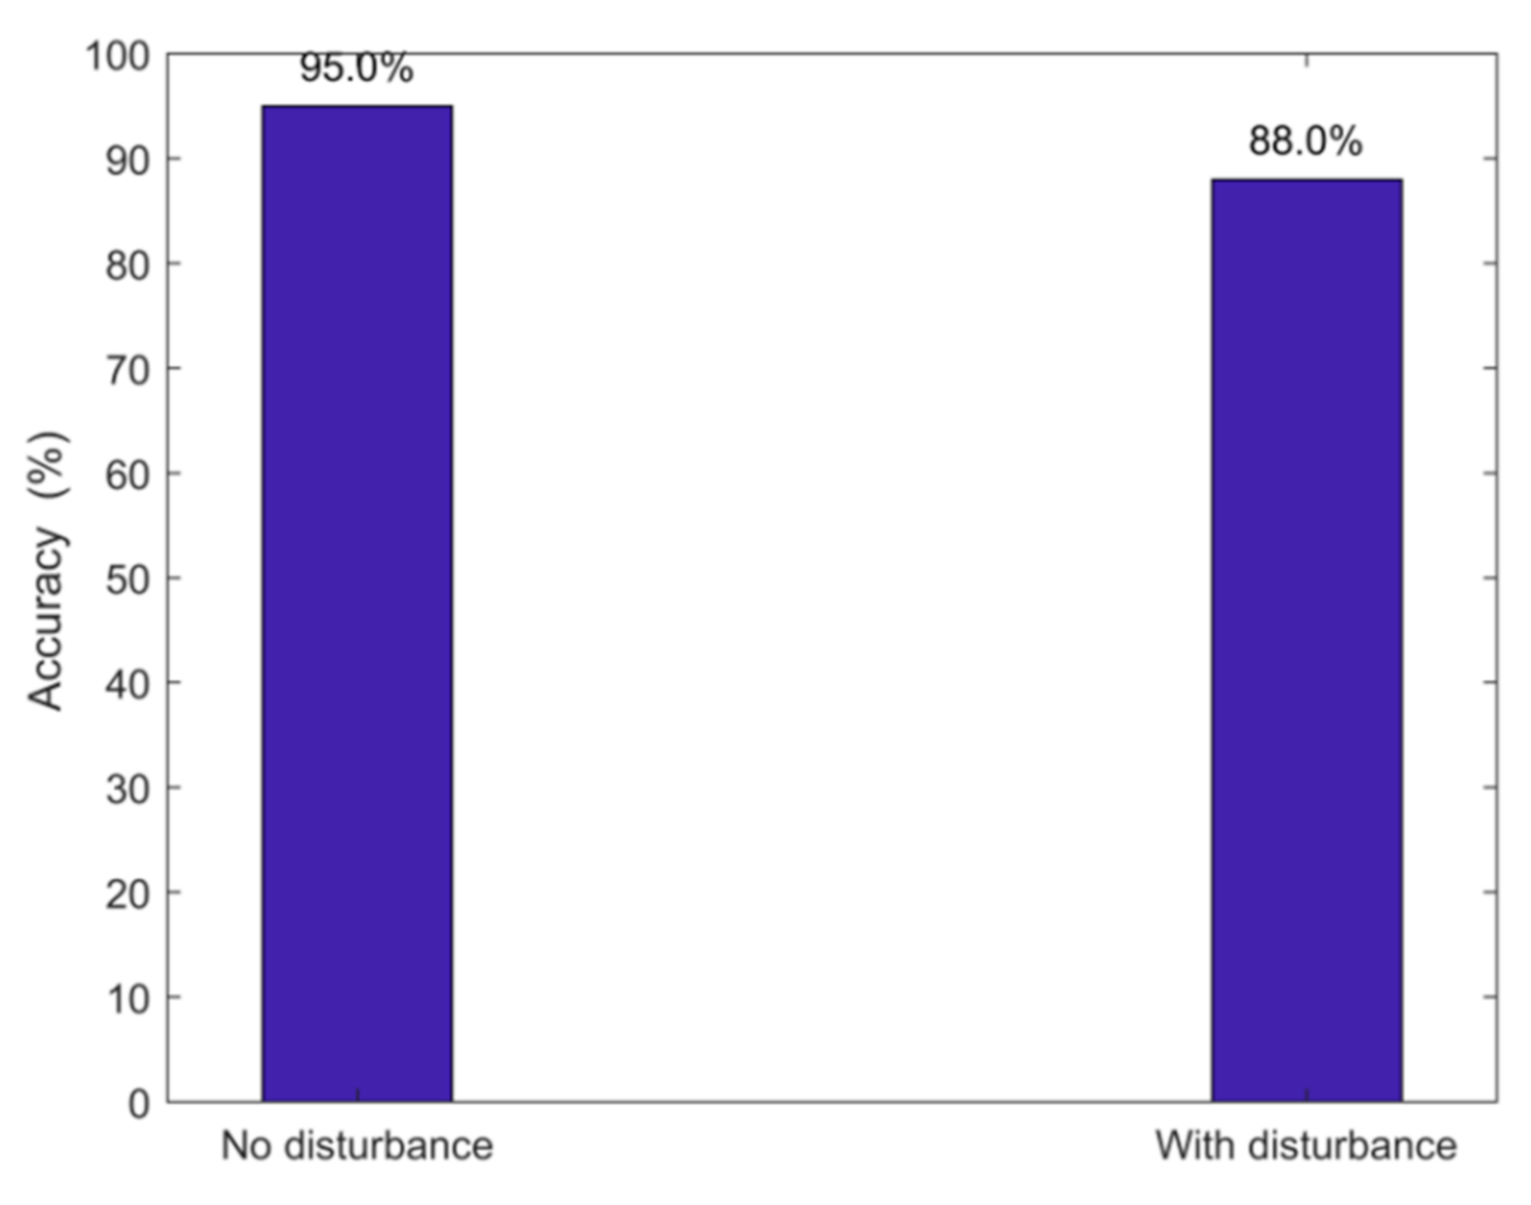
3.5. Impact of the Disturbance
4. Conclusions
Author Contributions
Funding
Institutional Review Board Statement
Informed Consent Statement
Data Availability Statement
Conflicts of Interest
References
- Kim, M.; Kim, W.; Kim, C. Estimating the number of people in crowded scenes by MID based foreground segmentation and head-shoulder detection. In Proceedings of the 19th international Conference on Pattern Recognition, Tampa, FL, USA, 8–12 December 2008; pp. 1–4. [Google Scholar]
- Chan, A.B.; Liang, Z.-S.J.; Vasconcelos, N. Privacy preserving crowd monitoring: Counting people without people models or tracking. In Proceedings of the 2008 IEEE Conference on Computer Vision and Pattern Recognition, Anchorage, AK, USA, 23–28 June 2008; pp. 1–7. [Google Scholar]
- Idrees, H.; Saleemi, I.; Seibert, C.; Shah, M. Multi-source Multi-scale Counting in Extremely Dense Crowd Images. In Proceedings of the 2013 IEEE Conference on Computer Vision and Pattern Recognition, Portland, OR, USA, 23–28 June 2013; pp. 2547–2554. [Google Scholar]
- Subburaman, V.B.; Descamps, A.; Carincotte, C. Counting People in the Crowd Using a Generic Head Detector. In Proceedings of the 2012 IEEE Ninth International Conference on Advanced Video and Signal-Based Surveillance, Beijing, China, 18–21 September 2012; pp. 470–475. [Google Scholar]
- Kannan, P.G.; Venkatagiri, S.P.; Chan, M.C.; Ananda, A.L.; Peh, L.-S. Low cost crowd counting using audio tones. In Proceedings of the 10th ACM Conference on Recommender Systems, Toronto, ON, Canada, 6–9 November 2012; pp. 155–168. [Google Scholar]
- Weppner, J.; Lukowicz, P. Bluetooth based collaborative crowd density estimation with mobile phones. In Proceedings of the 2013 IEEE International Conference on Pervasive Computing and Communications (PerCom), San Diego, CA, USA, 18–22 March 2013; pp. 193–200. [Google Scholar]
- Ni, L.M.; Liu, Y.; Lau, Y.C.; Patil, A.P. LANDMARC: Indoor location sensing using active RFID. In Proceedings of the First IEEE International Conference on Pervasive Computing and Communications, Fort Worth, TX, USA, 26 March 2003; pp. 407–415. [Google Scholar]
- Zheng, X.; Wang, J.; Shangguan, L.; Zhou, Z.; Liu, Y. Smokey: Ubiquitous smoking detection with commercial WiFi infrastructures. In Proceedings of the IEEE INFOCOM 2016—The 35th Annual IEEE International Conference on Computer Communications, San Francisco, CA, USA, 10–14 April 2016; pp. 1–9. [Google Scholar]
- Duan, S.; Yu, T.; He, J. WiDriver: Driver Activity Recognition System Based on WiFi CSI. Int. J. Wirel. Inf. Netw. 2018, 25, 146–156. [Google Scholar] [CrossRef]
- Feng, C.; Arshad, S.; Liu, Y. MAIS: Multiple activity identification system using channel state information of WiFi signals. In Transactions on Petri Nets and Other Models of Concurrency XV; Springer Science and Business Media LLC: Cham, Switzerland, 2017; pp. 419–432. [Google Scholar]
- Guo, L.; Wang, L.; Liu, J.; Zhou, W.; Lu, B. HuAc: Human Activity Recognition Using Crowdsourced WiFi Signals and Skeleton Data. Wirel. Commun. Mob. Comput. 2018, 2018, 6163475. [Google Scholar] [CrossRef]
- Jiang, W.; Miao, C.; Ma, F.; Yao, S.; Wang, Y.; Yuan, Y.; Xue, H.; Song, C.; Ma, X.; Koutsonikolas, D.; et al. Towards Environment Independent Device Free Human Activity Recognition. In Proceedings of the 24th Annual International Conference on Mobile Computing and Networking, New Delhi, India, 29 October–2 November 2018; pp. 289–304. [Google Scholar]
- Zhang, J.; Wei, B.; Hu, W.; Kanhere, S.S. WiFi-ID: Human Identification Using WiFi Signal. In Proceedings of the 2016 International Conference on Distributed Computing in Sensor Systems (DCOSS), Washington, DC, USA, 26–25 May 2016; pp. 75–82. [Google Scholar]
- Zeng, Y.; Pathak, P.H.; Mohapatra, P. WiWho: WiFi-based person identification in smart spaces. In Proceedings of the 2016 15th ACM/IEEE International Conference on Information Processing in Sensor Networks (IPSN), Vienna, Austria, 28 April 2016; pp. 1–12. [Google Scholar]
- Ali, K.; Liu, A.X.; Wang, W.; Shahzad, M. Keystroke Recognition Using WiFi Signals. In Proceedings of the 21st Annual International Conference on Mobile Computing and Networking, Paris, France, 7–11 September 2015; pp. 90–102. [Google Scholar]
- Kotaru, M.; Joshi, K.; Bharadia, D.; Katti, S. SpotFi: Decimeter level localization using WiFi. In Proceedings of the ACM SIGCOMM Computer Communication Review, London, UK, 17–21 August 2015; Volume 45, pp. 269–282. [Google Scholar]
- Xu, C.; Firner, B.; Moore, R.S.; Zhang, Y.; Trappe, W.; Howard, R.; Zhang, F.; An, N. Scpl: Indoor device-free multi-subject counting and localization using radio signal strength. In Proceedings of the 2013 ACM/IEEE International Conference on Information Processing in Sensor Networks (IPSN), Philadelphia, PA, USA, 8–11 April 2013; pp. 79–90. [Google Scholar]
- Wang, X.; Yang, C.; Mao, S. PhaseBeat: Exploiting CSI Phase Data for Vital Sign Monitoring with Commodity WiFi Devices. In Proceedings of the 2017 IEEE 37th International Conference on Distributed Computing Systems (ICDCS), Atlanta, GA, USA, 5–8 June 2017; pp. 1230–1239. [Google Scholar]
- Liu, J.; Chen, Y.; Wang, Y.; Chen, X.; Cheng, J.; Yang, J. Monitoring Vital Signs and Postures During Sleep Using WiFi Signals. IEEE Internet Things J. 2018, 5, 2071–2084. [Google Scholar] [CrossRef]
- Wang, H.; Zhang, D.; Ma, J.; Wang, Y.; Wang, Y.; Wu, D.; Gu, T.; Xie, B. Human respiration detection with Commodity WiFi Devices: Do user location and body orientation matter? In Proceedings of the 2016 ACM International Joint Conference on Pervasive and Ubiquitous Computing (UbiComp 2016), Heidelberg, Germany, 12–16 September 2016; pp. 25–36. [Google Scholar]
- Zhang, D.; Hu, Y.; Chen, Y.; Zeng, B. BreathTrack: Tracking Indoor Human Breath Status via Commodity WiFi. IEEE Internet Things J. 2019, 6, 3899–3911. [Google Scholar] [CrossRef]
- Lee, S.; Park, Y.-D.; Suh, Y.-J.; Jeon, S. Design and implementation of monitoring system for breathing and heart rate pattern using WiFi signals. In Proceedings of the 2018 15th IEEE Annual Consumer Communications & Networking Conference (CCNC), Las Vegas, NV, USA, 12–15 January 2018; pp. 1–7. [Google Scholar]
- Seifeldin, M.; Saeed, A.; Kosba, A.E.; El-Keyi, A.; Youssef, M. Nuzzer: A Large-Scale Device-Free Passive Localization System for Wireless Environments. IEEE Trans. Mob. Comput. 2013, 12, 1321–1334. [Google Scholar] [CrossRef]
- Xi, W.; Zhao, J.; Li, X.-Y.; Zhao, K.; Tang, S.; Liu, X.; Jiang, Z. Electronic frog eye: Counting crowd using WiFi. In Proceedings of the IEEE INFOCOM 2014—IEEE Conference on Computer Communications, Toronto, ON, Canada, 27 April–2 May 2014; pp. 361–369. [Google Scholar]
- Liu, S.; Lin, Y. Grey Information: Theory and Practical Applications; Springer Science & Business Media: Berlin, Germany, 2006; Volume 37, p. 189. [Google Scholar]
- Depatla, S.; Muralidharan, A.; Mostofi, Y. Mostofi Occupancy estimation using only WiFi power measurements. IEEE J. Sel. Areas Commun. 2015, 33, 1381–1393. [Google Scholar] [CrossRef]
- Adib, F.; Katabi, D. See through walls with WiFi! In Proceedings of the ACM Sigcomm 2013 Conference on Sigcomm, Hong Kong, China, 12–16 August 2013; pp. 75–86. [Google Scholar]
- Yang, Y.; Cao, J.; Liu, X.; Liu, X. Door-Monitor: Counting In-and-Out Visitors with COTS WiFi Devices. IEEE Internet Things J. 2019, 7, 1704–1717. [Google Scholar] [CrossRef]
- Wang, F.; Feng, J.; Zhao, Y.; Zhang, X.; Zhang, S.; Han, J. Joint Activity Recognition and Indoor Localization with WiFi Fingerprints. IEEE Access 2019, 7, 80058–80068. [Google Scholar] [CrossRef]
- Davies, L.; Gather, U. The identifification of multiple outliers. J. Am. Stat. Assoc. 1993, 88, 782–792. [Google Scholar] [CrossRef]
- Sakoe, H.; Chiba, S. Dynamic programming algorithm optimization for spoken word recognition. IEEE Trans. Acoust. Speech Signal Process. 1978, 26, 43–49. [Google Scholar] [CrossRef]
- Halperin, D.; Hu, W.; Sheth, A.; Wetherall, D. Predictable 802.11 packet delivery from wireless channel measurements. ACM SIGCOMM Comput. Commun. Rev. 2010, 40, 159–170. [Google Scholar] [CrossRef]


| Actual | One Person (100 Tests) | Two Persons (100 Tests) | Three Persons (103 Tests) | |
|---|---|---|---|---|
| Detected | ||||
| One person | 100 | 19 | 5 | |
| Two persons | 0 | 81 | 0 | |
| Three persons | 0 | 0 | 98 | |
| Actual | One Person | Two Persons | Three Persons | Four Persons | Five Persons | |
|---|---|---|---|---|---|---|
| Detected | ||||||
| One person | 99 | 0 | 3 | 0 | 0 | |
| Two persons | 0 | 101 | 10 | 7 | 0 | |
| Three persons | 2 | 0 | 82 | 0 | 0 | |
| Four persons | 0 | 2 | 5 | 96 | 25 | |
| Five persons | 0 | 0 | 0 | 0 | 75 | |
Publisher’s Note: MDPI stays neutral with regard to jurisdictional claims in published maps and institutional affiliations. |
© 2021 by the authors. Licensee MDPI, Basel, Switzerland. This article is an open access article distributed under the terms and conditions of the Creative Commons Attribution (CC BY) license (https://creativecommons.org/licenses/by/4.0/).
Share and Cite
Tian, L.; Chen, L.; Xu, Z.; Chen, Z. A People-Counting and Speed-Estimation System Using Wi-Fi Signals. Sensors 2021, 21, 3472. https://doi.org/10.3390/s21103472
Tian L, Chen L, Xu Z, Chen Z. A People-Counting and Speed-Estimation System Using Wi-Fi Signals. Sensors. 2021; 21(10):3472. https://doi.org/10.3390/s21103472
Chicago/Turabian StyleTian, Liping, Liangqin Chen, Zhimeng Xu, and Zhizhang (David) Chen. 2021. "A People-Counting and Speed-Estimation System Using Wi-Fi Signals" Sensors 21, no. 10: 3472. https://doi.org/10.3390/s21103472
APA StyleTian, L., Chen, L., Xu, Z., & Chen, Z. (2021). A People-Counting and Speed-Estimation System Using Wi-Fi Signals. Sensors, 21(10), 3472. https://doi.org/10.3390/s21103472