Creating Personalized Recommendations in a Smart Community by Performing User Trajectory Analysis through Social Internet of Things Deployment


Abstract
1. Introduction
- (a)
- a trajectory analysis framework that applies user location histories, specifically the trajectories of users with similar behavior and movement patterns,
- (b)
- the adoption of the knowledge–desire–intention (KDI) model [23] to collect user data explicitly (e.g., ratings for items) and implicitly (e.g., location history and number of orders) from profile users, and
- (c)
- a hybrid reasoning approach to leverage the available trajectory-based and contextualized data in performing personalized recommendations.
2. Background
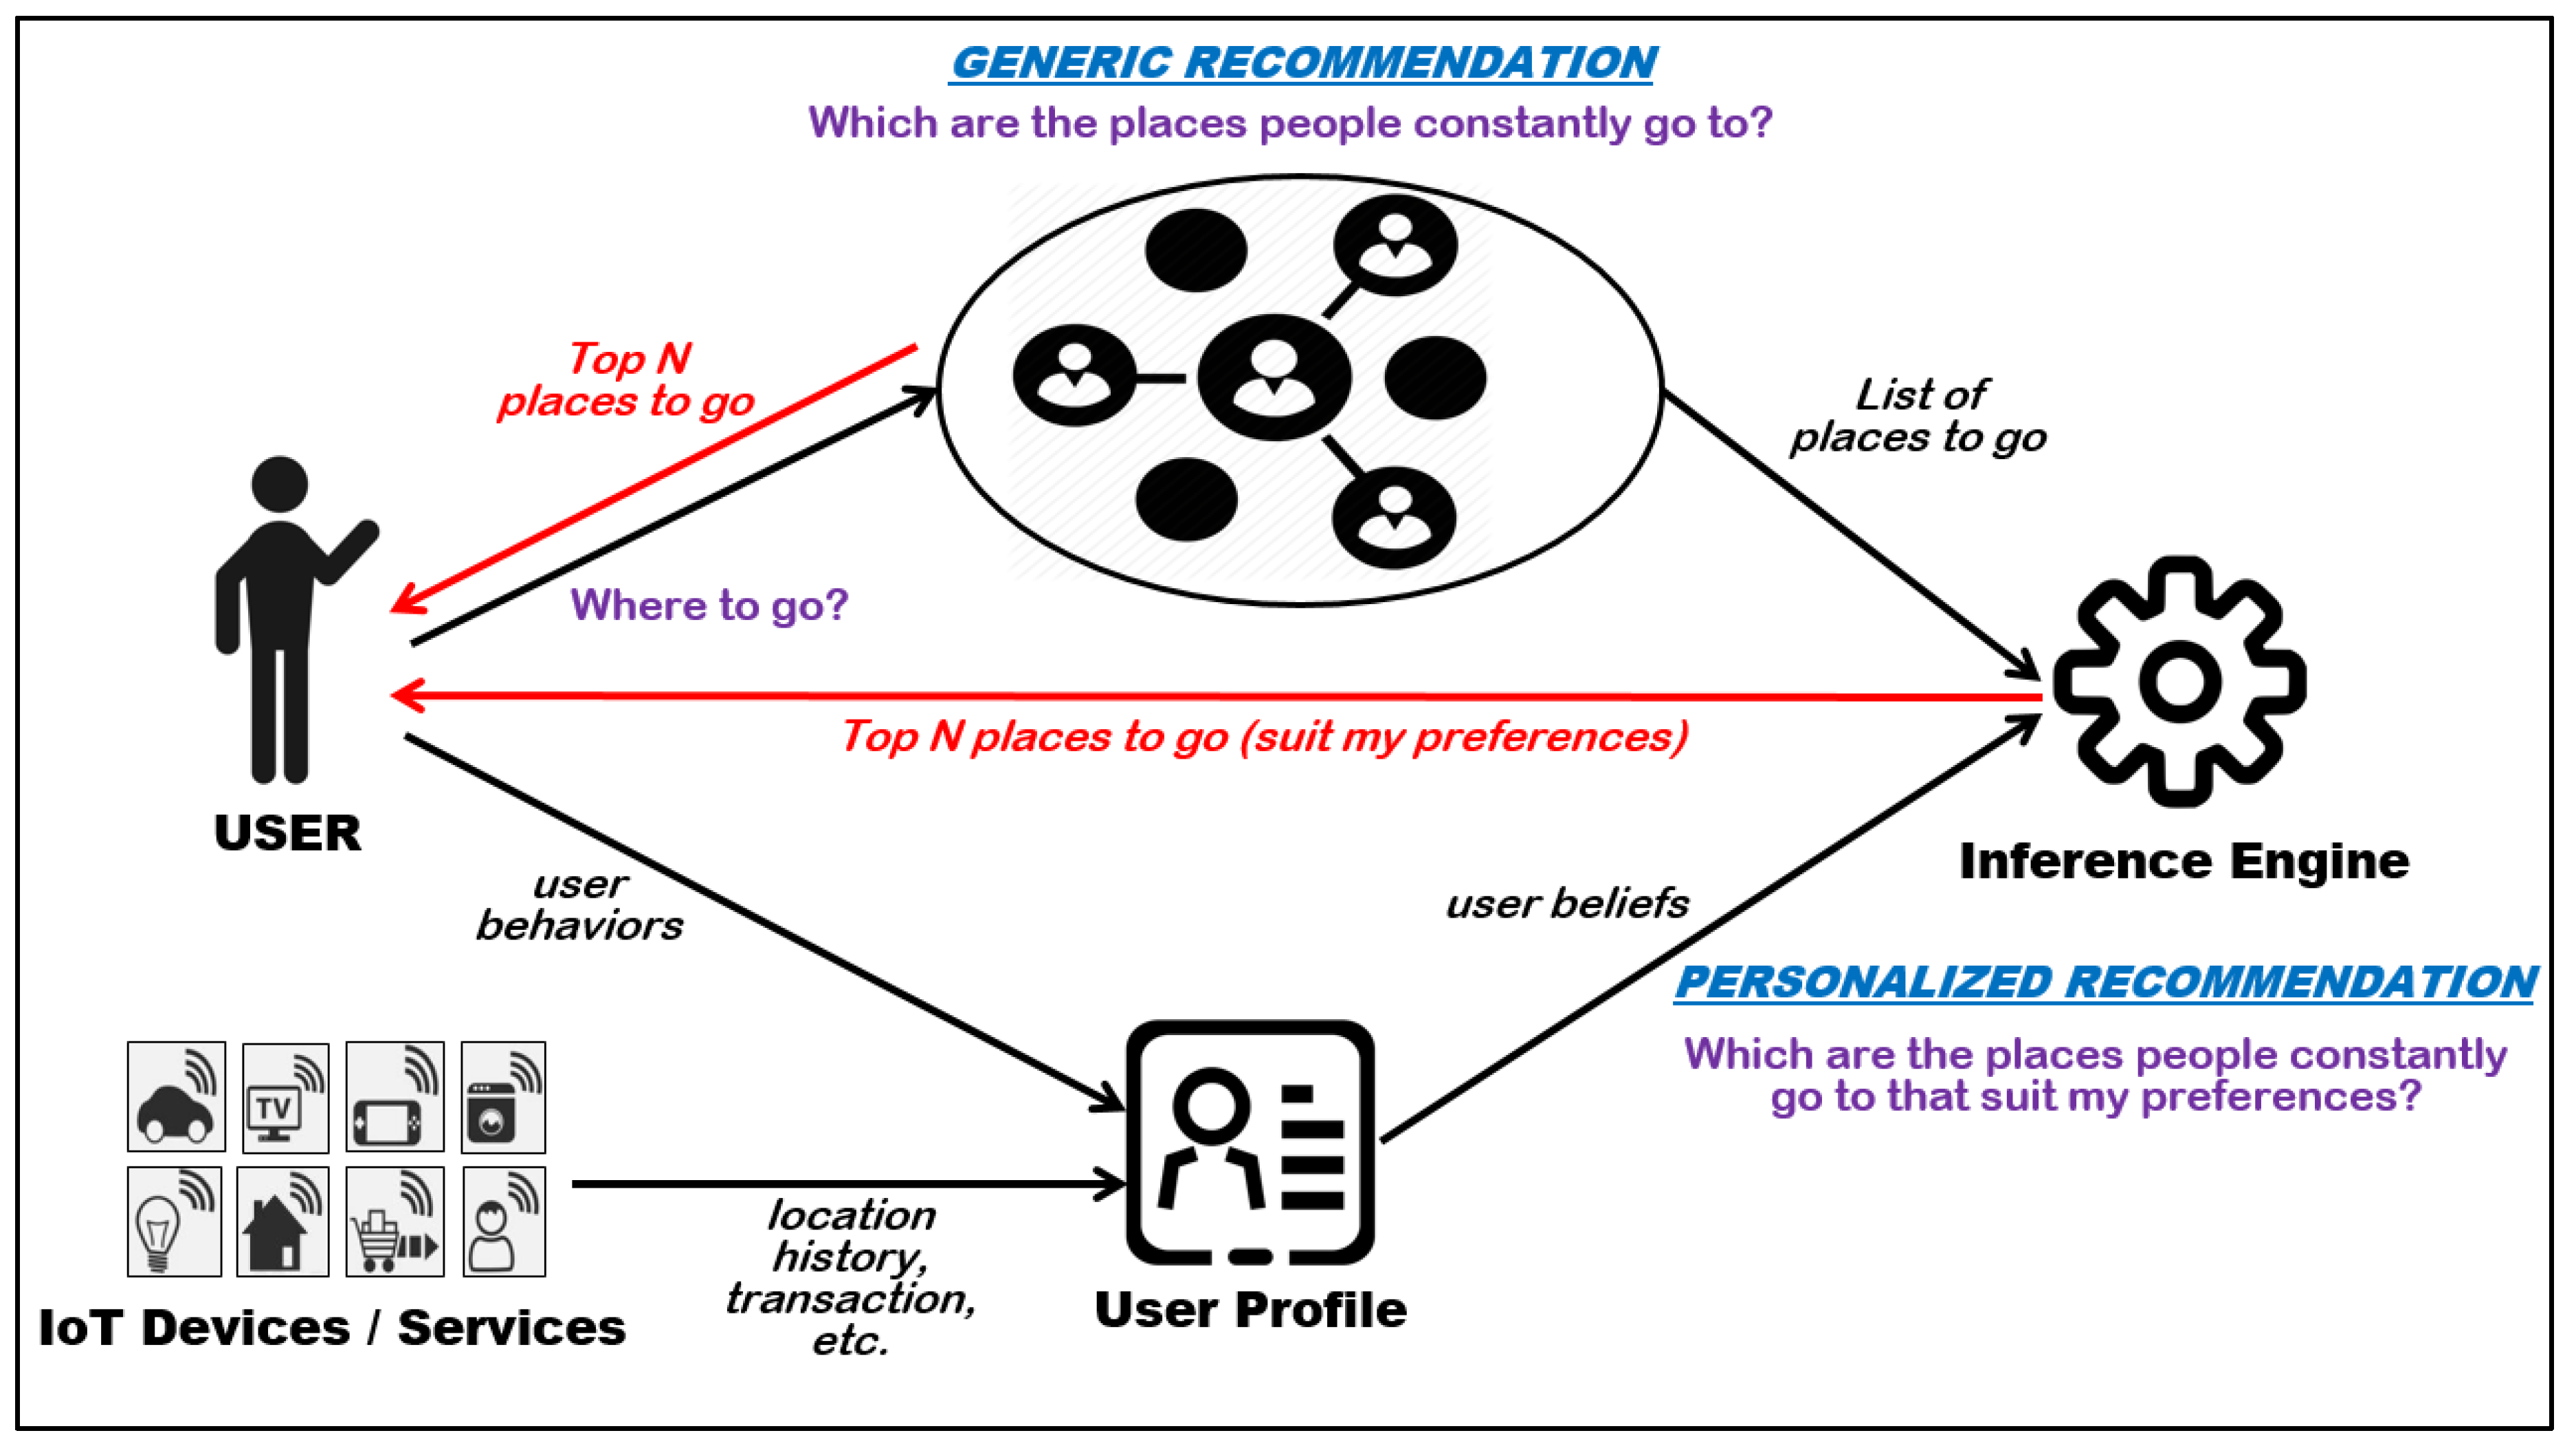
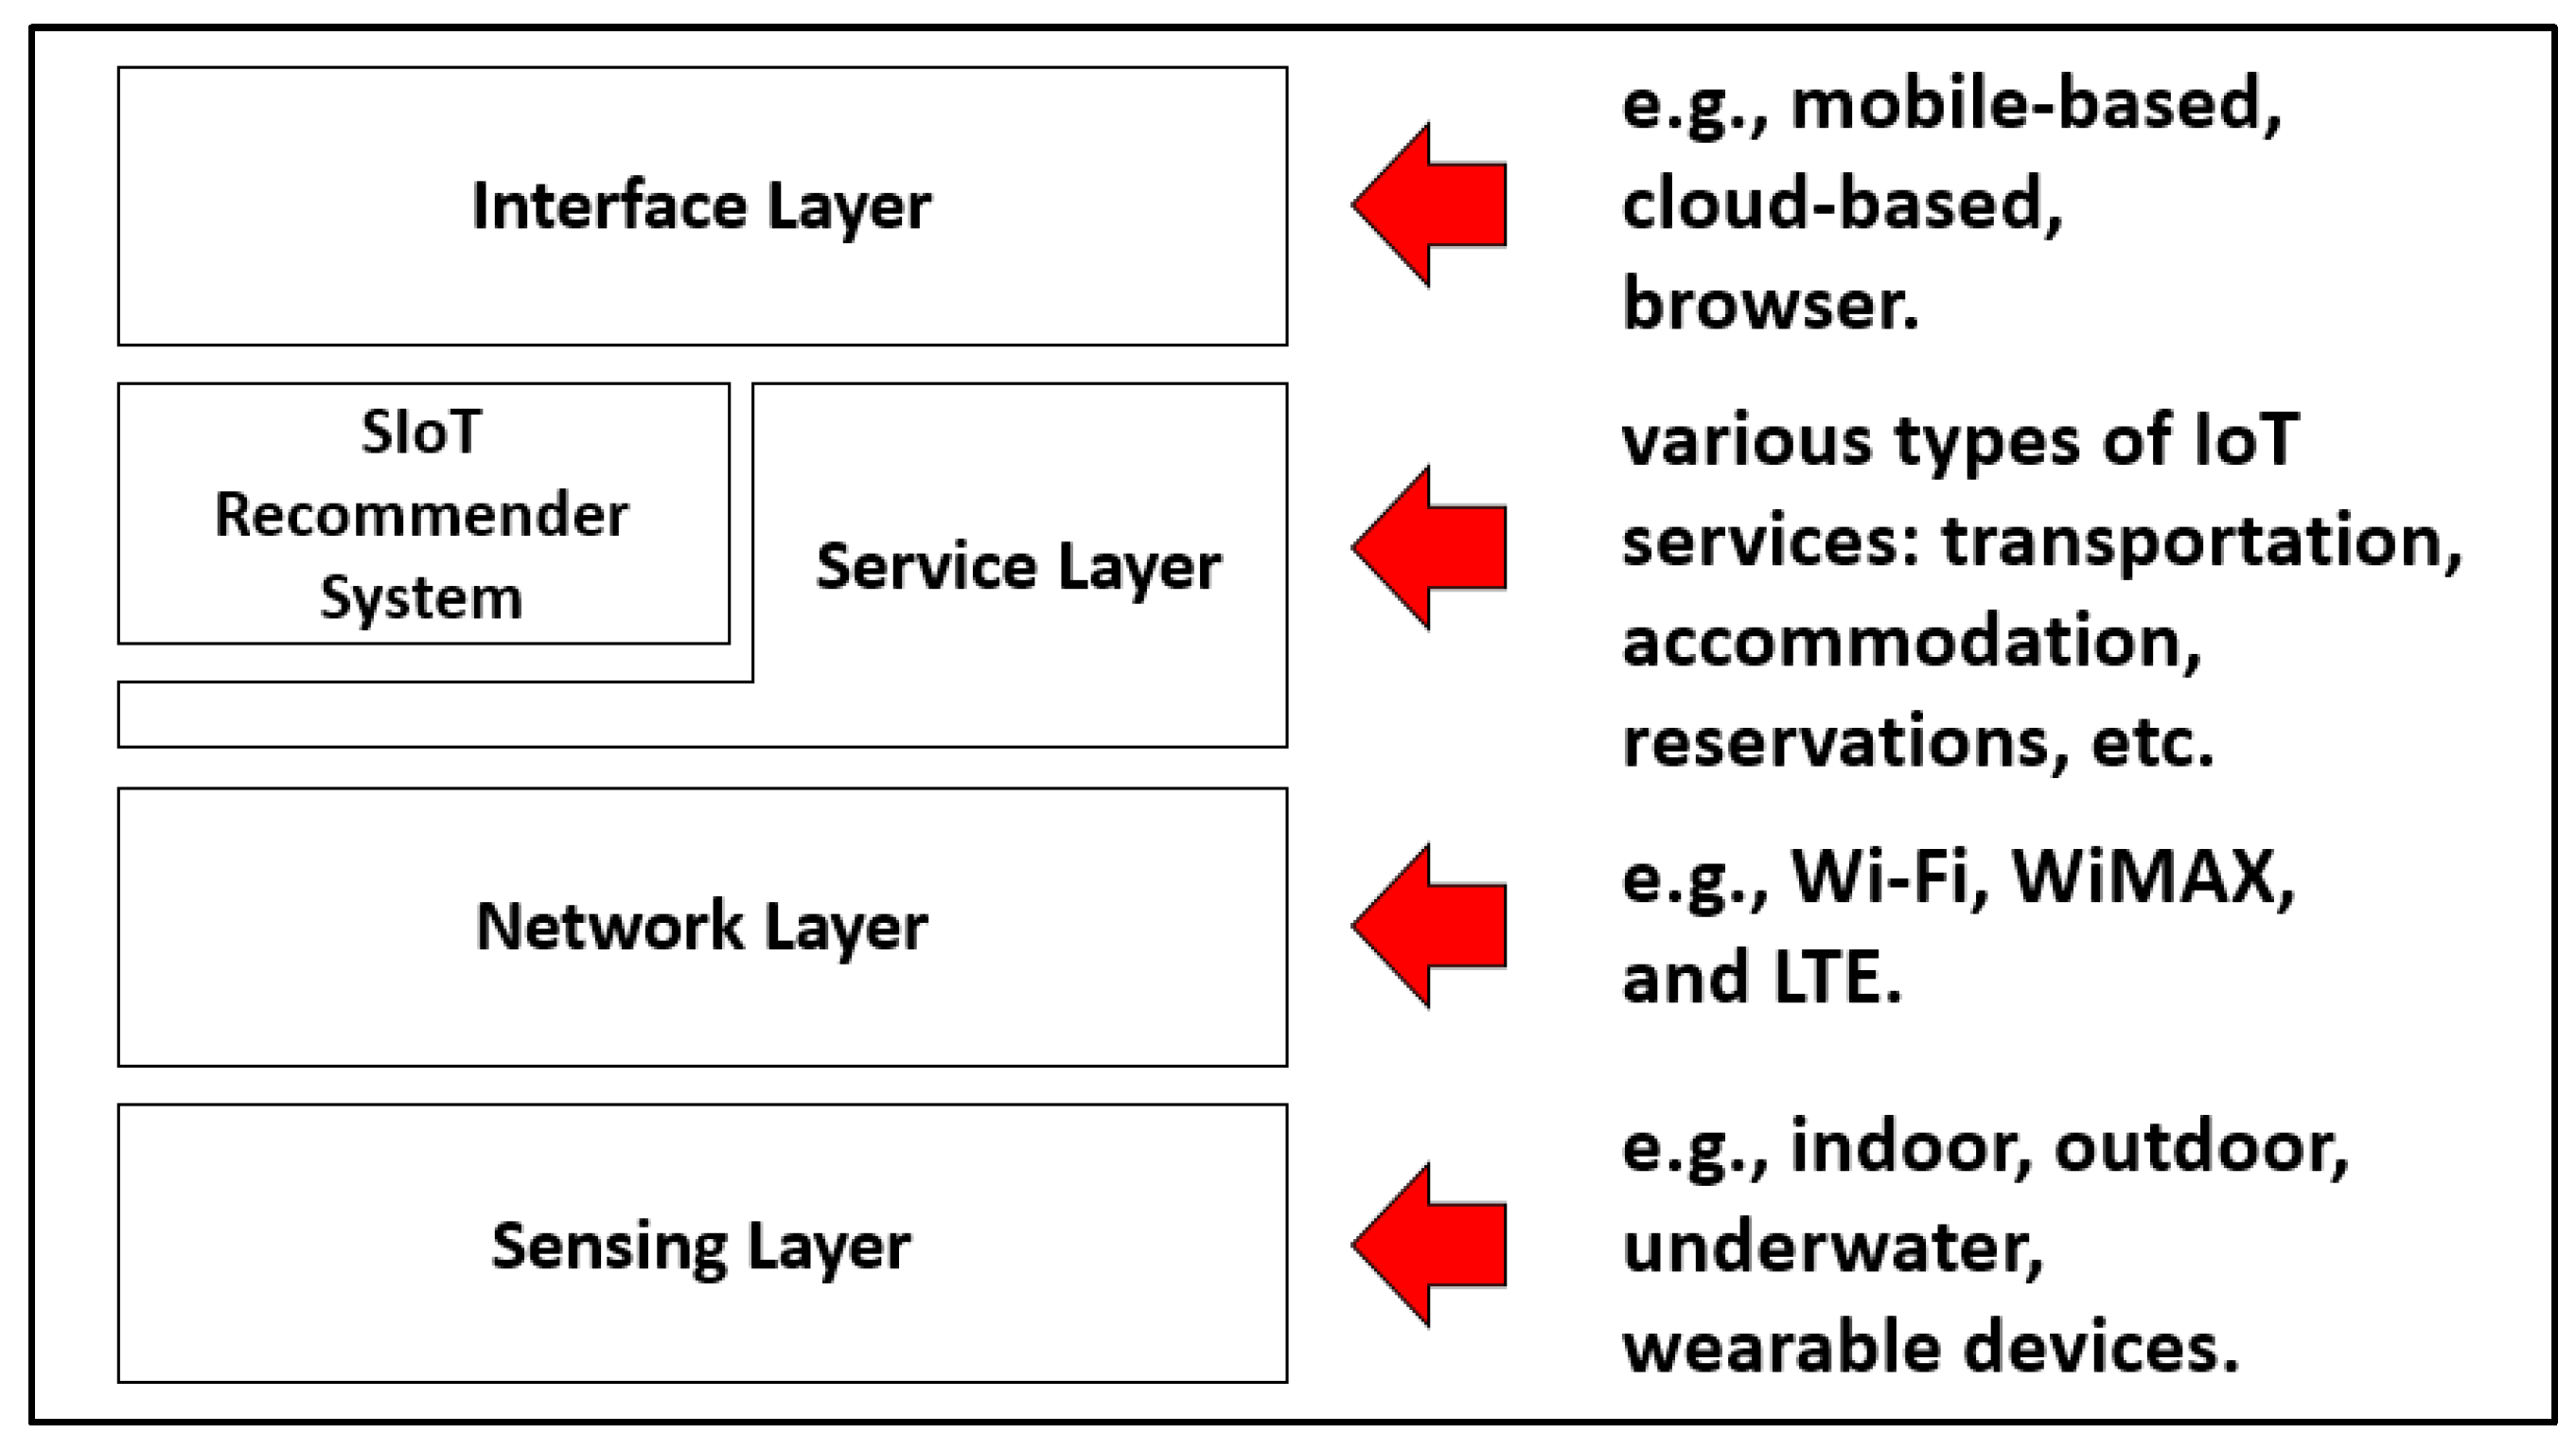
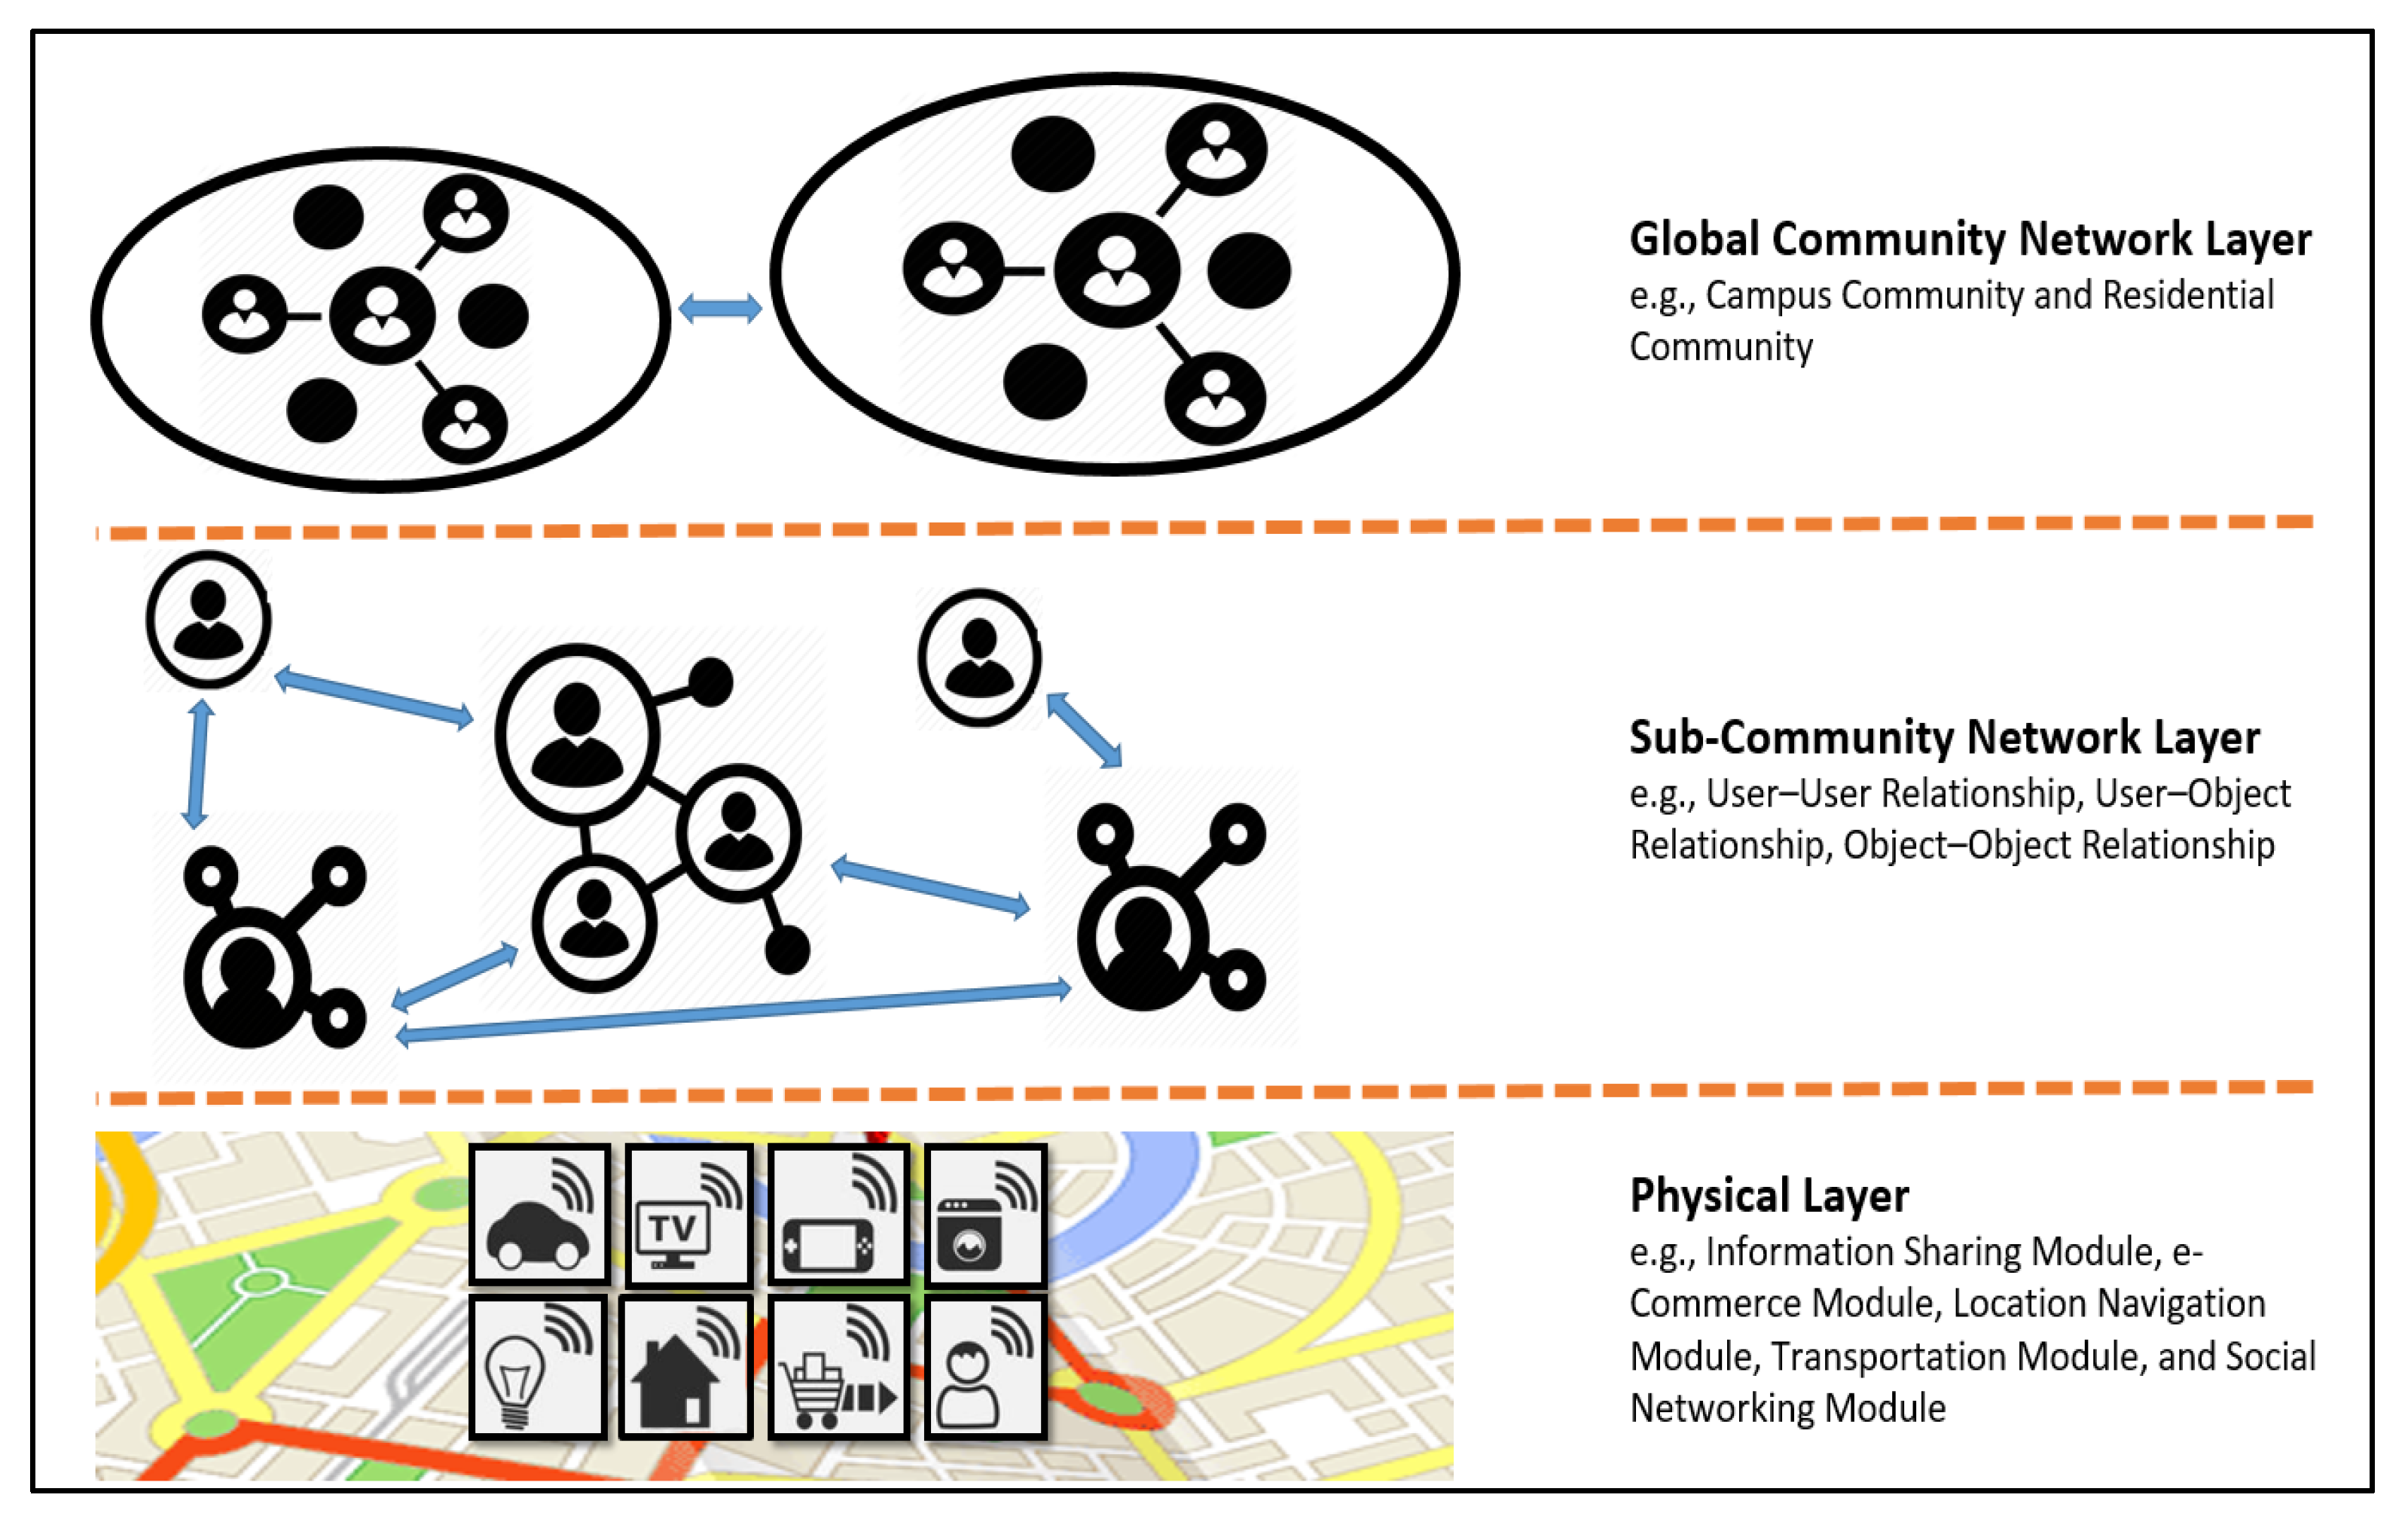
2.1. SIoT
Use Case Scenario
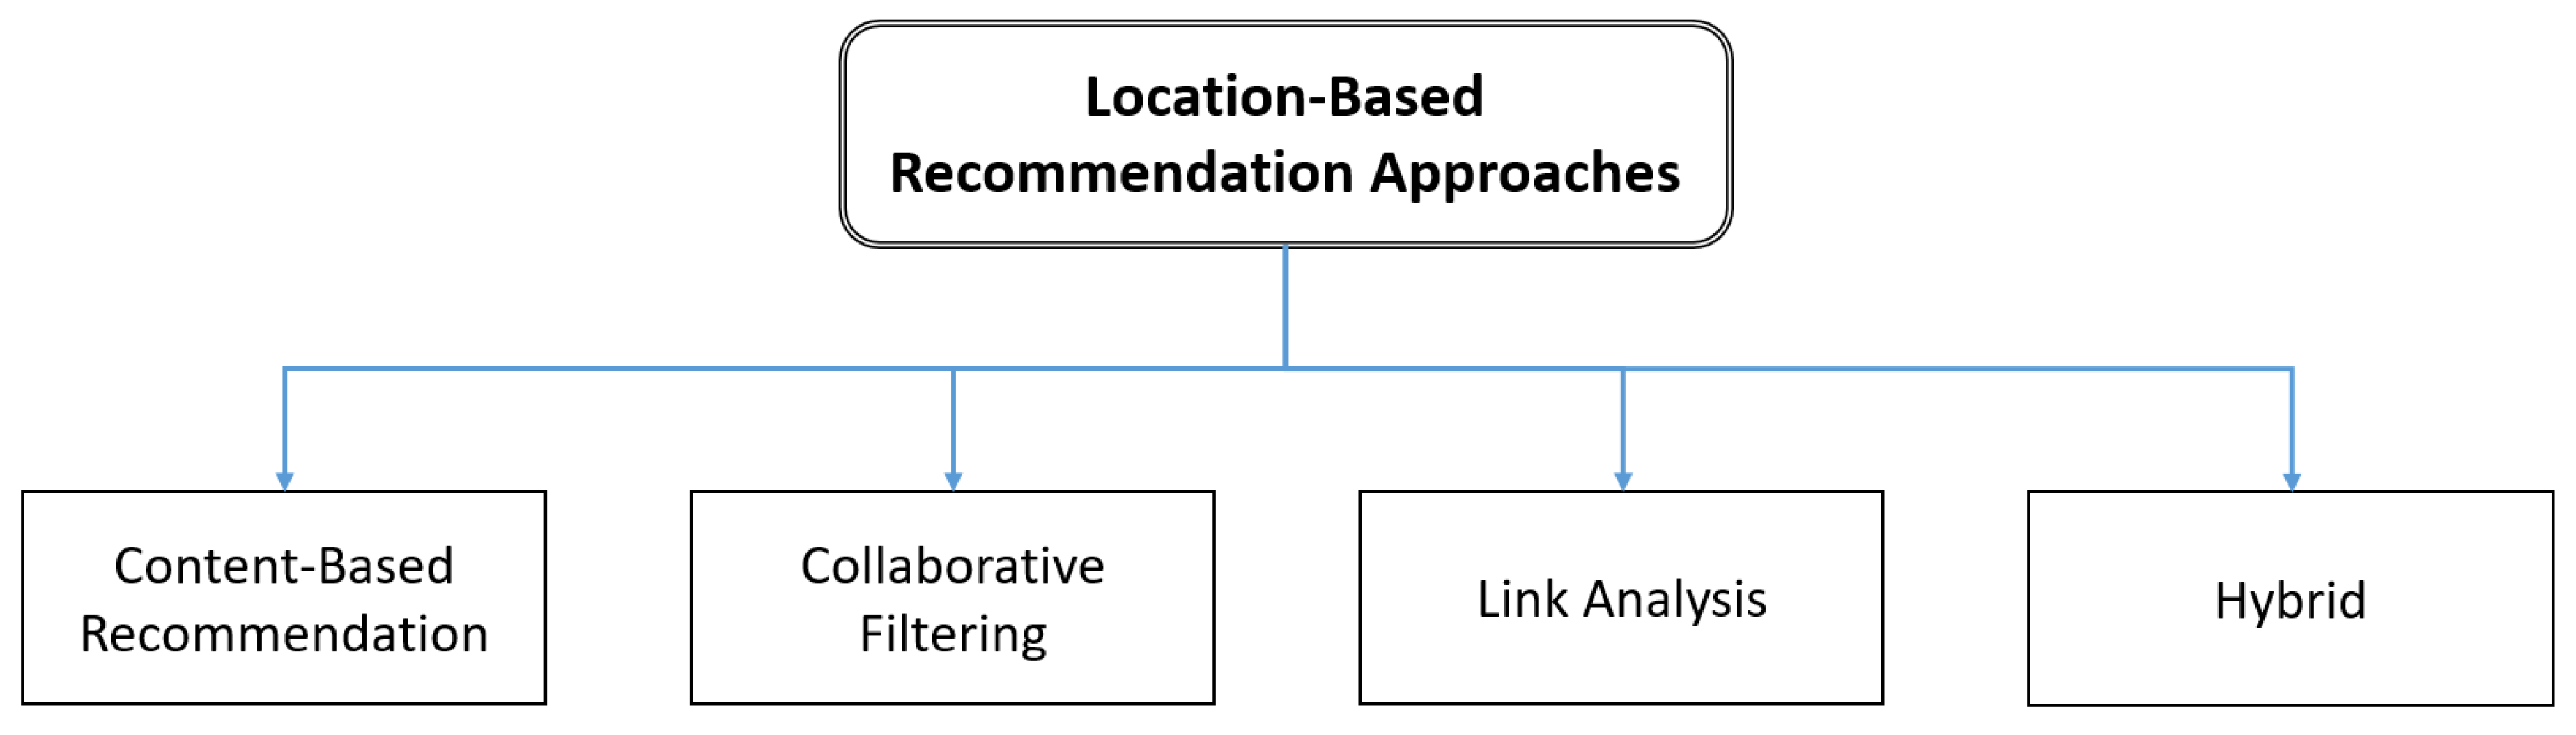
2.2. Recommendation Methodologies
2.2.1. Content-Based Recommendation System
2.2.2. Collaborative Filtering (CF)
2.2.3. LA
2.2.4. Hybrid Approach to Personalized Recommendation
3. User Trajectory Analysis
Issues and Challenges
- (1)
- Data collection: An efficient data-capturing model is required to represent different levels of diversity in user beliefs and the social relationships of users.
- (2)
- Inference engine: A generic yet tailored approach (from generic to personalized) is required to offer users various customizable outcomes for recommendation.
- (3)
- Dynamicity and scalability: A recommendation system that can be applied to different problem domains is required. The system should scale out or scale in when no direct evidence supports an outcome.
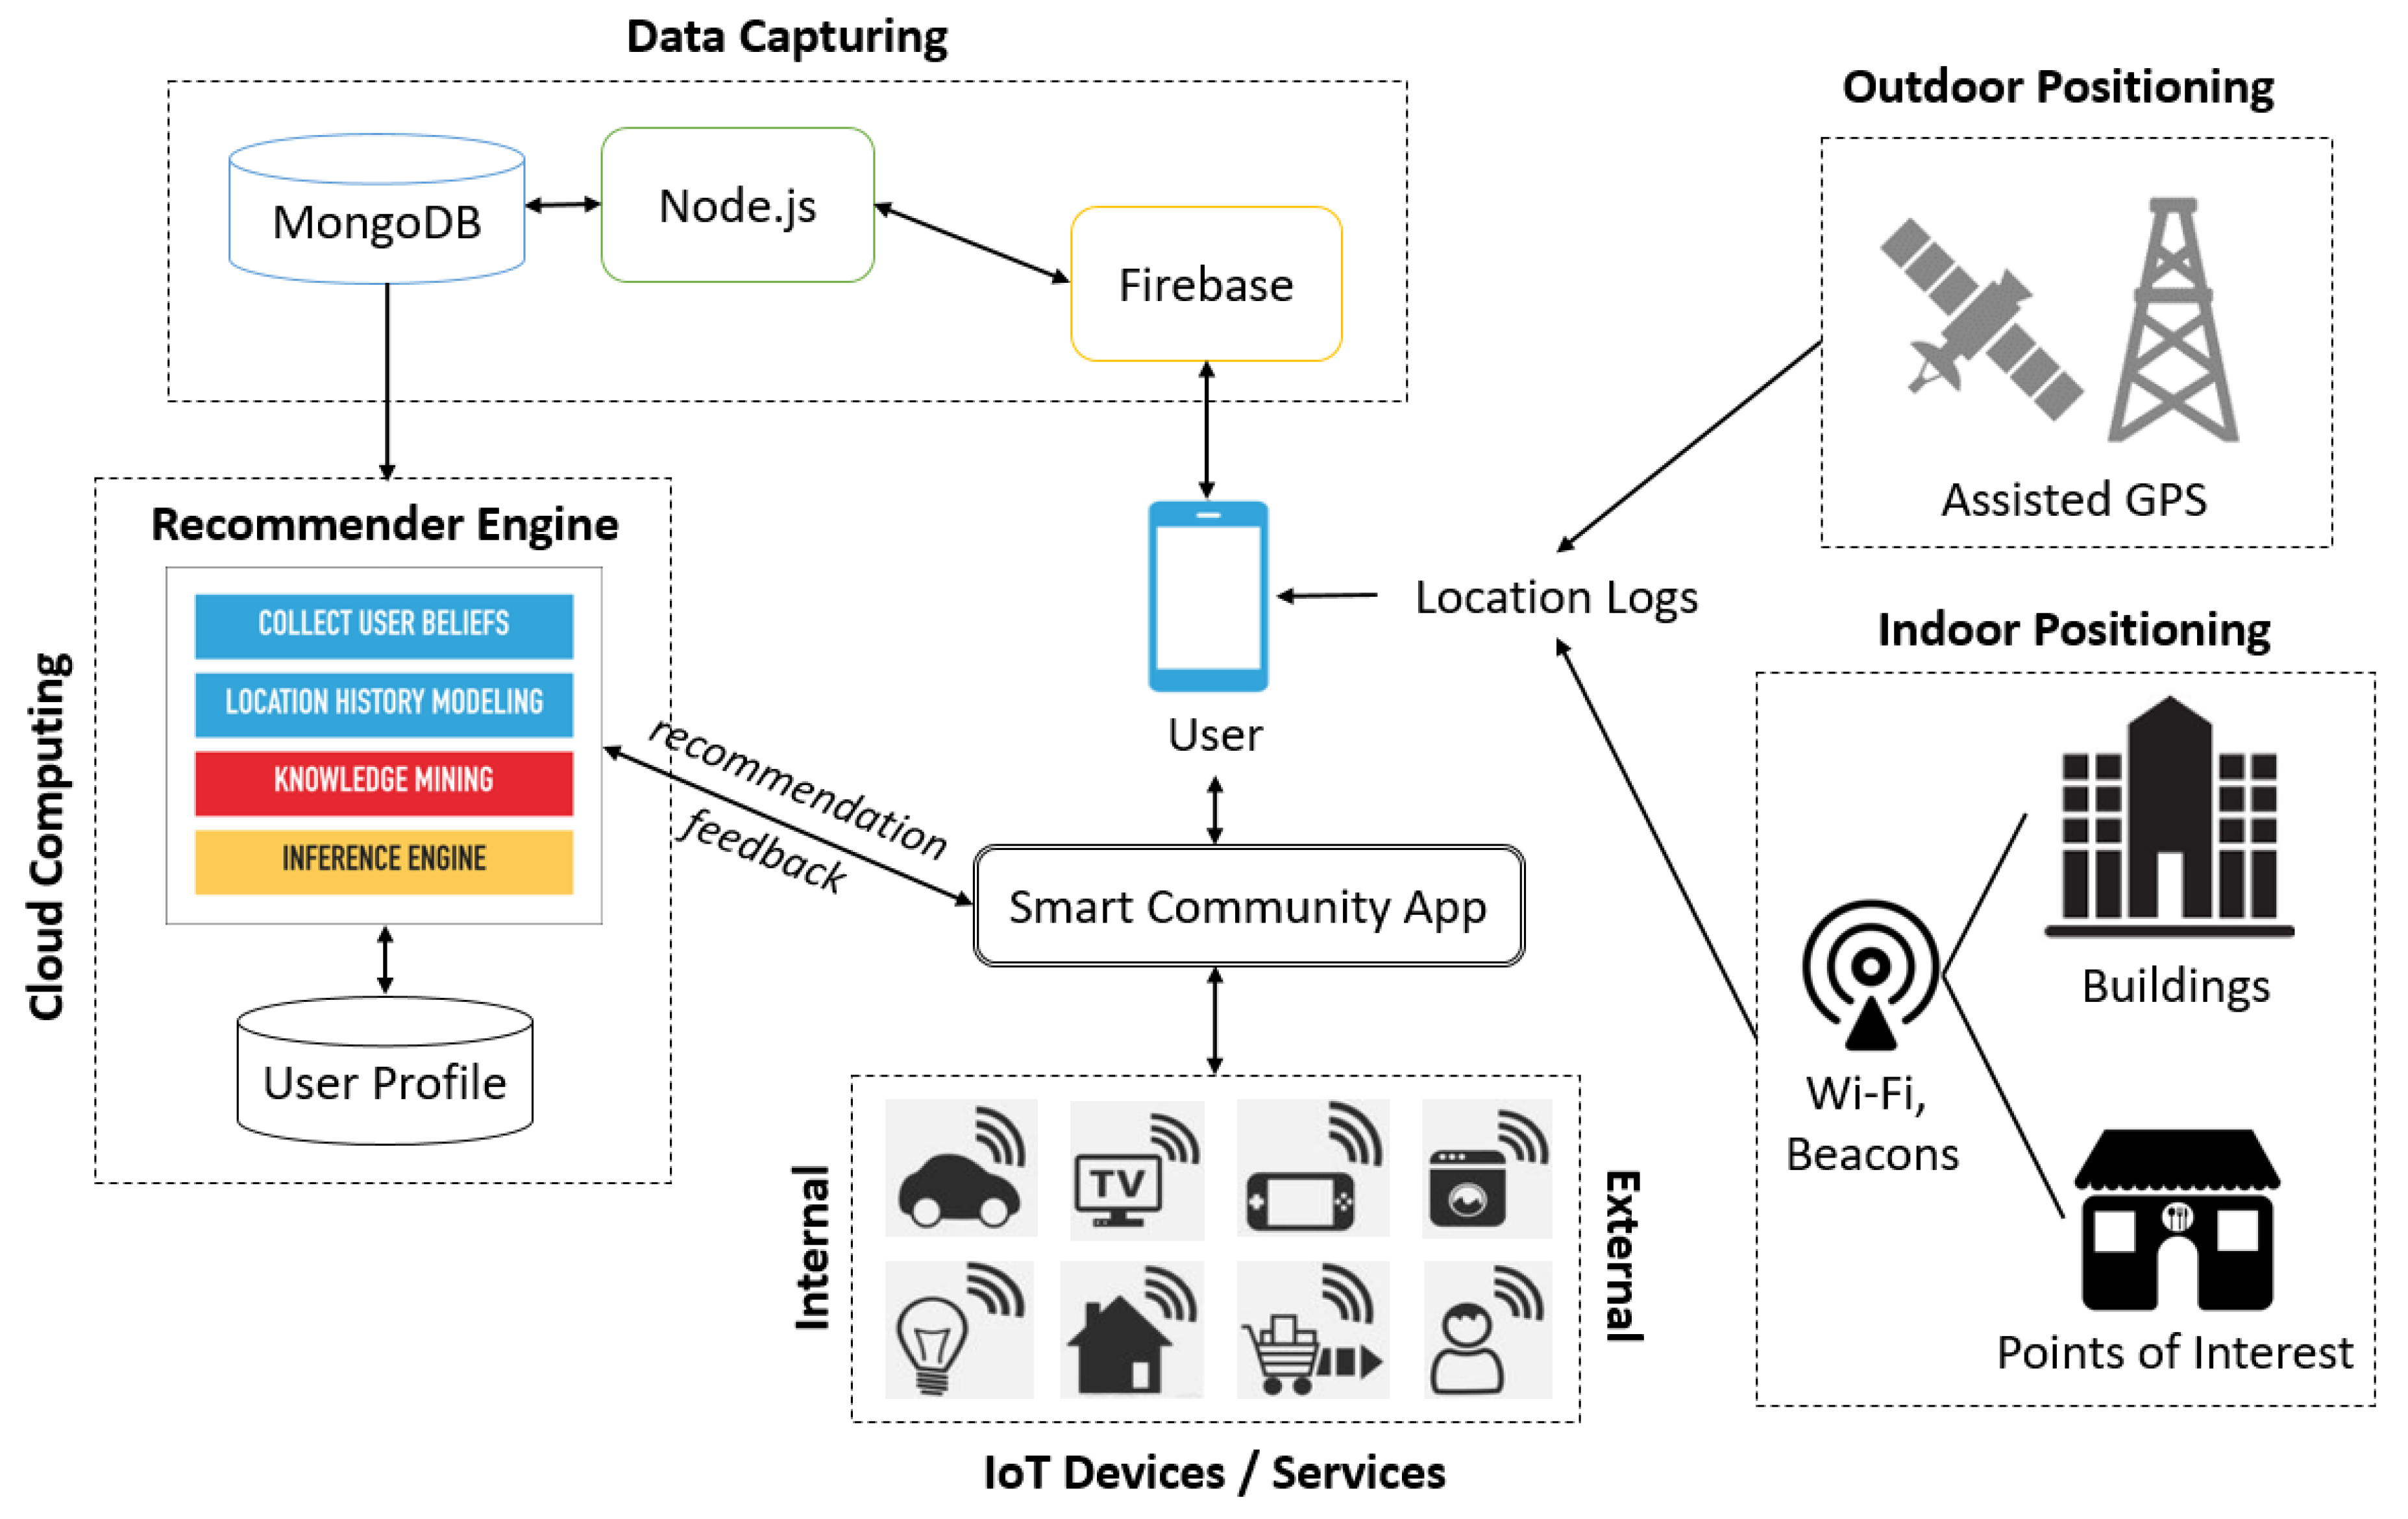
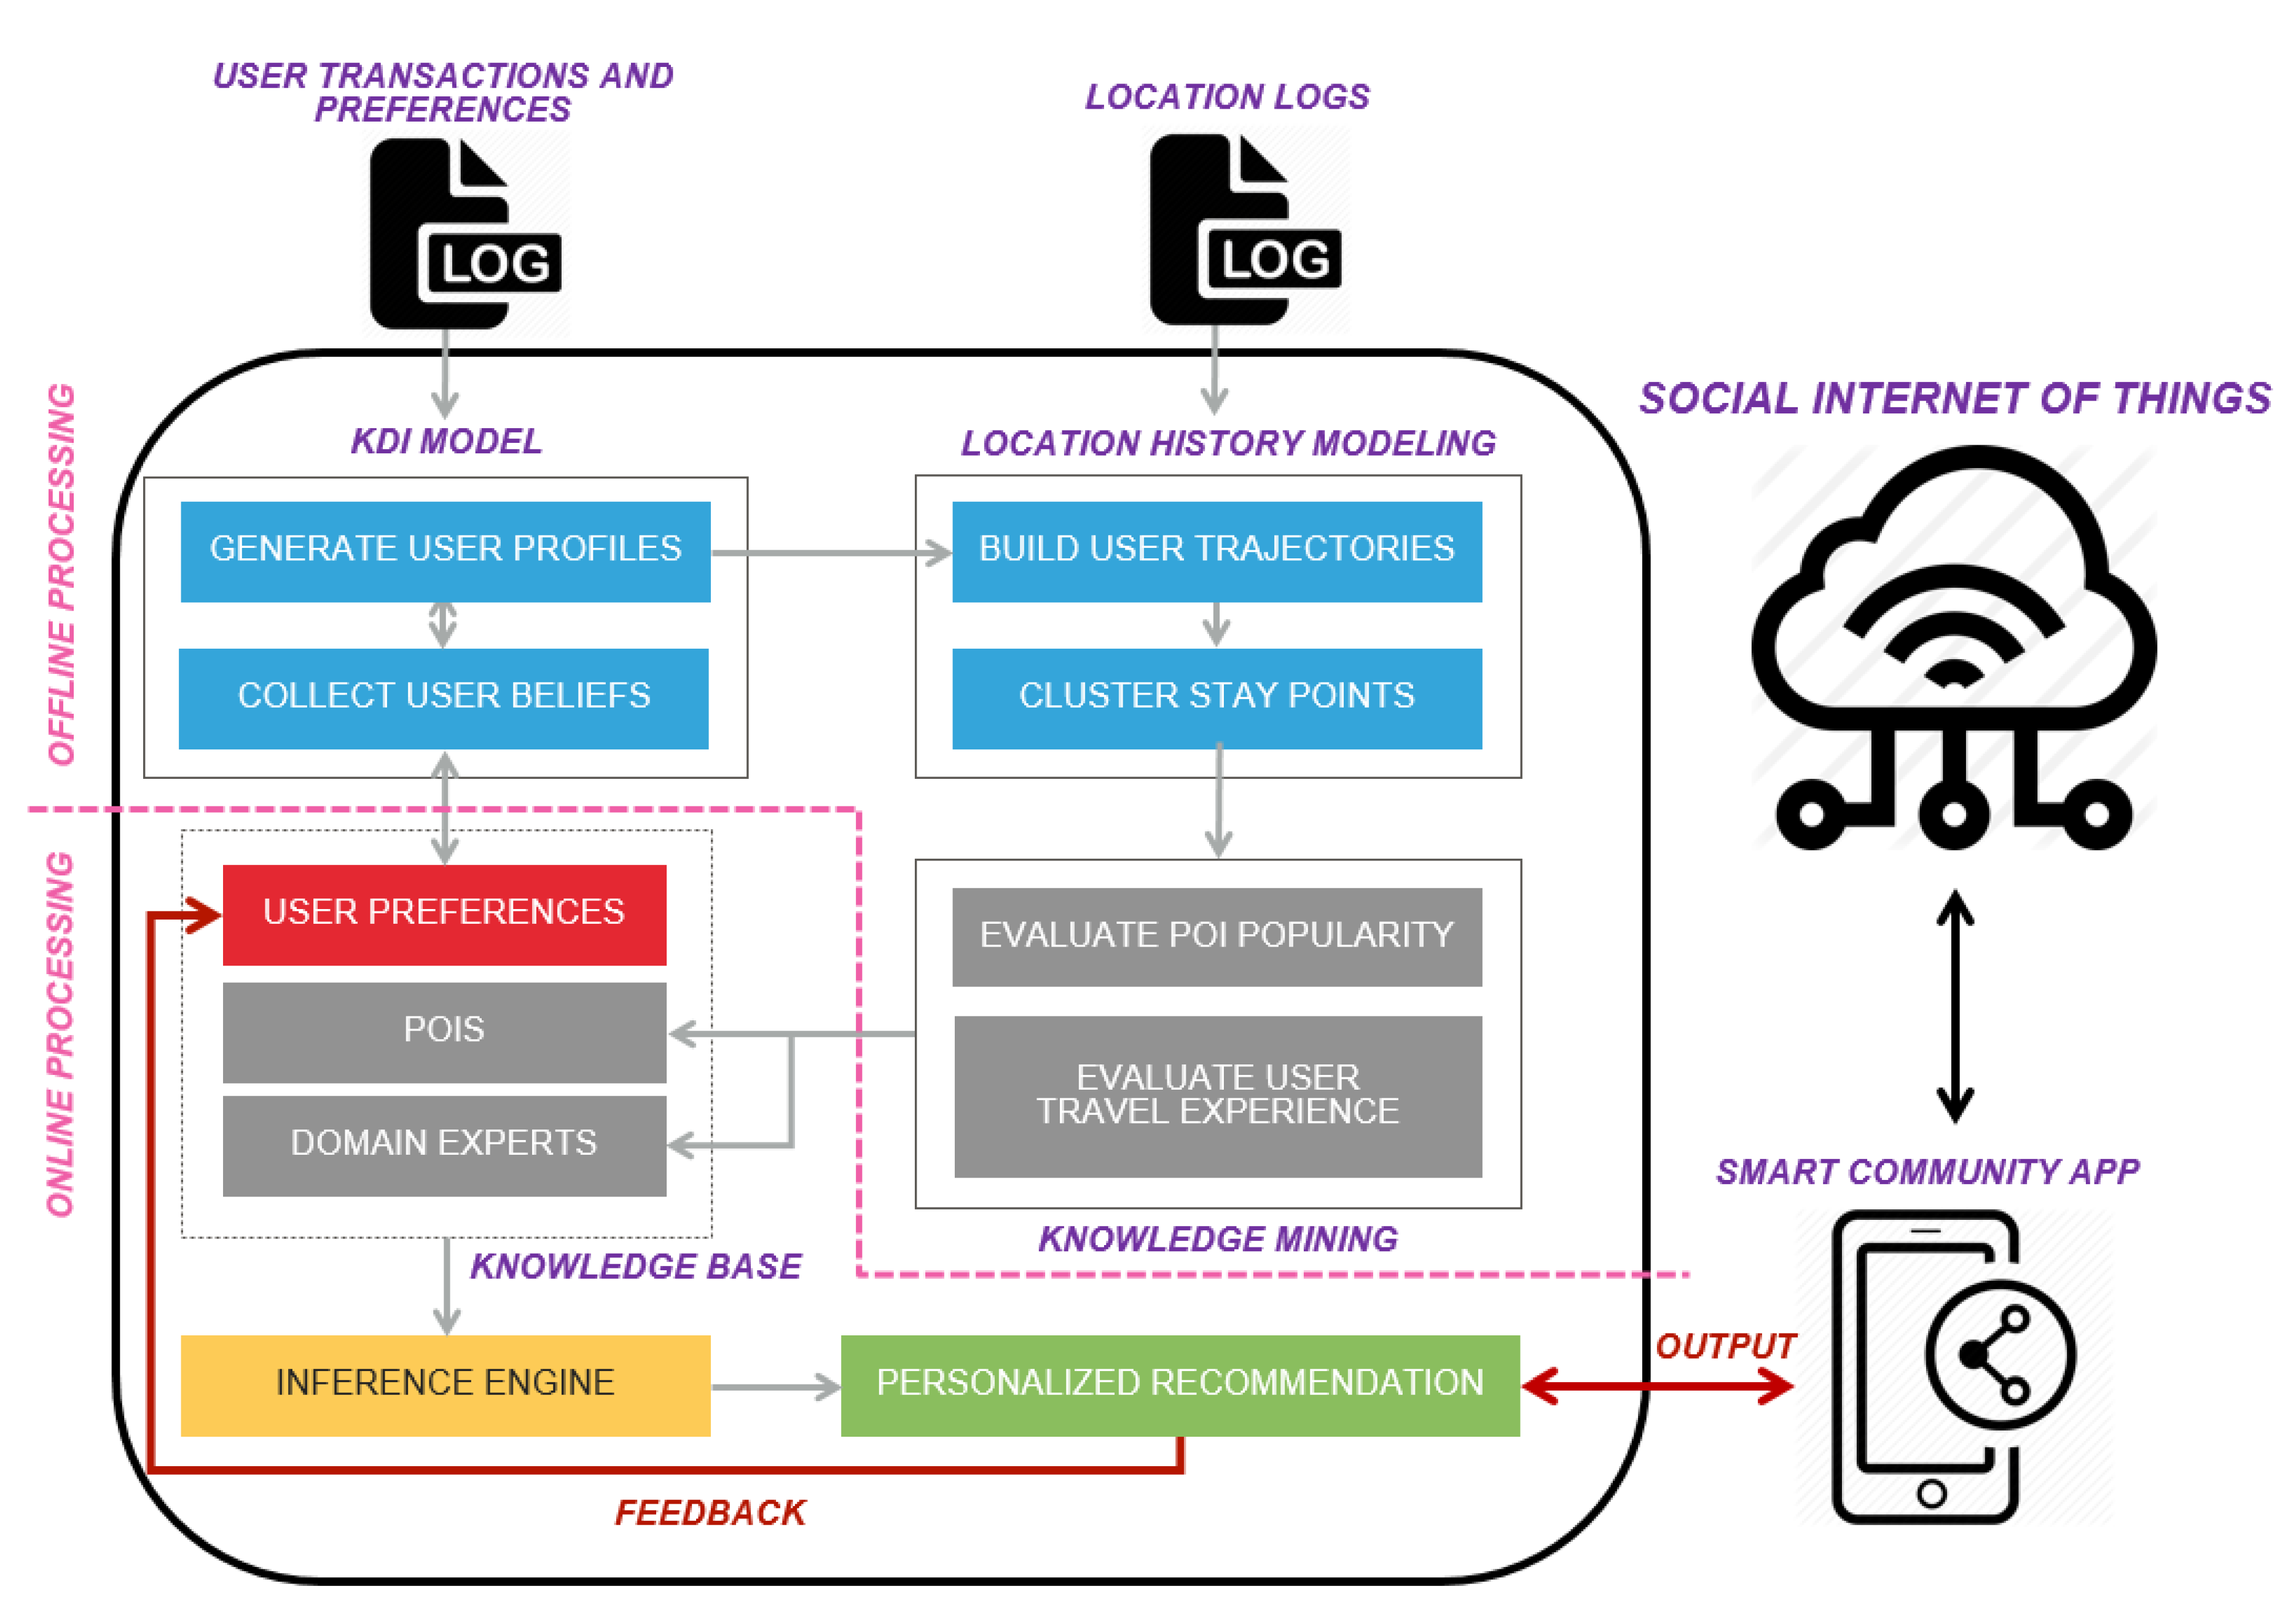
4. Personalized Recommendation for Smart Communities
4.1. Data Capture
| Algorithm 1. DataCapturing | |
| Input: User transactions and preferences, userPref | |
| Output: Generated user profiles and location logs | |
| 1 | LP = locationPointDetection(userPref); |
| 2 | userLogs = locationLogsGeneration(userPref); |
| 3 | Foreach user do |
| 4 | TS = durationCalculation(user, LP); |
| 5 | PF = pointFrequency(user, LP); |
| 6 | PR = pointRecency(user, LP); |
| 7 | LV = locationPointVelocity(user, LP); |
| 8 | userProfiles.add(TS, PF, PR, LV); |
| 9 | Return userProfiles, userLogs; |
4.2. KDI Model
4.3. Location History Modeling
| Algorithm 2. LocationHistoryModeling | |
| Input: Collection of users GPS logs, userLogs | |
| Output: Tree-Based Hierarchical Graph (TBHG) | |
| 1 | Foreach user do |
| 2 | trajectory = LogParsing(userLogs); |
| 3 | S = StayPointDetection(trajectory); |
| 4 | LocH = PersonalLocHis(S); //individual user |
| 5 | SP.add(S); //collection of stay points |
| 6 | H = HierarchicalClustering(SP); |
| 7 | Foreach level do //build a graph on each level |
| 8 | Foreach user do |
| 9 | g = graphBuilding(g, LocH); |
| 10 | G.add(g); |
| 11 | TBHG = (H, G); |
| 12 | Return TBHG; |
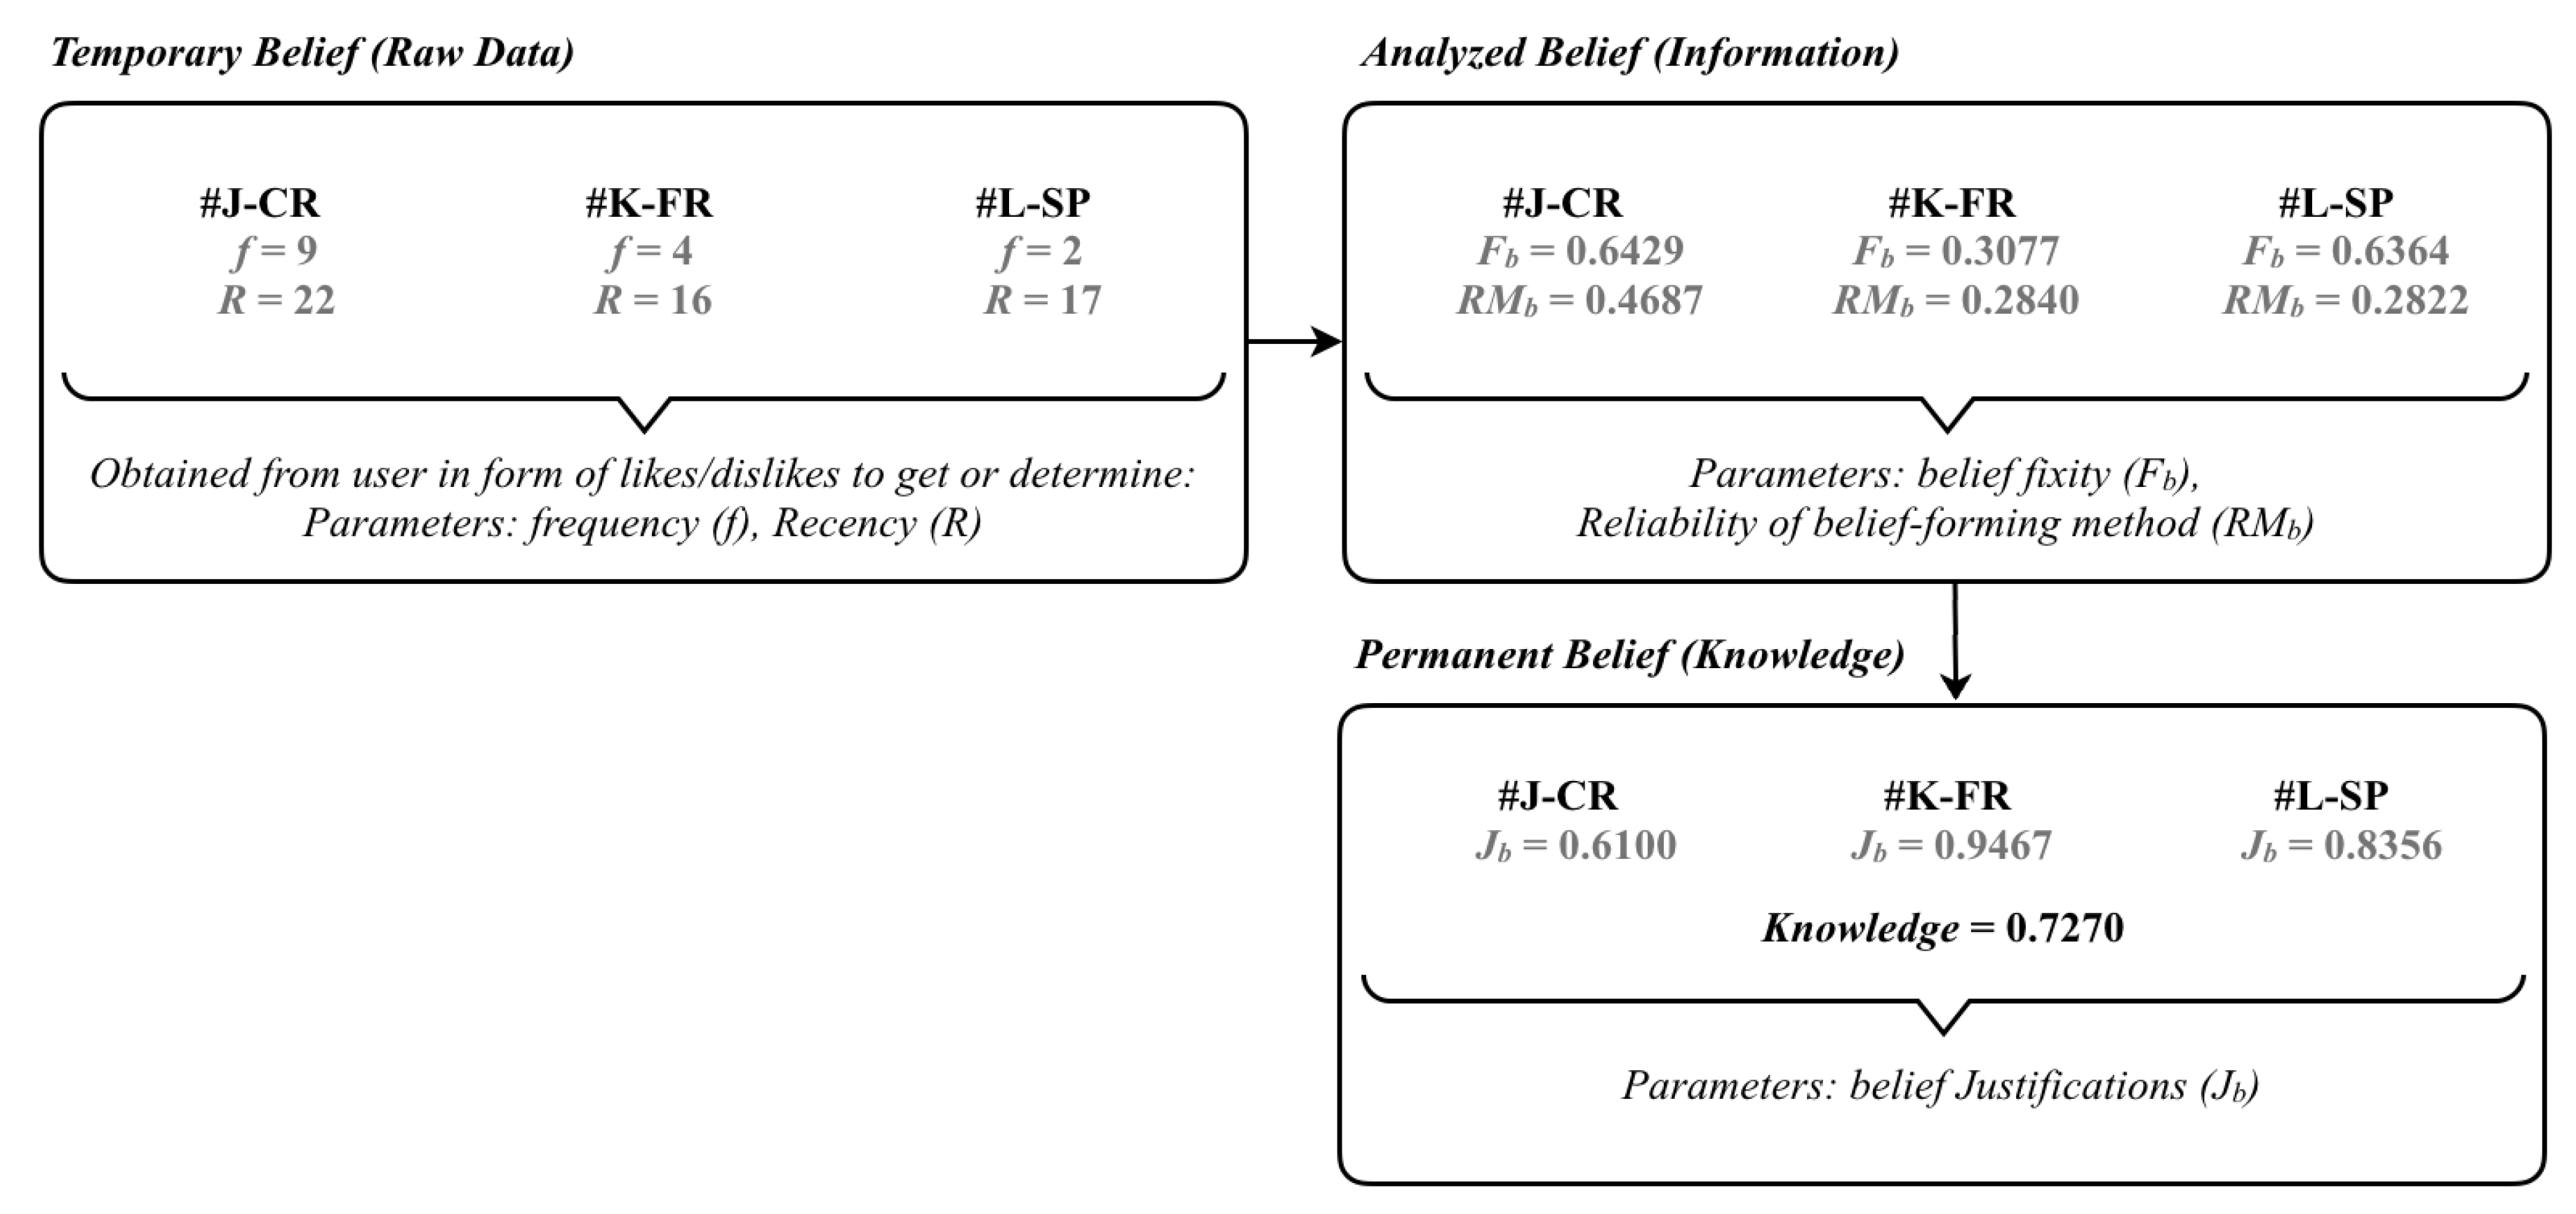
4.4. Knowledge Modeling
| Algorithm 3. LocationHistoryInference | |
| Input: TBHG=(H,G) and users’ location histories, LocH | |
| Output: Users’ hub scores, S and locations’ authority scores, A. | |
| 1 | S = A = ∅; |
| 2 | Fori = 1; i < |L|; i ++ //on each level |
| 3 | For j = 1; j < |C|; j ++ //on each cluster on the level |
| 4 | For k = i + 1; k ≦ |L|; k ++ //on each sub-level |
| 5 | C = LocationCollecting(k, c, H); |
| 6 | M = MatrixBuilding(C, LocH); |
| 7 | (x,y) = HITS-inference(M); |
| 8 | S = (x); |
| 9 | A = (y); |
| 10 | Return (S,A); |
4.5. Recommendation Module
| Algorithm 4. KnowledgeInference | |
| Input: User-selected region and knowledge base | |
| Output: Sorted collection of POIs. | |
| 1 | Fori = 1; i < |L|; i ++ //on each level |
| 2 | For j = 1; j < |C|; j ++ //on each cluster on the level |
| 3 | If region.contain(C[j]) |
| 4 | A.add(C[j].authority); |
| 5 | SP.add(C[j].poi); |
| 6 | Foreach SP do |
| 7 | k = KnowledgeKDI(SP); |
| 8 | K.add(k); |
| 9 | POI = SIoT-inference(SP, A, K); |
| 10 | ReturnPOI; |
5. Implementation and Measurement
Baselines and Methods
6. Experimental Results
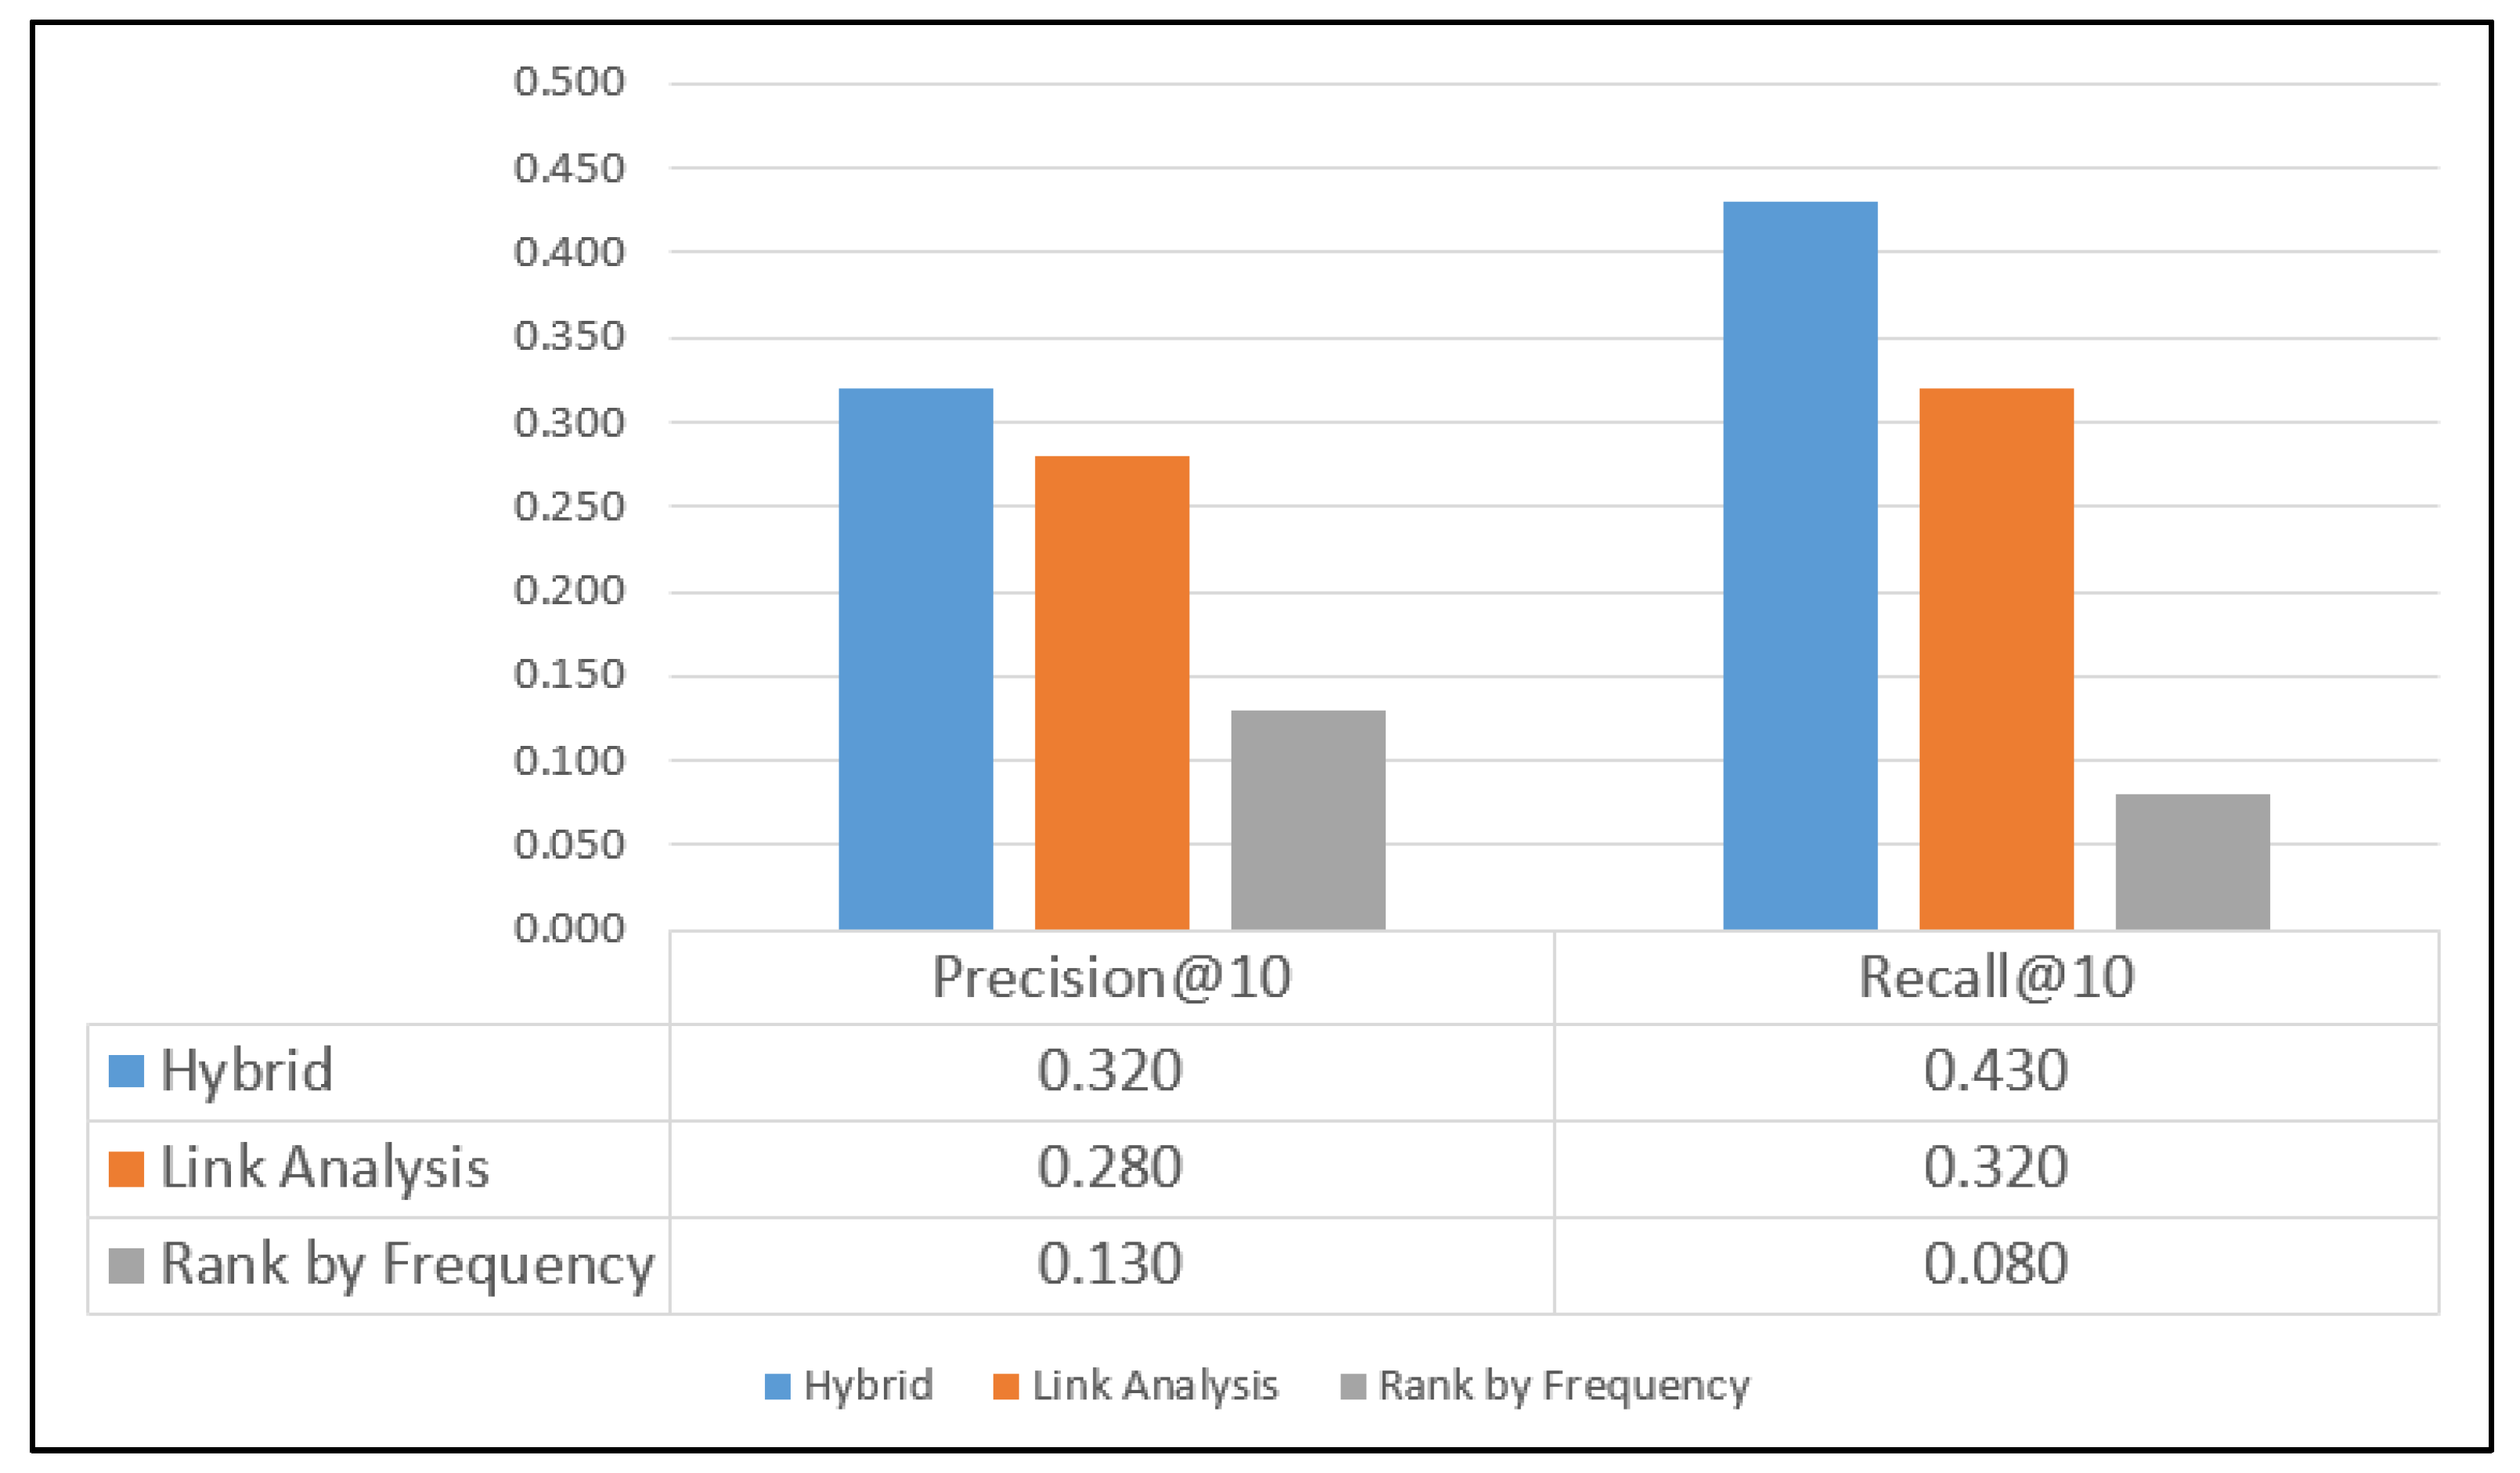
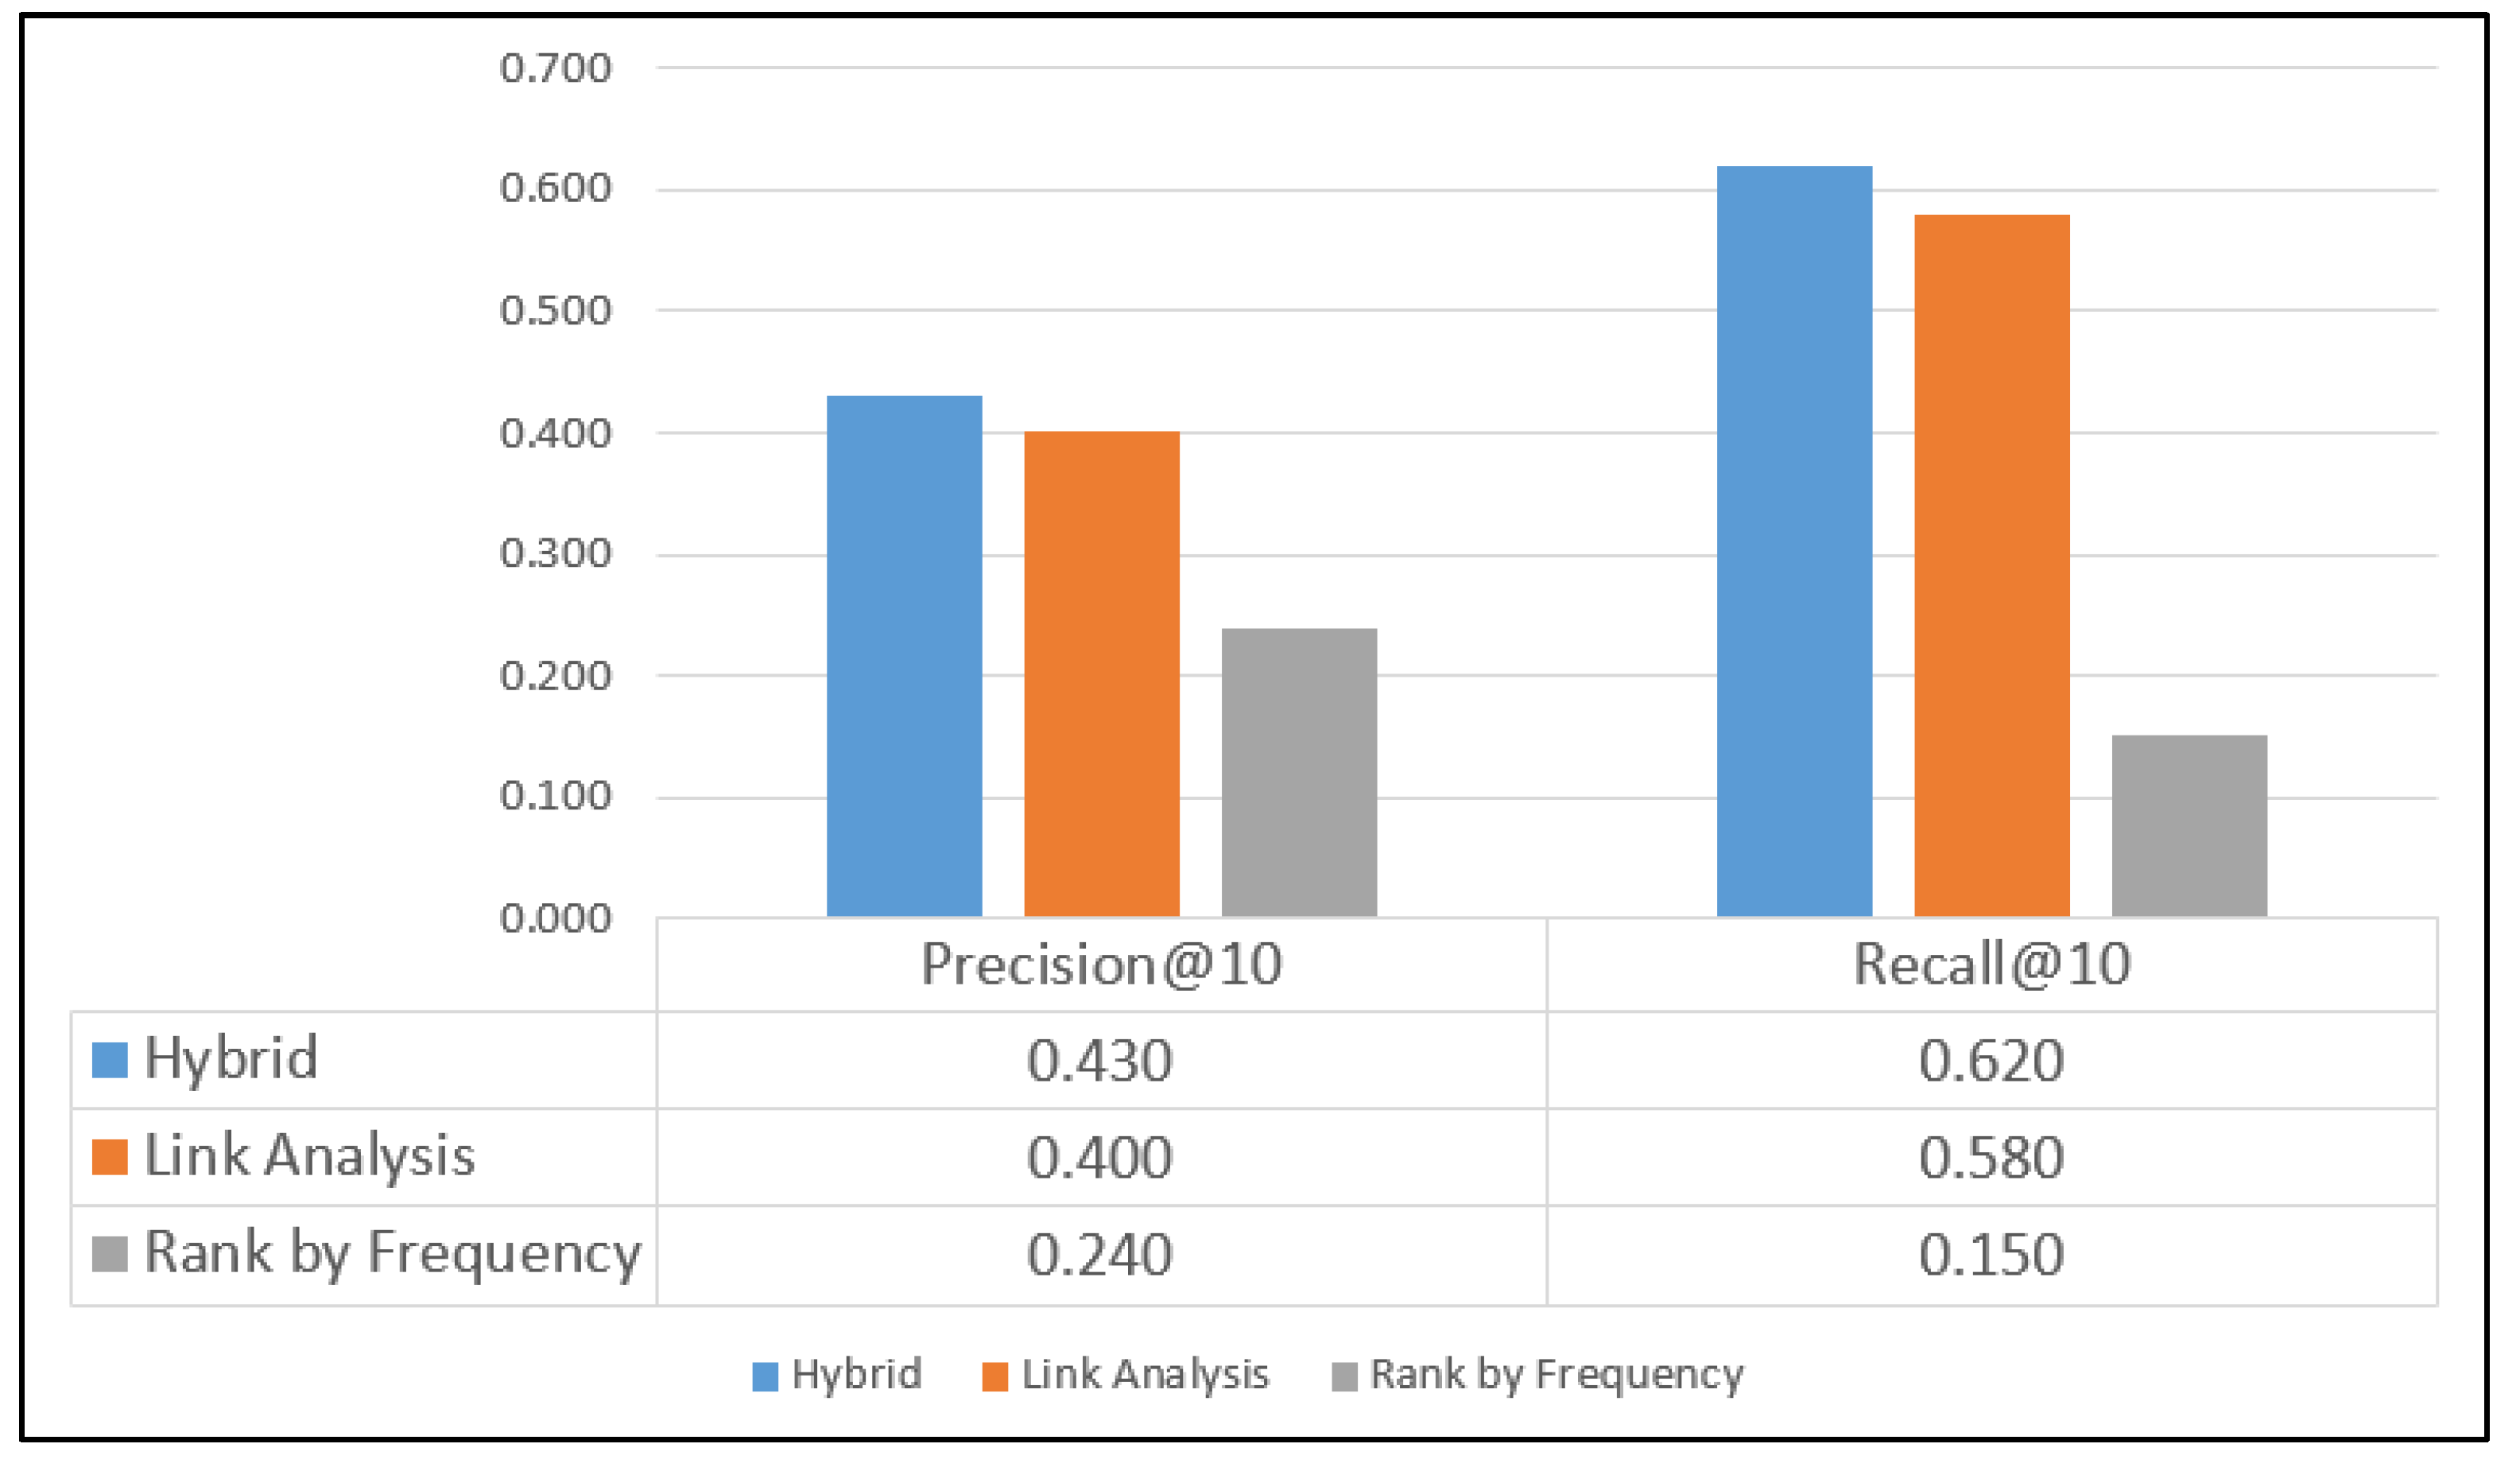
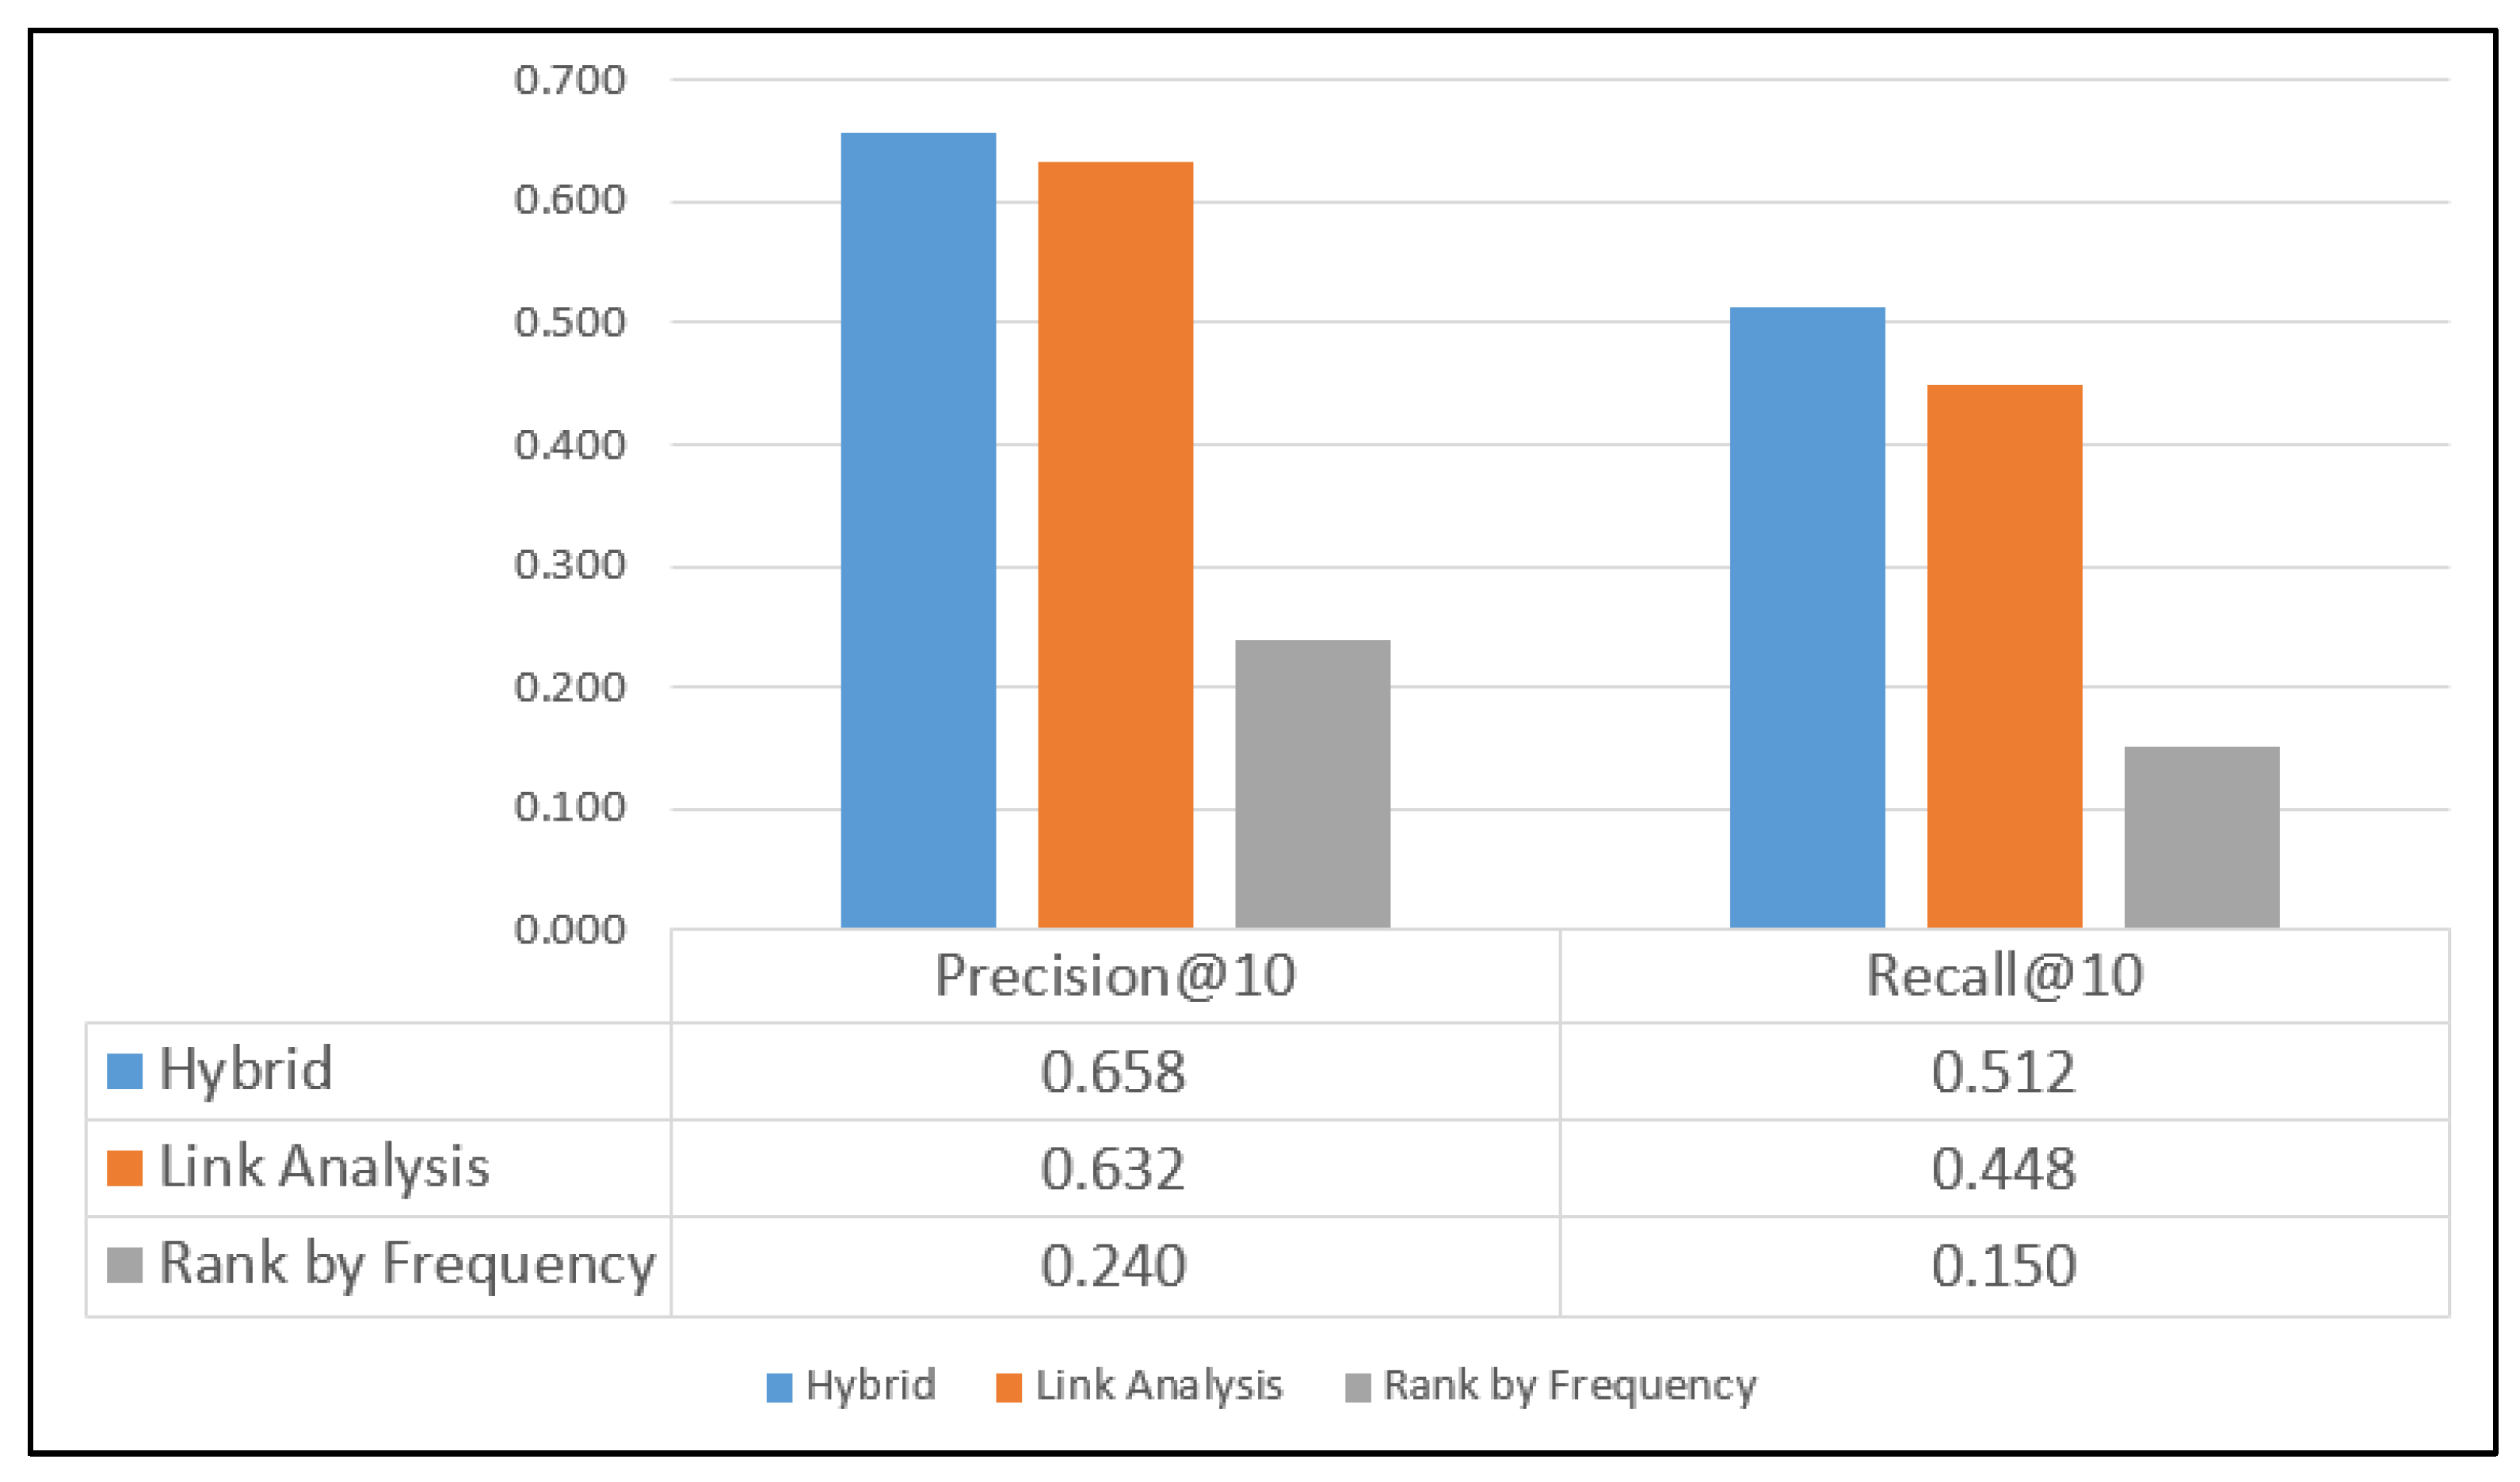
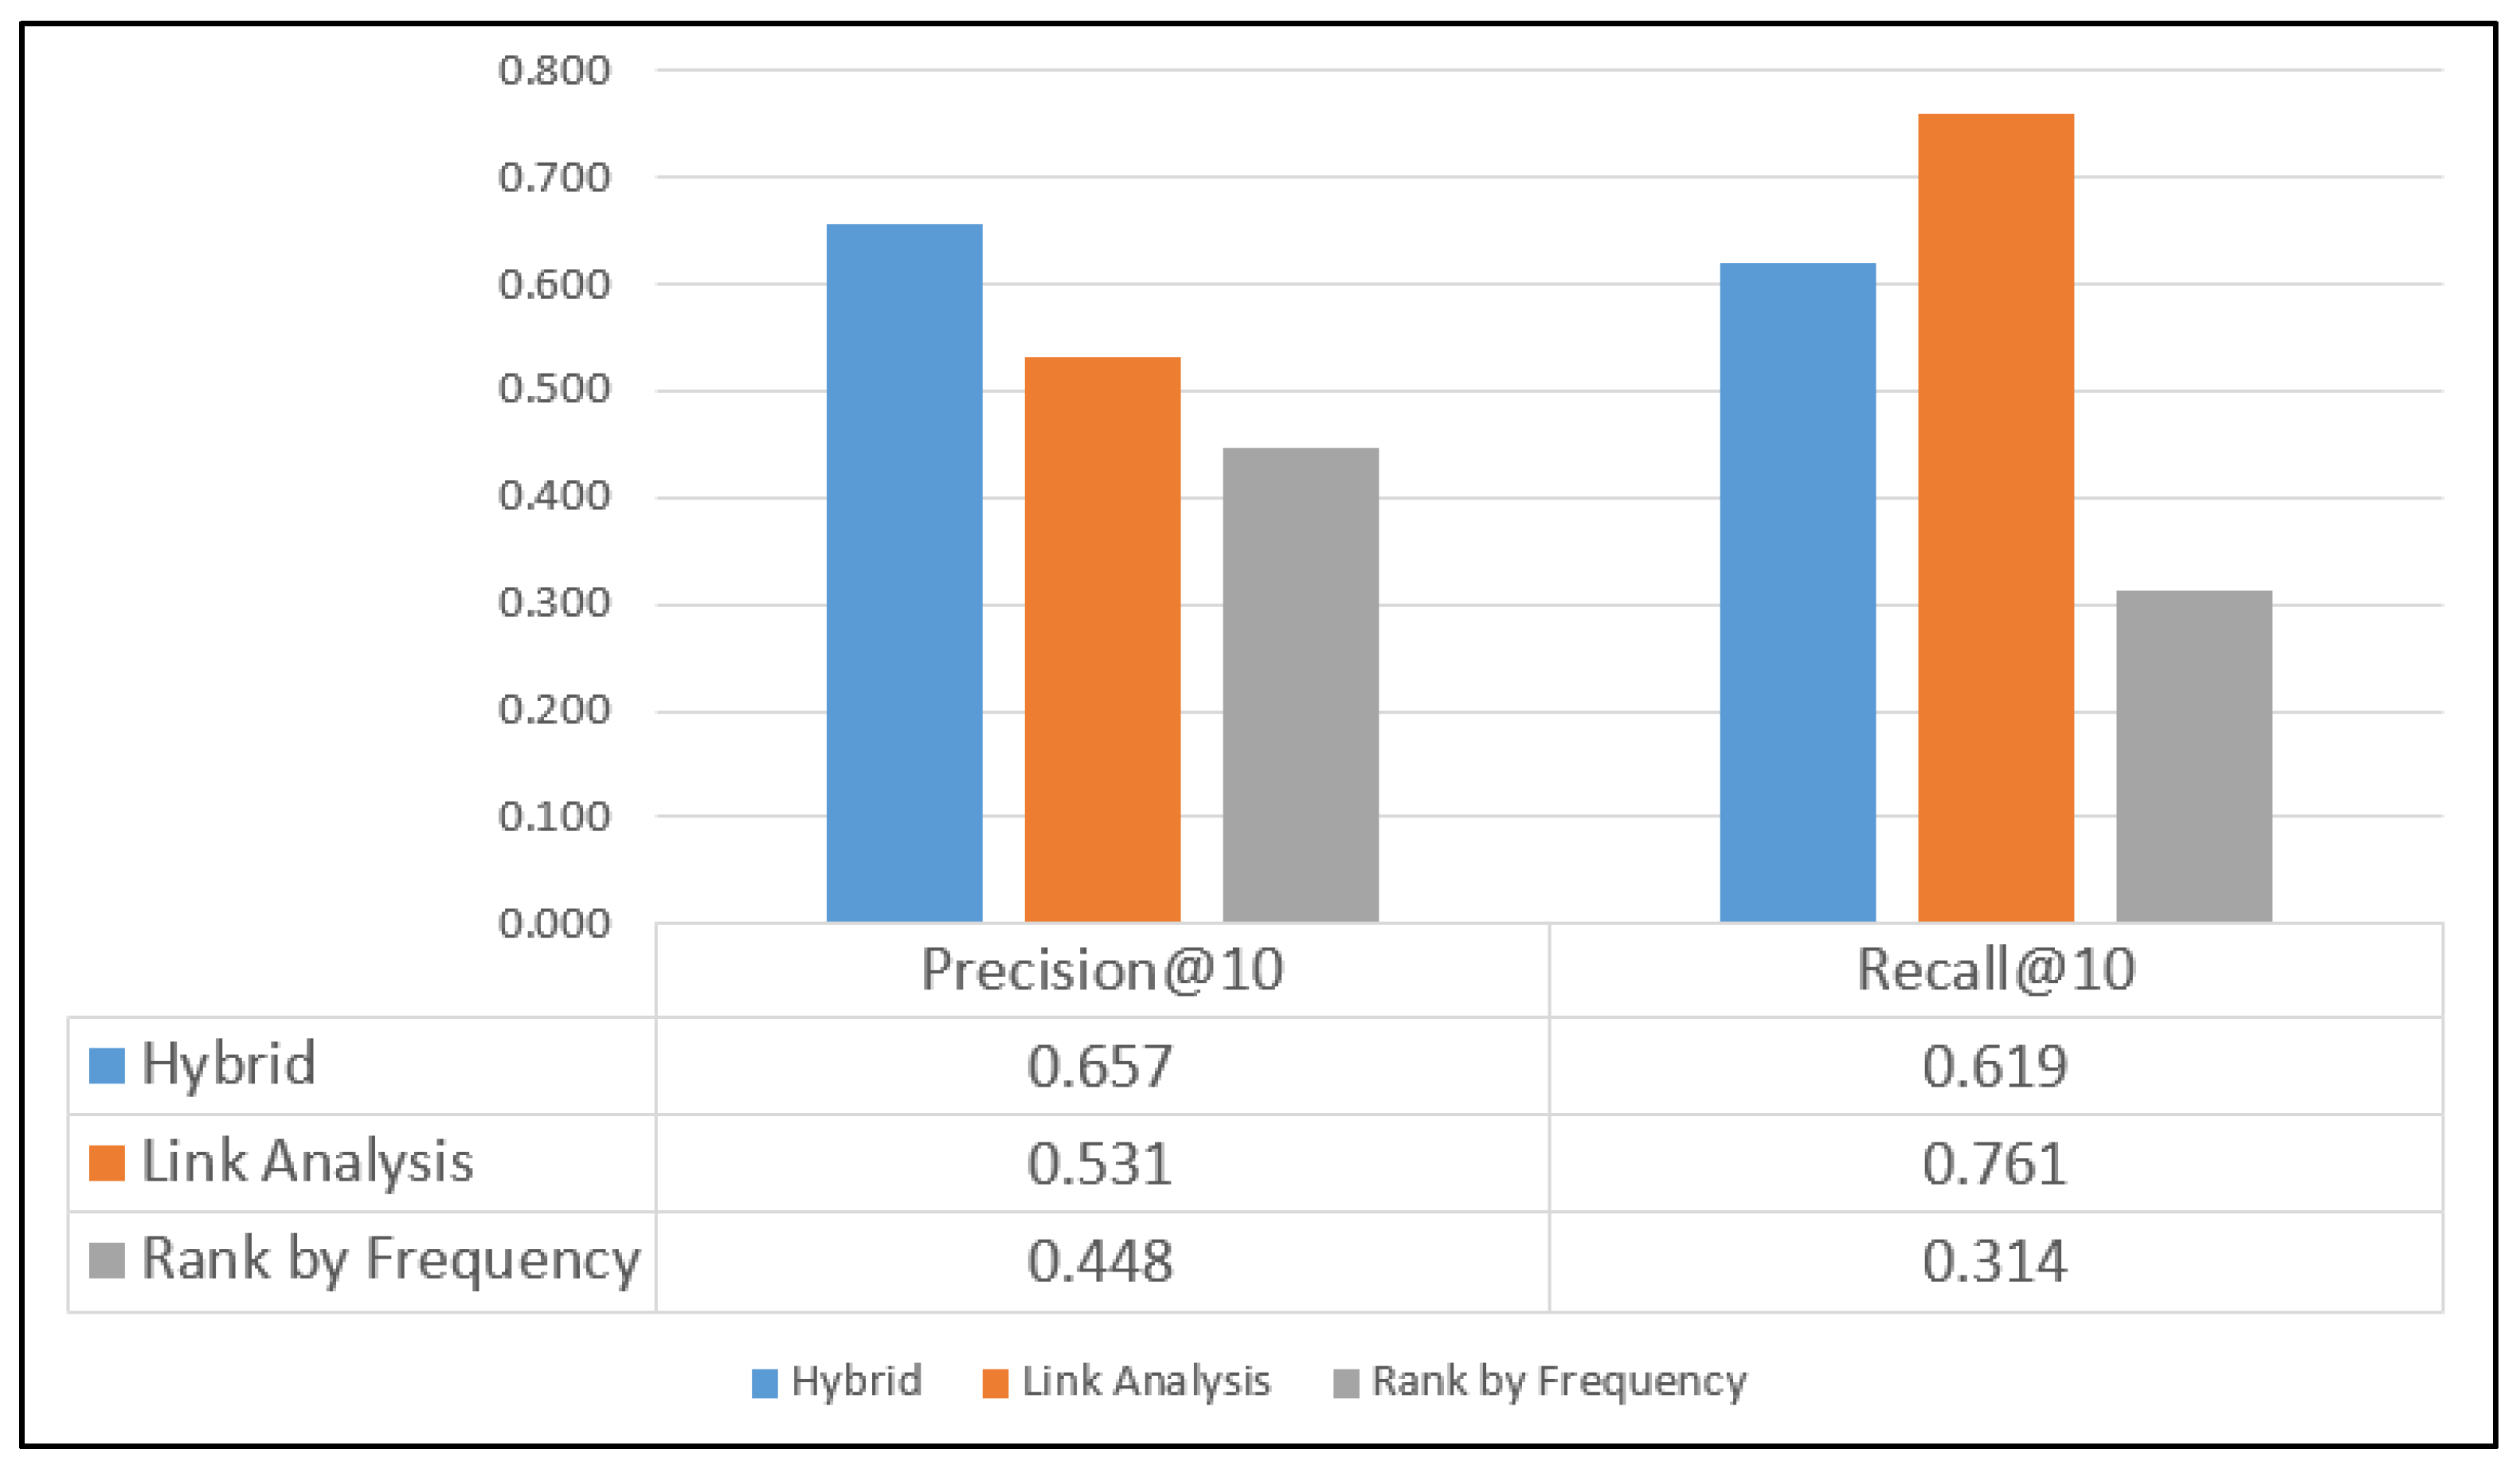
6.1. Comparison of Precision and Recall Measurements in Individual Datasets
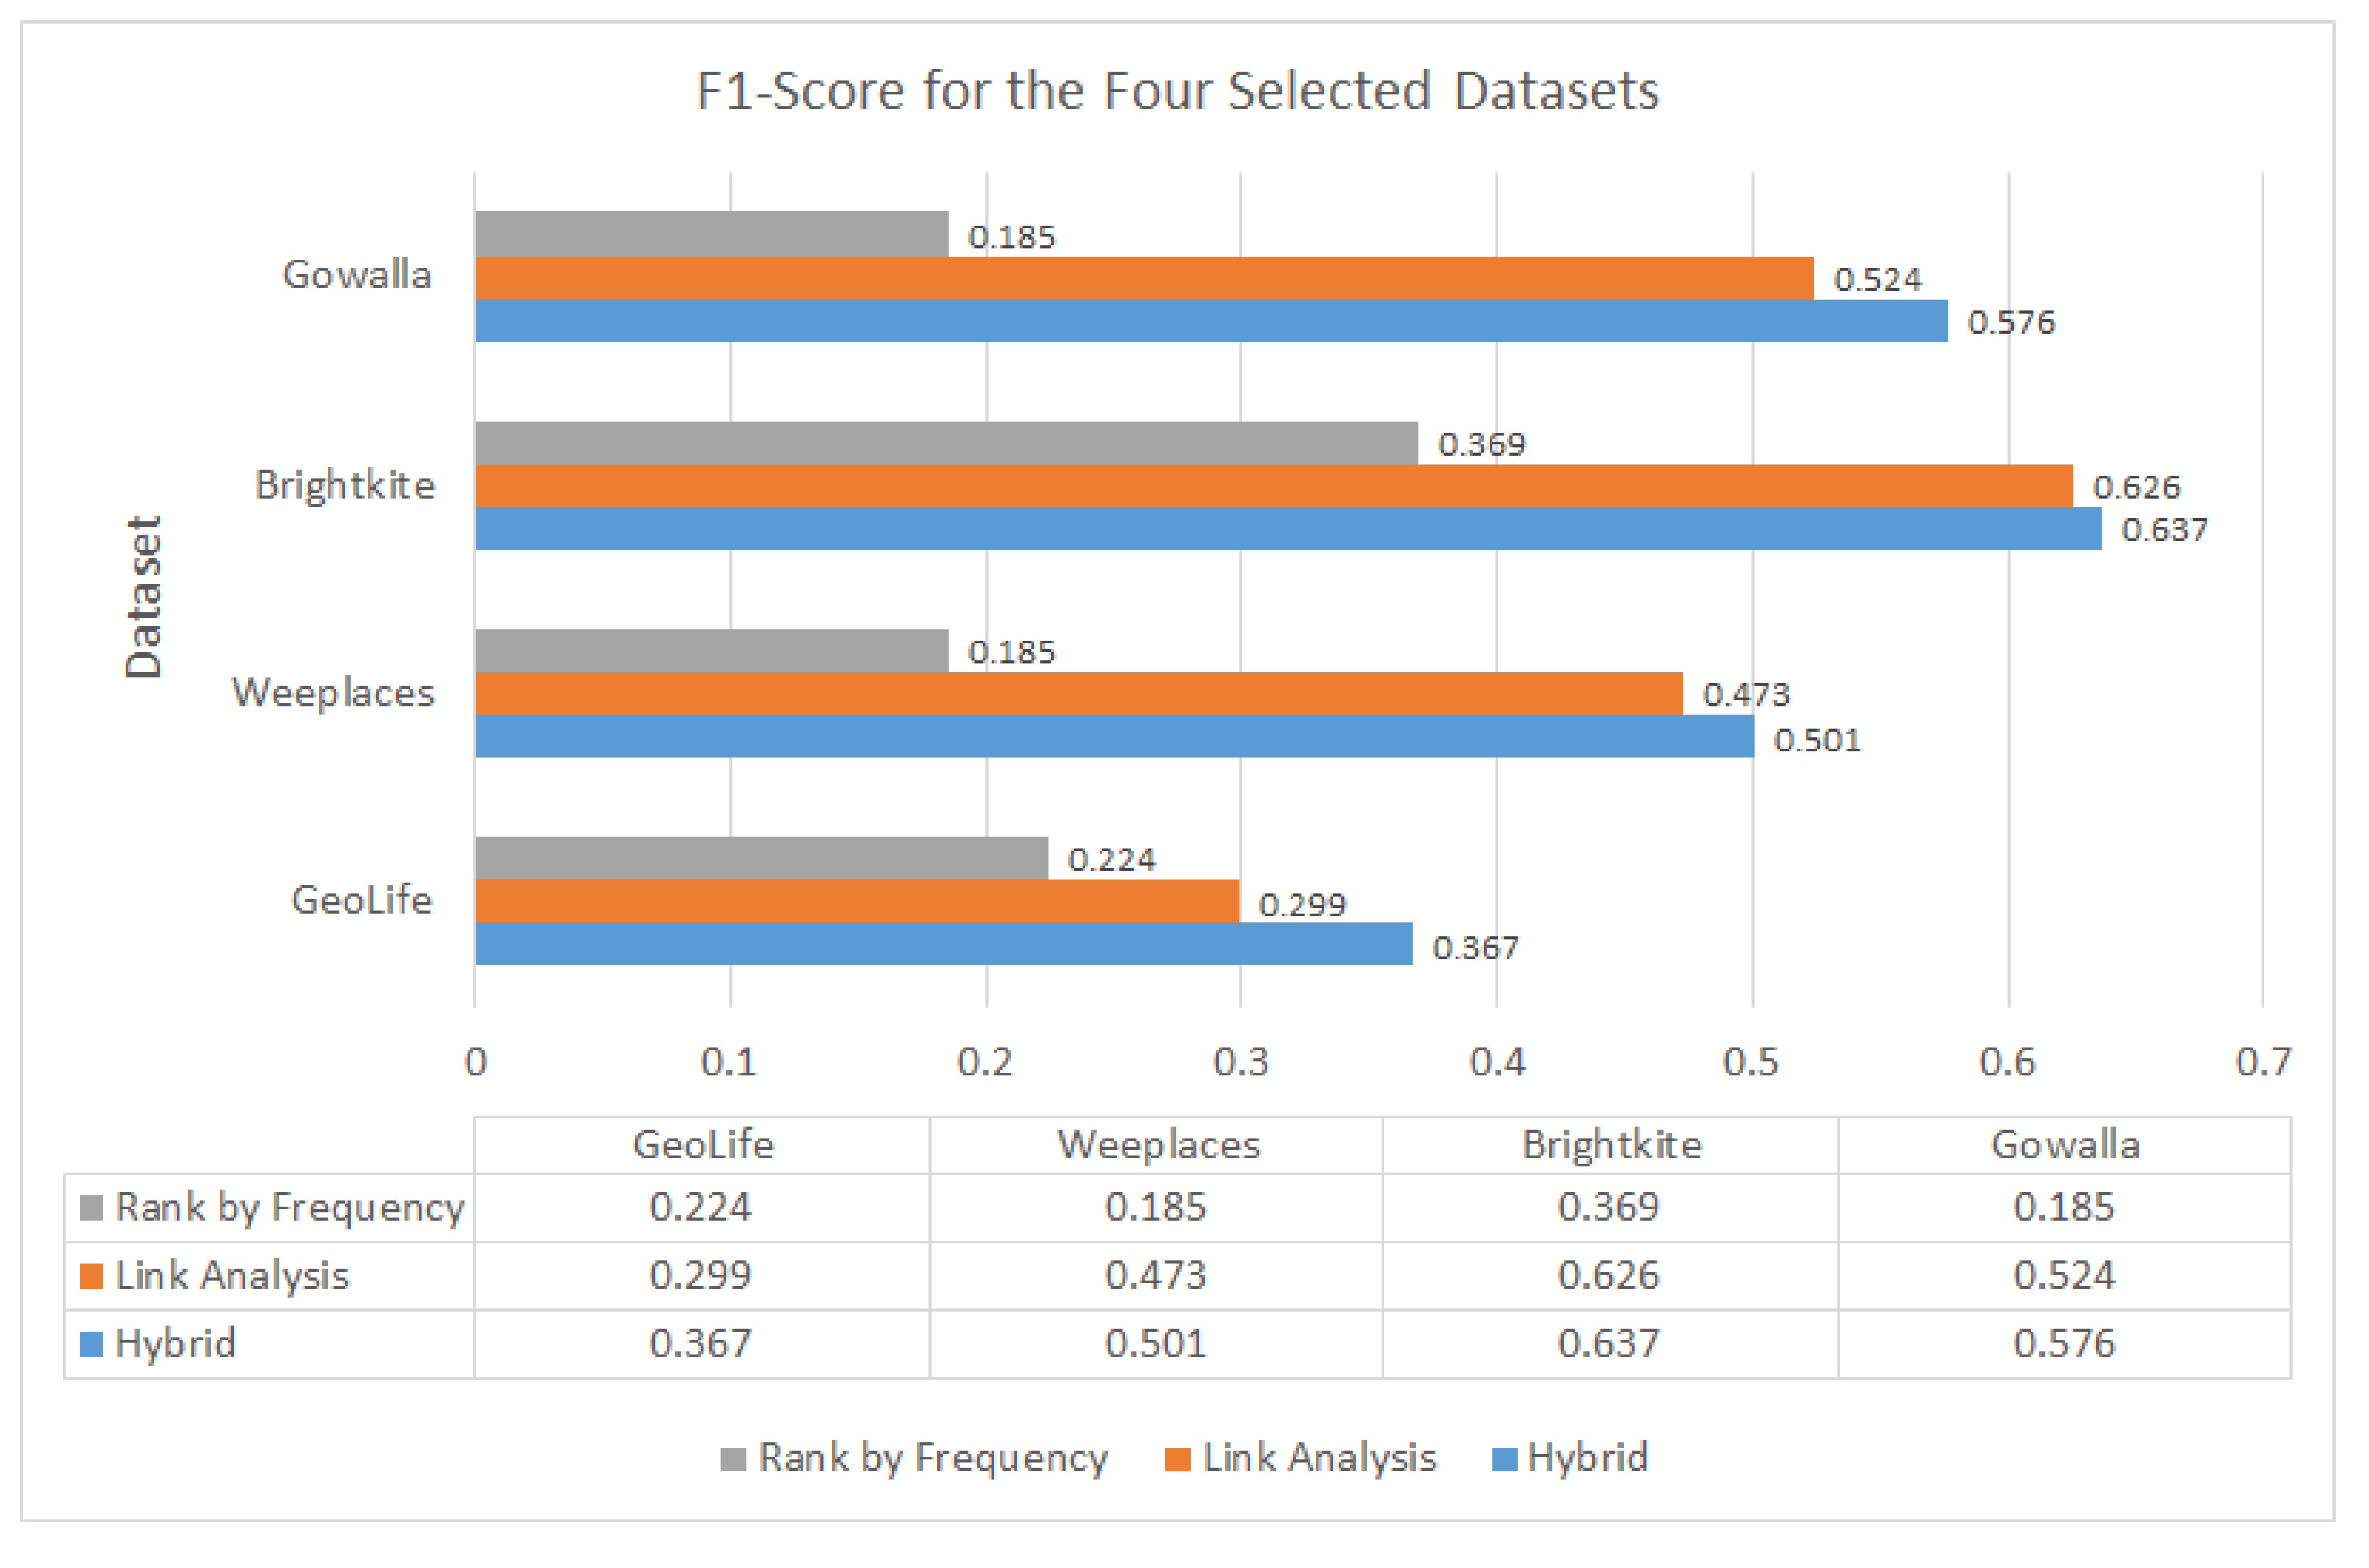
6.2. Measuring F1 for GeoLife, Gowalla, Weeplaces, and Brightkite Datasets
7. Conclusions
Author Contributions
Funding
Conflicts of Interest
References
- Gong, S.; Chen, C.L.; Tao, X. Security and surveillance. In Visual Analysis of Humans; Springer: London, UK, 2011; pp. 455–472. [Google Scholar]
- Calabrese, F.; Pereira, F.C.; Di Lorenzo, G.; Liu, L.; Ratti, C. The Geography of Taste: Analyzing Cell-Phone Mobility and Social Events. In Applied Reconfigurable Computing. Architectures, Tools, and Applications; Springer Science and Business Media LLC: Berlin, Germany, 2010; Volume 6030, pp. 22–37. [Google Scholar]
- Ali, S.; Kibria, M.G.; Jarwar, M.A.; Lee, H.K.; Chong, I. A Model of Socially Connected Web Objects for IoT Applications. Wirel. Commun. Mob. Comput. 2018, 2018, 1–20. [Google Scholar] [CrossRef]
- Wirz, M.; Franke, T.; Roggen, D.; Mitleton-Kelly, E.; Lukowicz, P.; Tröster, G. Inferring Crowd Conditions from Pedestrians’ Location Traces for Real-Time Crowd Monitoring during City-Scale Mass Gatherings. In Proceedings of the 2012 IEEE 21st International Workshop on Enabling Technologies: Infrastructure for Collaborative Enterprises, Hammamet, Tunisia, 25–27 June 2012; pp. 367–372. [Google Scholar]
- Junior, J.C.S.J.; Musse, S.R.; Jung, C. Crowd Analysis Using Computer Vision Techniques. IEEE Signal Process. Mag. 2010, 27, 66–77. [Google Scholar]
- Jung, J.; Chun, S.; Jin, X.; Lee, K.-H. Quantitative Computation of Social Strength in Social Internet of Things. IEEE Internet Things J. 2018, 5, 4066–4075. [Google Scholar] [CrossRef]
- Lippi, M.; Mamei, M.; Mariani, S.; Zambonelli, F. An Argumentation-Based Perspective Over the Social IoT. IEEE Internet Things J. 2018, 5, 2537–2547. [Google Scholar] [CrossRef]
- Chan, A.B.; Liang, Z.-S.J.; Vasconcelos, N. Privacy preserving crowd monitoring: Counting people without people models or tracking. In Proceedings of the 2008 IEEE Conference on Computer Vision and Pattern Recognition, Anchorage, AK, USA, 23–28 June 2008; pp. 1–7. [Google Scholar]
- Atzori, L.; Iera, A.; Morabito, G. From “smart objects” to “social objects”: The next evolutionary step of the internet of things. IEEE Commun. Mag. 2014, 52, 97–105. [Google Scholar] [CrossRef]
- Ben Abderrahim, O.; Elhdhili, M.H.; Saidane, L. TMCoI-SIOT: A trust management system based on communities of interest for the social Internet of Things. In Proceedings of the 2017 13th International Wireless Communications and Mobile Computing Conference (IWCMC), Valencia, Spain, 26–30 June 2017; pp. 747–752. [Google Scholar]
- Maglaras, L.; Al-Bayatti, A.H.; He, Y.; Wagner, I.; Janicke, H. Social Internet of Vehicles for Smart Cities. J. Sens. Actuator Networks 2016, 5, 3. [Google Scholar] [CrossRef]
- Butt, T.A.; Iqbal, R.; Shah, S.C.; Umer, T. Social Internet of Vehicles: Architecture and enabling technologies. Comput. Electr. Eng. 2018, 69, 68–84. [Google Scholar] [CrossRef]
- Ning, Z.; Xia, F.; Ullah, N.; Kong, X.; Hu, X. Vehicular Social Networks: Enabling Smart Mobility. IEEE Commun. Mag. 2017, 55, 16–55. [Google Scholar] [CrossRef]
- Ning, Z.; Hu, X.; Chen, Z.; Zhou, M.; Hu, B.; Cheng, J.; Obaidat, M.S. A Cooperative Quality-Aware Service Access System for Social Internet of Vehicles. IEEE Internet Things J. 2017, 5, 2506–2517. [Google Scholar] [CrossRef]
- Nam, T.; Pardo, T.A. Conceptualizing smart city with dimensions of technology, people, and institutions. In Proceedings of the 12th Annual International Digital Government Research Conference on Digital Government Innovation in Challenging Times, College Park, MD, USA, 12–15 June 2011; p. 282. [Google Scholar]
- Fortino, G.; Messina, F.; Rosaci, D.; Sarne, G.M.; Savaglio, C. A Trust-based Team Formation Framework for Mobile Intelligence in Smart Factories. IEEE Trans. Ind. Informatics 2020. [Google Scholar] [CrossRef]
- Guo, K.; Lu, Y.; Gao, H.; Cao, R. Artificial Intelligence-Based Semantic Internet of Things in a User-Centric Smart City. Sensors 2018, 18, 1341. [Google Scholar] [CrossRef] [PubMed]
- Amin, F.; Abbasi, R.; Rehman, A.; Choi, G.S. An Advanced Algorithm for Higher Network Navigation in Social Internet of Things Using Small-World Networks. Sensors 2019, 19, 2007. [Google Scholar] [CrossRef] [PubMed]
- Atzori, L.; Iera, A.; Morabito, G. Understanding the Internet of Things: definition, potentials, and societal role of a fast evolving paradigm. Ad Hoc Networks 2017, 56, 122–140. [Google Scholar] [CrossRef]
- Mariani, S. Coordination of Complex Socio-Technical Systems: Challenges and Opportunities. In Applied Reconfigurable Computing. Architectures, Tools, and Applications; Springer Science and Business Media LLC: Berlin, Germany, 2018; Volume 11176, pp. 295–310. [Google Scholar]
- Roopa, M.S.; Pattar, S.; Buyya, R.; Venugopal, K.R.; Iyengar, S.S.; Patnaik, L.M. Social Internet of Things (SIoT): Foundations, thrust areas, systematic review and future directions. Comput. Commun. 2019, 139, 32–57. [Google Scholar]
- Bobadilla, J.; Ortega, F.; Hernando, A.; Gutierrez, A.; Ortega, F. Recommender systems survey. Knowledge-Based Syst. 2013, 46, 109–132. [Google Scholar] [CrossRef]
- Xing, L.G.; Abiodun, I.A.; Khuen, C.W.; Boon, T.T. A personalized recommendation framework with user trajectory analysis applied in Location-Based Social Network (LBSN). In Proceedings of the 2017 IEEE 3rd International Conference on Engineering Technologies and Social Sciences (ICETSS), Bangkok, Thailand, 7–8 August 2017; pp. 1–6. [Google Scholar]
- Zheng, Y.; Zhang, L.; Xie, X.; Ma, W.-Y. Mining interesting locations and travel sequences from GPS trajectories. In Proceedings of the 18th international conference on World wide web, Madrid, Spain, 20–24 April 2009; pp. 791–800. [Google Scholar]
- Zheng, Y.; Xie, X. Learning travel recommendations from user-generated GPS traces. ACM Trans. Intell. Syst. Technol. 2011, 2, 1–29. [Google Scholar] [CrossRef]
- Dou, Y.; Yang, H.; Deng, X. A Survey of Collaborative Filtering Algorithms for Social Recommender Systems. In Proceedings of the 2016 12th International Conference on Semantics, Knowledge and Grids (SKG), Beijing, China, 15–17 August 2016; pp. 40–46. [Google Scholar]
- Cheng, W.K.; Ileladewa, A.A.; Tan, T.B. A Personalized Recommendation Framework for Social Internet of Things (SIoT). In Proceedings of the 2019 International Conference on Green and Human Information Technology (ICGHIT), Kuala Lumpur, Malaysia, 15–17 January 2019; pp. 24–29. [Google Scholar]
- Zheng, Y.; Chen, Y.; Xie, X.; Ma, W.-Y. GeoLife2.0: A Location-Based Social Networking Service. In Proceedings of the 2009 Tenth International Conference on Mobile Data Management: Systems, Services and Middleware, Taipei, Taiwan, 18–20 May 2009; pp. 357–358. [Google Scholar]
- Liu, Y.; Wei, W.; Sun, A.; Miao, C. Exploiting Geographical Neighborhood Characteristics for Location Recommendation. In Proceedings of the 23rd ACM international conference on Multimedia, Shanghai, China, 3–7 November 2014; pp. 739–748. [Google Scholar]
- Cho, E.; Myers, S.A.; Leskovec, J. Friendship and mobility. In Proceedings of the 17th ACM SIGKDD International Conference on Knowledge discovery and data mining - KDD ’11, San Diego, CA, USA, 21–24 August 2011; p. 1082. [Google Scholar]
- Truong, N.B.; Lee, H.; Askwith, B.; Lee, G.M. Toward a Trust Evaluation Mechanism in the Social Internet of Things. Sensors 2017, 17, 1346. [Google Scholar] [CrossRef]
- Fortino, G.; Rovella, A.; Russo, W.; Savaglio, C. Towards Cyberphysical Digital Libraries: Integrating IoT Smart Objects into Digital Libraries. In Internet of Things; Springer Science and Business Media LLC: Berlin, Germany, 2016; pp. 135–156. [Google Scholar]
- Saleem, Y.; Crespi, N.; Rehmani, M.H.; Copeland, R.; Hussein, D.; Bertin, E. Exploitation of social IoT for recommendation services. In Proceedings of the 2016 IEEE 3rd World Forum on Internet of Things (WF-IoT), Reston, VA, USA, 12–14 December 2016; pp. 359–364. [Google Scholar]
- Han, X.; Wang, L.; Park, S.; Cuevas, A.; Crespi, N. Alike people, alike interests? A large-scale study on interest similarity in social networks. In Proceedings of the 2014 IEEE/ACM International Conference on Advances in Social Networks Analysis and Mining (ASONAM 2014), Beijing, China, 17–20 August 2014; pp. 491–496. [Google Scholar]
- Felfernig, A.; Erdeniz, S.P.; Uran, C.; Reiterer, S.; Atas, M.; Tran, T.N.T.; Azzoni, P.; Kiraly, C.; Dolui, K. An overview of recommender systems in the internet of things. J. Intell. Inf. Syst. 2018, 52, 285–309. [Google Scholar] [CrossRef]
- Luan, W.; Liu, G.; Jiang, C.; Qi, L. Partition-based collaborative tensor factorization for POI recommendation. IEEE/CAA J. Autom. Sin. 2017, 4, 437–446. [Google Scholar] [CrossRef]
- Luan, W.; Liu, G.; Jiang, C.; Zhou, M. MPTR: A Maximal-Marginal-Relevance-Based Personalized Trip Recommendation Method. IEEE Trans. Intell. Transp. Syst. 2018, 19, 3461–3474. [Google Scholar] [CrossRef]
- Amin, F.; Ahmad, A.; Choi, G.S. Community Detection and Mining Using Complex Networks Tools in Social Internet of Things. In Proceedings of the TENCON 2018 - 2018 IEEE Region 10 Conference, Jeju, Korea, 28–31 October 2018; pp. 2086–2091. [Google Scholar]
- Lye, G.X.; Cheng, W.K.; Tan, T.B.; Hung, C.W.; Chen, Y.-L. User Trajectory Analysis within Intelligent Social Internet-of-things (SIoT). In Proceedings of the 2019 International Symposium on Intelligent Signal Processing and Communication Systems (ISPACS), Taipei, Taiwan, 3–6 December 2019. [Google Scholar]
- Huang, Z.; Xu, X.; Zhu, H.; Zhou, M. An Efficient Group Recommendation Model with Multiattention-Based Neural Networks. IEEE Trans. Neural Networks Learn. Syst. 2020. [Google Scholar] [CrossRef] [PubMed]
- Chen, Y.; Zhou, M.; Zheng, Z.; Chen, D. Time-Aware Smart Object Recommendation in Social Internet of Things. IEEE Internet Things J. 2020, 7, 2014–2027. [Google Scholar] [CrossRef]
- Bao, J.; Zheng, Y.; Wilkie, D.; Mokbel, M.F. Recommendations in location-based social networks: a survey. GeoInformatica 2015, 19, 525–565. [Google Scholar] [CrossRef]
- Yang, X.; Guo, Y.; Liu, Y.; Steck, H. A survey of collaborative filtering based social recommender systems. Comput. Commun. 2014, 41, 1–10. [Google Scholar] [CrossRef]
- Stai, E.; Kafetzoglou, S.; Tsiropoulou, E.E.; Papavassiliou, S. A holistic approach for personalization, relevance feedback & recommendation in enriched multimedia content. Multimedia Tools Appl. 2016, 77, 283–326. [Google Scholar]
- Ramaswamy, L.; Deepak, P.; Polavarapu, R.; Gunasekera, K.; Garg, D.; Visweswariah, K.; Kalyanaraman, S. CAESAR: A Context-Aware, Social Recommender System for Low-End Mobile Devices. In Proceedings of the 2009 Tenth International Conference on Mobile Data Management: Systems, Services and Middleware, Taipei, Taiwan, 18–20 May 2009; pp. 338–347. [Google Scholar]
- Pazzani, M. A Framework for Collaborative, Content-Based and Demographic Filtering. Artif. Intell. Rev. 1999, 13, 393–408. [Google Scholar] [CrossRef]
- Linden, G.; Smith, B.; York, J. Amazon.com recommendations: item-to-item collaborative filtering. IEEE Internet Comput. 2003, 7, 76–80. [Google Scholar] [CrossRef]
- Cantador, I.; Bellogín, A.; Castells, P. A multilayer ontology-based hybrid recommendation model. AI Commun. 2008, 21, 203–210. [Google Scholar] [CrossRef]
- Lucas, J.P.; Luz, N.; Moreno, M.N.; Anacleto, R.; Figueiredo, A.A.; Martins, C. A hybrid recommendation approach for a tourism system. Expert Syst. Appl. 2013, 40, 3532–3550. [Google Scholar] [CrossRef]
- Forestiero, A. Multi-Agent Recommendation System in Internet of Things. In Proceedings of the 2017 17th IEEE/ACM International Symposium on Cluster, Cloud and Grid Computing (CCGRID), Madrid, Spain, 14–17 May 2017; pp. 772–775. [Google Scholar]
- Ding, Z.; Li, X.; Jiang, C.; Zhou, M. Objectives and State-of-the-Art of Location-Based Social Network Recommender Systems. ACM Comput. Surv. 2018, 51, 1–28. [Google Scholar] [CrossRef]
- Page, L.; Brin, S.; Motwani, R.; Winograd, T. The Pagerank Citation Ranking: Bringing Order to the Web; Stanford InfoLab: Stanford, CA, USA, 1999. [Google Scholar]
- Kleinberg, J.M. Authoritative sources in a hyperlinked environment. J. ACM 1999, 46, 604–632. [Google Scholar] [CrossRef]
- Bai, X.; Wang, M.; Lee, I.; Yang, Z.; Kong, X.; Xia, F. Scientific Paper Recommendation: A Survey. IEEE Access 2019, 7, 9324–9339. [Google Scholar] [CrossRef]
- Balabanovic, M.; Shoham, Y. Fab: content-based, collaborative recommendation. Commun. ACM 1997, 40, 66–72. [Google Scholar] [CrossRef]
- Herlocker, J.L.; Konstan, J.; Terveen, L.; Riedl, J. Evaluating collaborative filtering recommender systems. ACM Trans. Inf. Syst. 2004, 22, 5–53. [Google Scholar] [CrossRef]
- Adomavicius, G.; Tuzhilin, A. Toward the next generation of recommender systems: a survey of the state-of-the-art and possible extensions. IEEE Trans. Knowl. Data Eng. 2005, 17, 734–749. [Google Scholar] [CrossRef]
- Lemire, D.; MacLachlan, A. Slope One Predictors for Online Rating-Based Collaborative Filtering. In Proceedings of the 2005 SIAM International Conference on Data Mining, Newport Beach, CA, USA, 21–23 April 2005; pp. 471–475. [Google Scholar]
- Chow, C.-Y.; Bao, J.; Mokbel, M.F. Towards location-based social networking services. In Proceedings of the 2nd ACM SIGSPATIAL International Workshop on Location Based Social Networks, San Jose, CA, USA, 2 November 2010; pp. 31–38. [Google Scholar]
- Horozov, T.; Narasimhan, N.; Vasudevan, V. Using location for personalized POI recommendations in mobile environments. In Proceedings of the International Symposium on Applications and the Internet (SAINT’06), Phoenix, AZ, USA, 23–27 January 2006. [Google Scholar]
- Ye, M.; Yin, P.; Lee, W.-C. Location recommendation for location-based social networks. In Proceedings of the 18th SIGSPATIAL International Conference on advances in geographic information systems, San Jose, CA, USA, 2–5 November 2010; pp. 458–461. [Google Scholar]
- Del Prete, L.; Capra, L. diffeRS: A Mobile Recommender Service. In Proceedings of the 2010 Eleventh International Conference on Mobile Data Management, Kansas City, MO, USA, 23–26 May 2010; pp. 21–26. [Google Scholar]
- Huang, Z.; Zeng, D.; Chen, H. A comparative study of recommendation algorithms in e-commerce applications. IEEE Intell. Syst. 2007, 22, 68–78. [Google Scholar] [CrossRef]
- Small, H. Co-citation in the scientific literature: A new measure of the relationship between two documents. J. Am. Soc. Inf. Sci. 1973, 24, 265–269. [Google Scholar] [CrossRef]
- Dooms, S. Dynamic generation of personalized hybrid recommender systems. In Proceedings of the 7th ACM Conference on Recommender systems, Hong Kong, China, 12–16 October 2013; pp. 443–446. [Google Scholar]
- Porcel, C.; Tejeda-Lorente, A.; Martínez, M.A.; Herrera-Viedma, E. A hybrid recommender system for the selective dissemination of research resources in a Technology Transfer Office. Inf. Sci. 2012, 184, 1–19. [Google Scholar] [CrossRef]
- Nouh, R.M.; Lee, H.-H.; Lee, W.-J.; Lee, J.-D. A Smart Recommender Based on Hybrid Learning Methods for Personal Well-Being Services. Sensors 2019, 19, 431. [Google Scholar] [CrossRef]
- Esmaeili, L.; Mardani, S.; Golpayegani, S.A.H.; Madar, Z.Z. A novel tourism recommender system in the context of social commerce. Expert Syst. Appl. 2020, 149, 113301. [Google Scholar] [CrossRef]
- Li, J.; Ren, P.; Chen, Z.; Ren, Z.; Lian, T.; Ma, J. Neural attentive session-based recommendation. In Proceedings of the ACM on Conference on Information and Knowledge Management, Singapore, 6–10 November 2017; pp. 1419–1428. [Google Scholar]
- Gao, L.; Li, C. Hybrid Personalized Recommended Model Based on Genetic Algorithm. In Proceedings of the 2008 4th International Conference on Wireless Communications, Networking and Mobile Computing, Dalian, China, 12–14 October 2008; pp. 1–4. [Google Scholar]
- Zhang, S.; Yao, L.; Sun, A.; Tay, Y. Deep Learning Based Recommender System. ACM Comput. Surv. 2019, 52, 1–38. [Google Scholar] [CrossRef]
- Rendle, S.; Freudenthaler, C.; Gantner, Z.; Schmidt-Thieme, L. BPR: Bayesian Personalized Ranking from Implicit Feedback. In Proceedings of the 25th Conference on Uncertainty in Artificial Intelligence, Montreal, QC, Canada, 18–21 June 2009; pp. 452–461. [Google Scholar]
- Luo, C.; Zhang, B.; Xiang, Y.; Qi, M. Gaussian-Gamma collaborative filtering: A hierarchical Bayesian model for recommender systems. J. Comput. Syst. Sci. 2019, 102, 42–56. [Google Scholar] [CrossRef]
- Gauch, S.; Speretta, M.; Chandramouli, A.; Micarelli, A. User Profiles for Personalized Information Access; Springer Science and Business Media LLC: Berlin, Germany, 2007; Volume 4321, pp. 54–89. [Google Scholar]
- Moukas, A. Amalthaea information discovery and filtering using a multiagent evolving ecosystem. Appl. Artif. Intell. 1997, 11, 437–457. [Google Scholar] [CrossRef]
- Mobasher, B. Data Mining for Web Personalization. In The Adaptive Web; Springer Science and Business Media LLC: Berlin, Germany, 2007; Volume 4321, pp. 90–135. [Google Scholar]
- Micarelli, A.; Sciarrone, F. Anatomy and Empirical Evaluation of an Adaptive Web-Based Information Filtering System. User Model. User-Adapted Interact. 2004, 14, 159–200. [Google Scholar] [CrossRef]
- Bloedorn, E.; Mani, I.; MacMillan, T.R. Machine learning of user profiles: Representational issues. arXiv 1997, arXiv:preprint cmp-lg/9712002. [Google Scholar]
- Abiodun, I.; Khuen, C.W. Using multi-agent system with publish/subscribe model in a mobile framework for capturing social network users’ behaviour. In Proceedings of the IET International Conference on Wireless Communications and Applications (ICWCA 2012), Kuala Lumpur, Malaysia, 8–10 October 2012. [Google Scholar]
- Lamarca, A.; Chawathe, Y.; Consolvo, S.; Hightower, J.; Smith, I.; Scott, J.; Sohn, T.; Howard, J.; Hughes, J.; Potter, F.; et al. Place Lab: Device Positioning Using Radio Beacons in the Wild. Lect. Notes Comput. Sci. 2005, 3468, 116–133. [Google Scholar]
- Gu, Y.; Zhou, C.; Wieser, A.; Zhou, Z. WiFi based trajectory alignment, calibration and crowdsourced site survey using smart phones and foot-mounted IMUs. In Proceedings of the 2017 International Conference on Indoor Positioning and Indoor Navigation (IPIN), Sapporo, Japan, 18–21 September 2017; pp. 1–6. [Google Scholar]
- Bratman, M. Intention, Plans, and Practical Reason; Harvard University Press: Cambridge, MA, USA, 1987; Volume 10. [Google Scholar]
- Dretske, F. Gettier and justified true belief: fifty years on. The Philosophers’ Magazine, 13 June 2013; 61. [Google Scholar]
- Duan, Z.; Tang, L.; Gong, X.; Zhu, Y. Personalized service recommendations for travel using trajectory pattern discovery. Int. J. Distrib. Sens. Networks 2018, 14. [Google Scholar] [CrossRef]


| Research Publication | Year | User Profile | Data Model | For Trajectory Analysis | Type and Recommendation Approach | Dataset | Domain |
|---|---|---|---|---|---|---|---|
| Zheng et al. [24,25] | 2009, 2011 | No | Tree-based hierarchical graph | No | Item-based collaborative filtering: (Personalized) | GeoLife [28] | Travel Advisory |
| Ning et al. [13] | 2017 | No | Temporal and spatial segments | Yes | Inner-line anomaly detection method: (Generic) | Data collected through mobile crowdsensing | Smart Vehicle |
| Luan et al. [36] | 2017 | No | Tensor partition | No | Collaborative tensor factorization: (Personalized) | Data collected from Weibo and DianPing | Location Based Social Network |
| Ning et al. [14] | 2017 | No | Node-centric generation tree | Yes | Trajectory-based interaction time prediction algorithm: (Generic) | Simulation | Smart Vehicle |
| Luan et al. [37] | 2018 | No | Two-level POI category hierarchy structure | No | Maximal-marginal-relevance method: (Personalized) | Data collected from Weibo | Location Based Social Network |
| Amin et al. [38] | 2018 | Yes | Social network structure | No | Statistical, Louvain and Greedy methods: (Generic) | Egonets-Facebook | Smart Community |
| Lye et al., [23,39] | 2017,2019 | Yes | Tree-based hierarchical graph and KDI Model | Yes | Trajectory-based KDI-link analysis: (Personalized) | UniCAT [23] and Weeplaces [29] | Smart Campus |
| Huang et al. [40] | 2020 | No | Multi-attention network | No | Multi-attention based neural network: (Personalized) | Data collected from Meetup, and MovieLens-1M | Social Networks |
| Chen et al. [41] | 2020 | No | Time aware SIoT knowledge graph | No | Item-based collaborative filtering: (Personalized) | MIT | Smart Community |
| Proposed Framework | 2020 | Yes | Tree-based hierarchical graph and KDI Model | Yes | Trajectory-based KDI-link analysis: (Personalized) | GeoLife, Weeplaces, Gowalla [29], and Brightkite [30] | Smart Community |
| Dataset | Type of Record | Number of Users | Number of Trajectories / Check-in Points | Number of POIs | Time Span of the Collection |
|---|---|---|---|---|---|
| GeoLife | GPS trajectory | 182 | 17,621 | - | 36 months |
| Weeplaces | Check-in point | 15,799 | 7,658,368 | 971,309 | 92 months |
| Brightkite | Check-in point | 58,228 | 4,491,143 | 772,764 | 31 months |
| Gowalla | Check-in point | 319,063 | 36,001,959 | 2,844,076 | 29 months |
© 2020 by the authors. Licensee MDPI, Basel, Switzerland. This article is an open access article distributed under the terms and conditions of the Creative Commons Attribution (CC BY) license (http://creativecommons.org/licenses/by/4.0/).
Share and Cite
Lye, G.X.; Cheng, W.K.; Tan, T.B.; Hung, C.W.; Chen, Y.-L. Creating Personalized Recommendations in a Smart Community by Performing User Trajectory Analysis through Social Internet of Things Deployment. Sensors 2020, 20, 2098. https://doi.org/10.3390/s20072098
Lye GX, Cheng WK, Tan TB, Hung CW, Chen Y-L. Creating Personalized Recommendations in a Smart Community by Performing User Trajectory Analysis through Social Internet of Things Deployment. Sensors. 2020; 20(7):2098. https://doi.org/10.3390/s20072098
Chicago/Turabian StyleLye, Guang Xing, Wai Khuen Cheng, Teik Boon Tan, Chen Wei Hung, and Yen-Lin Chen. 2020. "Creating Personalized Recommendations in a Smart Community by Performing User Trajectory Analysis through Social Internet of Things Deployment" Sensors 20, no. 7: 2098. https://doi.org/10.3390/s20072098
APA StyleLye, G. X., Cheng, W. K., Tan, T. B., Hung, C. W., & Chen, Y.-L. (2020). Creating Personalized Recommendations in a Smart Community by Performing User Trajectory Analysis through Social Internet of Things Deployment. Sensors, 20(7), 2098. https://doi.org/10.3390/s20072098