The Field Monitoring Experiment of the Roof Strata Movement in Coal Mining Based on DFOS


Abstract
1. Introduction
2. Distributed Fiber Optical Sensor (DFOS) Technology
2.1. The Principle of BOTDR and BOFDA
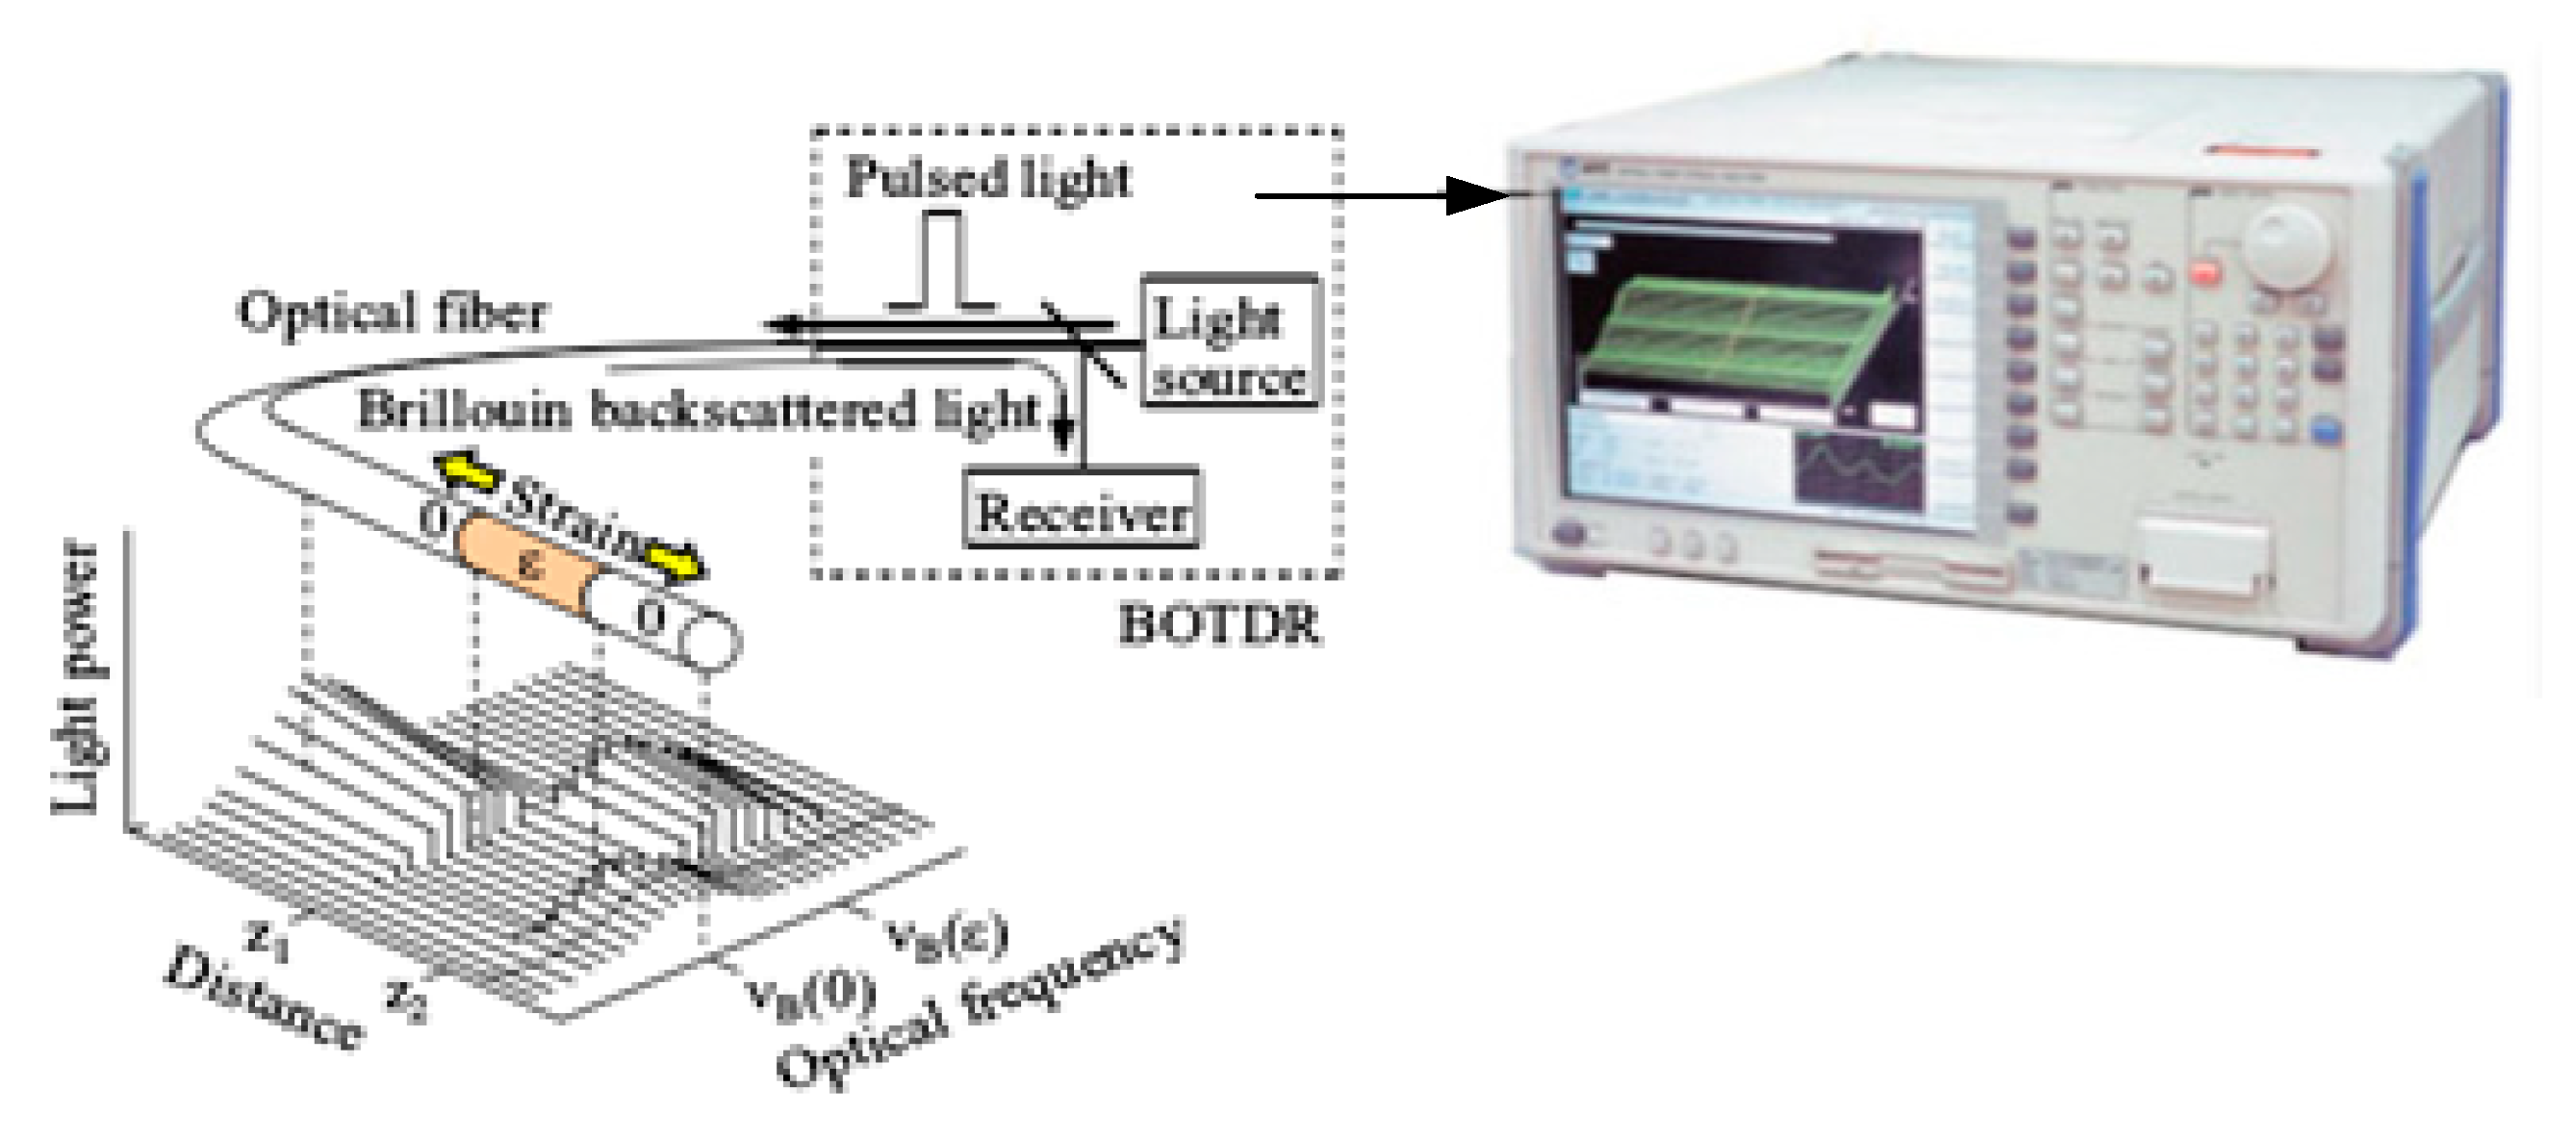
2.1.1. BOTDR
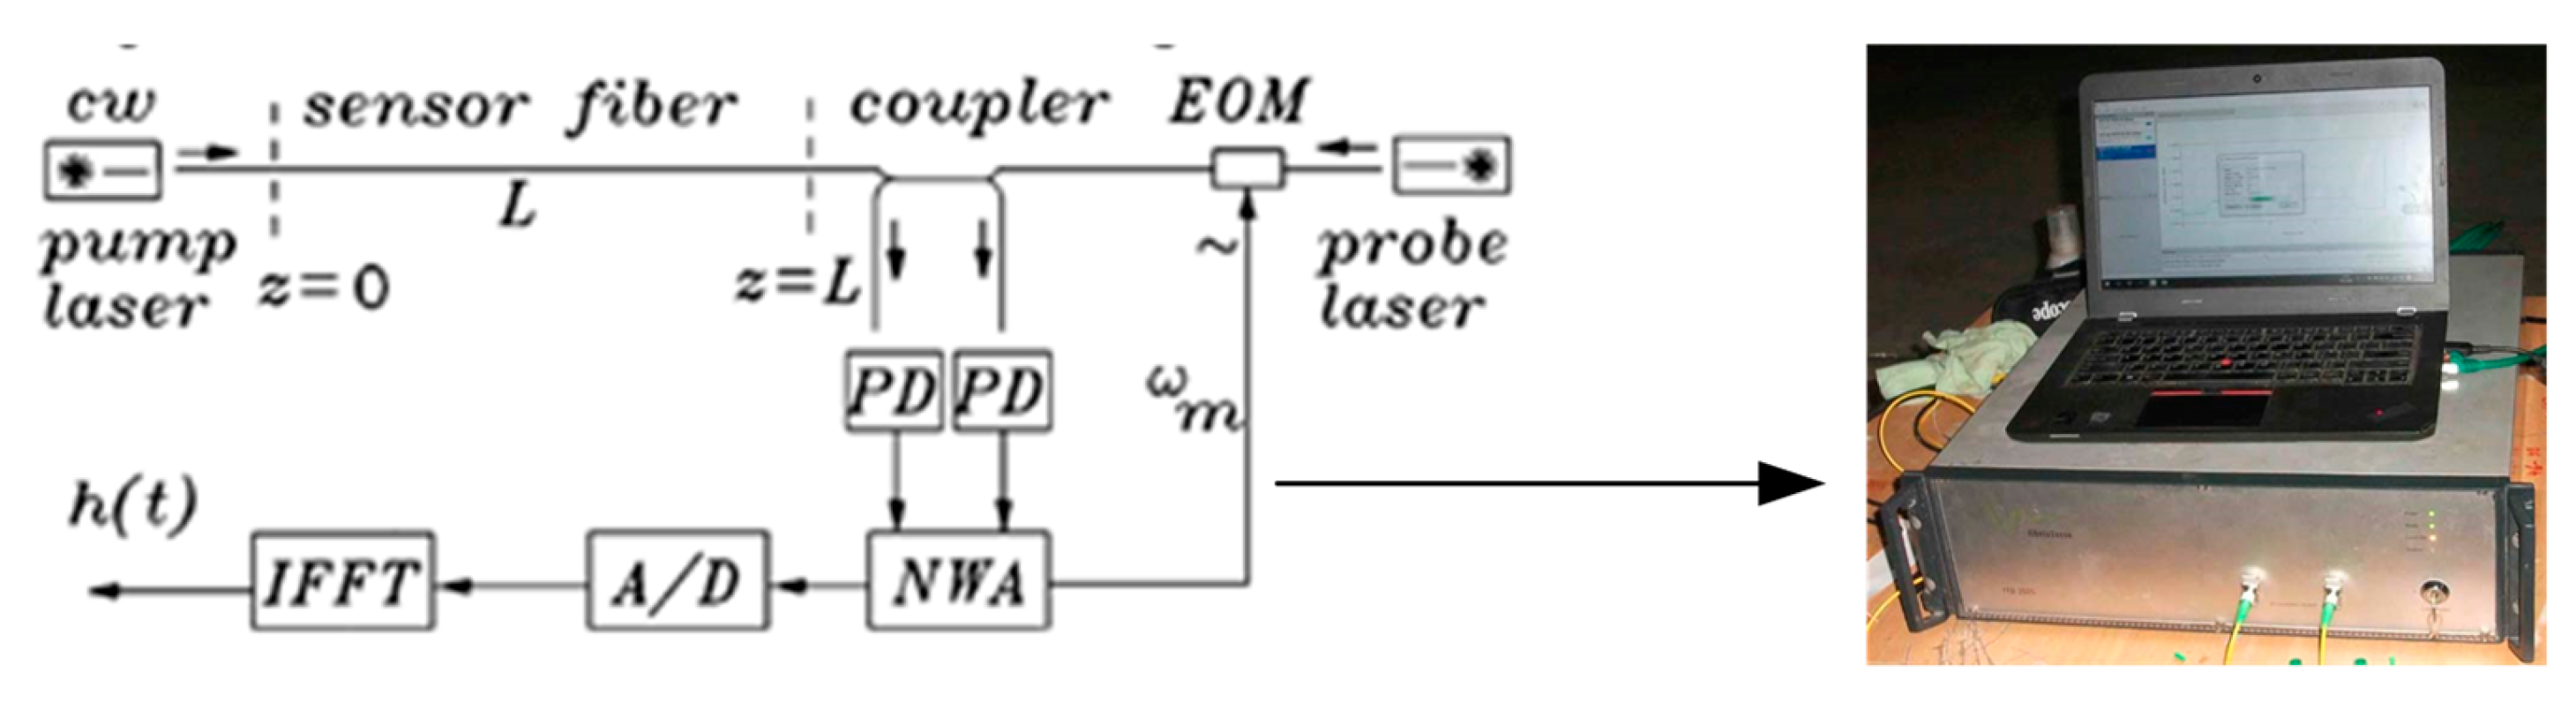
2.1.2. BOFDA
2.2. Principle of Optical Fiber Strain Monitoring
3. Indoor Experiments of Fiber Strain Based on DFOS
3.1. Experimental on Strain Transfer Performance of SS Fiber in Borehole Anchorage
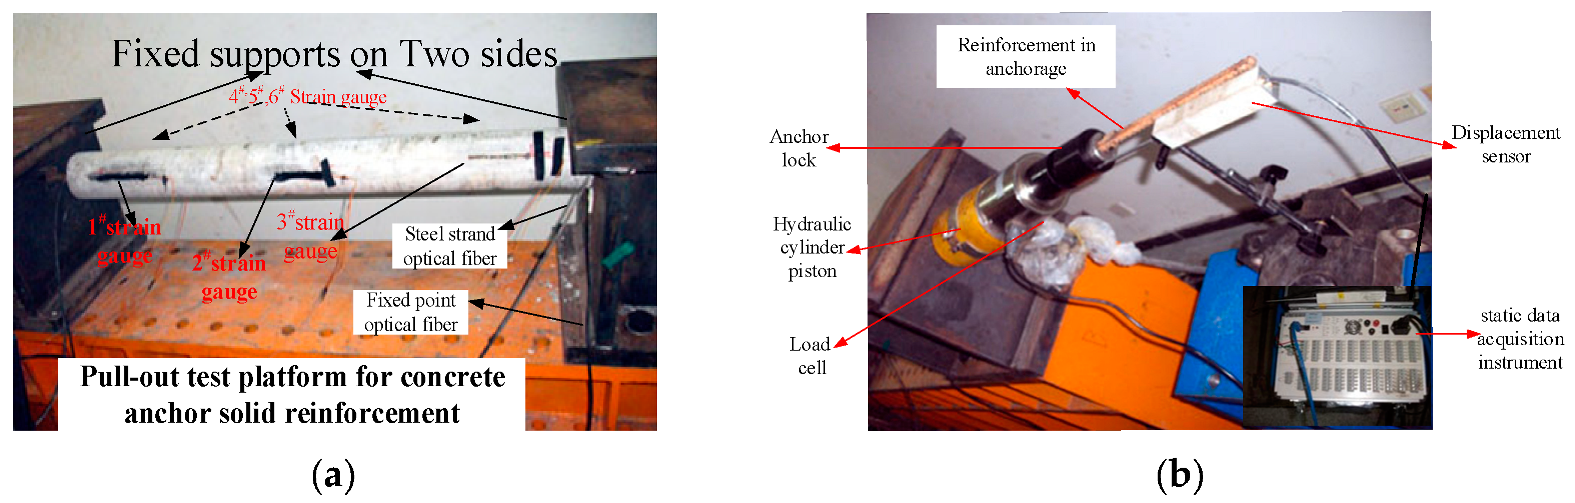
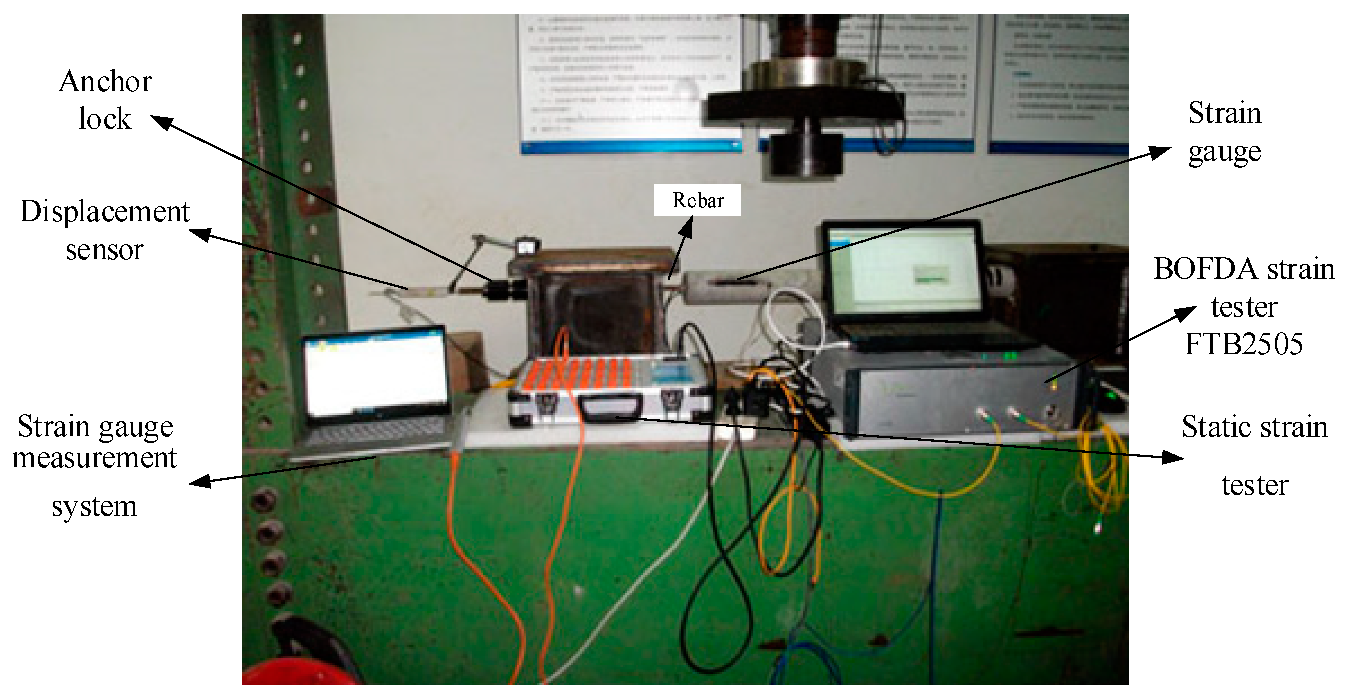
3.1.1. Experiment Method and Experiment System Setup
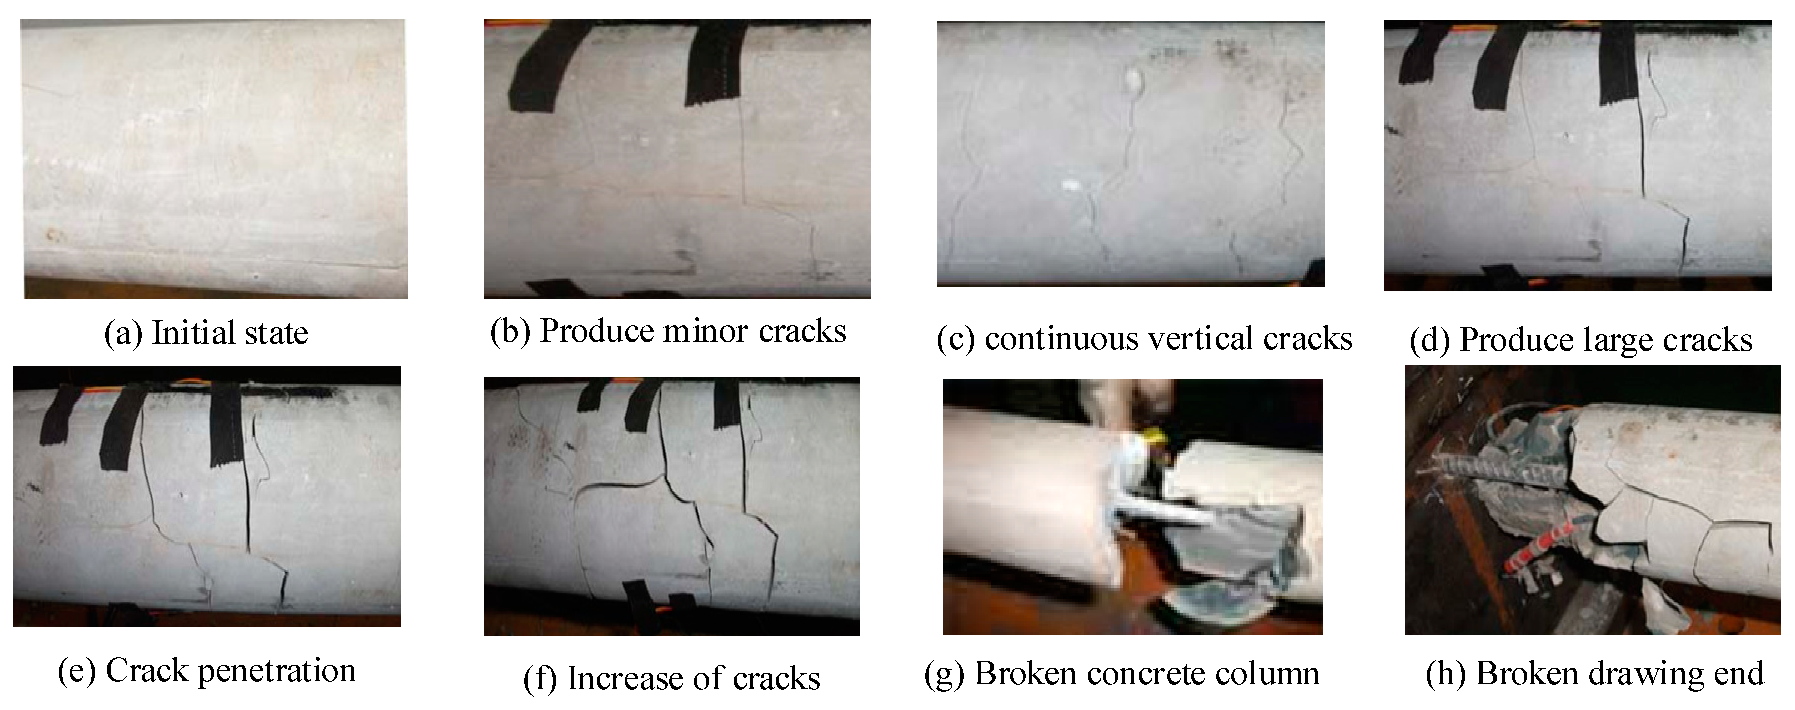
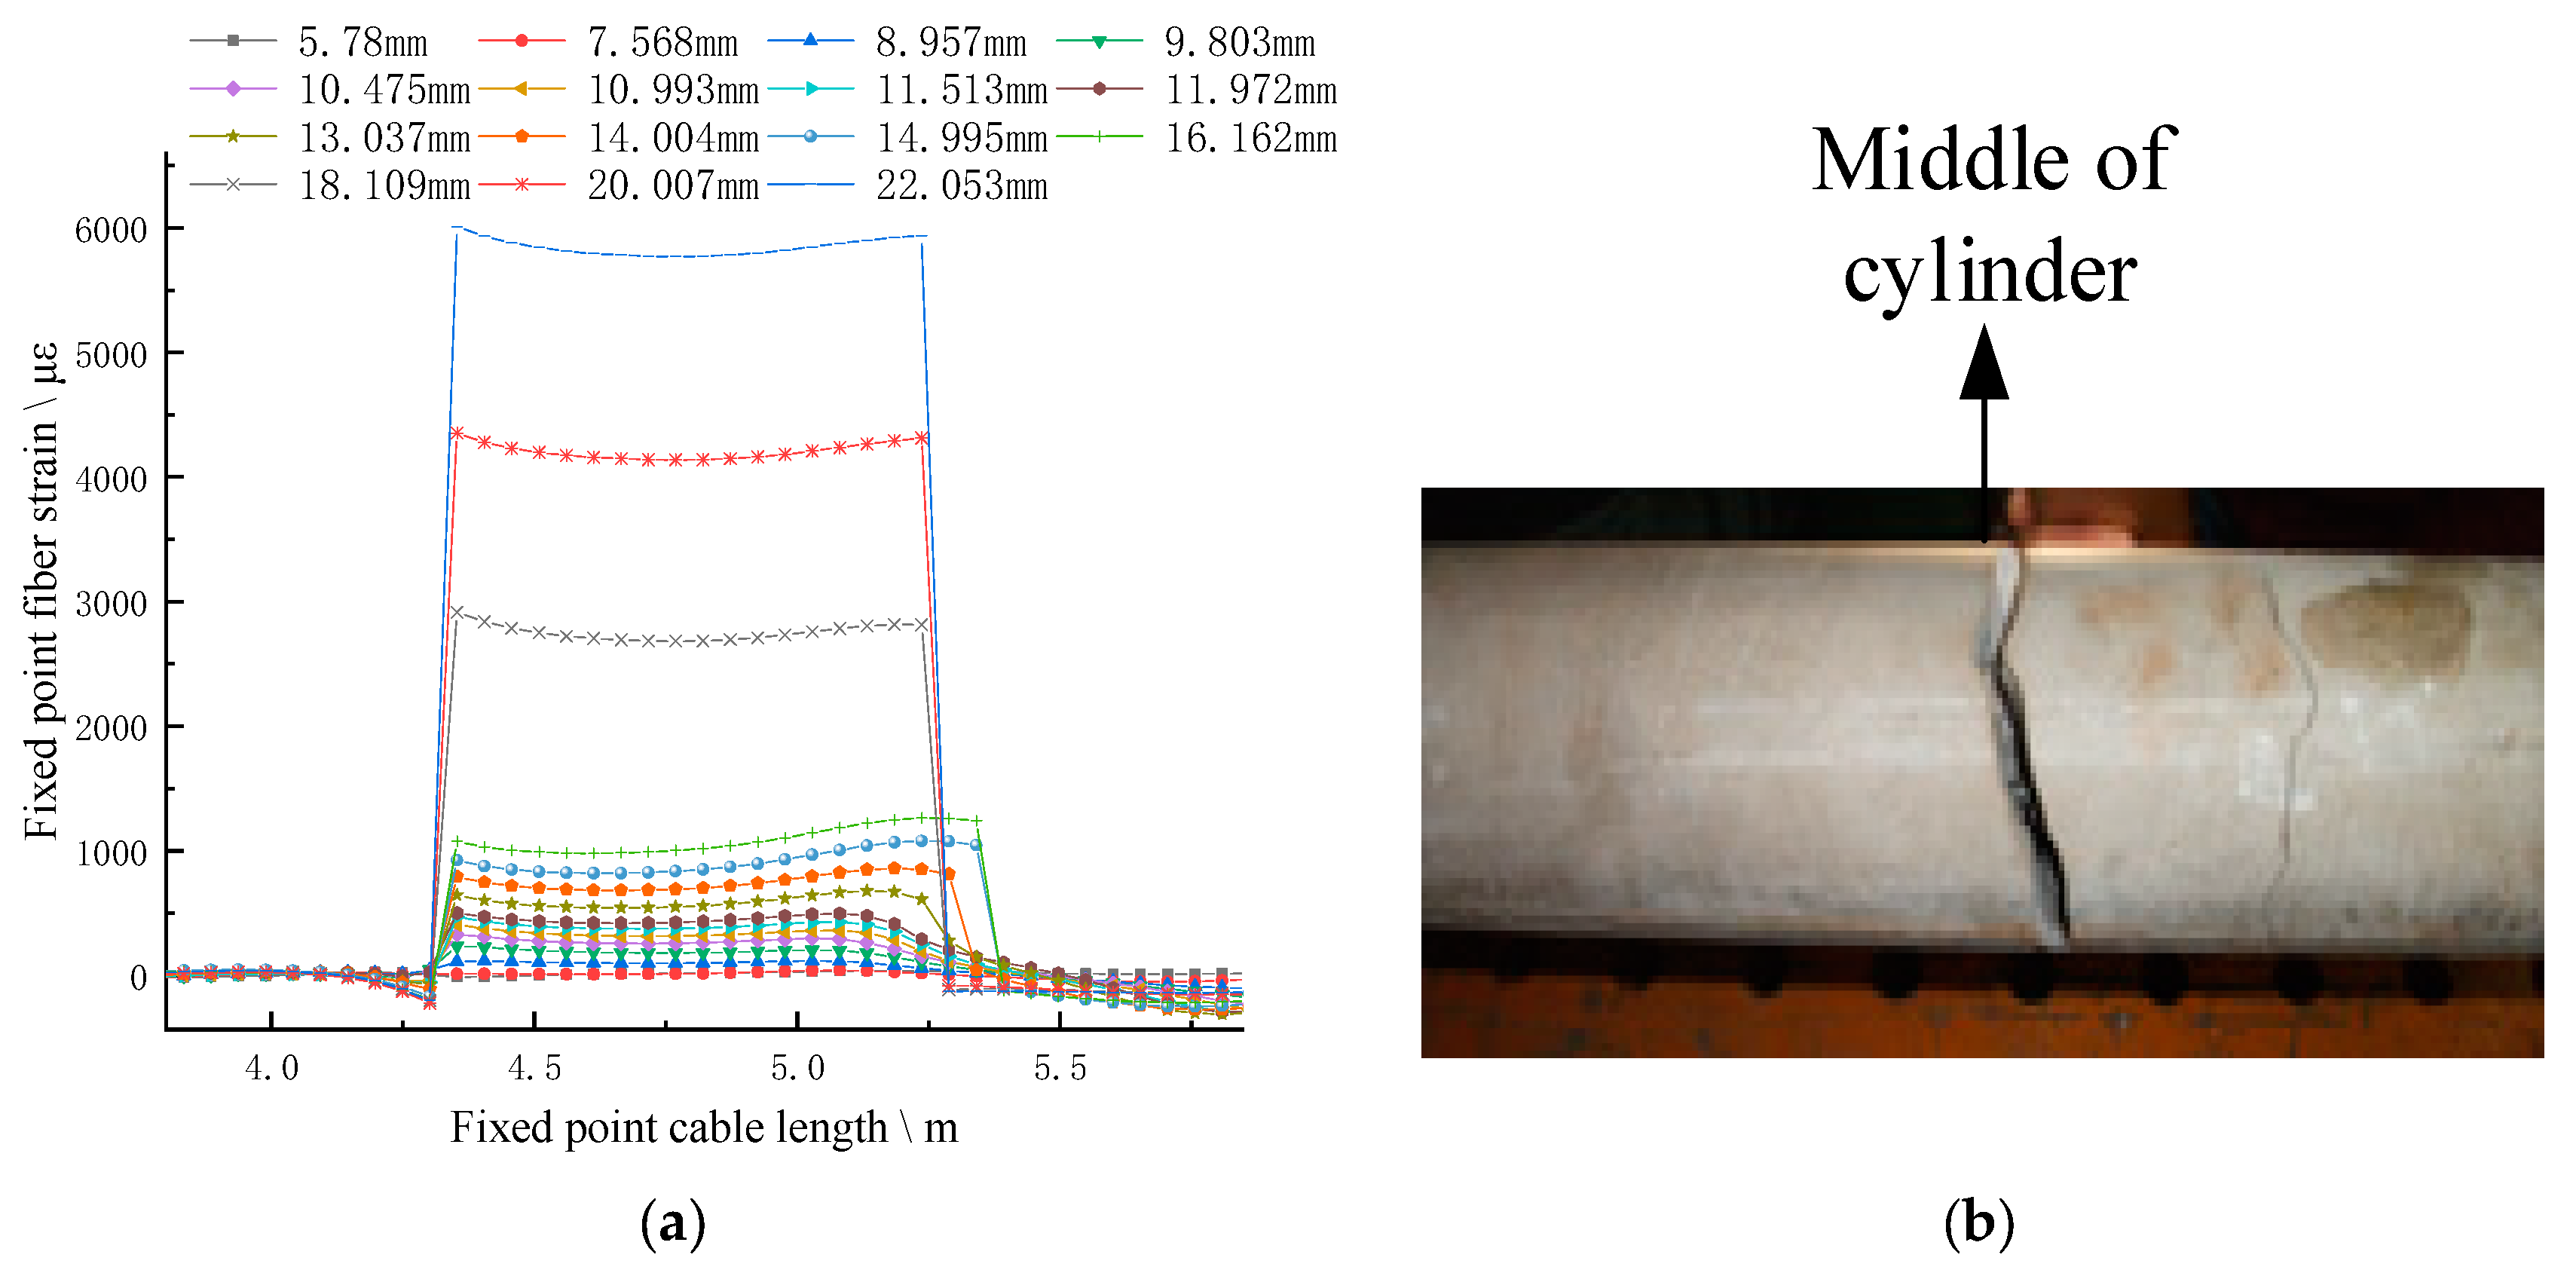
3.1.2. Analysis of Experiment Results
3.2. Strain Transfer Performance Test of SS Optical Fiber
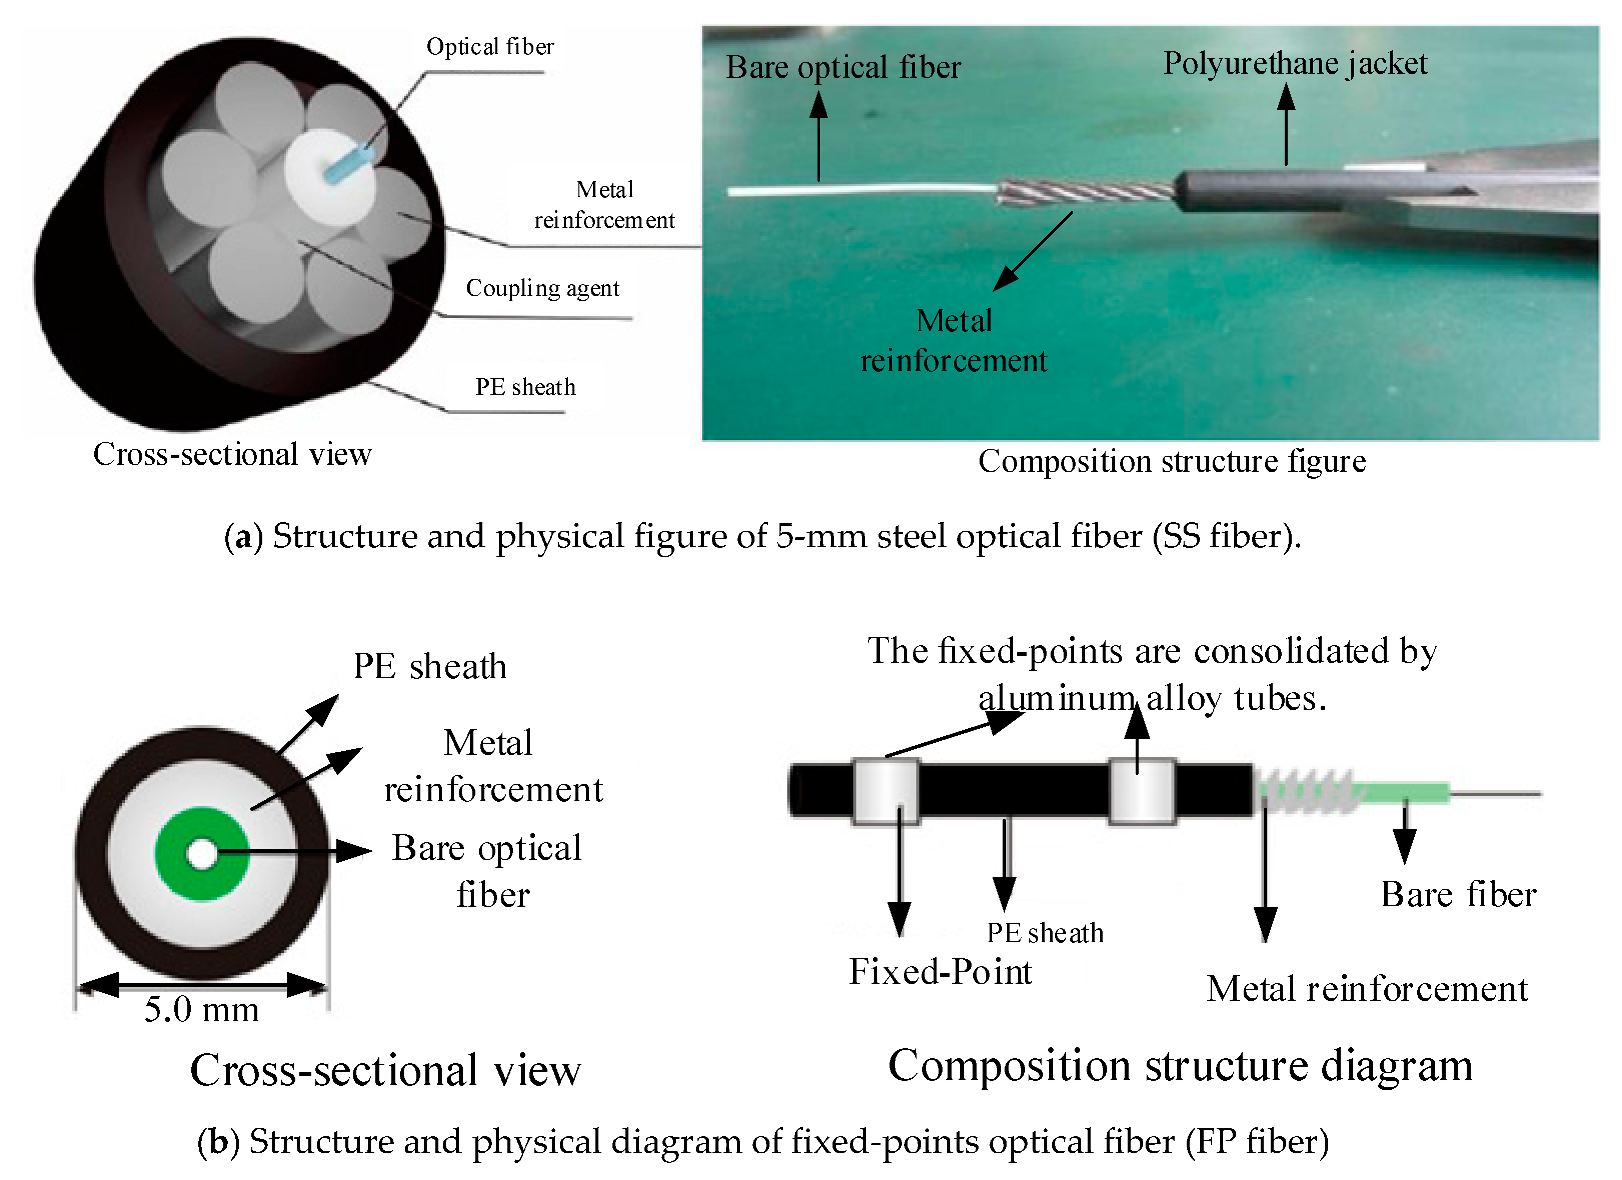
3.2.1. The Introduction of the SS Fiber and FP Fiber
3.2.2. Calibration of SS Fiber Strain Coefficient
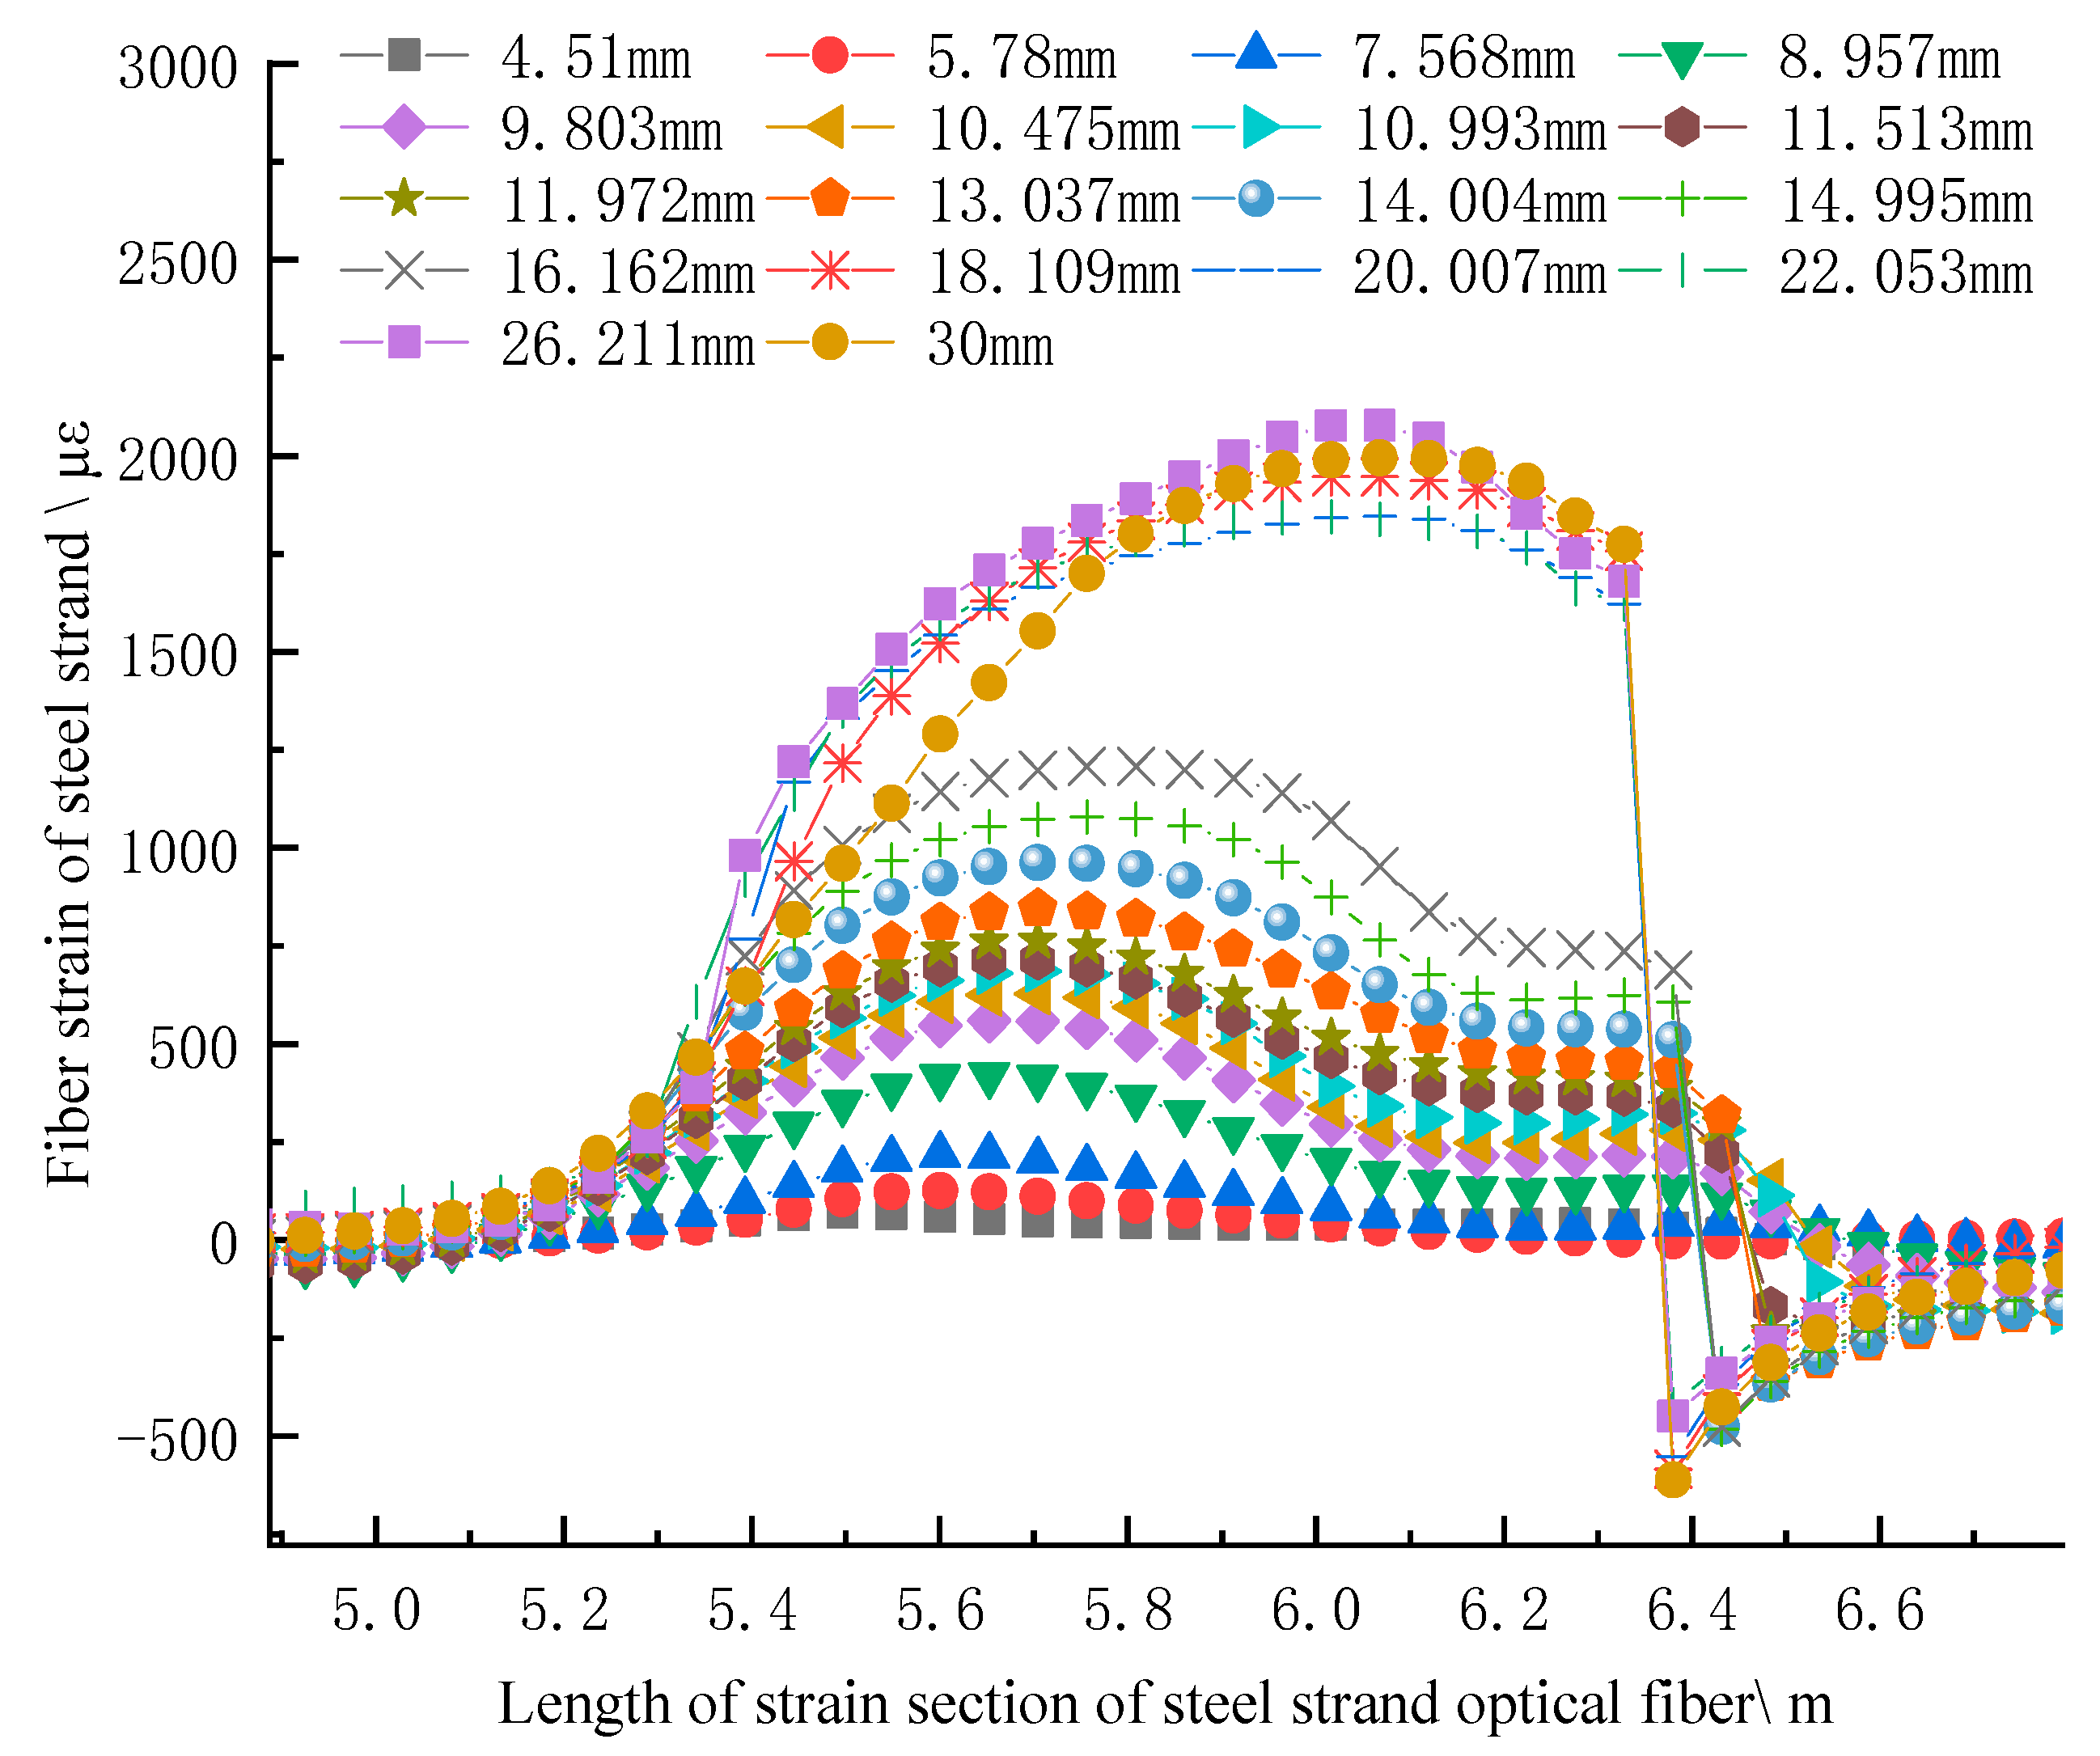
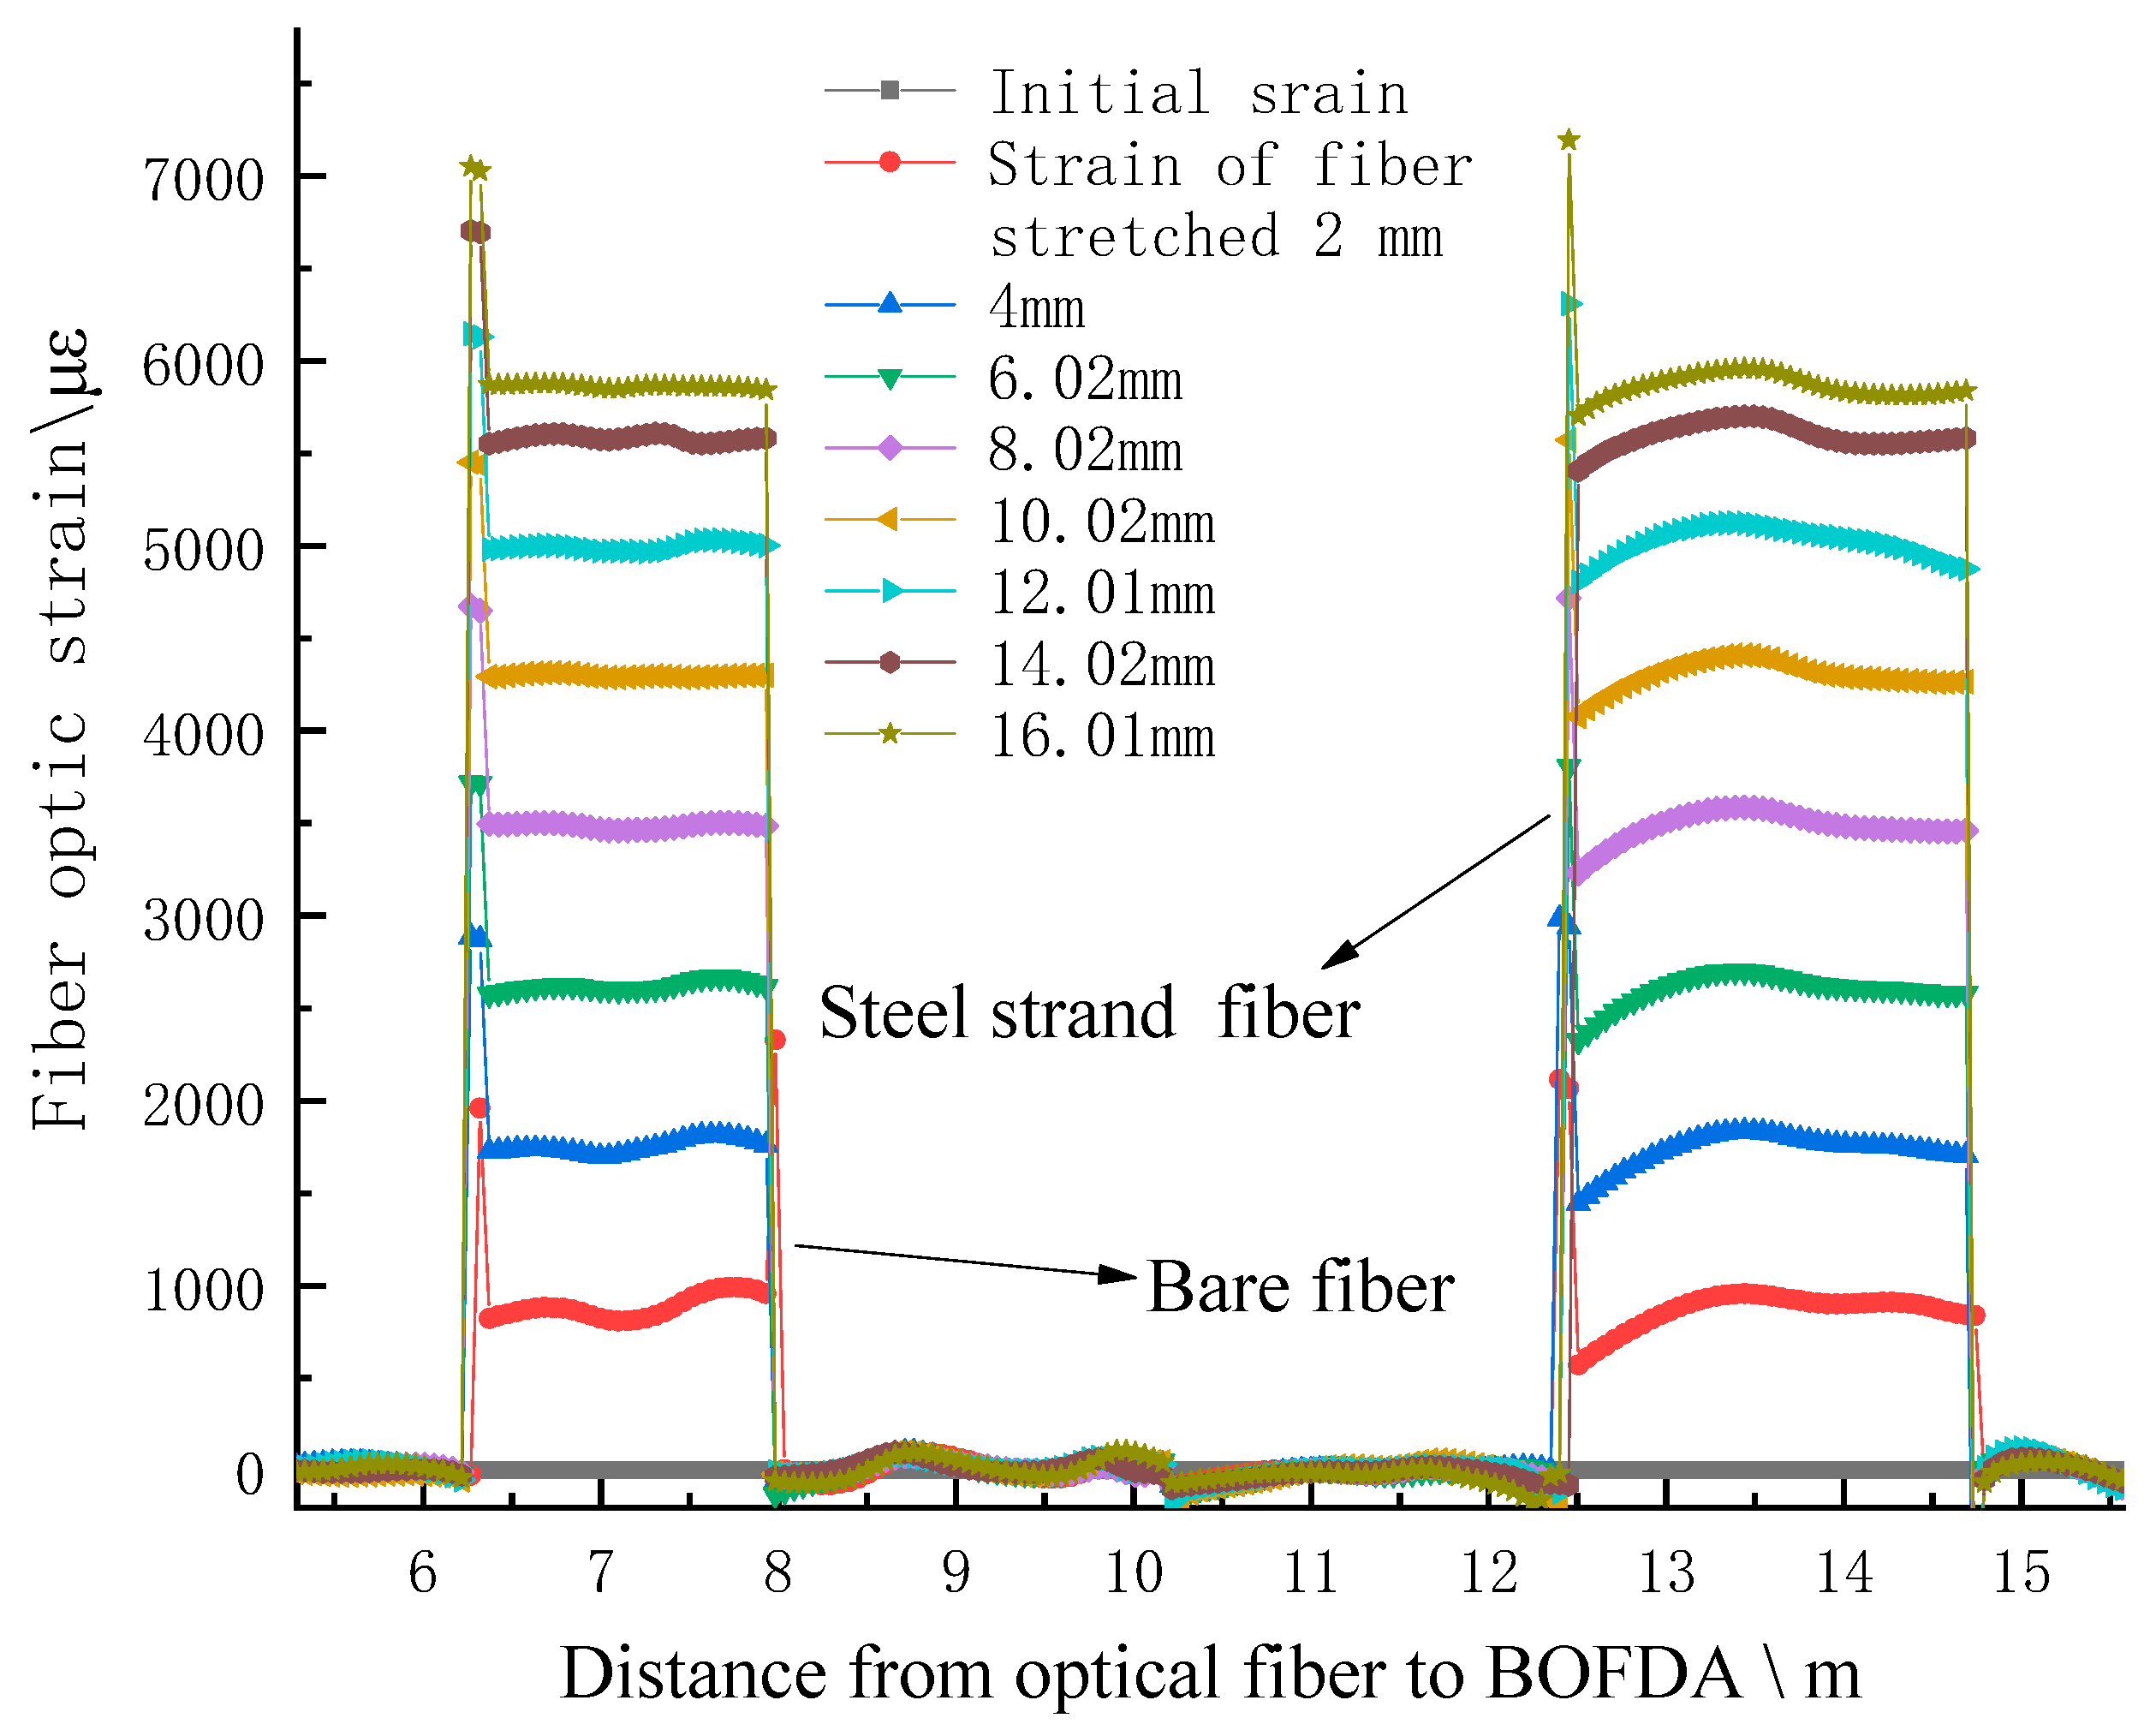
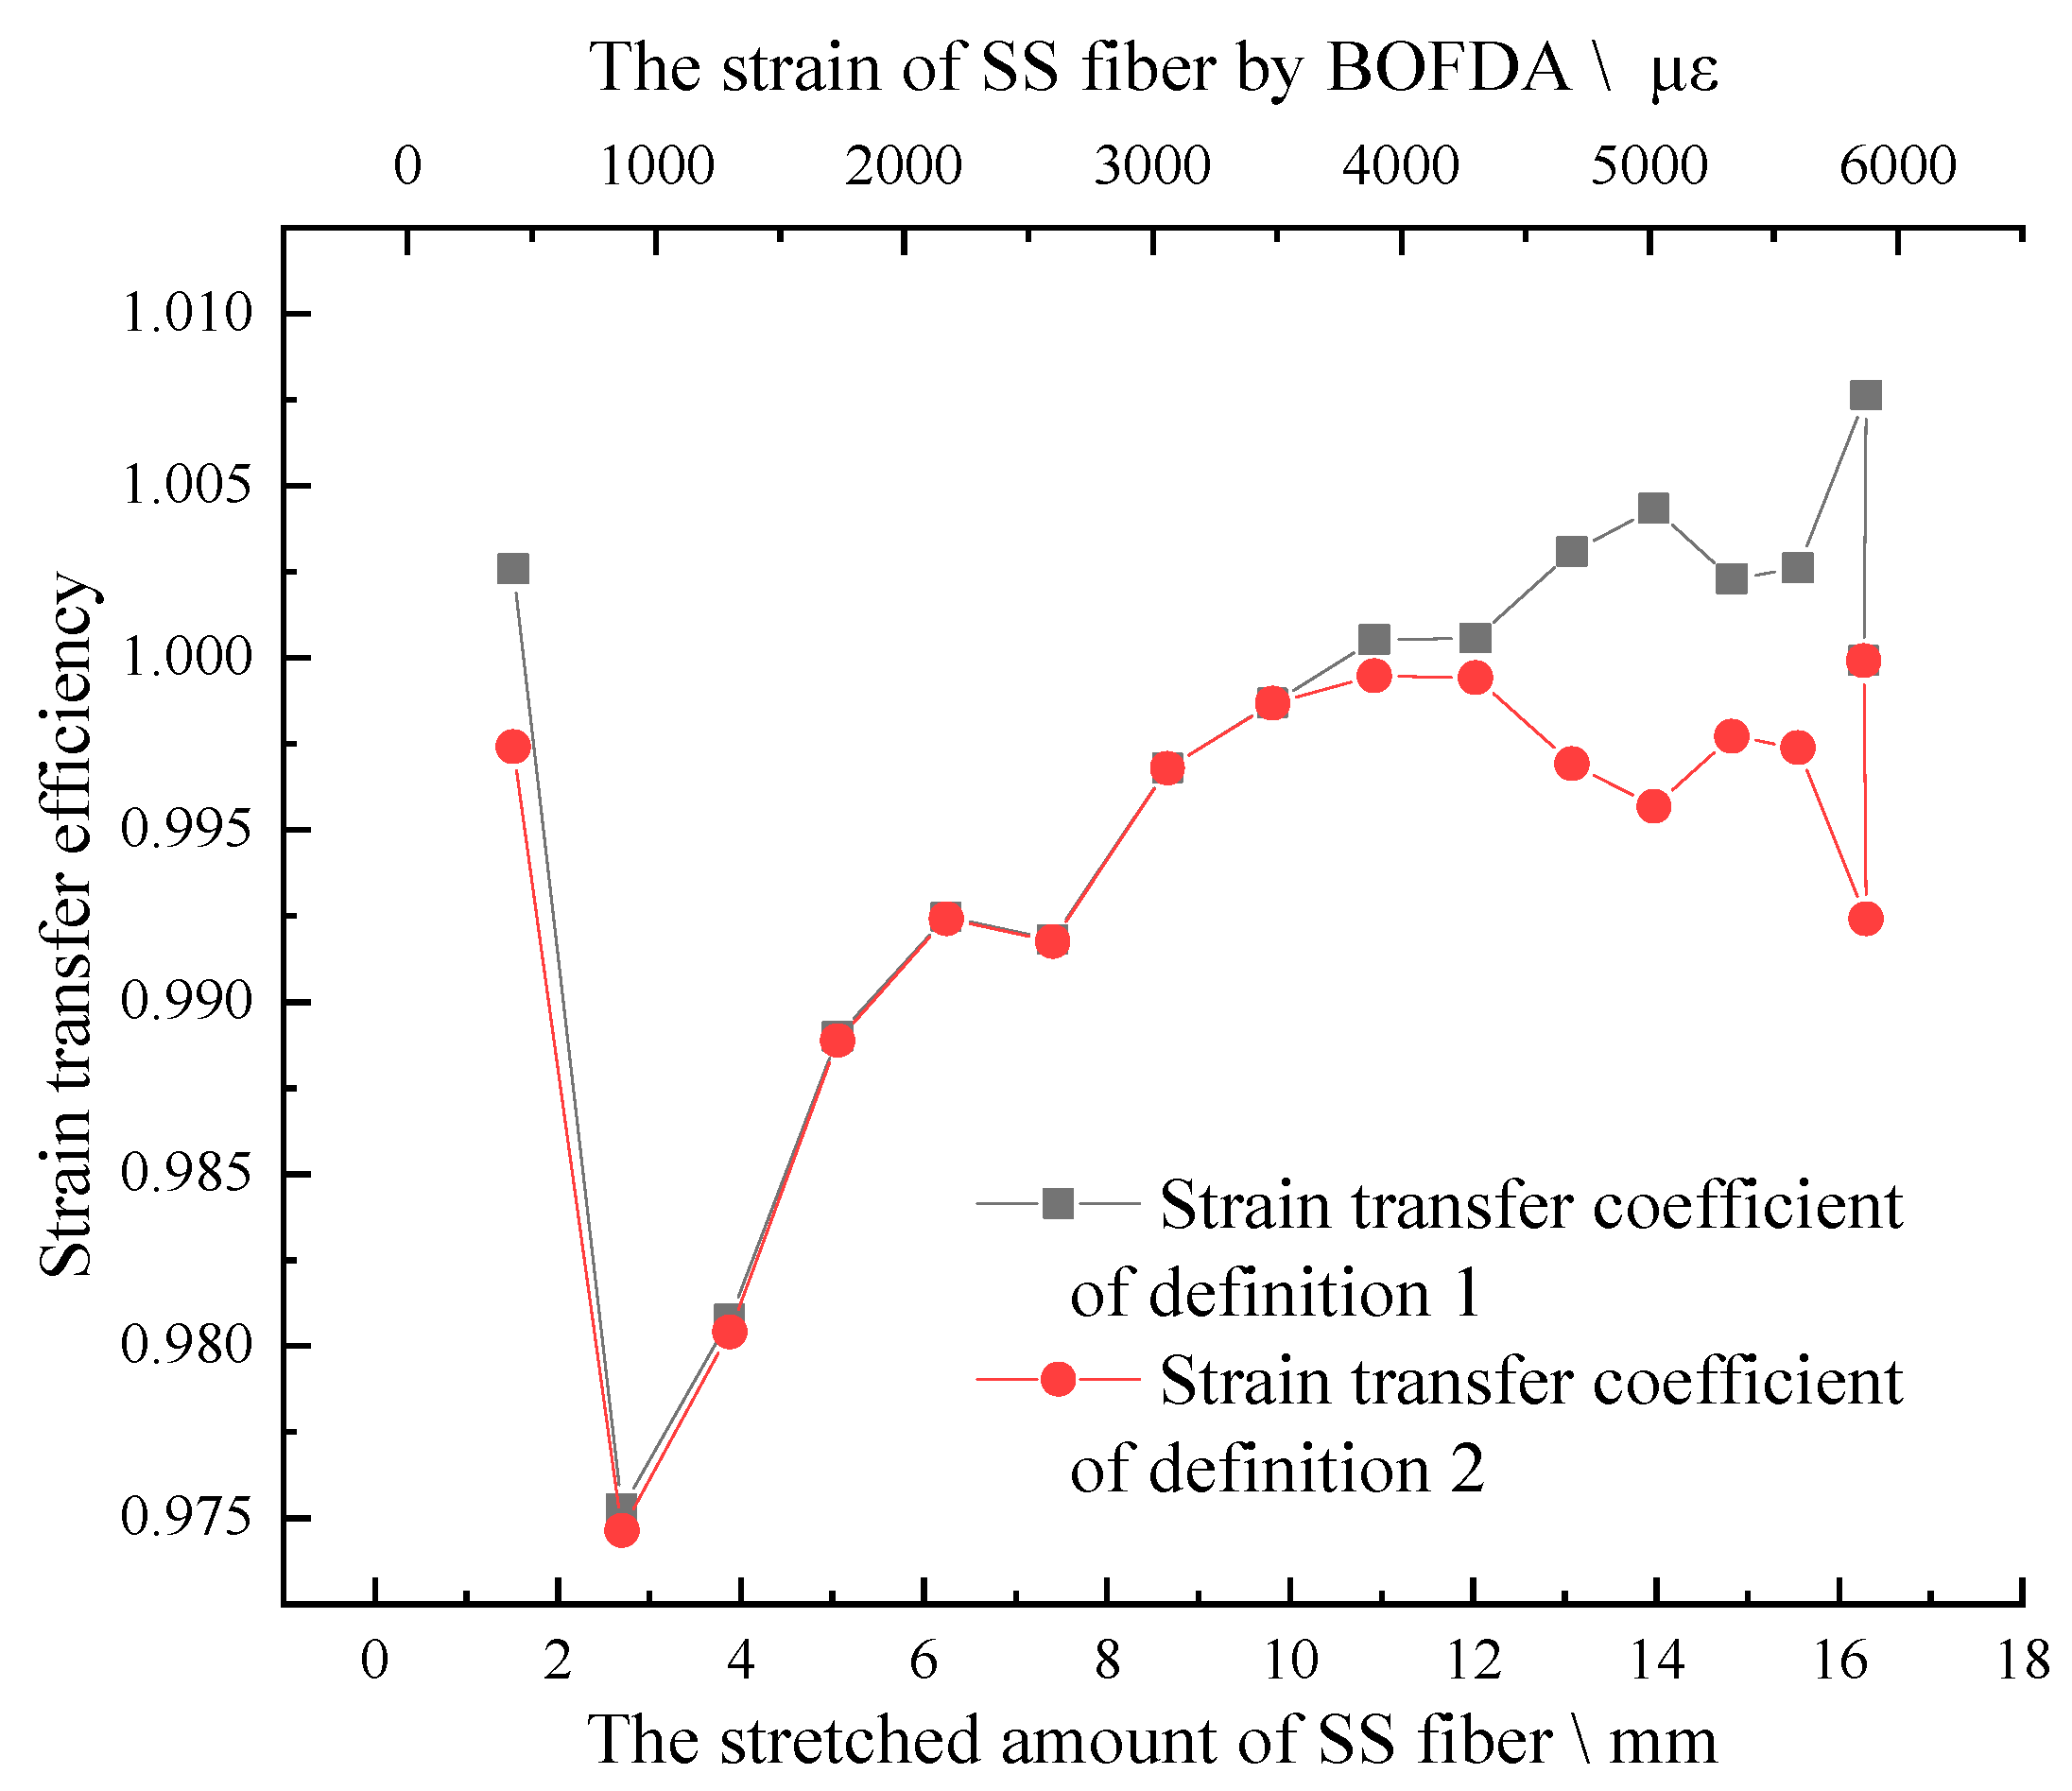
3.2.3. Experimental on Strain Transfer Performance of SS Fiber
3.3. Introduction to the Instruments Selected for Field Experiment
4. Distributed Optical Fiber Monitoring of Roof Strata Deformation
4.1. The Working Face and Roof Conditions of Field Experiment
4.2. Layout of Optical Fiber and Construction of Monitoring System in Field Test
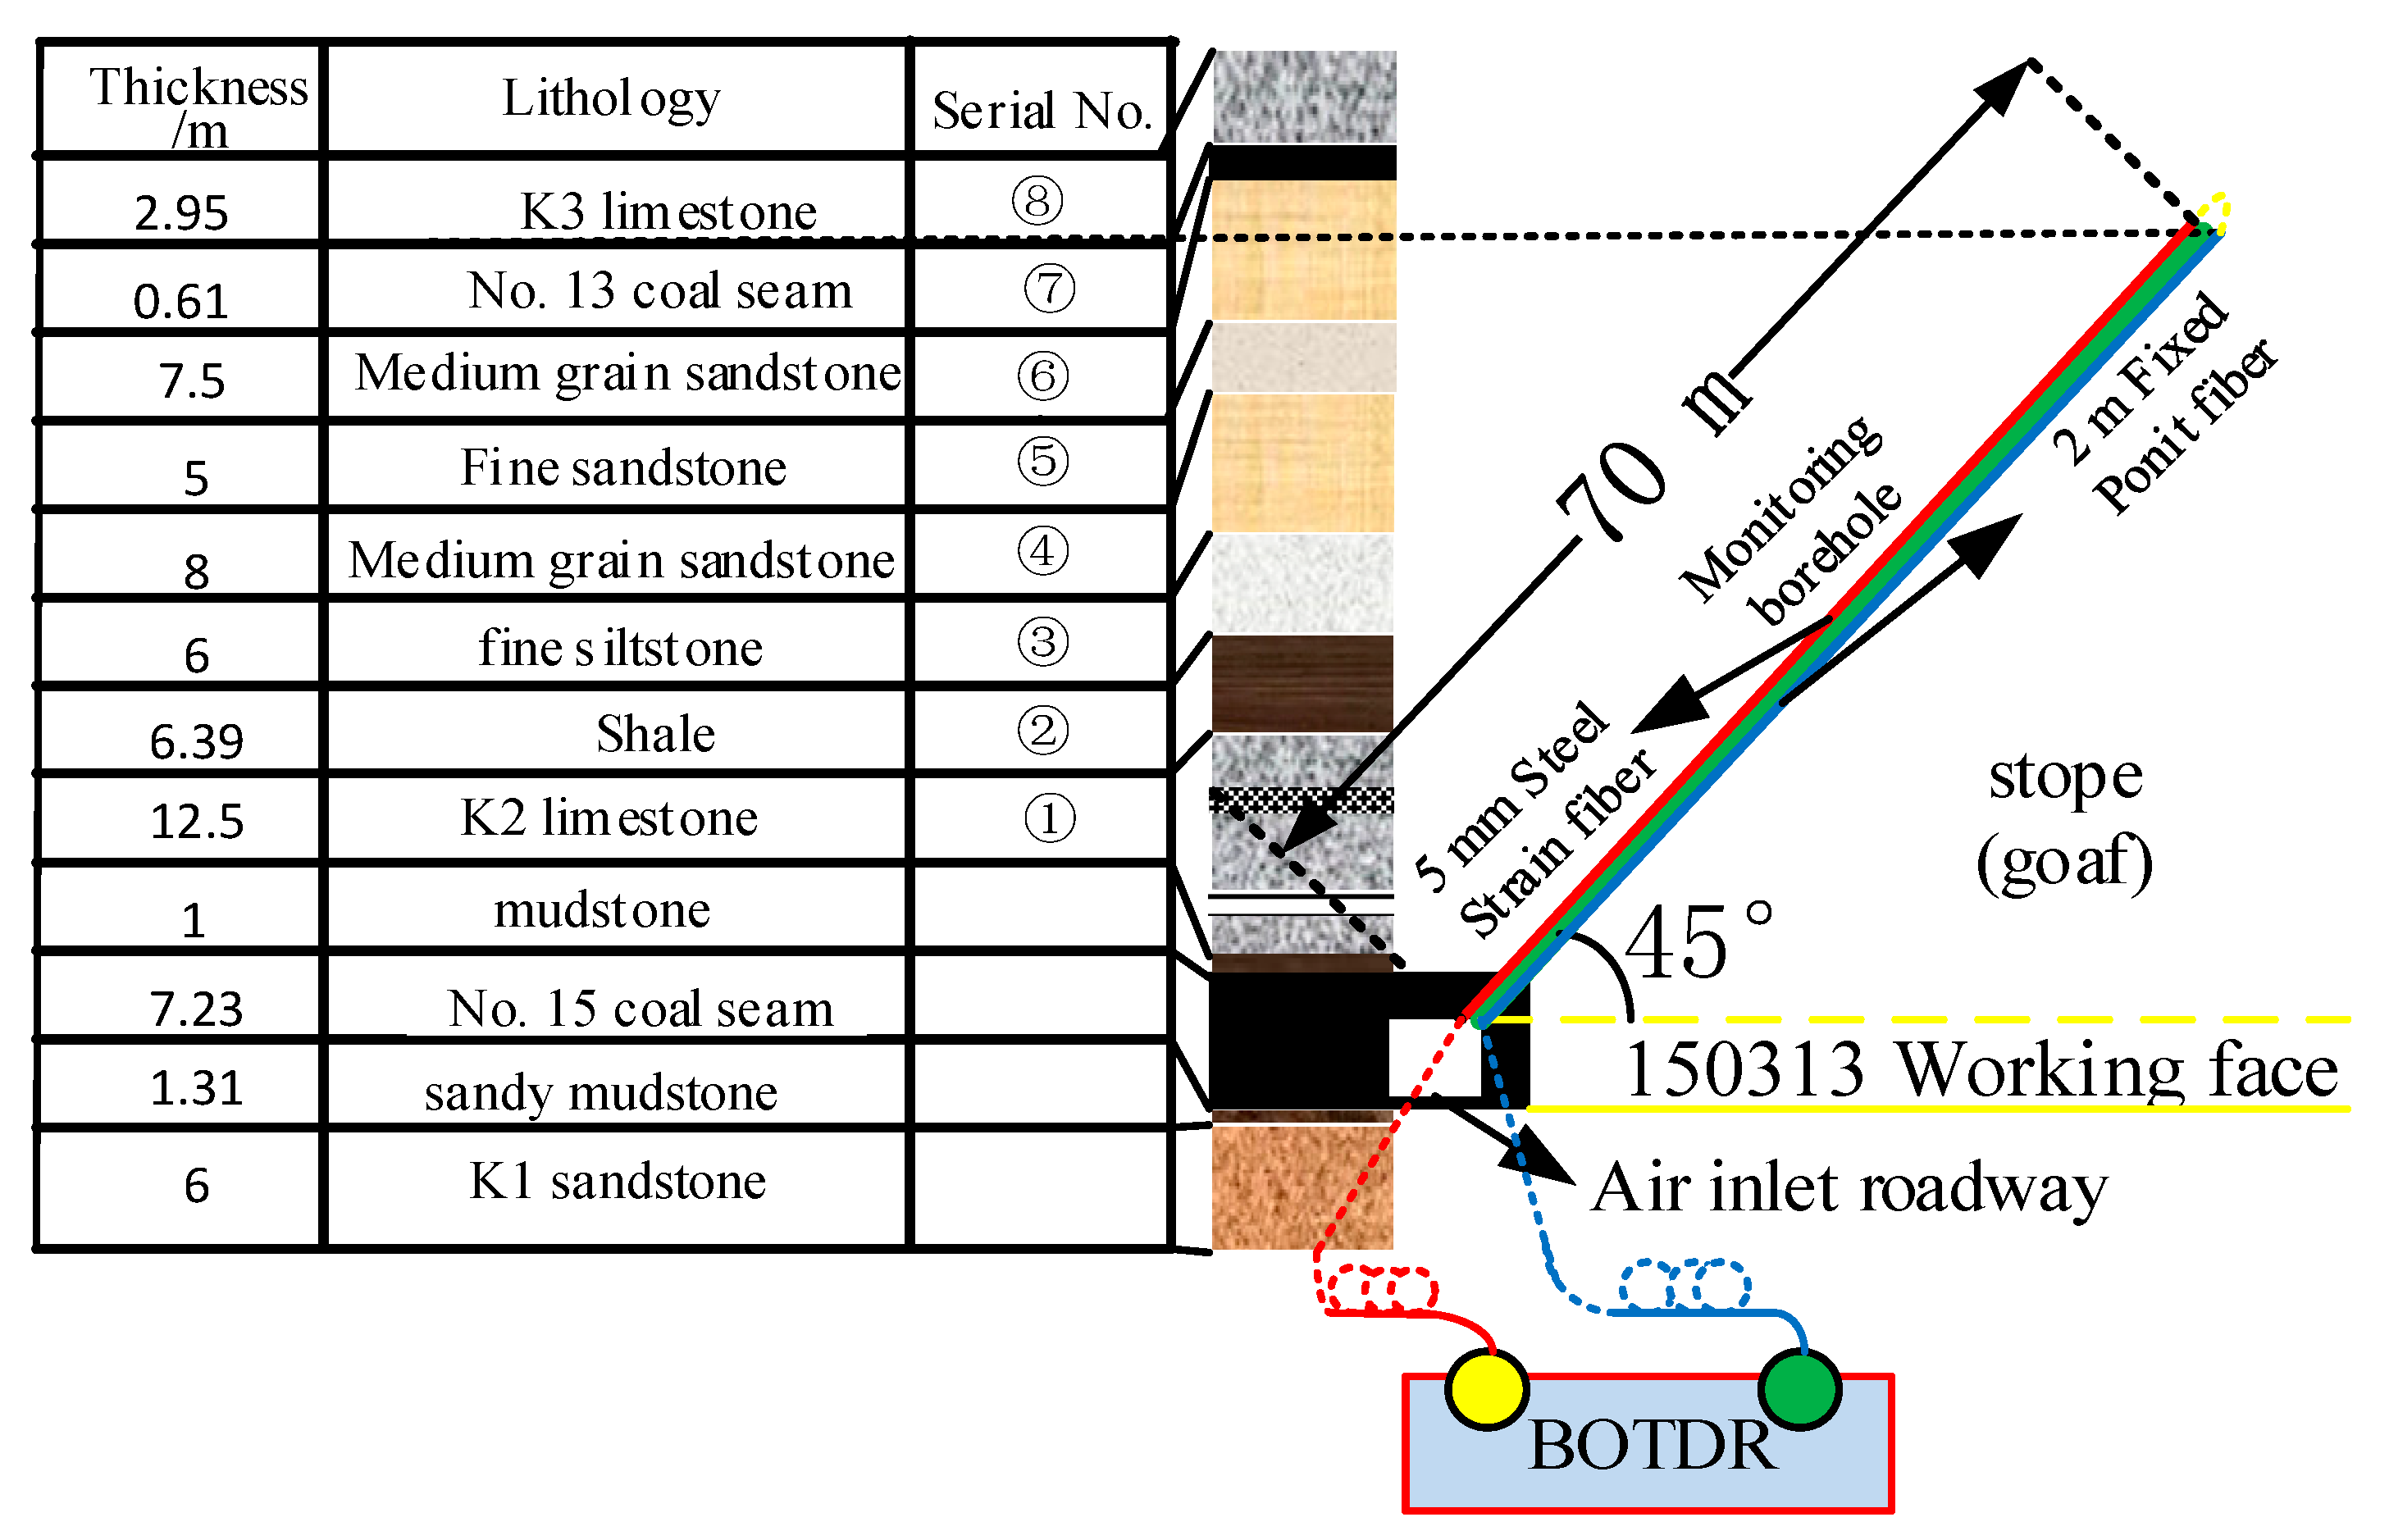
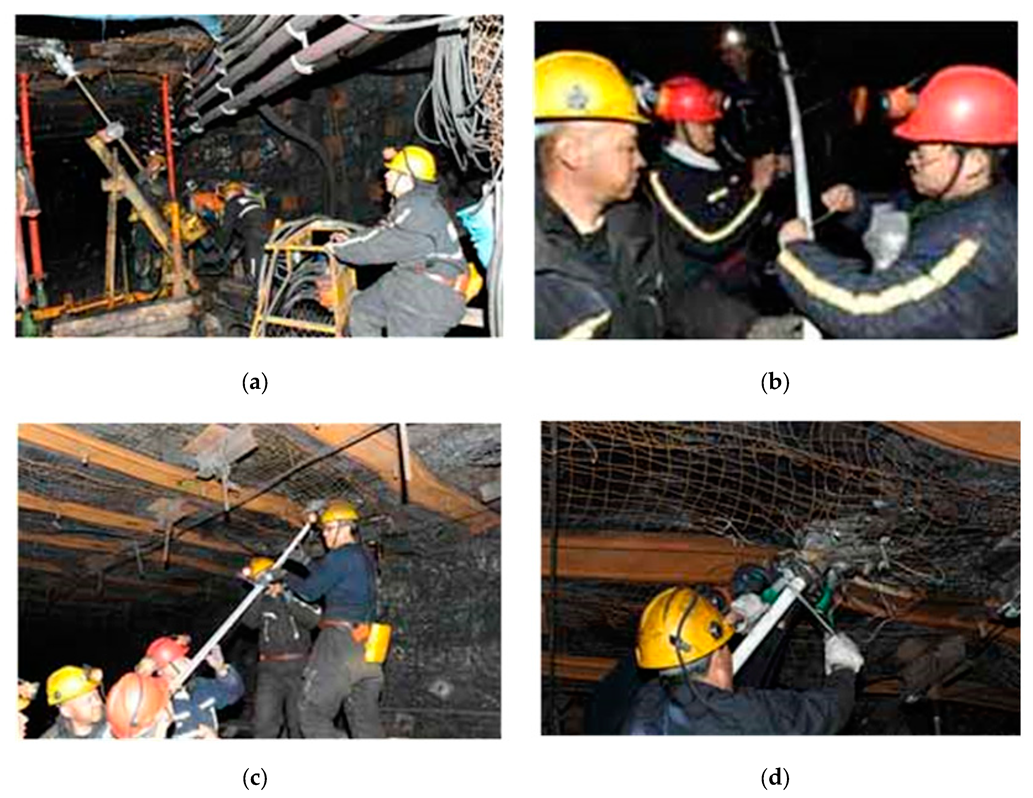
- A 70-m long drill hole of Φ 60 mm was set at the top angle of the coal wall near the working face between the 698 rows and 697 rows’ W steel strip of the air intake roadway of the 150,313 working face. As shown in Figure 19a, the elevation angle of the drill hole is 45°, which is perpendicular to the advancing direction of the working face.
- Binding SS and FP fibers on the outer wall of Φ 40 mm PVC pipe to keep the optical fiber straight. At the first end of PVC pipe, SS fiber and FP fiber are welded together. The welding position is protected by a hard conical shell, and FP optical fiber is bound on the other side of PVC pipe, as shown in Figure 19b.
- After cleaning the inner wall of the borehole with drill pipe, PVC pipe bound with two kinds of optical fibers was inserted into the borehole, as shown in Figure 19c.
- After all PVC pipes with fiber are put into the drilling hole, a special stopper is used to block the drilling hole to prevent PVC pipes from sliding out. The concrete slurry is pumped into the borehole until the slurry flows out of the PVC pipe, as shown in Figure 19d.
- The optical fiber path was examined throughout the construction. After grouting and sealing, the sensing optical fiber was properly placed in a safe position. It is fused to the communication optical fiber in the roadway, and then the communication optical fiber is arranged to the monitoring location; power distribution center in the main roadway. The configuration of the distributed optical fiber roof deformation monitoring system of the overall BOTDR is shown in Figure 20.
4.3. Field Data Collection
5. Analysis of Sensing Optical Fiber Strain Monitoring Results
5.1. Spatial Position Calibration of Sensing Optical Fiber in Coal Mines Underground
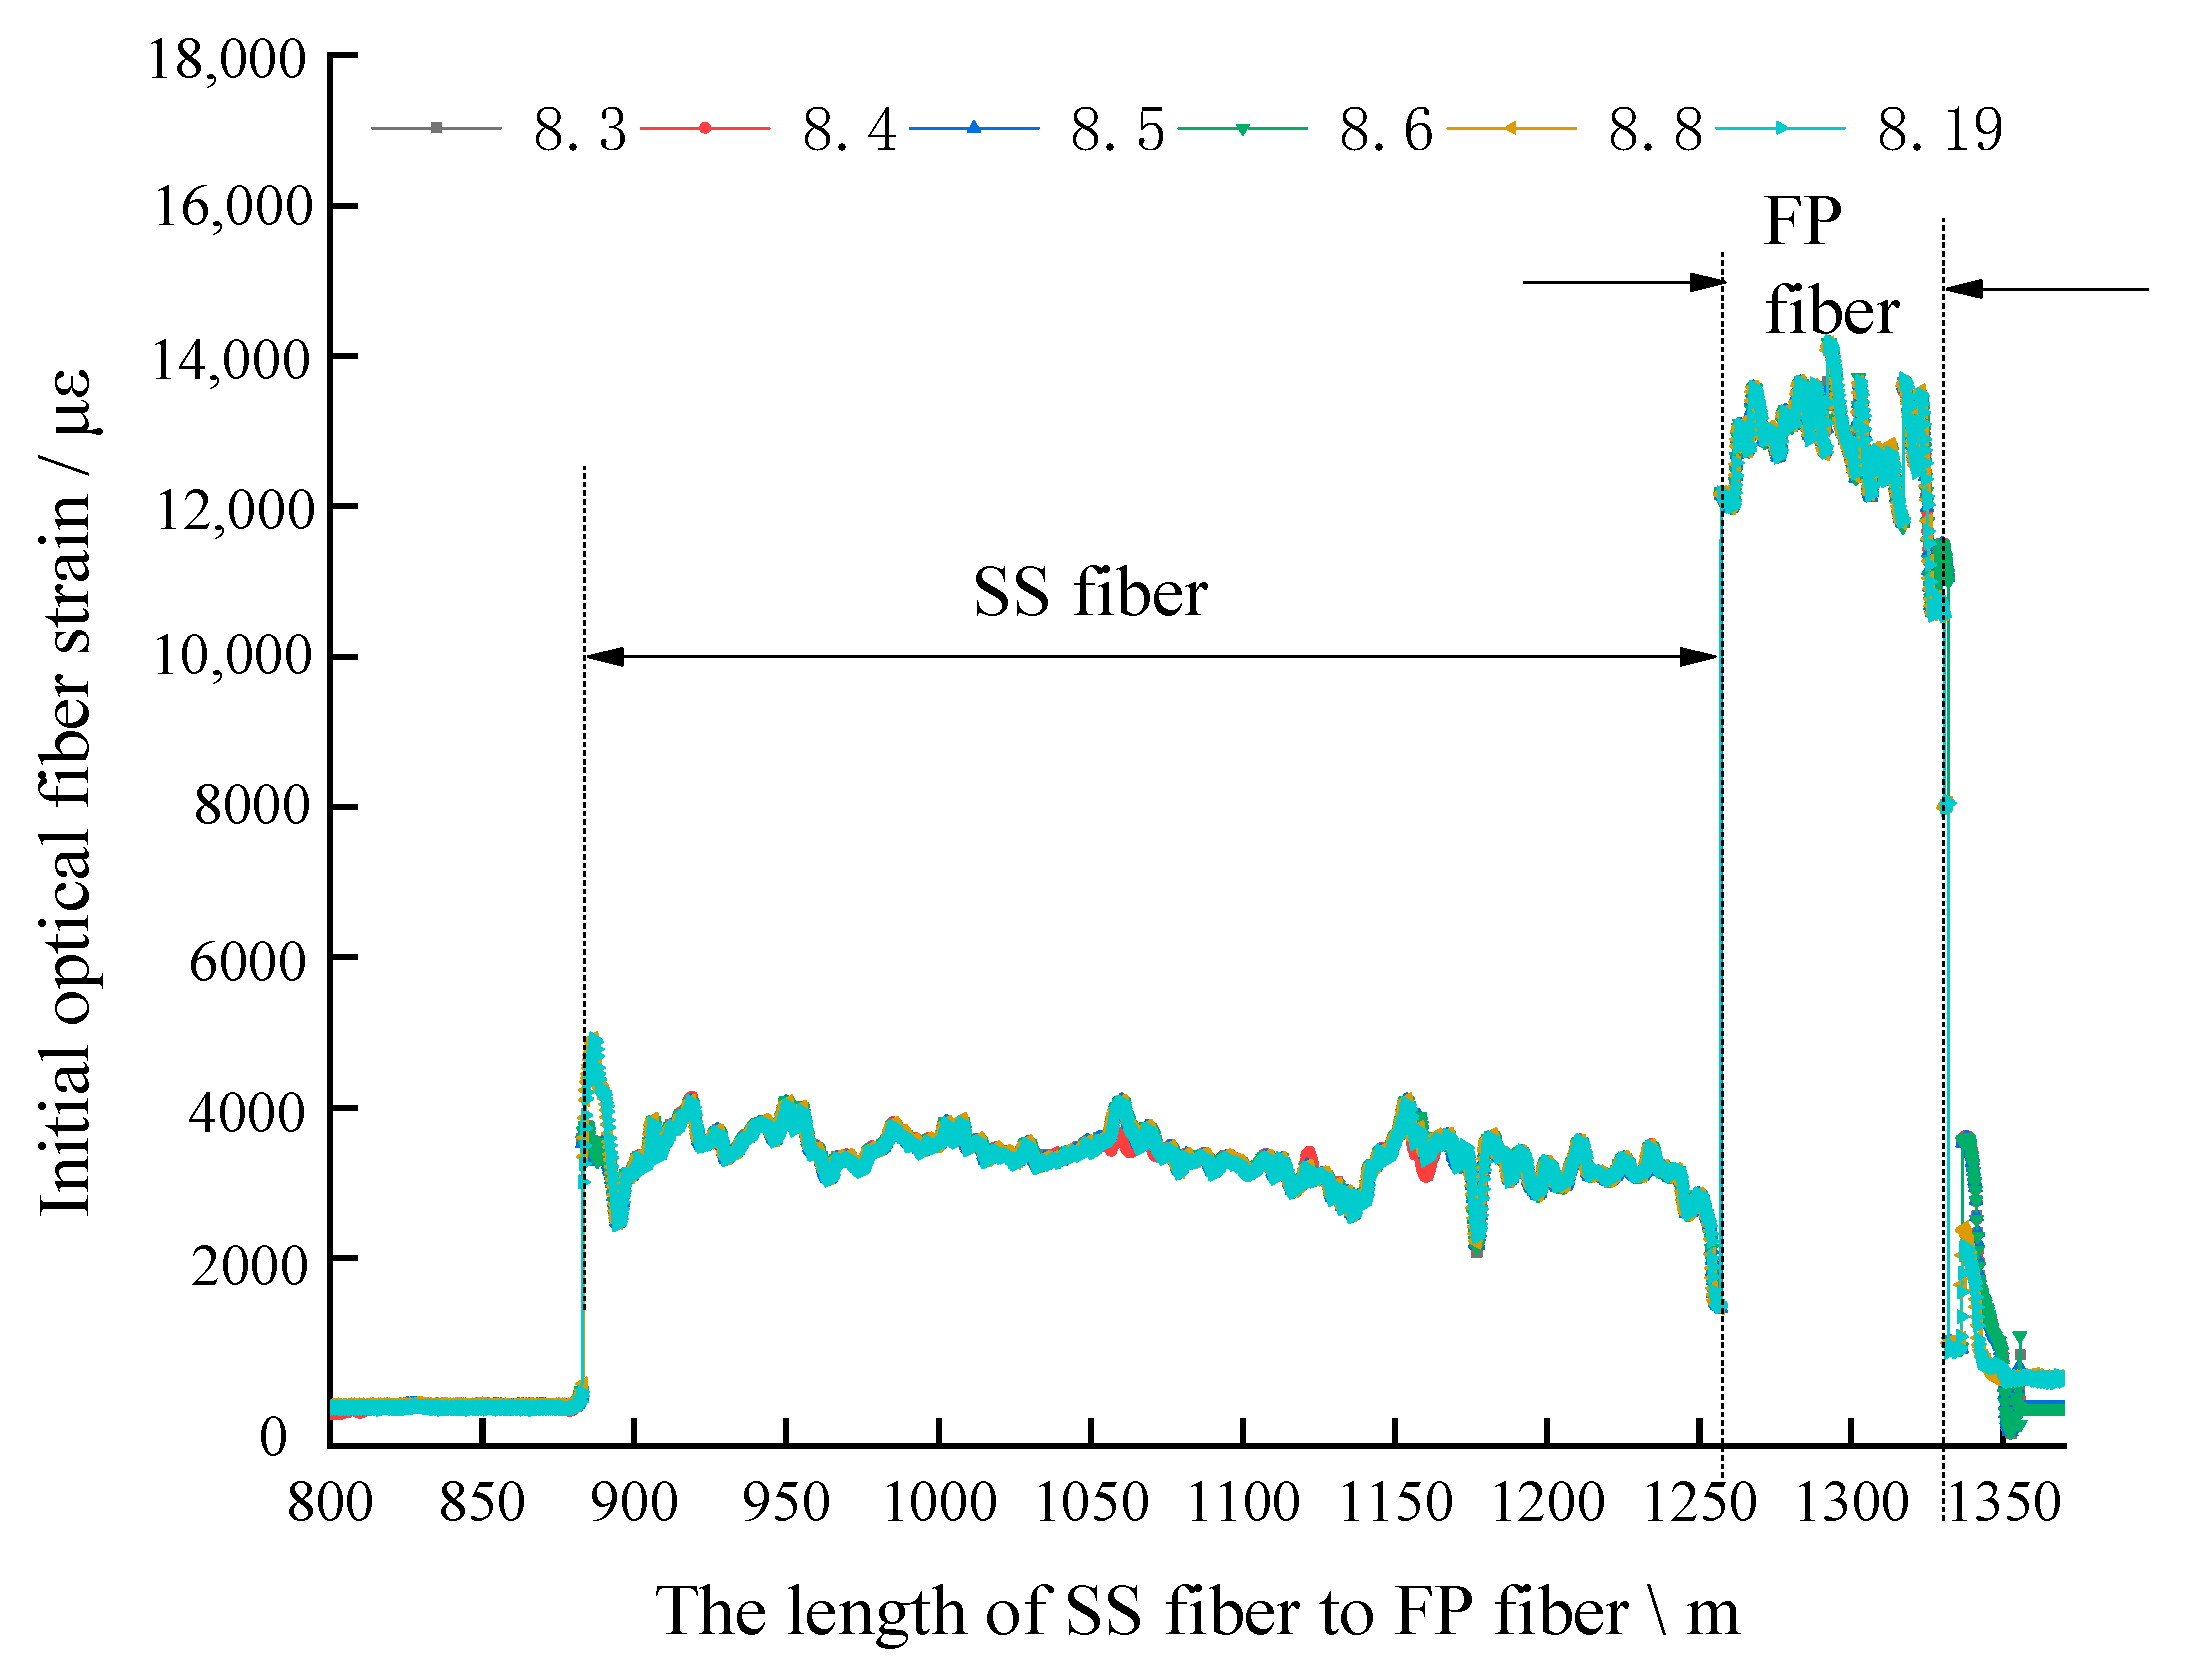
5.1.1. Spatial Position Calibration Using Initial Strain in Field Test
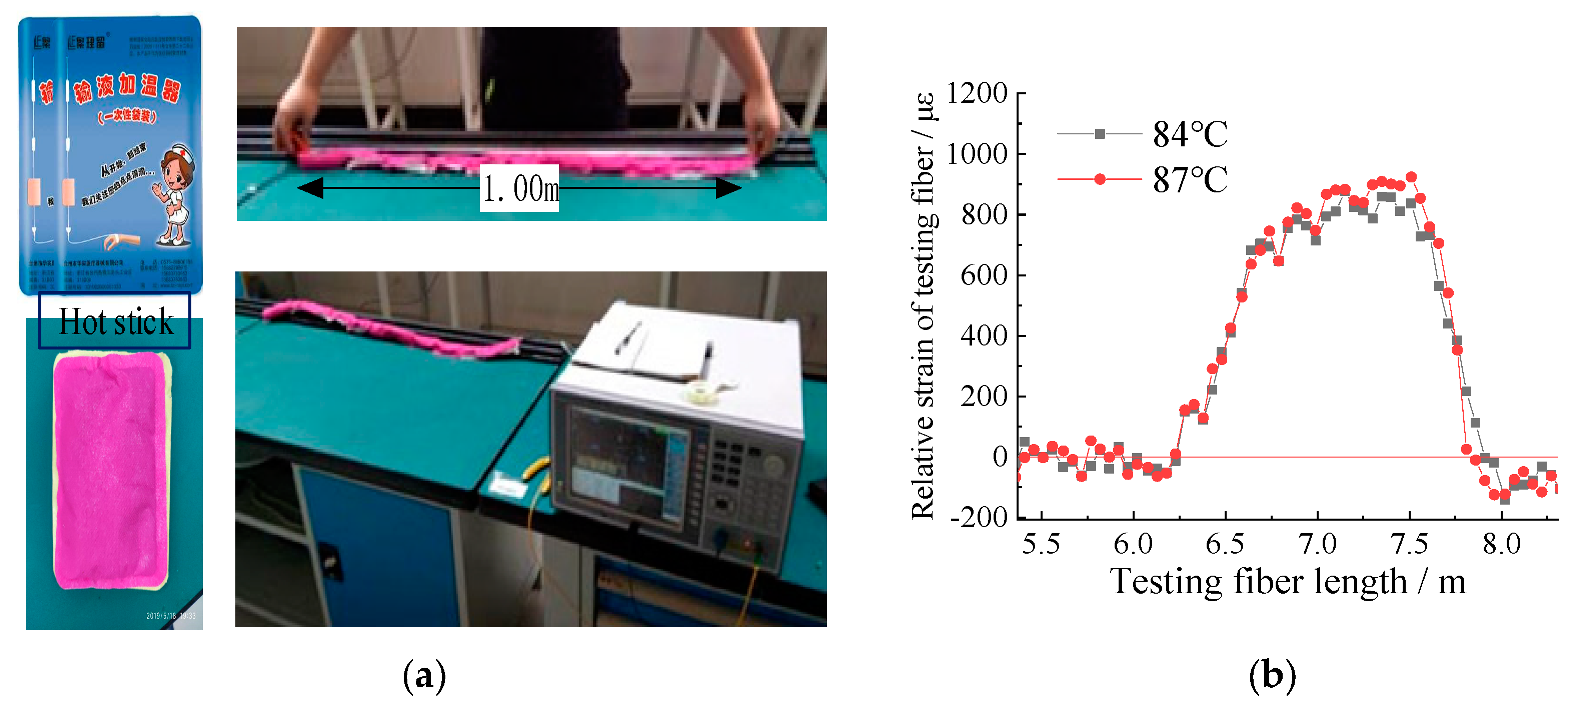
5.1.2. Indoor Test of Spatial Position Calibration by Hot Stick Method
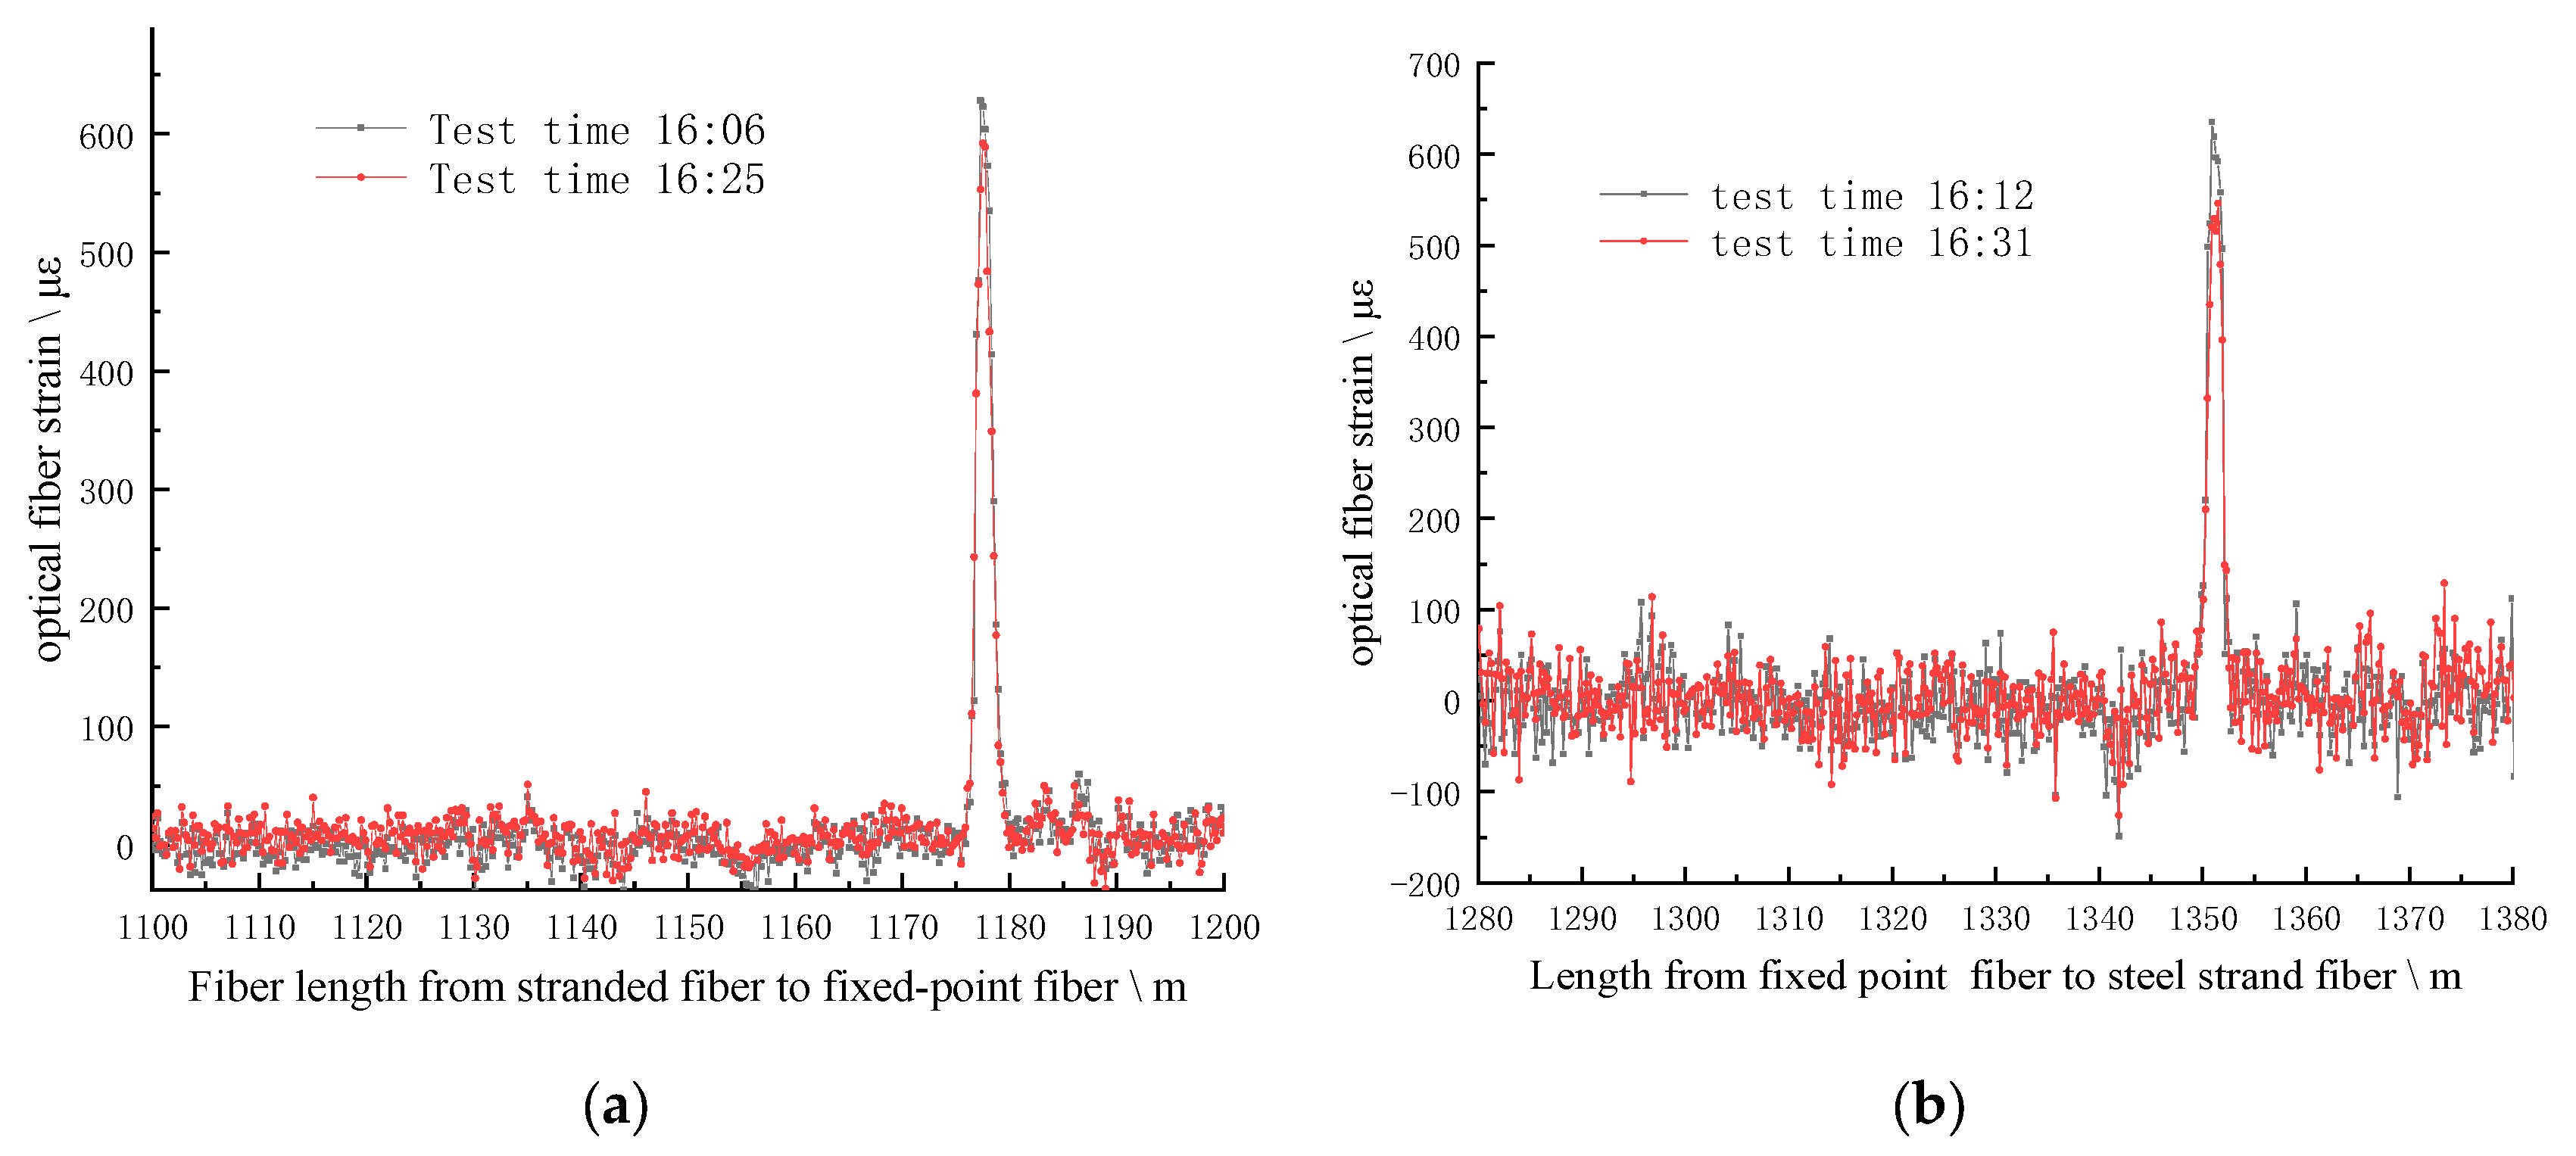
5.1.3. Field Experiment of Optical Fiber Spatial Position Calibration
5.2. Strain Distribution and Variation Characteristics of Optical Fiber in the Borehole
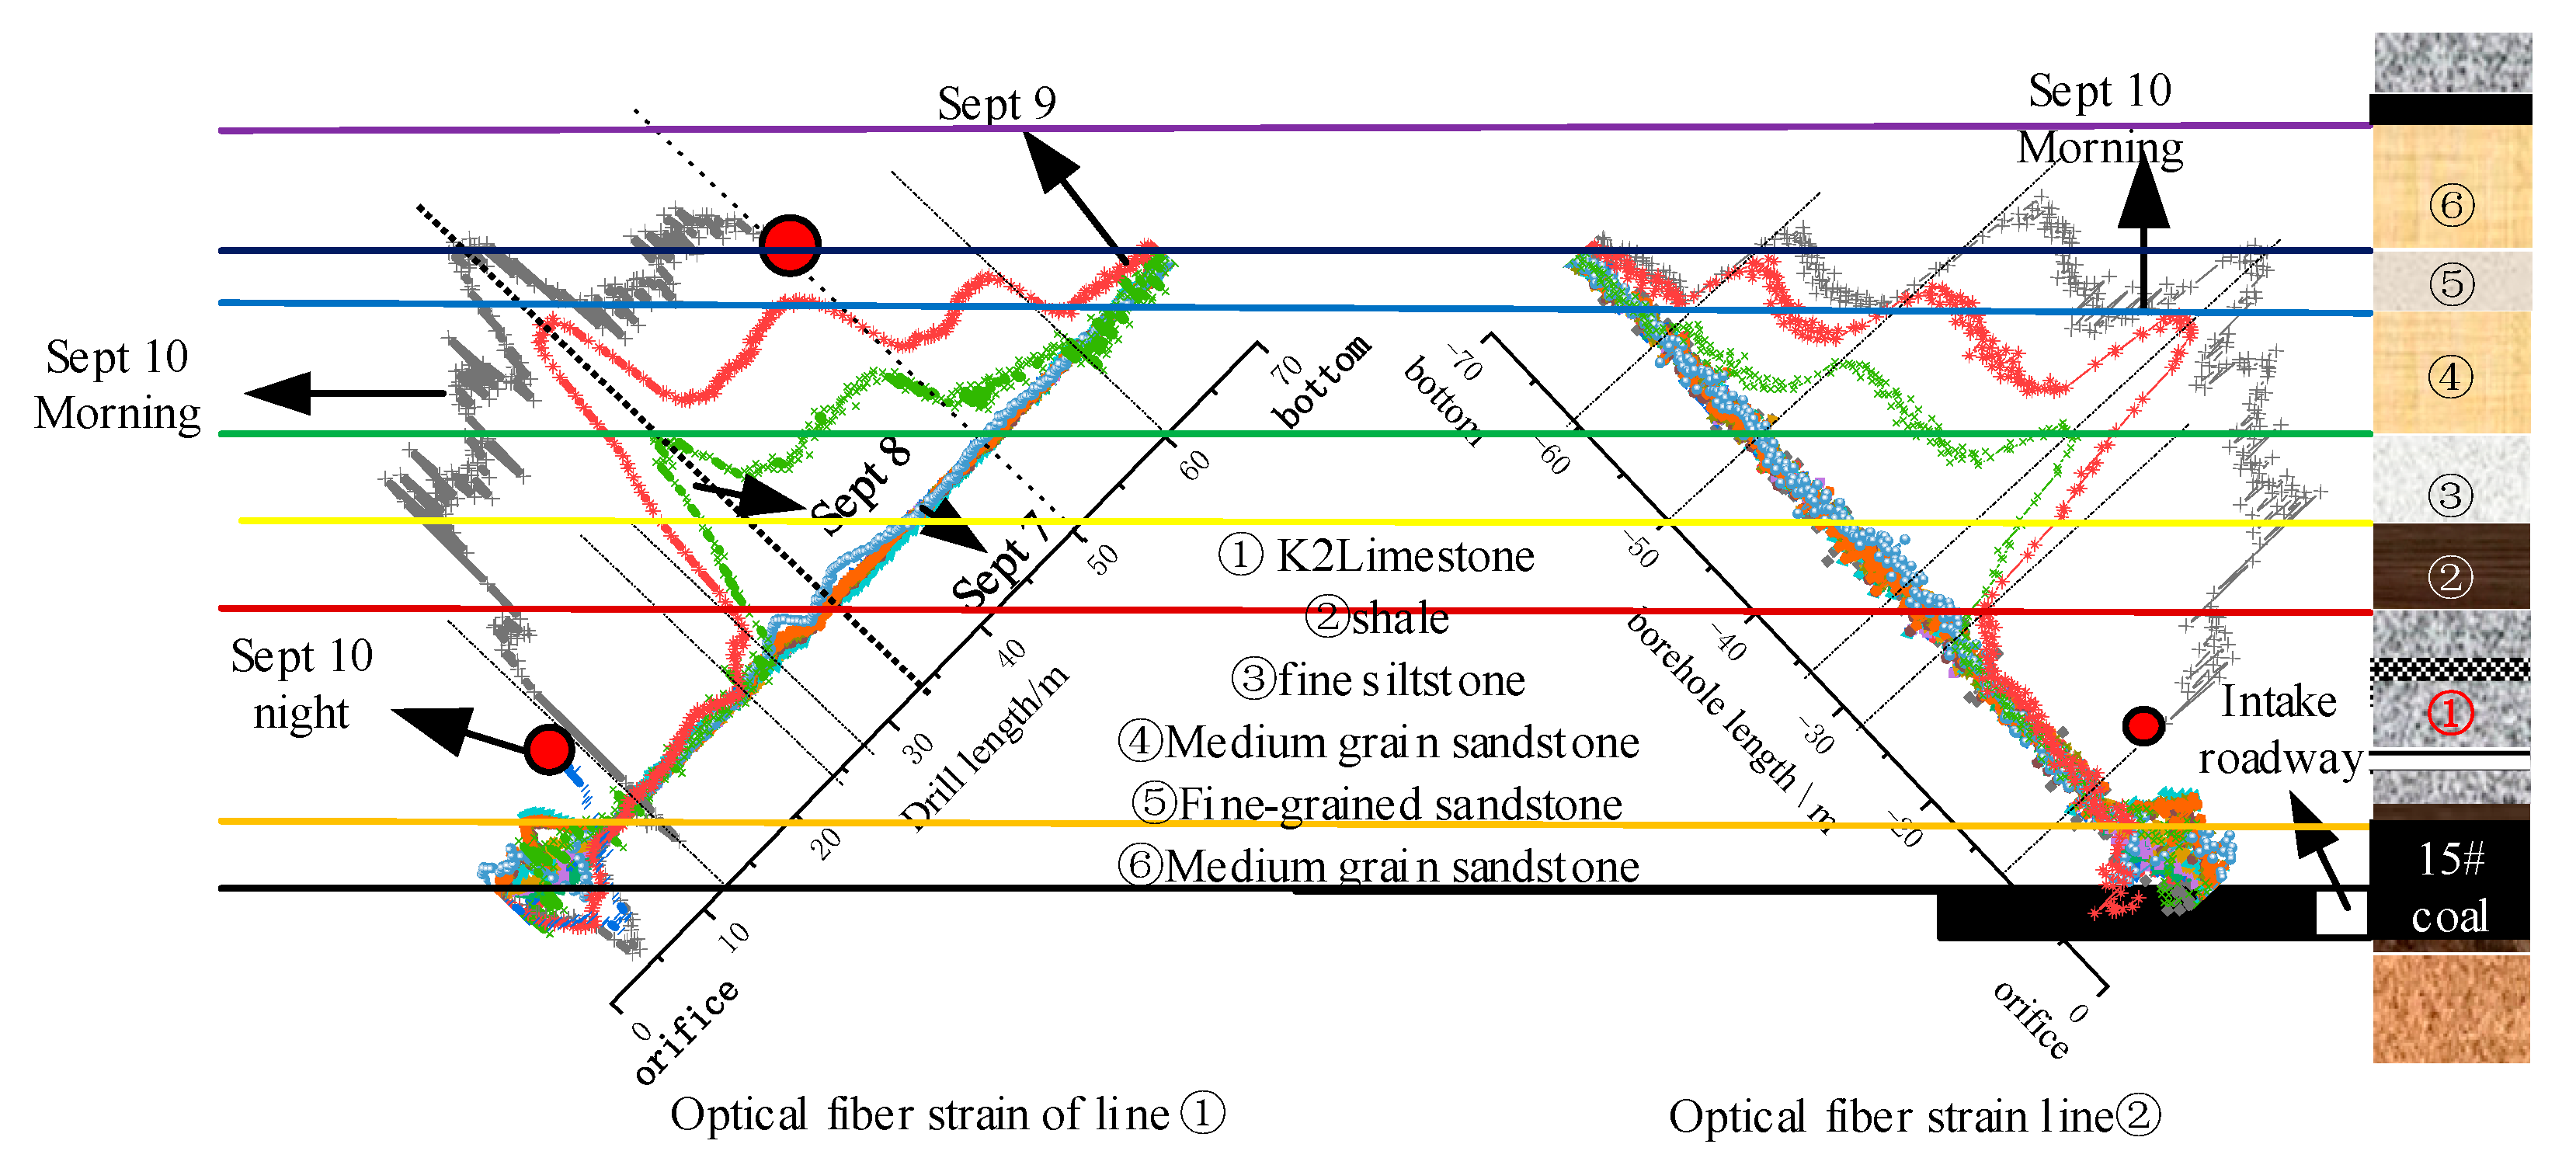
5.2.1. The Fiber Strain Curve in the Direction of Line ① in the Borehole
5.2.2. Strain Change in the Direction of Line ② in the Borehole
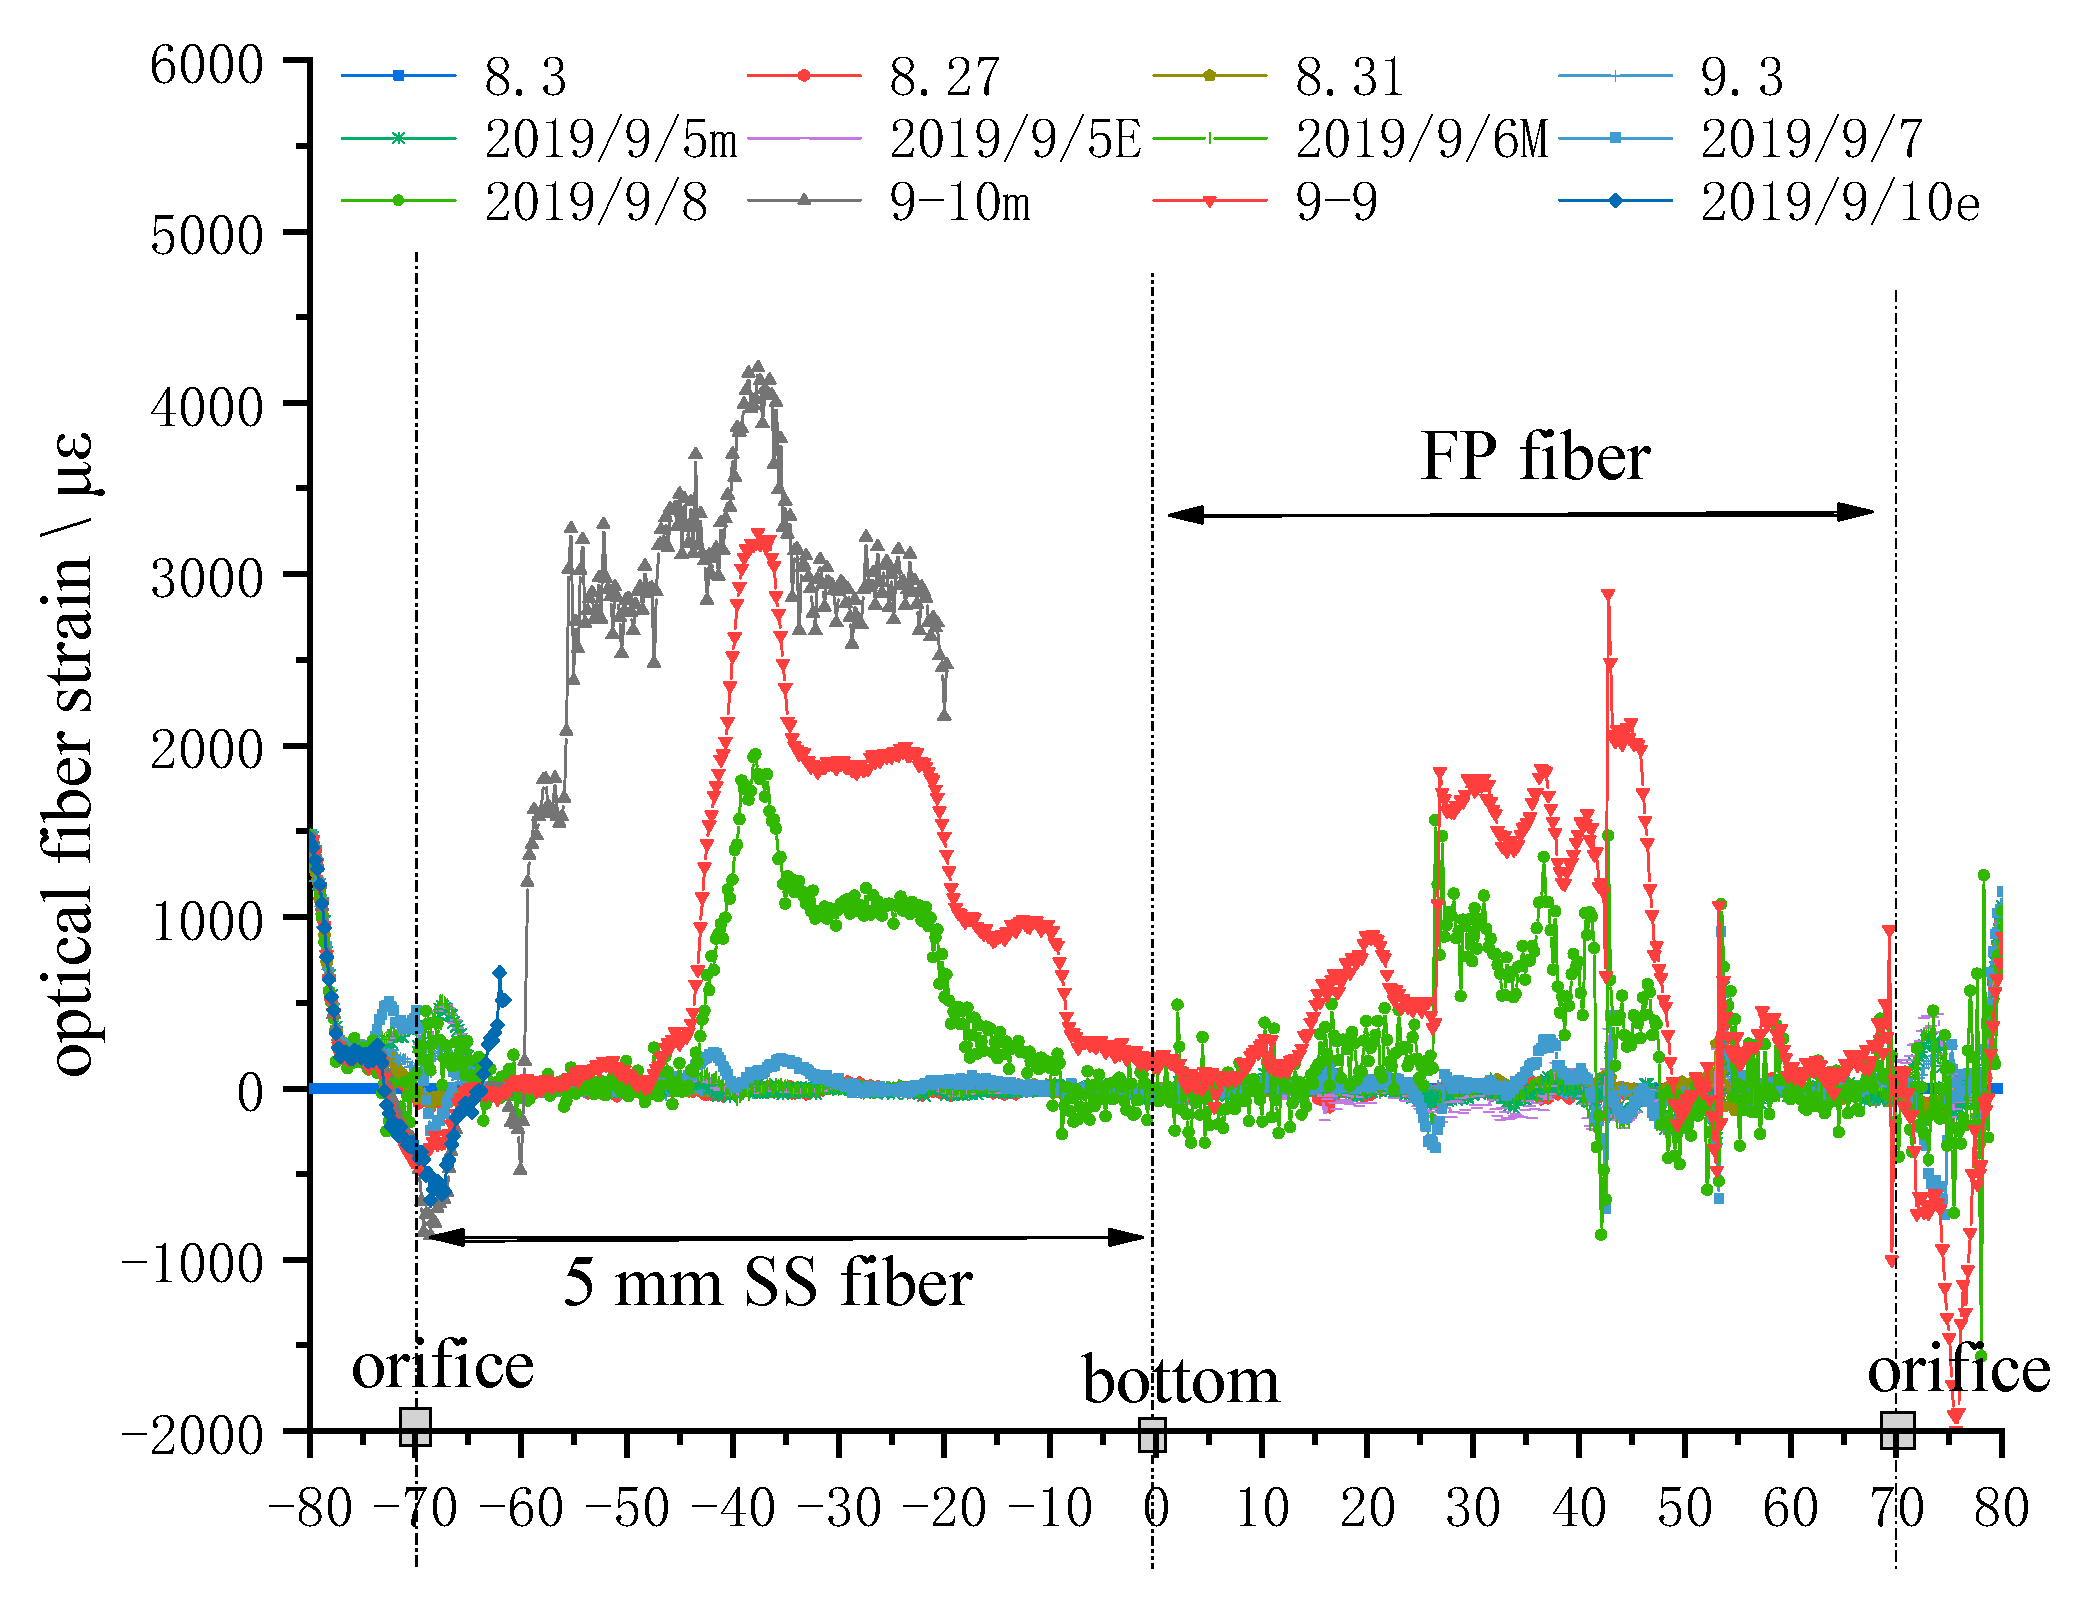
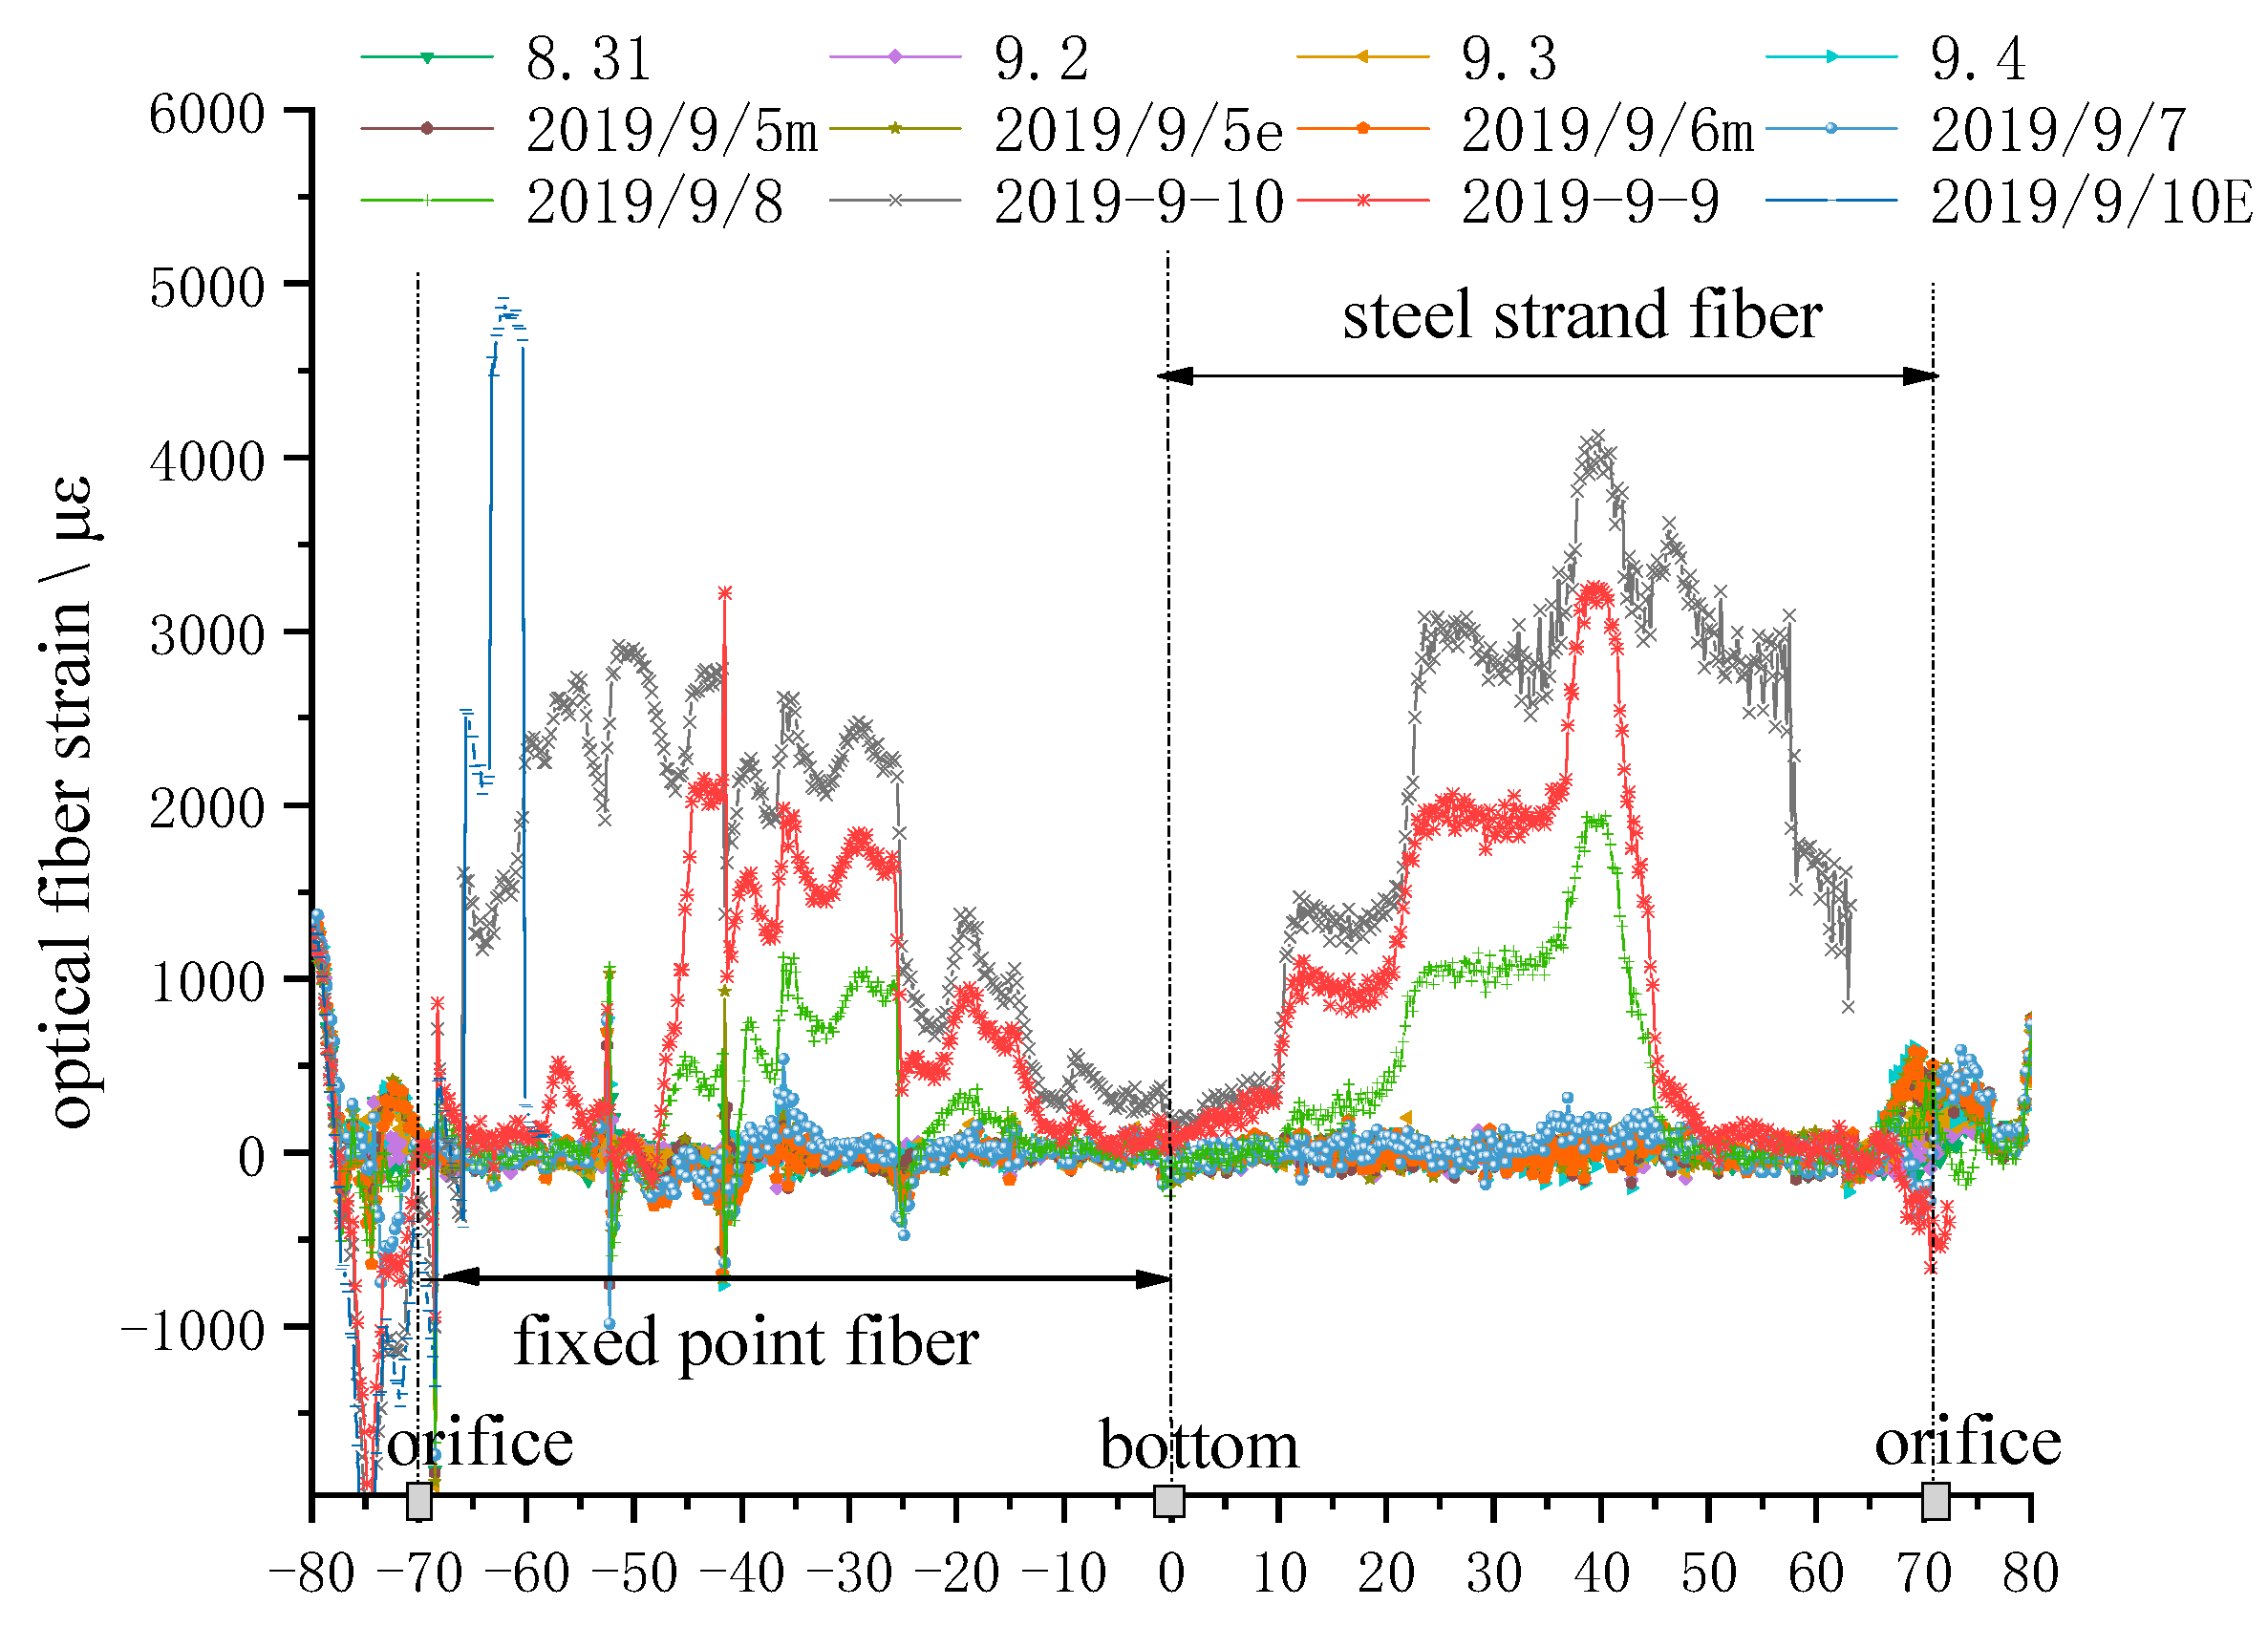
- In the morning of 10 September, the SS fiber lost the strain signal at 7 m from the orifice, kept a small platform of 2000 με between 5~18 m of the hole depth, and suddenly pulled up to 3000 με platform at 18 m of the hole depth. The peak value appeared at 35 m from the orifice. Other changes were the same as the strain change of line ①, but the strain value of 53–63 m increased very little. In the morning of 10 September, at the hole depth of 5 m, the optical fiber strain suddenly rose to the saw-tooth platform above 1000 με, and then the optical fiber strain rose to the saw-tooth platform of 2000 με above the hole depth of 10 m, and kept to the hole depth of 42 m; there was a saw-tooth curve platform of 1000 με between the hole depth of 42~55 m; there was a saw-tooth curve platform within 15 m from the hole bottom irregular curve platform with a maximum of 500 με.
- At 11:00 pm. on 10 September, when the working face passes through the borehole for 10 m, the strain of FP fiber at the orifice suddenly rises, and then soars to 5000 με at the borehole depth of 5 m, and then maintains this strain height, and suddenly fell back to the zero strain state at the borehole depth of 8 m, which obviously shows that FP fiber is subject to strong tension compression conversion at the borehole depth of 5~8 m, and finally is also damaged by shear.
6. Analysis of Mining Movement Law of Roof Strata
7. Conclusions
- (1)
- Strain coefficient calibration and strain transfer test show that high strength SS fiber has high strain transfer performance. The fiber strain test of concrete anchorage pull-out shows that the coupling performance of SS fiber with the concrete is high in the stage of tension and fracture. The SS fiber implanted into the rock stratum can reflect the deformation state of rock strata better with the deformation of the concrete anchorage, and its application in the roof strata movement monitoring is feasible.
- (2)
- It is the first condition to accurately determine the movement state of roof strata to accurately demarcate the three-dimensional spatial position of optical fiber in coal mine underground. It is feasible to demarcate the spatial position by the method of temperature calibration of infusion bottle hot sticking.
- (3)
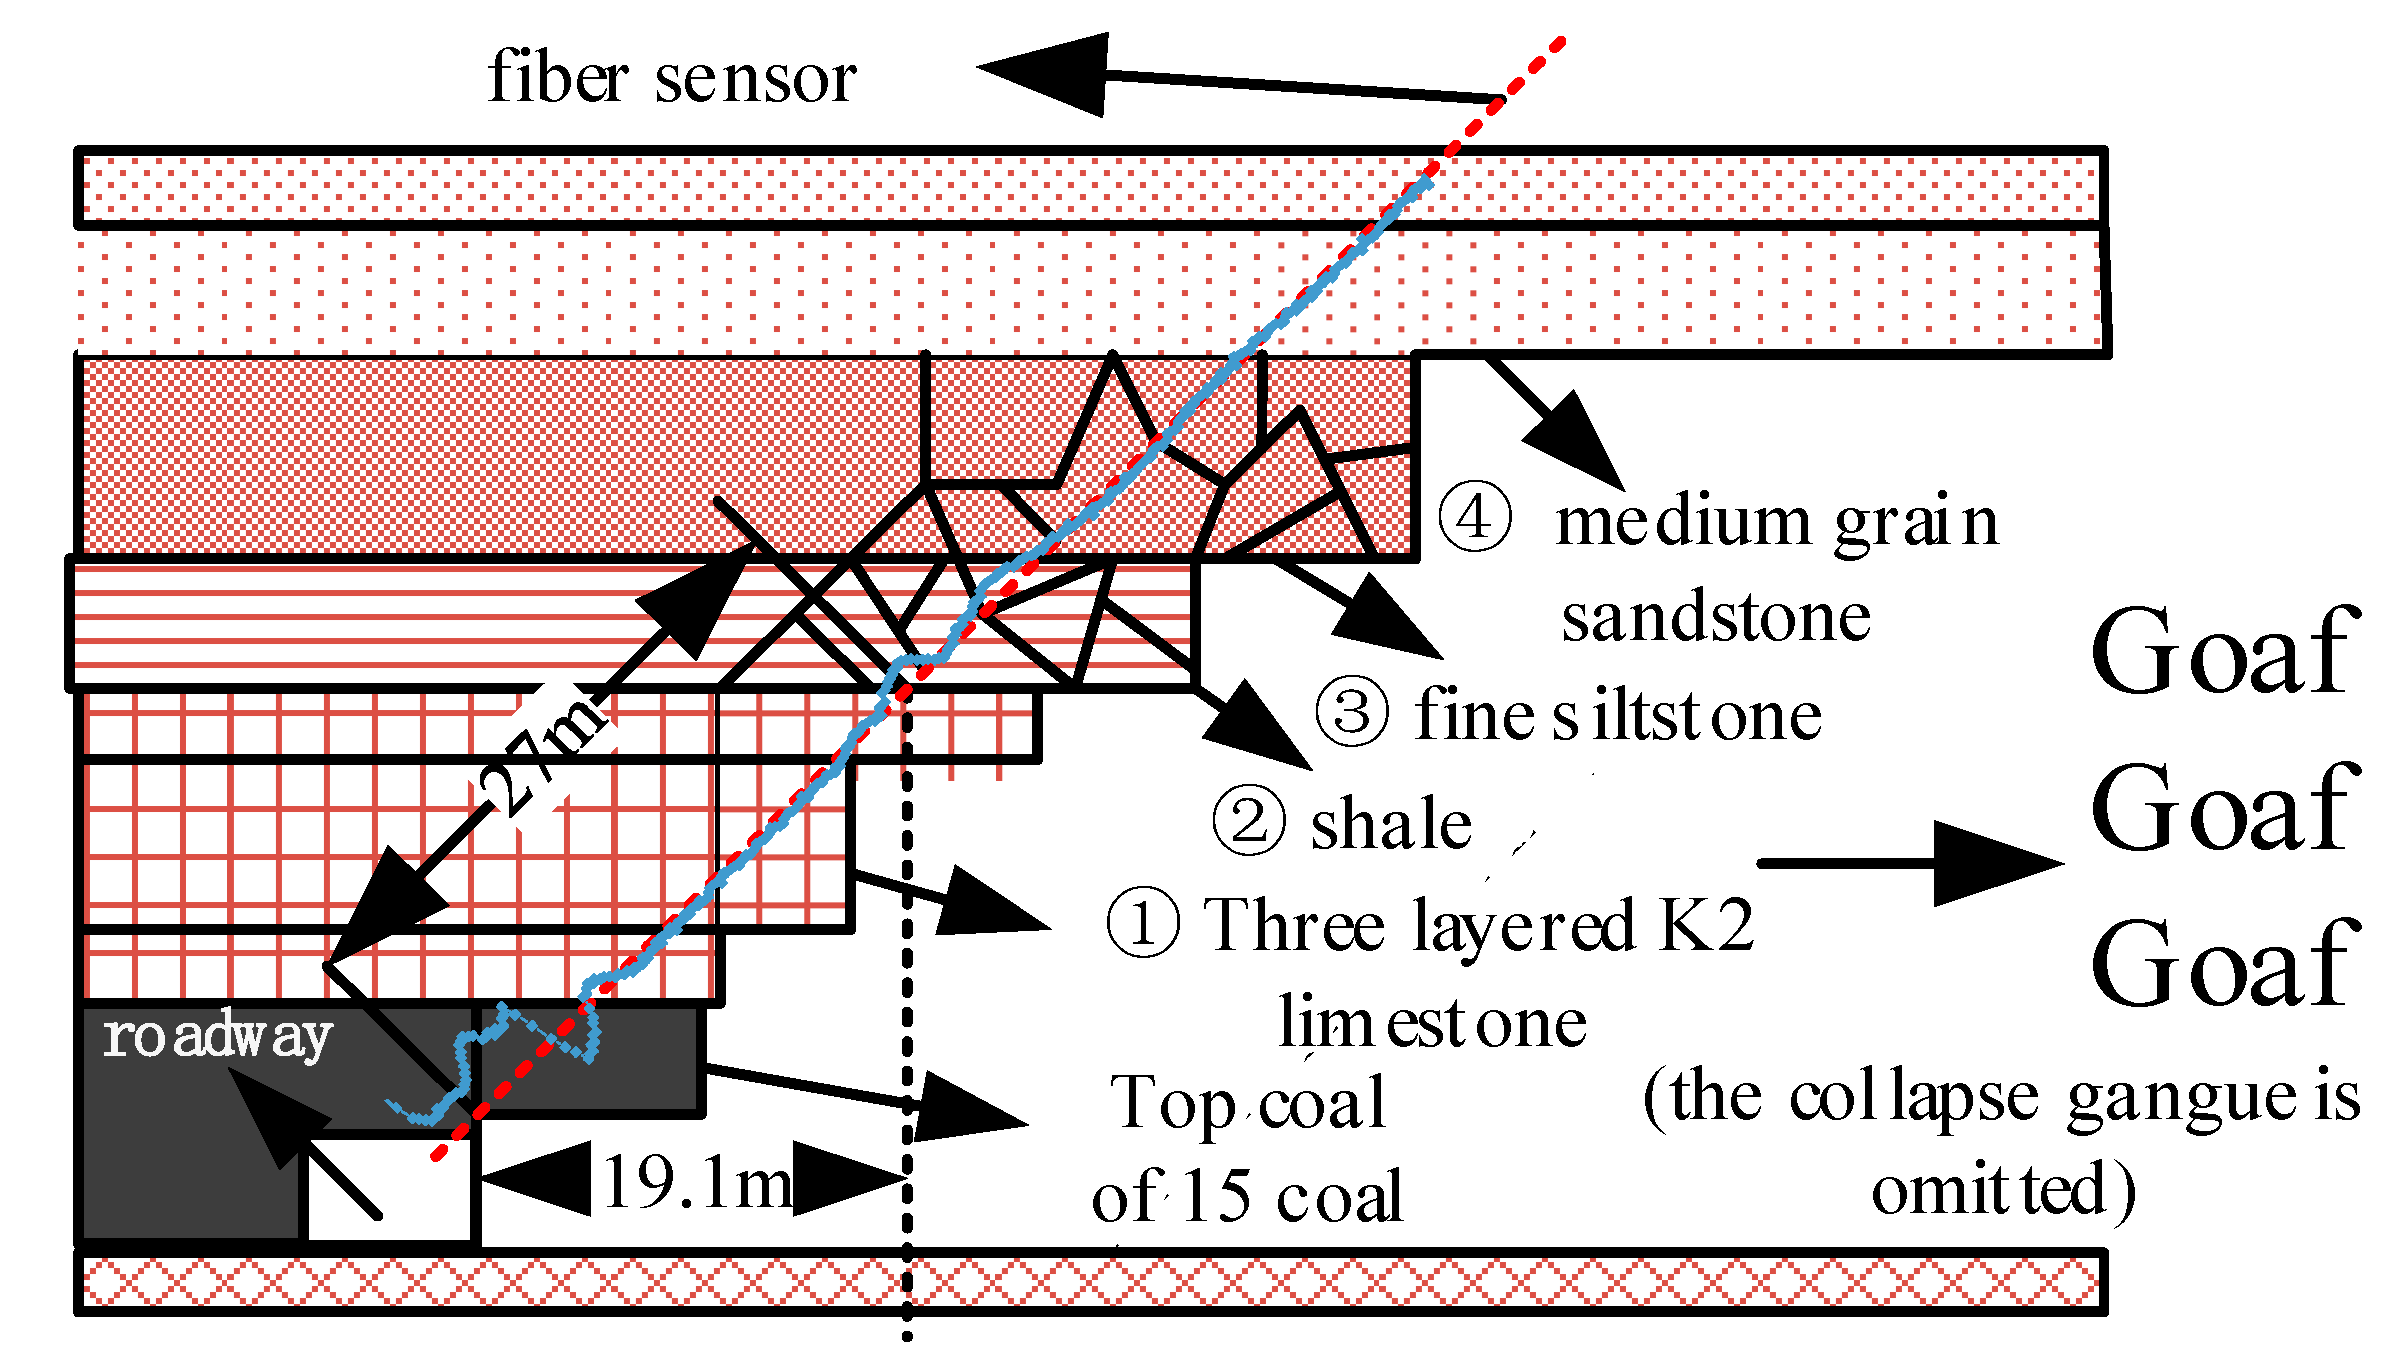
- The results of optical fiber strain show that with the advance of the working face, the roof strata of the goaf first break down in the middle of the goaf. Then the breakage develops upwards and to the two sides of coal pillars in horizontal direction.
- (4)
- In the field experiment, it is can be concluded that there are three movement states of roof strata in gob. First, the initial optical fiber strain state represents the strata is in a stably original state; second, the abrupt strain curve with peak value indicates the strata broke and fractured, it means there is a large separation in the position, or the strata below the fiber collapsed; the third, the platform curve of fiber strain indicate that the strata with the same strain value move overall as a whole.
- (5)
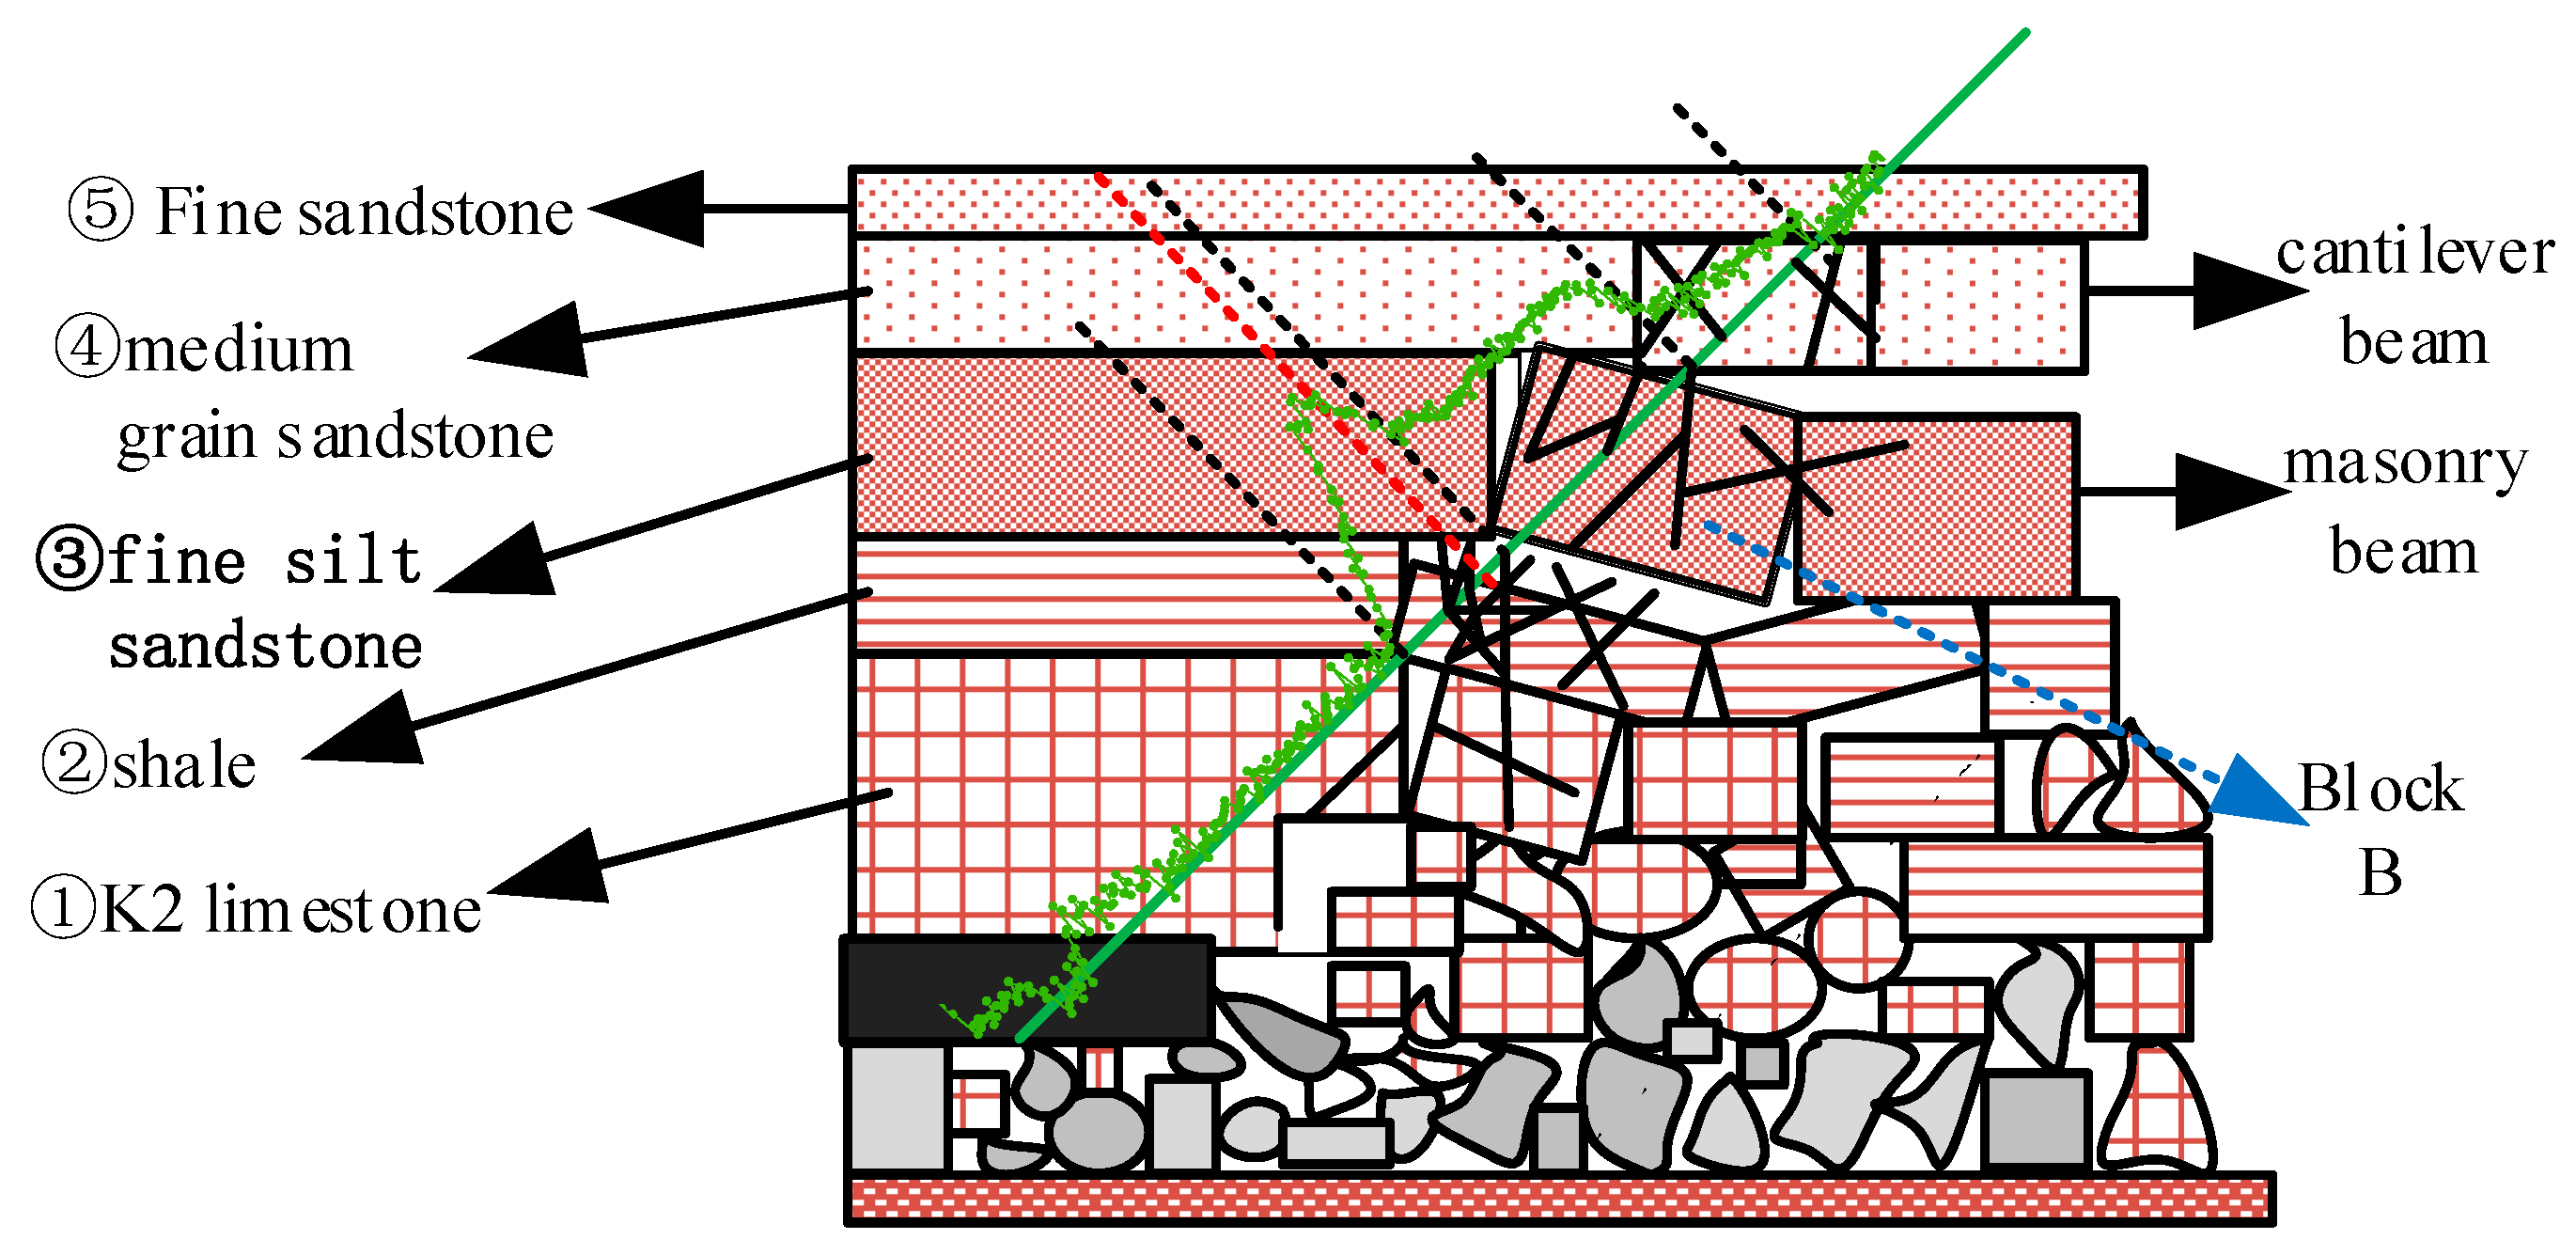
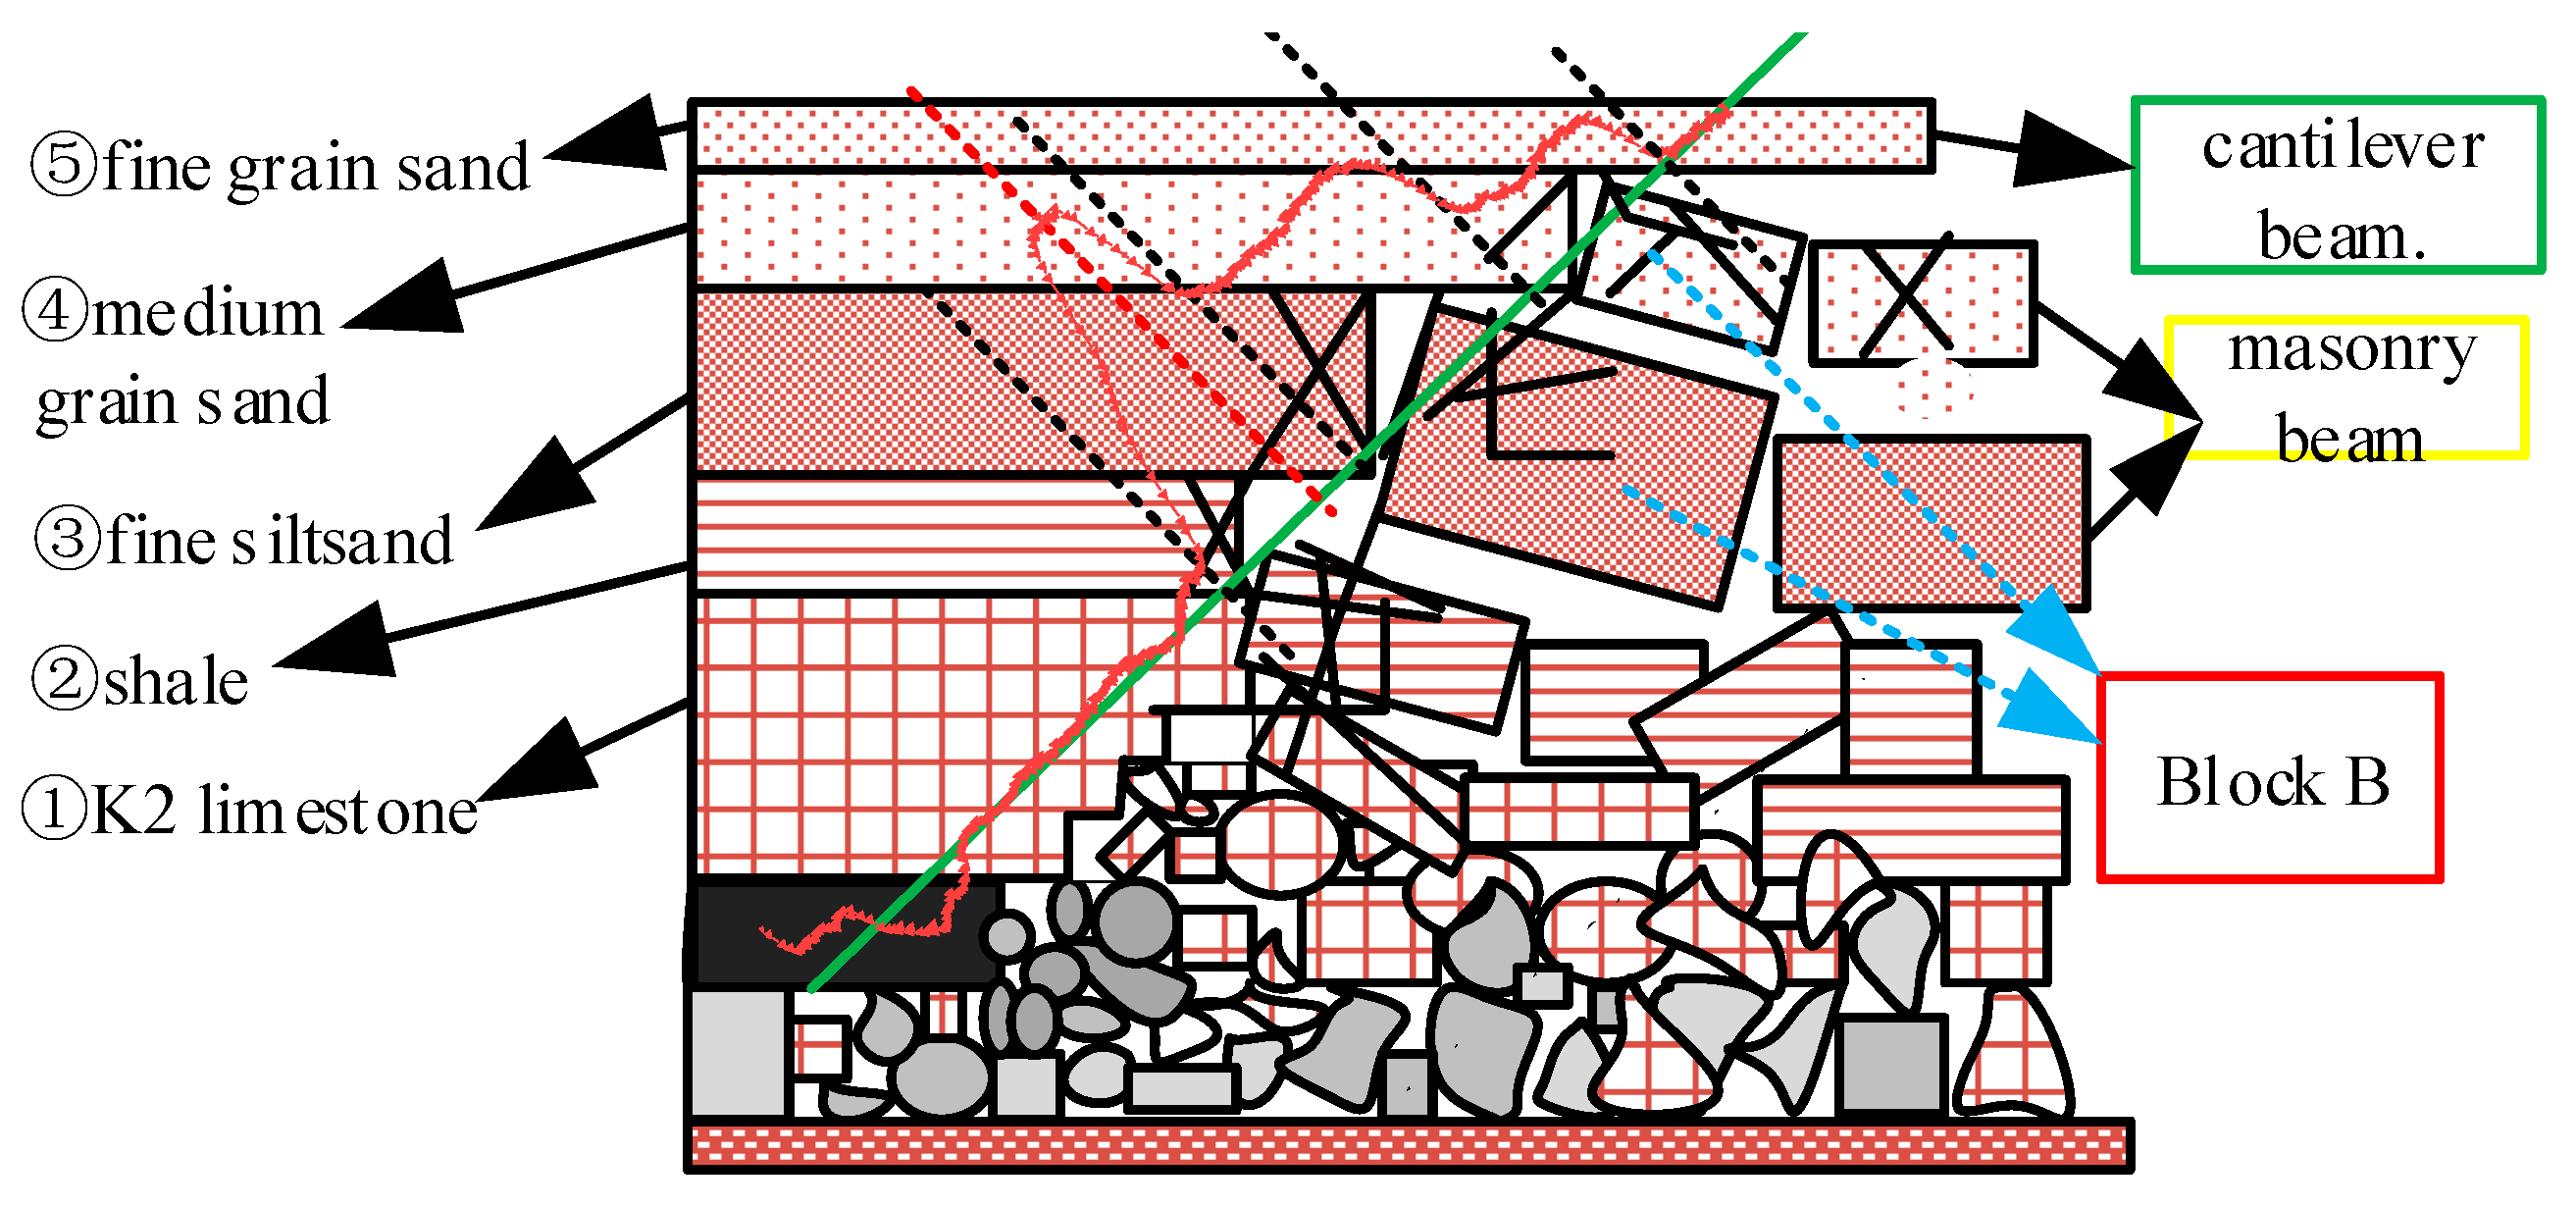
- Through the analysis of the strata position, strata lithology and the fiber strain, the difference of movement state of strata can be demonstrated in 150,313 working face, that is to say, there are three movement stages of roof strata movement. (1) When the coal is mined out in the goaf, the roof strata first is in cantilever beam state, it sink under the weight of strata; (2) when the soft underlying rock stratum collapse like shale. The broken shale rock blocks fill the goaf with the advance of working face, the broken blocks accumulate to support and prevent the upper hard sandy rock strata from sinking, as a result, the upper sandy rock strata are in masonry beam structure state. (3) In the end, from the K2 limestone to upper medium-grained sandstone near borehole broke twice, the new masonry beam structure emerges, and the old masonry beam collapsed in translational subsidence state. QIAN’s theories are confirmed and verified in the fiber strain field monitoring test based on BOTDR in the meantime.
Author Contributions
Funding
Acknowledgments
Conflicts of Interest
References
- Minggao, Q.; Jialin, X. Behaviors of strata movement in coal mining. J. China Coal Soc. 2019, 44, 973–984. (In Chinese) [Google Scholar] [CrossRef]
- Minggao, Q.; Xiexing, M.; Fulian, H. Analysis of key block in the structure of voussoir beam in longwall mining. J. China Coal Soc. 1994, 19, 557–563. (In Chinese) [Google Scholar]
- Qian, M.; Mao, X.; Miao, X. Variation of loads on the Key Layer of the overlying strata above the workings. J. China Coal Soc. 1998, 23, 135–139. (In Chinese) [Google Scholar] [CrossRef]
- He, M.; Zhu, G.; Guo, Z. Longwall mining “cutting cantilever beam theory” and 110 mining method in China—the third mining science innovation. J. Rock Mech. Geotech. Eng. 2015, 7, 483–492. [Google Scholar] [CrossRef]
- Frith, R. Structural engineering principles in coal mine ground control—the common link between empirical models, numerical models, and practical solutions. Adv. Coal Mine Ground Control 2017, 3, 67–92. [Google Scholar]
- Liu, C.; Li, H.; Mitri, H.; Jiang, D.; Li, H.; Feng, J. Voussoir beam model for lower strong roof strata movement in longwall mining–Case study. J. Rock Mech. Geotech. Eng. 2017, 9, 1171–1176. [Google Scholar] [CrossRef]
- Ren, Z.; Wang, N. The overburden strata caving characteristics and height determination of water conducting fracture zone in fully mechanized caving mining of extra thick coal seam. Geotech. Geol. Eng. 2020, 38, 329–341. [Google Scholar] [CrossRef]
- Ju, J.; Xu, J. Structural characteristics of key strata and strata behavior of a fully mechanized longwall face with 7.0 m height chocks. Int. J. Rock Mech. Min. Sci. 2013, 58, 46–54. [Google Scholar] [CrossRef]
- Yu, B. Behaviors of overlying strata in extra-thick coal seams using top-coal caving method. J. Rock Mech. Geotech. Eng. 2016, 8, 238–247. [Google Scholar] [CrossRef]
- Wang, C.; Zhang, C.; Zhao, X.; Liao, L.; Zhang, S. Dynamic structural evolution of overlying strata during shallow coal seam longwall mining. Int. J. Rock Mech. Min. Sci. 2018, 103, 20–32. [Google Scholar] [CrossRef]
- Zhang, J.; Zhang, Q.; Huang, Y.; Zhou, N.; Zan, D. Strata movement controlling effect of waste and fly ash backfillings in fully mechanized coal mining with backfilling face. Min. Sci. Technol. (China) 2011, 21, 721–726. [Google Scholar] [CrossRef]
- Hu, T.; Hou, G.; Li, Z.; Chen, J. Study on the Parameters of Roadside Support after the Cantilever Beam of the Basic Roof with Height of Fracture Zone Cut by Deep-Hole Blasting. In Proceedings of the IOP Conference Series: Earth and Environmental Science, 5th International Conference on Environmental Science and Civil Engineering (ESCE2019), Nanchang, China, 13–14 April 2019; p. 012038. [Google Scholar]
- Cheng, G.; Ma, T.; Tang, C.; Liu, H.; Wang, S. A zoning model for coal mining-induced strata movement based on micro seismic monitoring. Int. J. Rock Mech. Min. Sci. 2017, 94, 123–138. [Google Scholar] [CrossRef]
- Zhang, S.; Liu, Y. A simple and efficient way to detect the mining induced water-conducting fractured zone in overlying strata. Energy Procedia 2012, 16, 70–75. [Google Scholar] [CrossRef]
- Liu, S.; Li, W.; Wang, Q. Height of the water-flowing fractured zone of the Jurassic coal seam in northwestern China. Mine Water Environ. 2018, 37, 312–321. [Google Scholar] [CrossRef]
- Liu, Y.; Liu, Q.M.; Li, W.P.; Li, T.; He, J.H. Height of water-conducting fractured zone in coal mining in the soil–rock composite structure overburdens. Environ. Earth Sci. 2019, 78, 242. [Google Scholar] [CrossRef]
- Bai, J.; Wang, X.; Zhu, Z.; Yan, S. Field investigation of fractures evolution in overlying strata caused by extraction of the Jurassic and carboniferous coal seams and its application: Case study. Int. J. Coal Geol. 2019, 208, 12–23. [Google Scholar]
- Wei, J.; Wu, F.; Yin, H.; Guo, J.; Xie, D.; Xiao, L.; Zhi, H.; Lefticariu, L. Formation and height of the interconnected fractures zone after extraction of thick coal seams with weak overburden in Western China. Mine Water Environ. 2017, 36, 59–66. [Google Scholar] [CrossRef]
- Domingues, M.F.F.; Radwan, A. Optical Fiber Sensors for loT and Smart Devices; Springer Publishing Company, Incorporated: Singapore, 2017. [Google Scholar]
- Jamioy, C.A.G.; López-Higuera, J.M.; Ló Pez-Higuera, J.M. Brillouin Distributed Fiber Sensors: An Overview and Applications. J. Sens. 2012, 2012, 1–17. [Google Scholar] [CrossRef]
- Zhou, D.P.; Li, W.; Chen, L.; Bao, X. Distributed Temperature and Strain Discrimination with Stimulated Brillouin Scattering and Rayleigh Backscatter in an Optical Fiber. Sensors 2013, 13, 1836–1845. [Google Scholar] [CrossRef]
- Bastianini, F.; Di Sante, R.; Falcetelli, F.; Marini, D.; Bolognini, G. Optical Fiber Sensing Cables for Brillouin-Based Distributed Measurements. Sensors 2019, 19, 5172. [Google Scholar] [CrossRef]
- Soto, M.A. Distributed Brillouin sensing: Time-domain techniques. In Handbook of Optical Fibers; Springer: Singapore, 2018; pp. 1–91. [Google Scholar]
- Ravet, F. Distributed Brillouin Sensor Application to Structural Failure Detection. In New Developments in Sensing Technology for Structural Health Monitoring; Springer: Berlin/Heidelberg, Germany, 2011; Volume 96, pp. 93–136. [Google Scholar]
- Lenke, P.; Wendt, M.; Liehr, S.; Krebber, K. Distributed humidity sensing based on Rayleigh scattering in polymer optical fibers. In Proceedings of the (EWOFS’10) Fourth European Workshop on Optical Fibre Sensors, Porto, Portugal, 8–10 September 2010; p. 76533. [Google Scholar]
- Yan, A.; Huang, S.; Li, S.; Chen, R.; Huang, Y.; Chen, K. Ultrafast Laser Enhanced Rayleigh Scattering Characteristics in D-Shaped Fibers for High-Temperature Distributed Chemical Sensing. In Proceedings of the Bragg Gratings, Photosensitivity, and Poling in Glass Waveguides 2016, Sydney, Australia, 5–8 September 2016. [Google Scholar] [CrossRef]
- Gao, Z.F.; Song, W.W.; Luo, H.Q.; Li, N.B. Detection of mercury ions (II) based on non-cross-linking aggregation of double-stranded DNA modified gold nanoparticles by resonance Rayleigh scattering method. Biosens. Bioelectron. 2015, 65, 360–365. [Google Scholar] [CrossRef] [PubMed]
- Peng, F.; Wu, H.; Jia, X.-H.; Rao, Y.-J.; Wang, Z.-N.; Peng, Z.-P. Ultra-long high-sensitivity Φ-OTDR for high spatial resolution intrusion detection of pipelines. Opt. Express 2014, 22, 13804–13810. [Google Scholar] [CrossRef] [PubMed]
- Rizzolo, S.; Sabatier, C.; Boukenter, A.; Marin, E.; Ouerdane, Y.; Cannas, M.; Périsse, J.; Macé, J.-R.; Bauer, S.; Girard, S. Radiation Characterization of Optical Frequency Domain Reflectometry Fiber-Based Distributed Sensors. IEEE Trans. Nucl. Sci. 2016, 63, 1688–1693. [Google Scholar] [CrossRef]
- Bolognini, G.; Hartog, A. Raman-based fiber sensors: Trends and applications. Opt. Fiber Technol. 2013, 19, 678–688. [Google Scholar] [CrossRef]
- Wang, Z.; Sun, X.H.; Xue, Q.; Wang, Y.L.; Qi, Y.L.; Wang, X.S. An optical fiber-folded distributed temperature sensor based on Raman backscattering. Opt. Laser Technol. 2017, 93, 224–227. [Google Scholar] [CrossRef]
- Nan, S.; Gao, Q. Application of Distributed Optical Fiber Sensor Technology Based on BOTDR in Similar Model Test of Backfill Mining. Procedia Earth Planet. Sci. 2011, 2, 39. [Google Scholar] [CrossRef]
- Chai, J.; Du, W.; Yuan, Q.; Zhang, D. Analysis of test method for physical model test of mining based on optical fiber sensing technology detection. Opt. Fiber Technol. 2019, 48, 84–94. [Google Scholar] [CrossRef]
- Chai, J.; Lei, W.; Du, W.; Yuan, Q.; Zhu, L.; Zhang, D.; Li, H. Experimental study on distributed optical fiber sensing monitoring for ground surface deformation in extra-thick coal seam mining under ultra-thick conglomerate. Opt. Fiber Technol. 2019, 53, 102006. [Google Scholar] [CrossRef]
- Zhang, D.; Wang, J.; Zhang, P.; Shi, B. Internal strain monitoring for coal mining similarity model based on distributed fiber optical sensing. Measurement 2017, 97, 234–241. [Google Scholar] [CrossRef]
- Shi, B.; Jiang, H.; Sun, Y. DFOS technology-based landslide monitoring: The Majiagou landslide case study (China). In Workshop on World Landslide Forum; Springer: Cham, Switzerland, 2017; pp. 317–324. [Google Scholar]
- Piao, C.; Lei, S.; Yang, J.; Sang, L. Experimental Study on the Movement and Evolution of Overburden Strata under Reamer-Pillar Coal Mining Based on Distributed Optical Fiber Monitoring. Energies 2019, 12, 77. [Google Scholar] [CrossRef]
- Liu, Y.; Li, W.; He, J.; Liu, S.; Cai, L.; Cheng, G. Application of Brillouin optical time domain reflectometry to dynamic monitoring of overburden deformation and failure caused by underground mining. Int. J. Rock Mech. Min. Sci. 2018, 106, 133–143. [Google Scholar] [CrossRef]
- Tang, B.; Cheng, H. Application of distributed optical fiber sensing technology in surrounding rock deformation control of TBM-excavated coal mine roadway. J. Sens. 2018, 2018, 1–11. [Google Scholar] [CrossRef]
- Cheng, G.; Shi, B.; Zhu, H.-H.; Zhang, C.-C.; Wu, J.-H. A field study on distributed fiber optic deformation monitoring of overlying strata during coal mining. J. Civ. Struct. Health Monit. 2015, 5, 553–562. [Google Scholar] [CrossRef]
- Hartog, A.H. An Introduction to Distributed Optical Fiber Sensors; CRC Press: Boca Raton, FL, USA, 2017. [Google Scholar]
- Rui, Y.; Kechavarzi, C.; O’Leary, F.; Barker, C.; Nicholson, D.; Soga, K. Integrity testing of pile cover using distributed fiber optic sensing. Sensors 2017, 17, 2949. [Google Scholar] [CrossRef] [PubMed]
- Cheng, G.; Shi, B.; Zhu, H.; Chen, D. Experimental Study on Coupling Performance of Fiber and Sand Interface Based on Distributed Sensing. Geol. J. China Univ. 2019, 25, 87–494. (In Chinese) [Google Scholar]
- Moffat, R.; Parra, P.; Carrasco, M. Monitoring a 28.5 m High Anchored Pile Wall in Gravel Using Various Methods. Sensors 2019, 20, 80. [Google Scholar] [CrossRef] [PubMed]
- Gao, L.; Han, C.; Xu, Z.; Jin, Y.; Yan, J. Experimental Study on Deformation Monitoring of Bored Pile Based on BOTDR. Appl. Sci. 2019, 9, 2435. [Google Scholar] [CrossRef]
- Zhang, Z.; Guan, P.; Xu, J.; Wang, B.; Li, H.; Dong, Y. Horizontal Loading Performance of Offshore Wind Turbine Pile Foundation Based on DPP-BOTDA. Appl. Sci. 2020, 10, 492. [Google Scholar] [CrossRef]
- Liu, Y.; Zhang, S. Damage Localization of Beam Bridges Using Quasi-Static Strain Influence Lines Based on the BOTDA Technique. Sensors 2018, 18, 4446. [Google Scholar] [CrossRef]
- Chai, J.; Wei, S.M.; Chang, X.T.; Liu, J.X. Monitoring deformation and damage on rock structures with distributed fiber optical sensing. Int. J. Rock Mech. Min. Sci. 2004, 41, 298–303. [Google Scholar] [CrossRef]
- Gu, L.; Zhang, L.; Bao, X.; Zhang, M.; Zhang, C.; Dong, Y. Detection of Thermal Strain in Steel Rails with BOTDA. Appl. Sci. 2018, 8, 2013. [Google Scholar] [CrossRef]
- Kapa, T.; Schreier, A.; Krebber, K. 63 km BOFDA for Temperature and Strain Monitoring. Sensors 2018, 18, 1600. [Google Scholar] [CrossRef] [PubMed]
- Van Ravenzwaaij, J.; Iten, M.; Spruit, R.; De Boer, A. Geotechnical and Structural Applications of Fiber-Optic Sensing. In High Tech Concrete: Where Technology and Engineering Meet; Springer: Cham, Switzerland, 2018; pp. 1287–1298. [Google Scholar]
- Ohno, H.; Naruse, H.; Kihara, M.; Shimada, A. Industrial applications of the BOTDR optical fiber strain sensor. Opt. Fiber Technol. 2001, 7, 45–64. [Google Scholar] [CrossRef]
- Naruse, H.; Komatsu, K.; Fujihashi, K.; Okutsu, M. Telecommunications tunnel monitoring system based on distributed optical fiber strain measurement. In Proceedings of the 17th International Conference on Optical Fibre Sensors, Bruges, Belgium, 23–27 May 2005; pp. 168–171. [Google Scholar]
- Naruse, H.; Uehara, H.; Deguchi, T.; Fujihashi, K.; Onishi, M.; Espinoza, R.; Guzman, C.; Pardo, C.; Ortega, C.; Pinto, M. Application of a distributed fibre optic strain sensing system to monitoring changes in the state of an underground mine. Meas. Sci. Technol. 2007, 18, 3202. [Google Scholar] [CrossRef]
- Gu, K.; Shi, B.; Liu, C.; Jiang, H.; Li, T.; Wu, J. Investigation of land subsidence with the combination of distributed fiber optic sensing techniques and microstructure analysis of soils. Eng. Geol. 2018, 240, 34–47. [Google Scholar] [CrossRef]
- Yari, T.; Ishioka, M.; Nagai, K.; Sakurai, T. Airplane structure health monitoring by the optical frequency modulation Brillouin distributed measuring method. In Proceedings of the Smart Structures and Materials 2005: Smart Sensor Technology and Measurement Systems, San Diego, CA, USA, 7–9 March 2005; pp. 145–155. [Google Scholar]
- Wang, X.; Shi, B.; Wei, G.; Chen, S.E.; Zhu, H.; Wang, T. Monitoring the behavior of segment joints in a shield tunnel using distributed fiber optic sensors. Struct. Control Health Monit. 2018, 25, e2056. [Google Scholar] [CrossRef]
- Sun, B.Y.; Zhang, P.S.; Wu, R.X.; Guo, L.Q. Dynamic detection and analysis of overburden deformation and failure in a mining face using distributed optical fiber sensing. J. Geophys. Eng. 2018, 15, 2545–2555. [Google Scholar]
- Horiguchi, T.; Shimizu, K.; Kurashima, T.; Tateda, M.; Koyamada, Y. Development of a distributed sensing technique using Brillouin scattering. J. Light. Technol. 1995, 13, 1296–1302. [Google Scholar] [CrossRef]
- . Horiguchi, T.; Kurashima, T.; Tateda, M. Tensile strain dependence of Brillouin frequency shift in silica optical fibers. IEEE Photonics Technol. Lett. 1989, 1, 107–108. [Google Scholar] [CrossRef]
- Garus, D.; Krebber, K.; Schliep, F.; Gogolla, T. Distributed sensing technique based on Brillouin optical-fiber frequency-domain analysis. Opt. Lett. 1996, 21, 1402–1404. [Google Scholar] [CrossRef]
- Saetchnikov, V.A.; Chernyavskaya, E.A.; Yanukovich, T.P. Measurement of temperature and strain using Brillouin optical frequency-domain analysis method. In Proceedings of the Second International Conference on Lasers for Measurement and Information Transfer, St. Petersburg, Russia, 6–8 June 2002; pp. 157–166. [Google Scholar]
- Zhang, Q.; Xiong, Z. Crack Detection of Reinforced Concrete Structures Based on BOFDA and FBG Sensors. Shock. Vib. 2018, 2018, 1–10. [Google Scholar] [CrossRef]
- Ding, Y.; Shi, B.; Zhang, D. Data processing in BOTDR distributed strain measurement based on pattern recognition. Optik 2010, 121, 2234–2239. [Google Scholar] [CrossRef]
- Thévenaz, L.; Niklès, M.; Fellay, A.; Facchini, M.; Robert, A.P. Truly distributed strain and temperature sensing using embedded optical fibers. In Proceedings of the Smart Structures and Materials 1998: Sensory Phenomena and Measurement Instrumentation for Smart Structures and Materials, San Diego, CA, USA, 1–5 March 1998; pp. 301–314. [Google Scholar]
- Bassil, A.; Wang, X.; Chapeleau, X.; Niederleithinger, E.; Abraham, O.; Leduc, D. Distributed fiber optics sensing and coda wave interferometry techniques for damage monitoring in concrete structures. Sensors 2019, 19, 356. [Google Scholar] [CrossRef] [PubMed]
- Gao, L.; Ji, B.; Kong, G.; Huang, X.; Li, M.; Mahfouz, H.A. Distributed measurement of temperature for PCC energy pile using BOFDA. J. Sens. 2015, 2015, 1–6. [Google Scholar] [CrossRef]


| Fiber Type | Diameter/ mm | Tensile Strength/ MPa | Strain Range/ % | Unit Weight/ kg/km | Features |
|---|---|---|---|---|---|
| SS fiber | 5.0 | 6.5 | −2~2 | 42 | High strength with high strain transfer performance |
| FP fiber | 5.0 | 3.0 | 0~5 | 38 | Continuous large deformation monitoring |
| Parameter Type | Specific Parameter |
|---|---|
| Fiber type | Single mode |
| Measurement range (km) | 0.5, 1, 2, 5, 10, 20, 40, 80 |
| The interval of spatial sampling (m) | 0.05, 0.10, 0.20, 0.50, 1.00 |
| Test pulse width (ns) | 10, 20, 50, 100, 200 |
| dynamic range (dB) | 3.5, 7.5, 11.5, 14.5, 16.5 |
| Repeatability of strain test (με) | ≤±100 |
| Strain test range (με) | −15,000–+15,000 |
| Frequency scanning range (GHz) | 9.9–12.0 |
| Frequency scan interval (MHz) | 1, 2, 5, 10, 20, 50 |
| Working wavelength (nm) | 1550 ± 5 |
| Maximum number of sampling points | 20,000 |
| Parameter Type | Specific Parameter |
|---|---|
| Measuring range/km | 5 |
| Spatial resolution/m | 1 |
| Sampling resolution/m | 0.2 |
| CS: MHz/με | 0.0495 |
| Initial Brillouin frequency/GHz | 10.82 |
| initial scanning frequency index/GHz | 10.45 |
| End scanning frequency/GHz | 11.8 |
| Optical fiber refractive index | 1.468 |
| Cumulative times | 213 |
| Pulse width/ns | 20 |
| Frequency interval/MHz | 10 |
| Data points | 20,000 |
| Frequency points | 136 |
© 2020 by the authors. Licensee MDPI, Basel, Switzerland. This article is an open access article distributed under the terms and conditions of the Creative Commons Attribution (CC BY) license (http://creativecommons.org/licenses/by/4.0/).
Share and Cite
Hu, T.; Hou, G.; Li, Z. The Field Monitoring Experiment of the Roof Strata Movement in Coal Mining Based on DFOS. Sensors 2020, 20, 1318. https://doi.org/10.3390/s20051318
Hu T, Hou G, Li Z. The Field Monitoring Experiment of the Roof Strata Movement in Coal Mining Based on DFOS. Sensors. 2020; 20(5):1318. https://doi.org/10.3390/s20051318
Chicago/Turabian StyleHu, Tao, Gongyu Hou, and Zixiang Li. 2020. "The Field Monitoring Experiment of the Roof Strata Movement in Coal Mining Based on DFOS" Sensors 20, no. 5: 1318. https://doi.org/10.3390/s20051318
APA StyleHu, T., Hou, G., & Li, Z. (2020). The Field Monitoring Experiment of the Roof Strata Movement in Coal Mining Based on DFOS. Sensors, 20(5), 1318. https://doi.org/10.3390/s20051318