Article

A Facile Fabrication of a Potentiometric Arrayed Glucose Biosensor Based on Nafion-GOx/GO/AZO

1
Graduate School of Electronic Engineering, National Yunlin University of Science and Technology, Douliu 64002, Taiwan
2
Graduate School of Chemical and Materials Engineering, National Yunlin University of Science and Technology, Douliu 64002, Taiwan
*
Author to whom correspondence should be addressed.
Sensors 2020, 20(4), 964; https://doi.org/10.3390/s20040964
Submission received: 16 December 2019 / Revised: 31 January 2020 / Accepted: 7 February 2020 / Published: 11 February 2020
(This article belongs to the Special Issue Printed Electrode Sensors and Biosensors)

Abstract

:
In this study, the potentiometric arrayed glucose biosensors, which were based on zinc oxide (ZnO) or aluminum-doped zinc oxide (AZO) sensing membranes, were fabricated by using screen-printing technology and a sputtering system, and graphene oxide (GO) and Nafion-glucose oxidase (GOx) were used to modify sensing membranes by using the drop-coating method. Next, the material properties were characterized by using a Raman spectrometer, a field-emission scanning electron microscope (FE-SEM), and a scanning probe microscope (SPM). The sensing characteristics of the glucose biosensors were measured by using the voltage–time (V-T) measurement system. Finally, electrochemical impedance spectroscopy (EIS) was conducted to analyze their charge transfer abilities. The results indicated that the average sensitivity of the glucose biosensor based on Nafion-GOx/GO/AZO was apparently higher than that of the glucose biosensor based on Nafion-GOx/GO/ZnO. In addition, the glucose biosensor based on Nafion-GOx/GO/AZO exhibited an excellent average sensitivity of 15.44 mV/mM and linearity of 0.997 over a narrow range of glucose concentration range, a response time of 26 s, a limit of detection (LOD) of 1.89 mM, and good reproducibility. In terms of the reversibility and stability, the hysteresis voltages (VH) were 3.96 mV and 2.42 mV. Additionally, the glucose biosensor also showed good anti-inference ability and reproducibility. According to these results, it is demonstrated that AZO is a promising material, which could be used to develop a reliable, simple, and low-cost potentiometric glucose biosensor.

1. Introduction

Glucose plays a vital role in numerous physiological processes, and all cells and organs in the human body require glucose as a source of energy in order to function properly [1]. If blood sugar cannot be sufficiently well regulated, an individual will eventually develop type 2 diabetes (T2D). At present, T2D is an incurable chronic disease, but it is preventable and controllable if symptoms are recognized early enough [2]. Worldwide, approximately 422 million people have some type of diabetes, and it is the cause of 3.96 million deaths annually [3]. For this reason, the detection and control of blood sugar levels are crucially important.
Zinc Oxide (ZnO) is an n-type II-VI semiconductor with large exciton binding energy (60 meV) and a wide direct band gap (3.37 eV) [4]. The ZnO nanostructure may have potential as an excellent matrix owing to its ability to enhance signal transduction and to facilitate the immobilization of biomolecules while retaining activity. A matrix with these properties could be used in the development of a biosensor [5]. Enzymes such as glucose oxidase (GOx) have a relatively low isoelectric point (IEP approximately 4.2) [6]. Conversely, ZnO has a high isoelectric point (IEP approximately 9.5) and thus can provide a suitable environment for enzyme immobilization [7]. Recently, Ali et al. [8] developed a potentiometric glucose biosensor by immobilizing GOx onto a ZnO nanowires (NWs)/Ag electrode. They compared the addition of bovine serum albumin (BSA) regarding the growth of ZnO NWs. The biosensor had an outstanding sensitivity of 35 mV/decade over a relatively wide logarithmic concentration range (0.5 to 1000 μM) and a fast response within 4 s. Fulati et al. [9] proposed a potentiometric intracellular glucose biosensor based on a BSA-GOx/ZnO nanoflakes (NFs)/Al microelectrode, which was used to take measurements from human adipocytes and frog oocytes. The results showed a fast response within 4 s, and a sensitivity of 65.2 mV/decade over a wide range of glucose concentrations (500 nM to 10 mM), as well as good values for stability, selectivity, and reproducibility. Wahab et al. [10] studied a glucose biosensor based on ZnO nanorods (NRs) that were deposited on a silver wire with an annealing temperature of 250 °C. The biosensor was able to determine glucose concentration in phosphate-buffered saline (PBS) over a range of 1µM to 10mM and in human serum, and its linearity was 0.98. The aforementioned biosensors demonstrate the enormous potential for ZnO in the potentiometric detection of glucose.
ZnO has been widely studied in the biosensing field and thus many of its properties and applications are well known [8,9,10,11,12,13]. Aluminum-doped zinc oxide (AZO) is a novel material that is composed of ZnO that had aluminum (Al) doped into it. The electrical conductivity of ZnO can be enhanced by doping group III metals such aluminum, a p-type dopant, into it in order to increase the concentration of free holes. Doping can change the characteristics of a material, such as its electron mobility, optical properties, and electrical conductivity, and can improve its high-temperature stability [14,15]. AZO is more sensitive compared to non-doped ZnO, especially with regard to adsorbed species on the surface in a known microenvironment [16]. Besides, relatively little research has been done in potentiometric biosensors applying AZO in recent years, and most studies have investigated the use of AZO in amperometric biosensors [13,17]. Due to the good sensitivity and limit of detection, the amperometric glucose biosensors have come into the picture. However, when a high polarizing voltage is applied, interfering substances may lead to nonspecific signals. Compared to the amperometric biosensors, potentiometric biosensors have an outstanding advantage in selectivity and stability, due to the extra potential that is not required, so they have become more particularly suitable for long-term monitoring [18]. Therefore, we applied AZO to the sensing membranes of potentiometric arrayed glucose biosensors, thereby analyzing whether AZO was more suitable for biosensing than ZnO.
Graphene is a form of carbon consisting of two-dimensional monolayers of carbon atoms arranged in a honeycomb lattice [19]. Since graphene has excellent electrical conductivity, a high volume–surface area ratio, hydrophobicity, and strong mechanical strength [20,21], it is increasingly being used in the development of sensors [20,21,22,23]. Graphene oxide (GO), which belongs to the graphene family, was also selected for investigation in this study. According to the structural model proposed by He et al. [24], GO consists of unoxidized benzene rings and has a hexagonal ring structure. GO could be dissolved and manipulated in aqueous solution owing to the abundant hydroxyl and epoxide groups on the basal planes and the numerous carbonyl and carboxyl groups at the sheet edges [24,25,26]. GO was also able to enhance the charge transfer ability of sensors and biosensors to improve their sensitivity [26] and limit of detection (LOD) [27]. In this study, GO was synthesized using the modified Hummers’ method [28], and it was processed into an aqueous solution in order to modify the sensing membranes of the potentiometric arrayed glucose biosensors.
In this study, we proposed a potentiometric arrayed glucose biosensor based on a terephthalate (PET) substrate, which has many advantages, such as its portability, flexibility, miniaturization of sensors, and low cost [29]. In terms of the fabrication process, the printed silver pattern served as the reference electrodes and conductive wires on a PET substrate via screen-printing technology [30]. Sputtering was used to deposit a metal oxide, i.e., AZO or ZnO, to form sensing membranes. GO was used to modify the sensing membranes, and the GOx was immobilized on the sensing electrodes by the entrapment method to complete the production of the glucose biosensor. Then, we investigated the sensing characteristics of the potentiometric arrayed glucose biosensor based on Nafion-GOx/GO/AZO, which included the average sensitivity, linearity, LOD, response time, reversibility, selectivity, and reproducibility. Further analysis using electrochemical impedance spectroscopy (EIS) was conducted to determine the charge transfer ability of membranes. Finally, the performances of the proposed glucose biosensor were compared with potentiometric glucose biosensors that have been developed in recent years.

2. Experimental

2.1. Materials

The silver conductive paste was purchased from Advanced Electronic Material Inc. (Tainan, Taiwan). The epoxy (product no. JA643) was purchased from Sil-More Industrial, Ltd. (New Taipei City, Taiwan). Polyethylene terephthalate (PET) was purchased from Perm Top Co., Ltd. (New Taipei City, Taiwan). D-Glucose was purchased from J. T. Baker Co. (New Jersey, USA). The graphite powder was purchased from Alfa Aesar Co. (Massachusetts, USA). Nafion and glucose oxidase (GOx) were purchased from Sigma-Aldrich Co. (Missouri, USA). The AZO (99.99% purity, Al:ZnO = 2 wt%:98 wt%) and ZnO (99.99% purity) targets were purchased from Ultimate Material Technology Co., Ltd. (Hsinchu, Taiwan). The 0.1 M phosphate-buffered saline solution (PBS, pH 7.0) was prepared by mixing the standard solution of potassium phosphate monobasic (KH2PO4) and potassium phosphate dibasic (K2HPO4), which were purchased from Katayama Chemical Co., Ltd. (Osaka, Japan). All chemicals used in this study were of analytical grade and used without further purification.

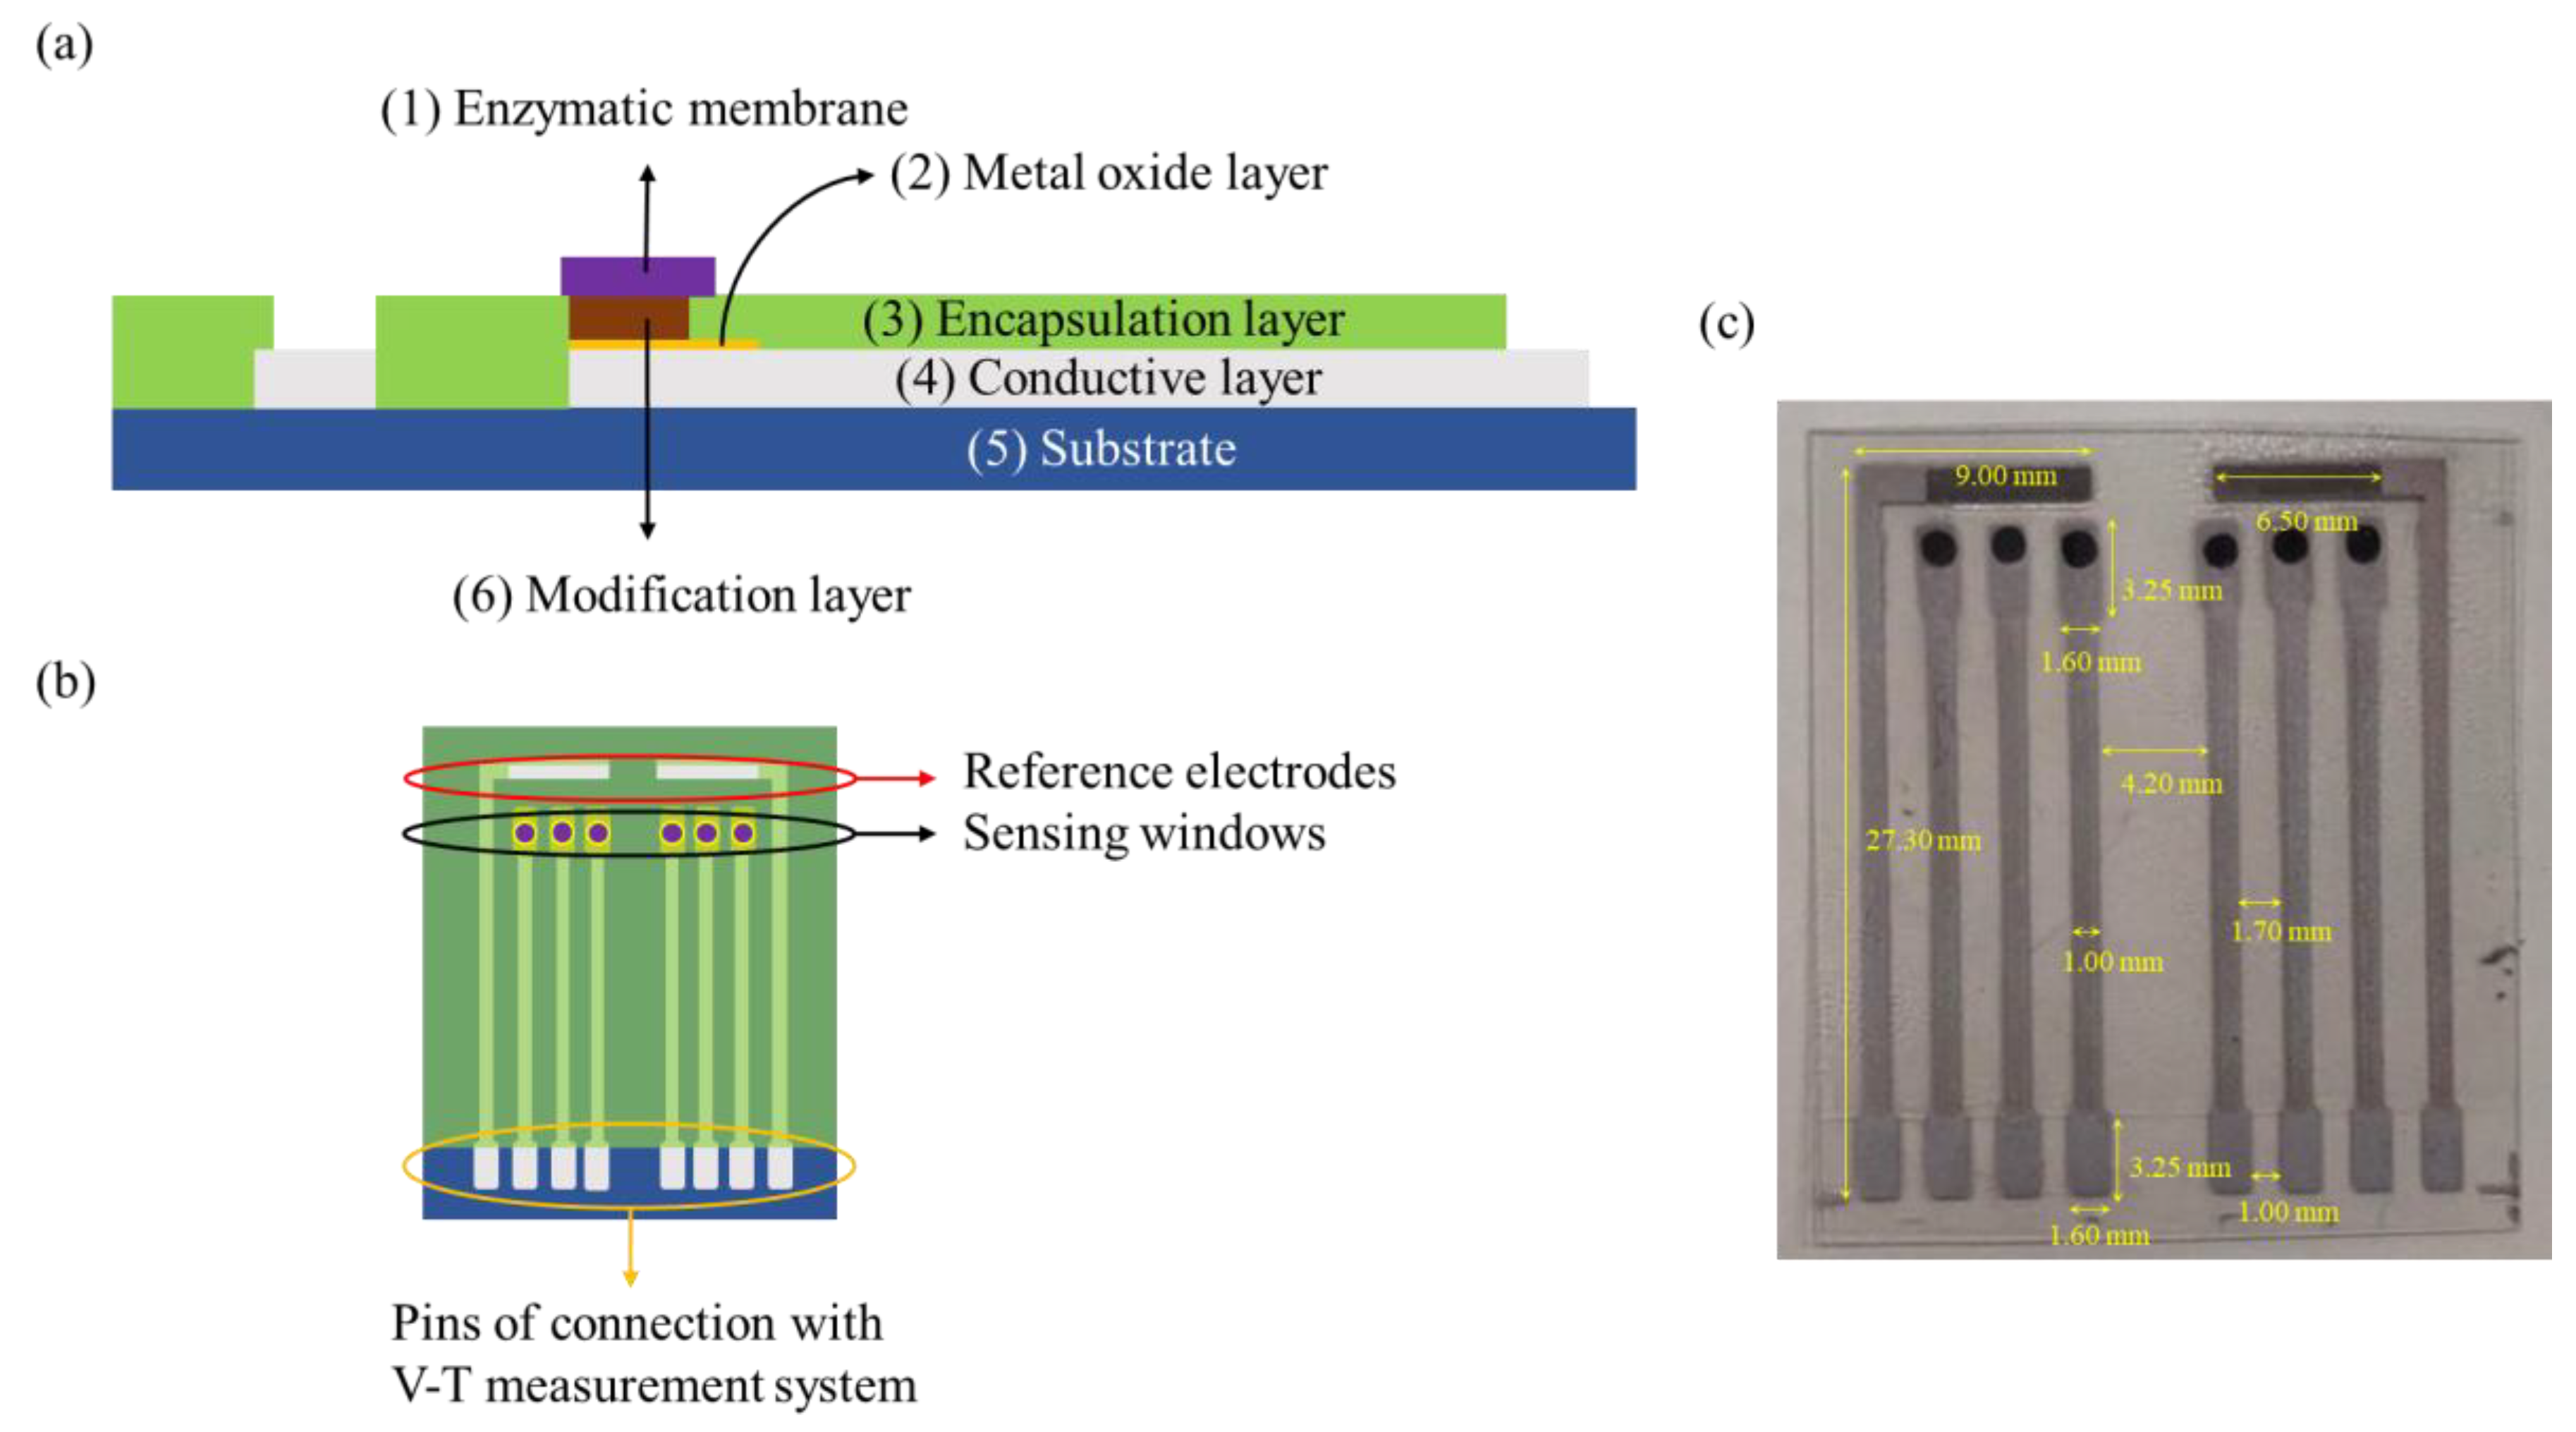
2.2. Deposition of Sensing Membranes and Preparation of Electrodes

The PET substrate was cut into an area of 10.5 cm2 (3 cm × 3.5 cm) which was cleaned using ethanol and deionized (D.I.) water in an ultrasonic vibrator for 10 min. The silver conductive paste was printed onto the PET substrate, the electrodes and conductive wires were printed using screen-printing technology, and then they were placed in a high-temperature oven at 120 °C for 30 min.
The high-purity circular AZO and ZnO targets were used for deposition of the sensing membranes. ZnO or AZO was sputtered onto the PET substrate by radio frequency (RF) sputtering at 3 mTorr pressure, 60 W power, and with Ar/O2 as the reactive gas flowing at 9/1 sccm for 30 min. In terms of encapsulation, the epoxy was printed on the sensors as an insulation layer, and the completed samples were then placed in a high-temperature oven at 120 ºC for 90 min. The aforementioned process produced six defined areas that served as the sensing windows (1.77 mm2 per window), and which were able to protect the conductive wires and block an aqueous solution.

2.3. Synthesis of Graphene Oxide and Modification of the Sensing Membranes

The modified Hummers’ method [28] was employed to synthesize GO using graphite powder. Graphite and sodium nitrate (NaNO3) were mixed (vol. ratio: 1:1) in a sealed glass container, and sulfuric acid (H2SO4) was added to the mixture. The mixture was stirred in an ice bath at 0–4 °C for 1 h. Then, potassium permanganate (KMnO4) was slowly added into the uniform mixture and stirred for 24 h. Subsequently, deionized (D.I.) water was added into the mixture, followed by hydrogen peroxide (H2O2) to cease the oxidation reaction, and then the mixture was stood for 24 h. Next, the produced precipitate was washed by using a solution of hydrochloric acid (HCl) and D.I. water (vol. ratio: 1:10). Finally, the precipitate was rinsed with D.I. water until it reached pH 7.0, after which it was freeze-dried to remove any excess water. Finally, the brown-colored GO powder was obtained.
In order to modify the sensing membranes, the GO powder was dissolved in D.I. water and placed in an ultrasonic vibrator for 10 min in order to prepare the 0.3 wt% GO solution [31]. Subsequently, 2 μL of GO solution was separated by a micropipette and used to modify the sensing membranes by the drop-coating method. Thereafter, the membranes were left to dry at room temperature.

2.4. Immobilization of Nafion-GOx Sensing Membranes

The 10 mg of glucose oxidase powder was added to 1 mL of 0.1 M PBS solution (10 mg/mL in PBS). The glucose oxidase solution and Nafion were uniformly mixed (vol. ratio: 4:3) by using a vortex mixer [31]. Finally, the mixture of Nafion and glucose oxidase was dropped onto the sensing windows to form the glucose sensing membrane, and then the Nafion-GOx sensing membranes were dried at 4 °C for 12 h. The unbound enzyme was removed by rinsing with D.I. water. After the GOx was immobilized on the sensing windows, the potentiometric arrayed glucose biosensor based on Nafion-GOx/GO/ZnO or Nafion-GOx/GO/AZO was fabricated.
The schematic diagram of the potentiometric arrayed glucose biosensor is shown in Figure 1. The function of each layer in Figure 1a is as follows: (1) the enzymatic membrane acts as a biometric layer; (2) the metal oxide layer serves as a matrix; (3) epoxy provides an insulation layer preventing contact with aqueous solution; (4) silver paste is printed on the substrate as reference electrodes and conductive wires; (5) PET is used as a substrate of the flexible arrayed biosensors; (6) GO is used as a modification layer, which is used to enhance the specific surface area of the sensing membranes. In Figure 1b, it can be seen that the biosensor has six sensing windows, two reference electrodes, and eight pins for connection with the V-T measurement system. Figure 1c only shows the optical image of the potentiometric arrayed glucose biosensor based on Nafion-GOx/GO/AZO, which the dimensions annotated in yellow. Since the optical images of ZnO and AZO were almost identical (the membranes were transparent), only one of them is shown in Figure 1.

2.5. Voltage–Time Measurement System

The sensing characteristic of the biosensor was measured by a voltage–time (V-T) measurement system [32], which is composed of a power supply, a readout circuit, a data acquisition card (DAQ card) (Model: NI USB-6201, National Instrument Corp. Texas, USA), and the system software (Model: LabVIEW 2011, National Instrument Corp. Texas, USA). The glucose biosensor measured via the V-T measurement system is shown in Figure 2. In this study, due to its high common-mode rejection ratio (CMRR) and high input impedances, LT1167 was determined to be suitable for bio-electronic signals. The readout circuit consists of eight instrumentation amplifiers (INA, LT1167). The output voltage is expressed by Equation (1):
V out   =   ( V +     ( - V - ) ) ×   ( 1   +   R th R G ) = V ref V work = V work        ( R G = )
where Vout is the output voltage (INA), V+ is the non-inverting input voltage (INA), V- is the inverting input voltage (INA), Rth is the internal equivalent resistance, VG is the gain resistance, Vref is the potential of the reference electrode, and the Vwork is the potential of the working electrode. Herein, because RG is an open circuit (RG = ∞), the voltage gain of INA is 1. According to Equation (1), we can obtain Vout, which is the potential difference between the working electrode and the reference electrode, i.e., -Vwork is the response voltage of the biosensor. The working schematics of the potentiometric measurement are shown in Figure 3.

2.6. Characterization of Materials

The optical microscope with a light source (Model: VHX-5000 and VH-Z100R, Tokyo, Japan) that was used to observe the morphology of a silver electrode was purchased from Keyence Co., Ltd. The field-emission scanning electron microscope equipped with an energy-dispersive detector (FE-SEM, Model: JSM-6701F, Tokyo, Japan) that was used to investigate the morphology and conduct the elemental analysis was purchased from JEOL Ltd. The Raman spectrometer (Model: iHR550, Tokyo, Japan) with 532 nm laser excitation that was used to characterize carbon materials was purchased from Horiba, Ltd. The scanning probe microscope (SPM, Model: Dimension Icon, Texas, USA) that was used to examine the surface roughness of membranes was purchased from Bruker Corp.

2.7. Analysis of Electrochemical Impedance

The electrochemical impedance analysis was characterized by using a potentiostat/galvanostat (Biologic, SP-150, Isère, France), and a three-electrode setup was used with a Pt panel as a counter electrode, an Ag/AgCl reference electrode, and a working electrode. The frequency range was set from 200 kHz to 50 mHz. The amplitude of the sine signal was 10 mV (EWE vs. EOC = 0V). The test solution was a 0.1 M PBS solution (pH 7.0). Other experimental parameters, such as temperature, were kept constant.

3. Results and Discussion

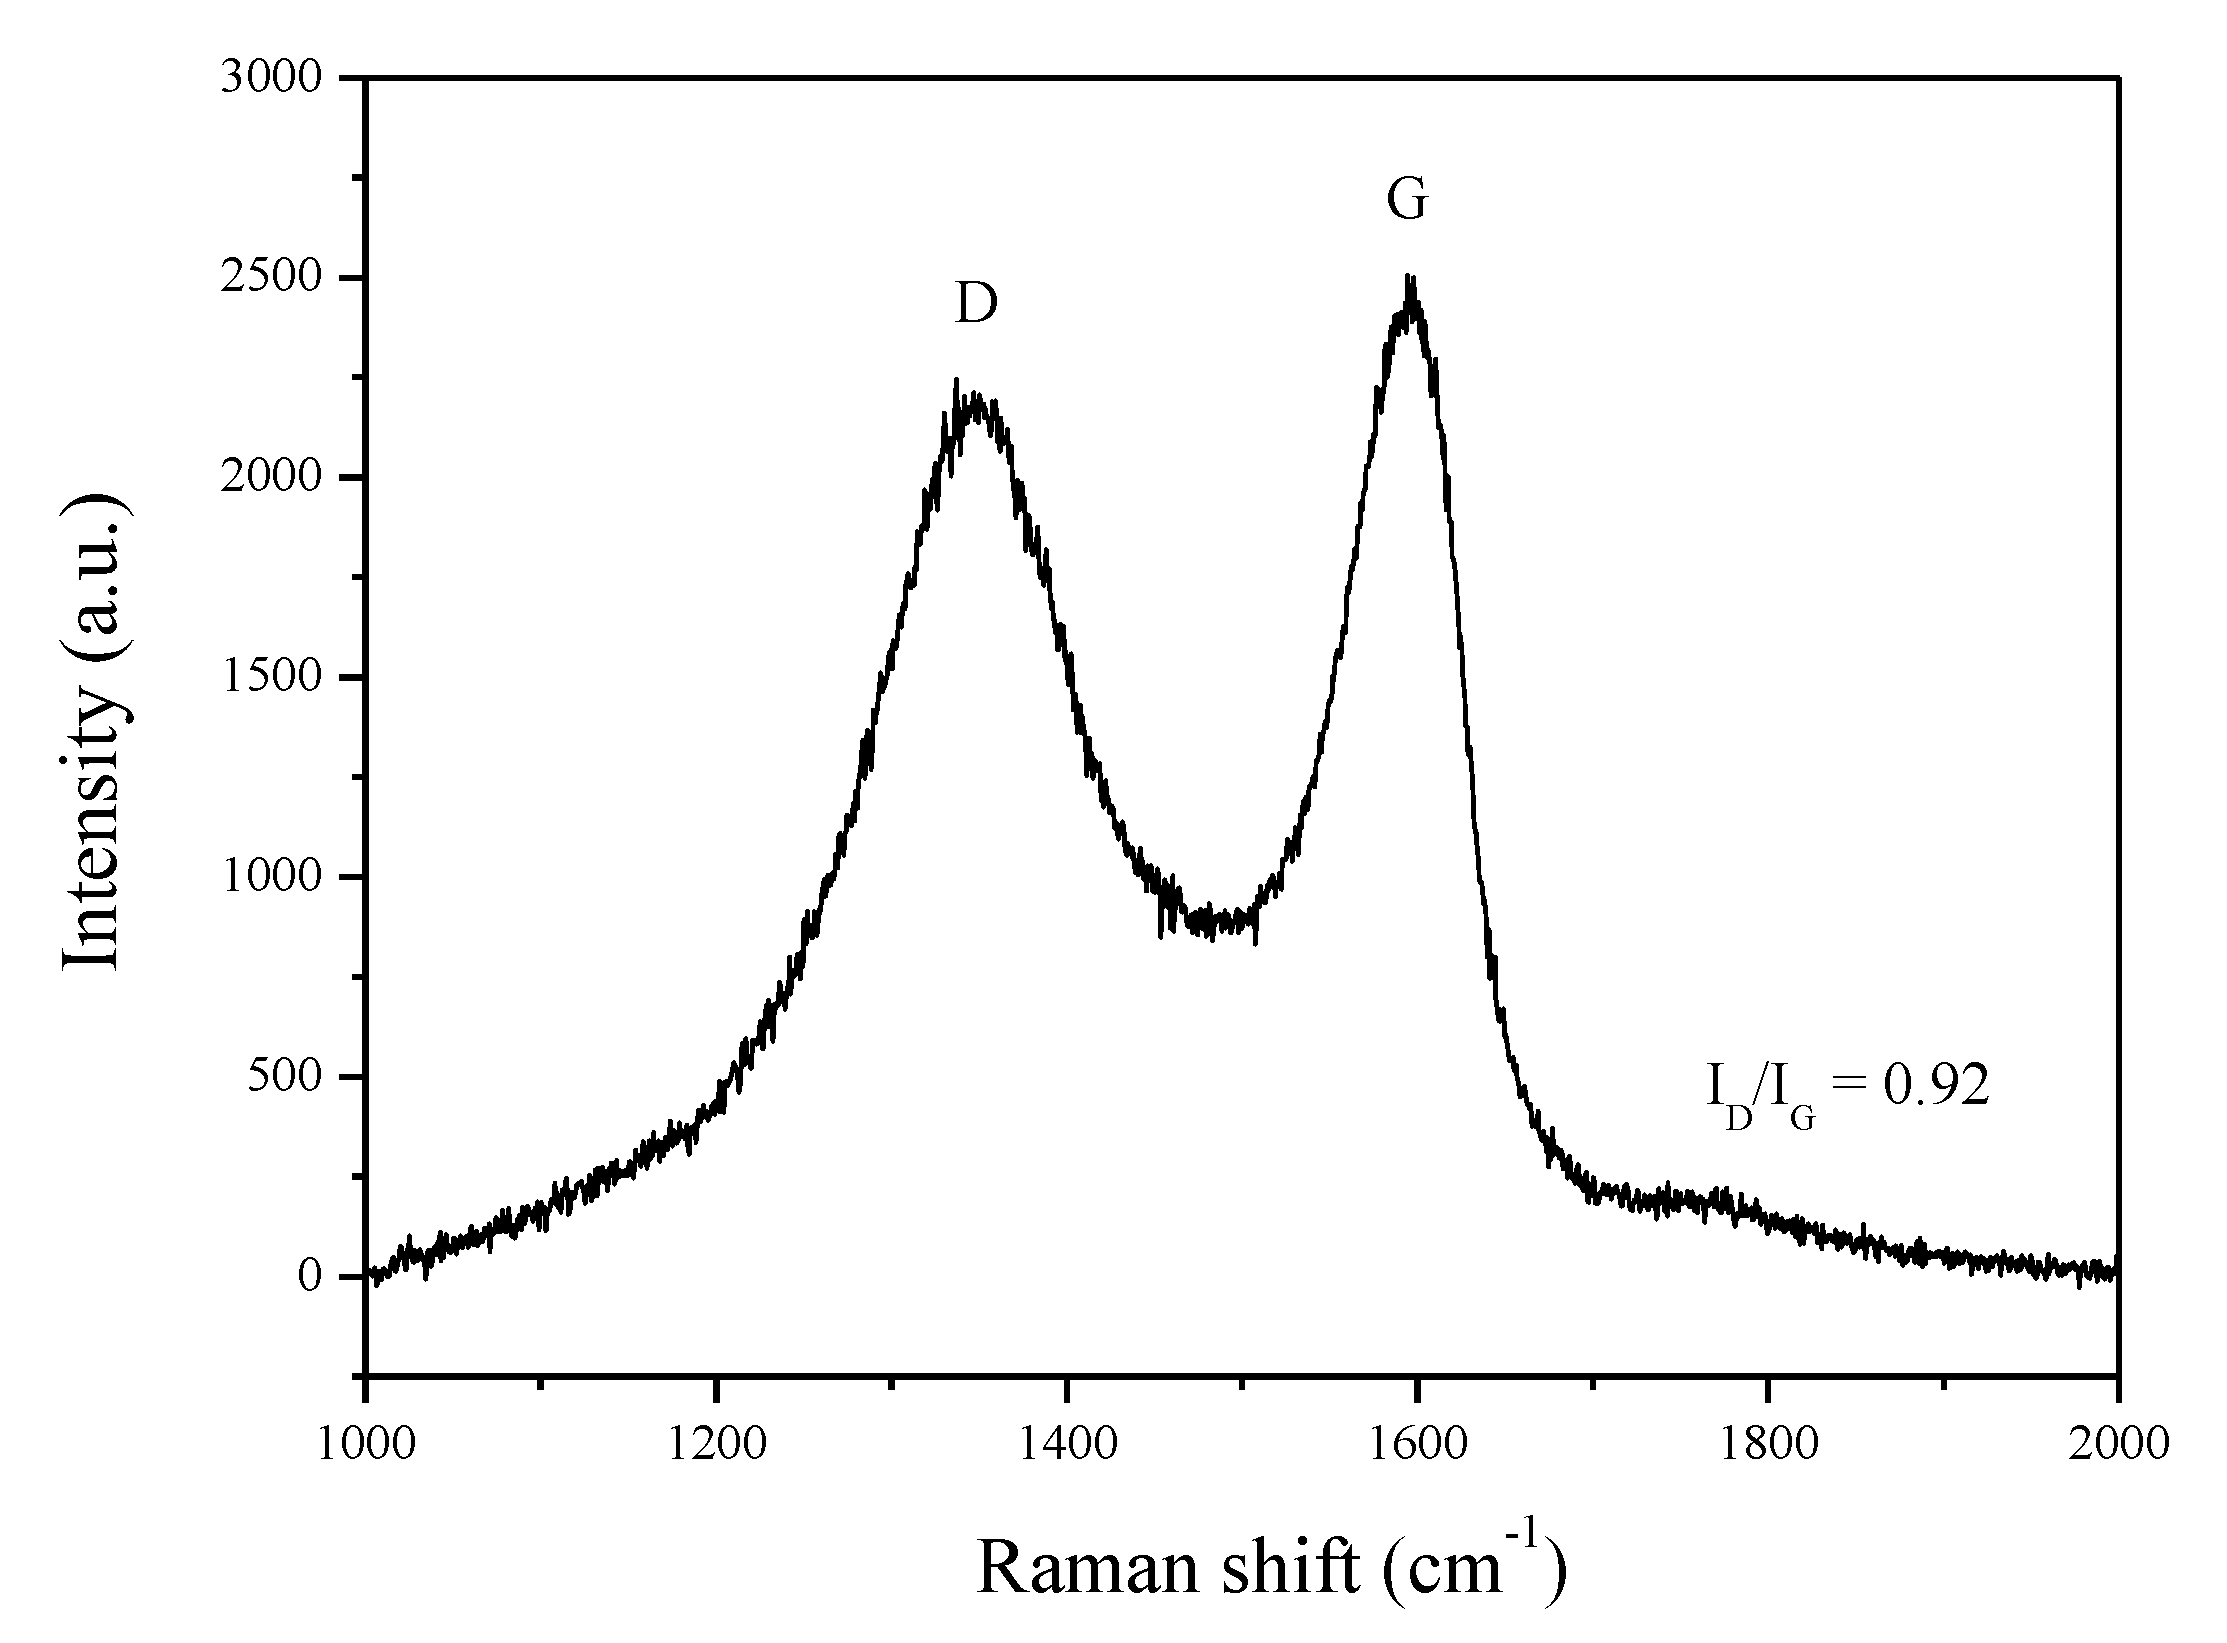
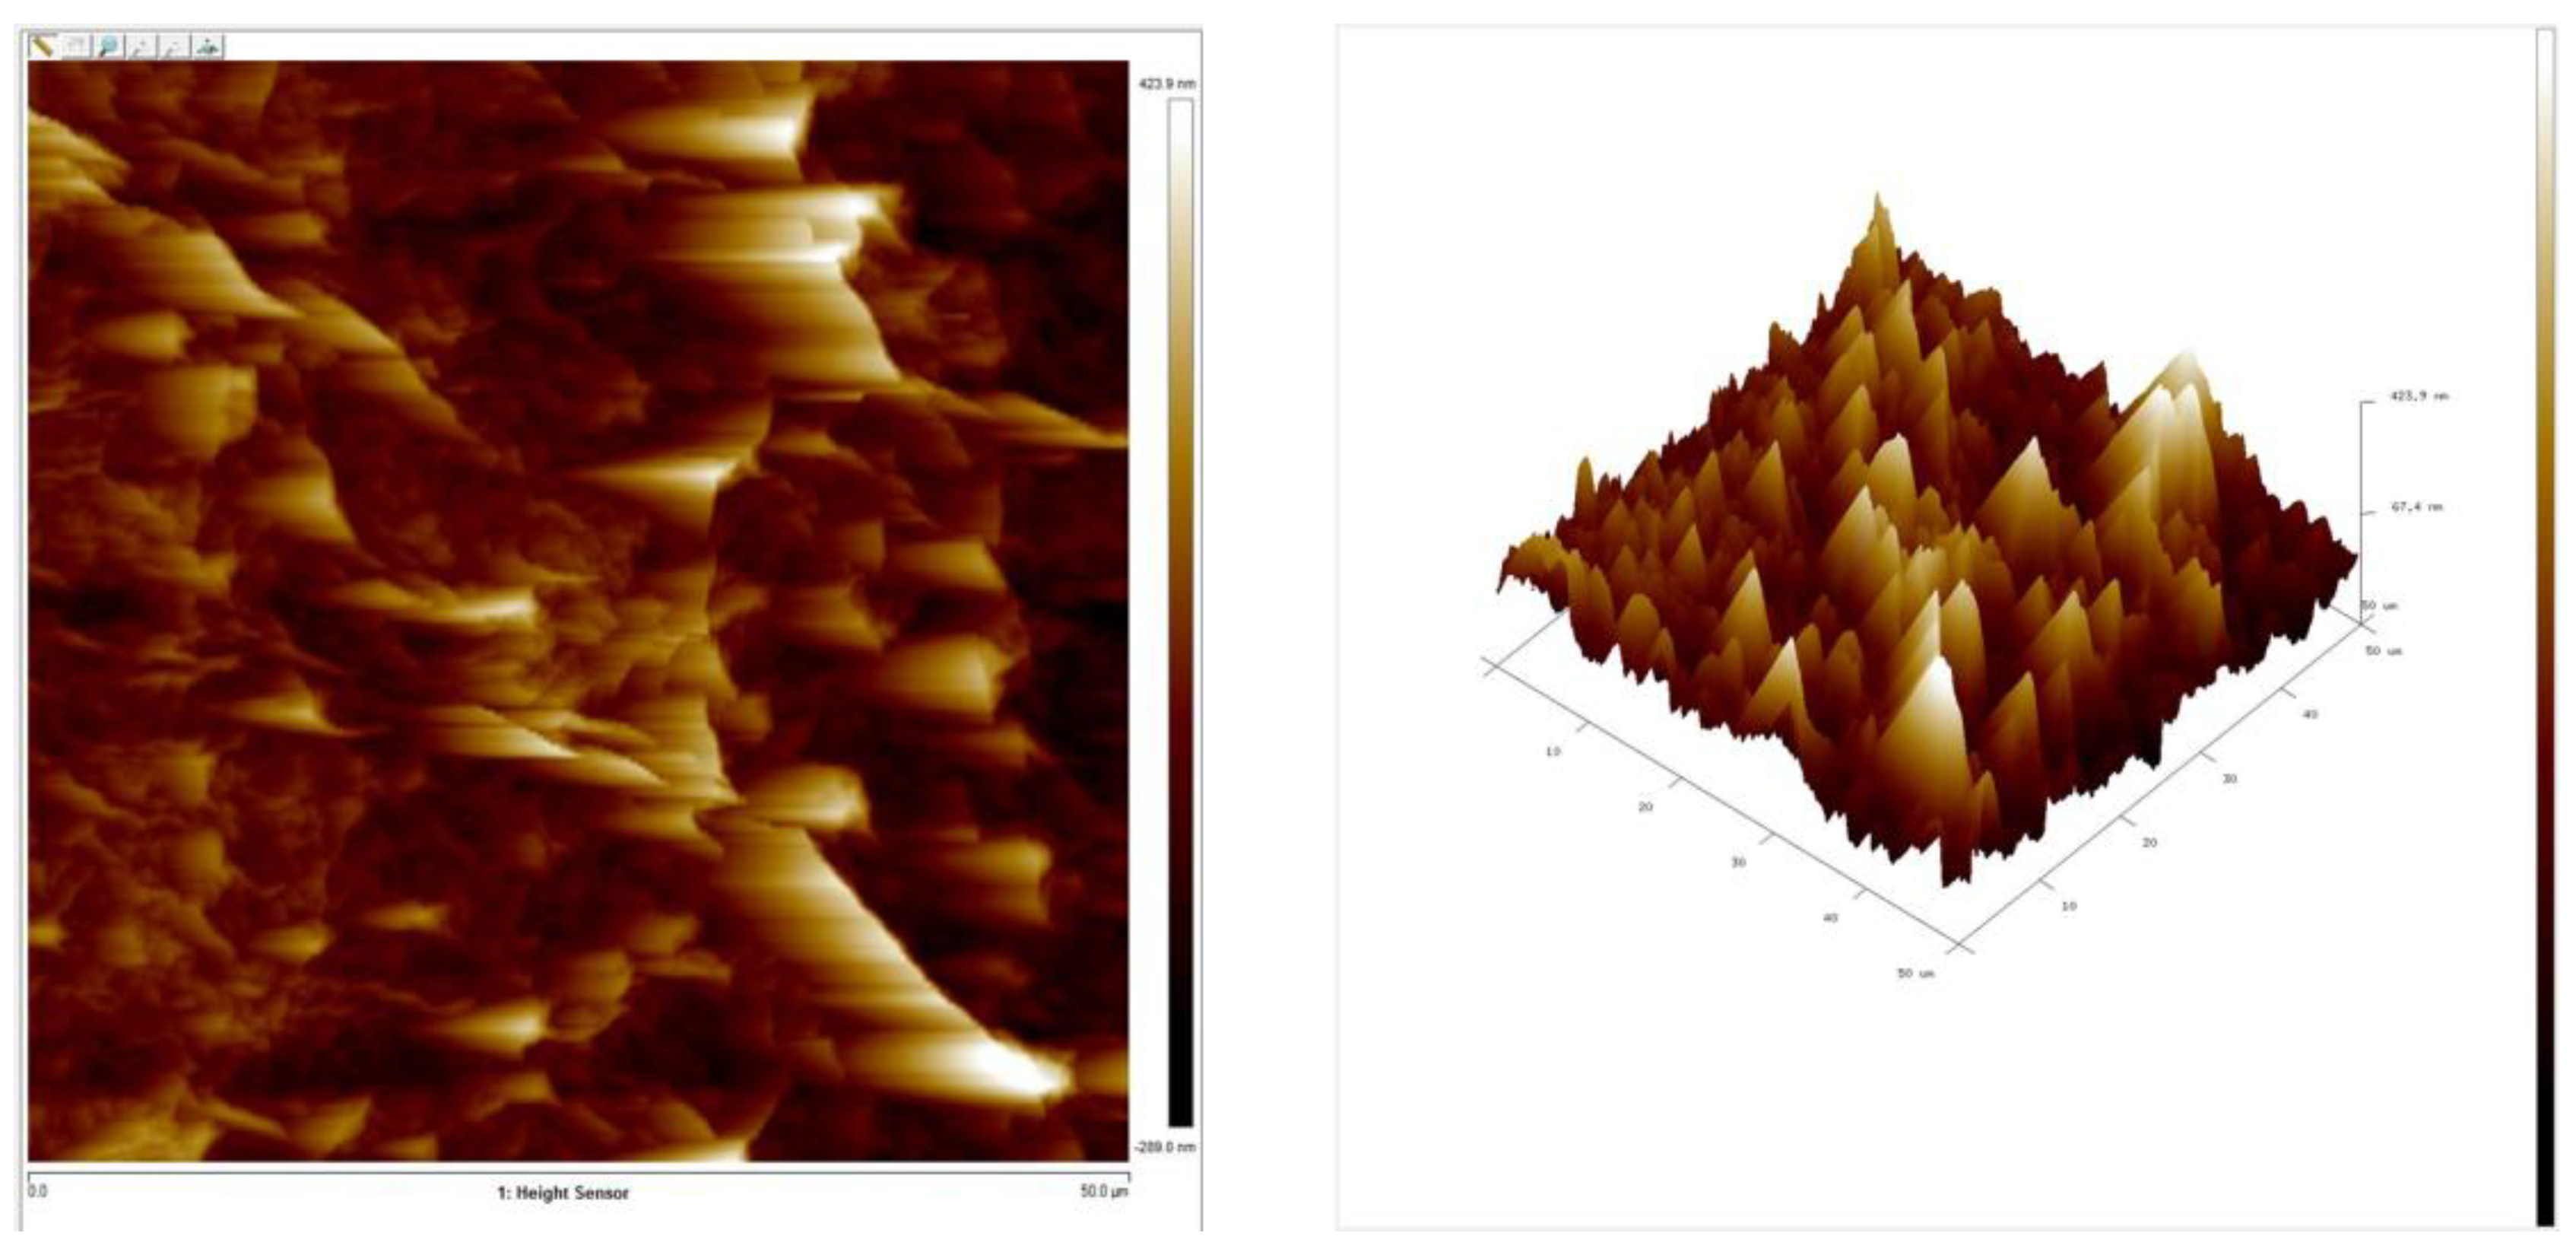
3.1. Raman Spectroscopy of GO and Morphology of Membrane

The synthesized GO was characterized by Raman spectroscopy. Raman spectroscopy is an analytical technique for characterizing the differences between sp2 and sp3 hybridization in carbon materials [33]. The Raman spectra of GO are characterized by a D band at approximately 1340 cm−1 and a G band at approximately 1590 cm−1 [34,35]. The D band represents the degree of defects on graphene sheets, resulting from the presence of sp3-carbon atoms; the G band is used to evaluate the graphitization degree, originating from in-plane vibrations of sp2-carbon atoms [34,35]. The intensity ratio of the D and G bands (ID/IG) is an index of the degree of defects on graphene [34,35,36]. As shown in Figure 4, the spectrum shows two obvious peaks of D (1347.89 cm−1) and G (1595.31 cm−1), and the value of ID/IG was 0.92. The results indicated the successful synthesis of GO.
The morphology of materials was characterized by using the FE-SEM and the optical microscope, as shown in Figure 5. From Figure 5a, the surface of a silver electrode, which was used as the conductive layer, was compact. After that, the ZnO and AZO were deposited onto the silver electrode by sputtering. As shown in Figure 5c–d, the ZnO and AZO showed a uniform and compact distribution of nanoparticles. The grain size of both films was nearly the same. In order to compare the differences between the ZnO membrane and the AZO membrane and to determine whether Al was successfully doped into the ZnO membrane, energy-dispersive X-ray spectroscopy (EDX) was used for the qualitative analysis of both membranes. In Figure S1, both EDX spectra all exhibited obvious Si, Pt, O, and Zn peaks. Si and Pt peaks were originated from Si substrates and the preparation of samples, respectively. In Figure S1b, a small Al peak could be found next to the Si peak. This is due to the light doping of the AZO target (Al:ZnO = 2 wt%:98 wt%). The results indicated that the AZO membrane was successfully deposited by sputtering, and there is a difference compared to the ZnO membrane. In Figure 5b, the GO membrane exhibited a highly crumpled surface with jagged wrinkles across the surface. These wrinkles increased the surface roughness of the membrane, which could provide numerous active sites to facilitate the adsorption of ions onto the membrane. Furthermore, the morphology of the GO membrane was further characterized by the 2D and 3D atomic force microscope (AFM) images, as determined by using an SPM. Figure 6 shows an array composed of jagged carbon flakes. The GO membrane exhibited a quite high roughness average (Ra) of 75 nm and root mean roughness (Rq) of 99 nm, as determined by the surface roughness analysis. It was reported that the large surface roughness of the electrode was responsible for the good sensing characteristics of a sensor [37]. From these results, the GO membrane with high Ra and Rq might play an indispensable role in the potentiometric arrayed glucose biosensors.

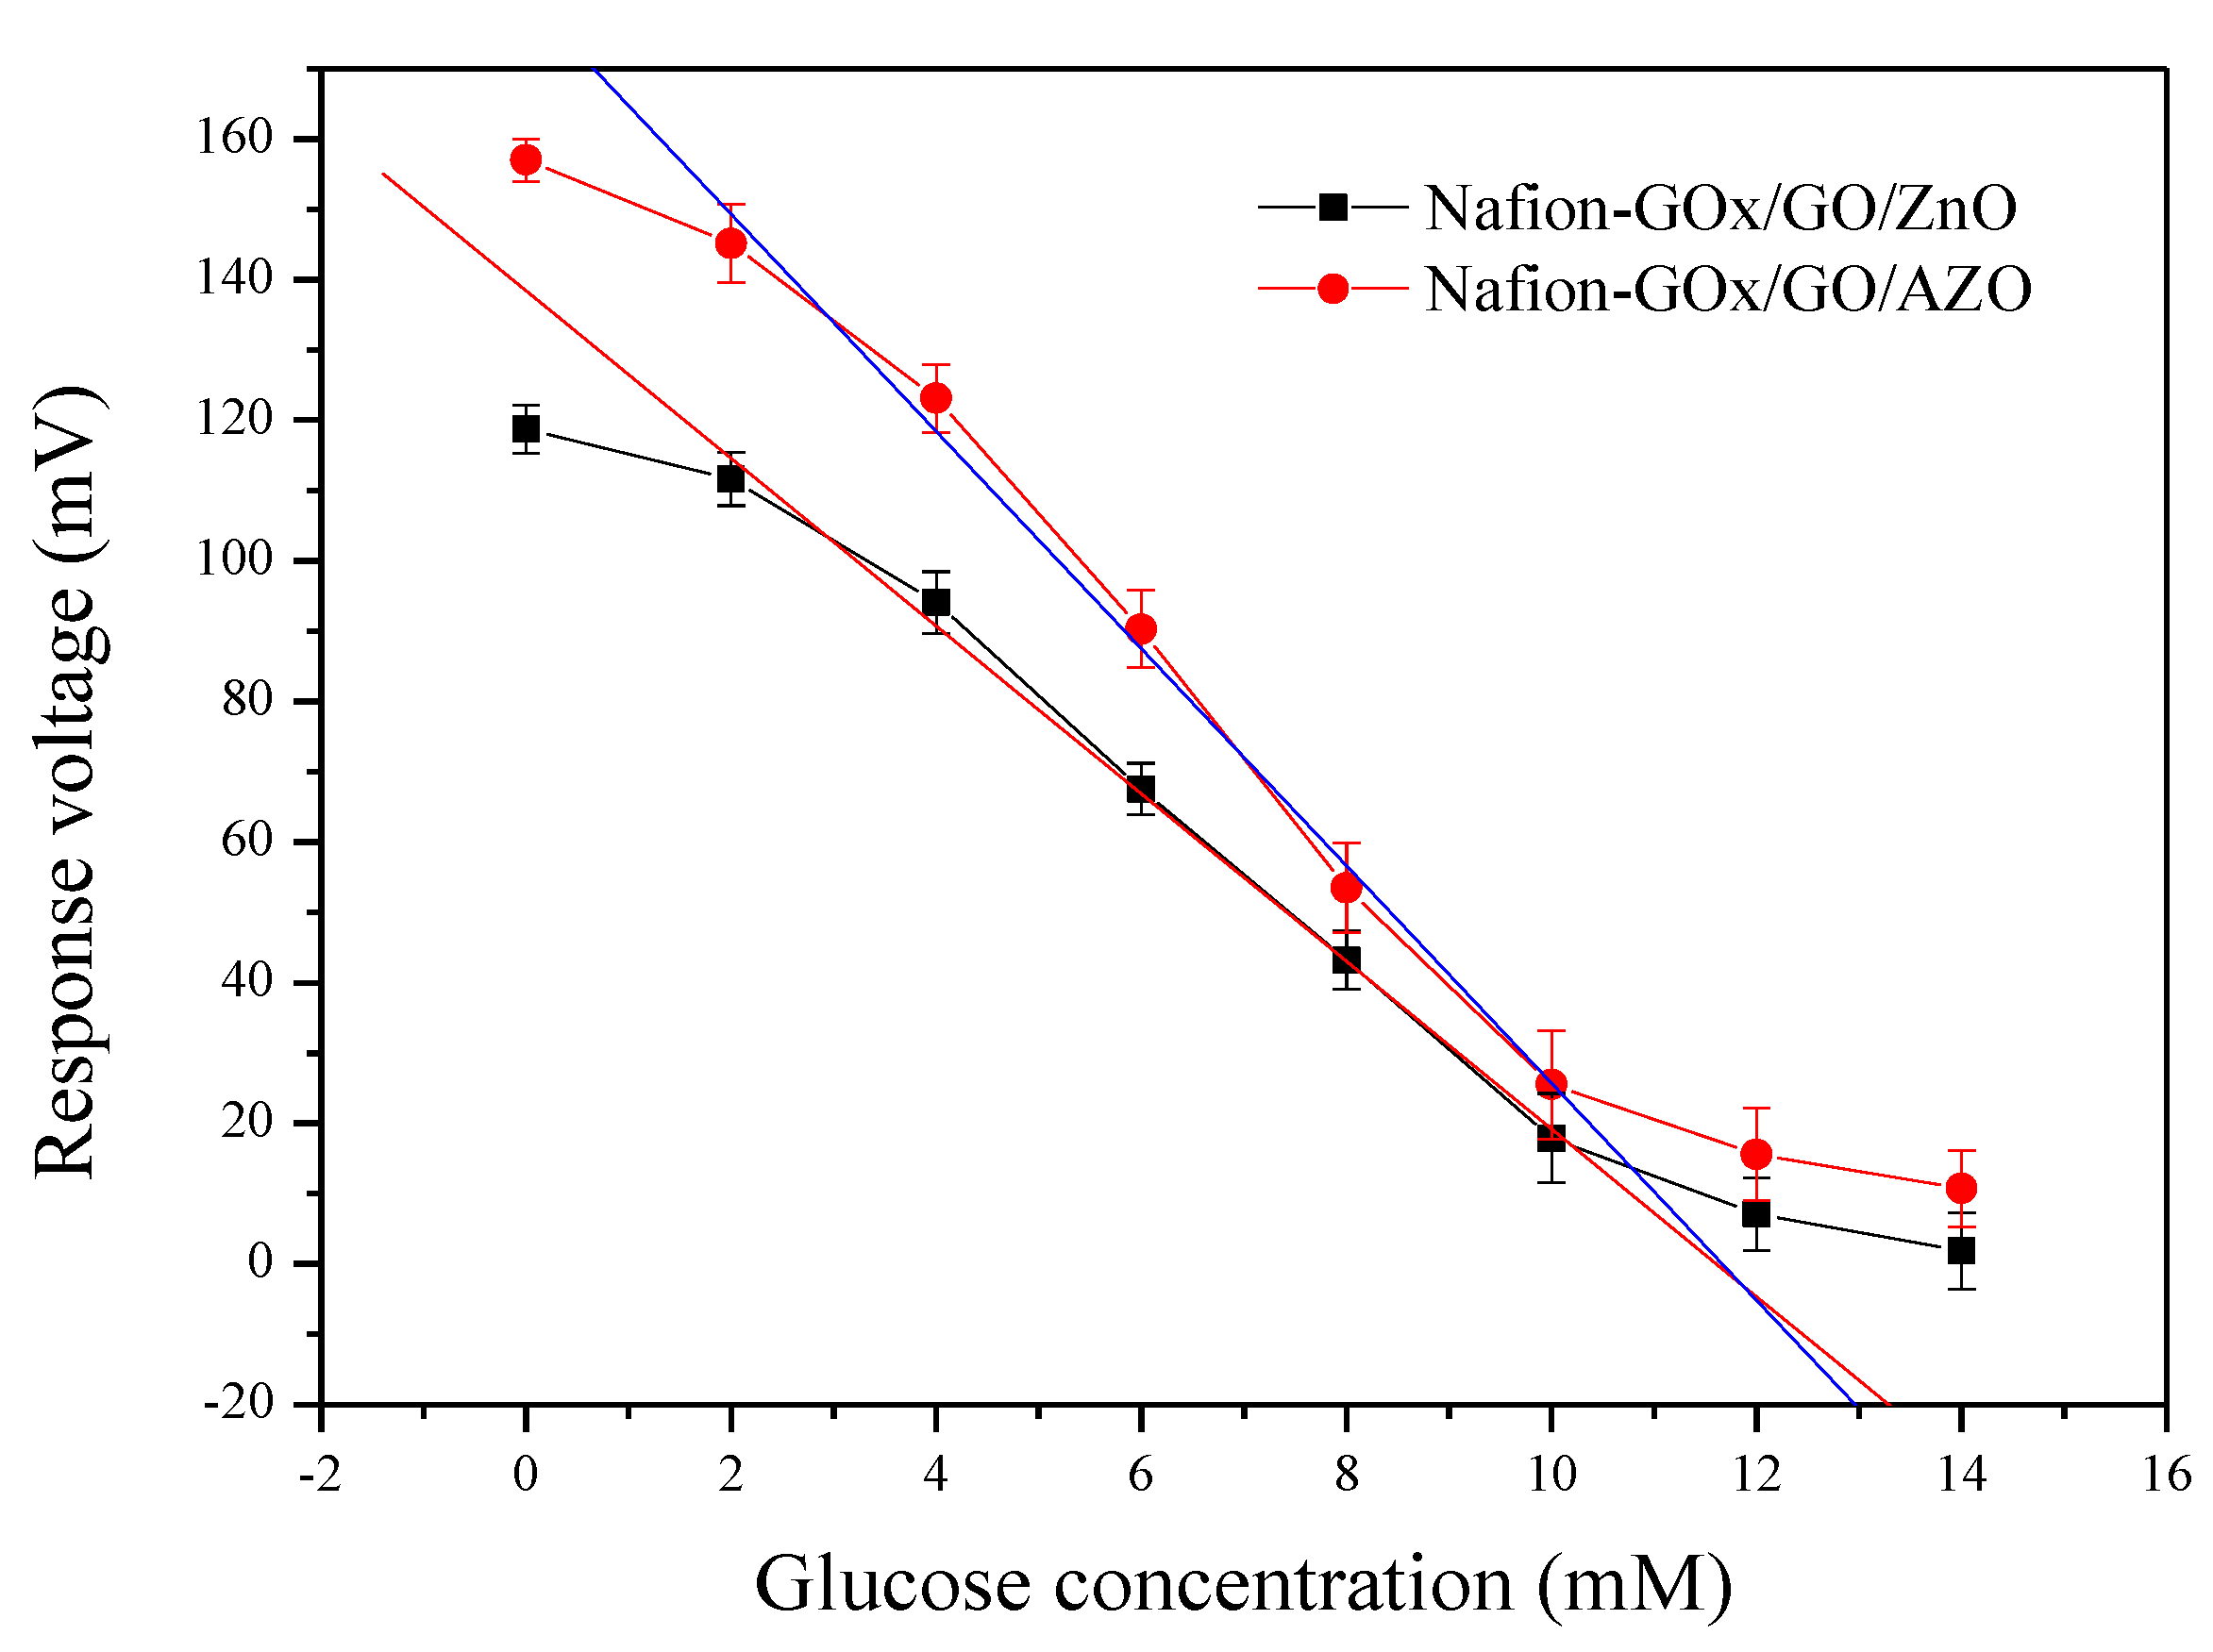
3.2. Average Sensitivity, Linearity, LOD, and Response Time of Potentiometric Arrayed Glucose Biosensors

The sensing mechanism of the potentiometric biosensor follows the Nernst Equation (2) [38]:
E   =   E 0   +   RT F ln [ a H + ]   =   E 0     2 . 303 RT F   pH
where E is the electromotive force (EMF), E0 is the standard potential of the reference electrode, R is the gas constant, T is the temperature in Kelvins, F is the Faraday’s constant, and pH is the pH of the electrolyte. The sensing mechanism of most potentiometric glucose biosensors is based on an enzymatic reaction catalyzed by glucose oxidase (GOx) according to Formulas (3) and (4) [8]:
H 2 O + O 2 + glucose GOx δ gluconolactone + H 2 O 2
δ gluconolactone spontaneous gluconate + H +
As shown in Formulas (1) and (2), δ-gluconolactone and hydrogen peroxide were produced after the enzymatic reaction was catalyzed by GOx. The produced δ-gluconolactone spontaneously converted to gluconate ions and hydrogen ions (H+). Owing to the local variation of H+ in the microsurroundings of a membrane, the different surface potentials are formed further. When the potentiometric arrayed glucose biosensor was measured over a low glucose concentration, the pH of the microsurroundings of a membrane was high; the negative value of E was larger according to Equation (2), and vice versa. Based on Equation (1), the obtained negative value was converted into a positive value via LT1167. This is the sensing mechanism by which the potentiometric glucose arrayed biosensor detects glucose.
The response characteristics of the biosensors based on Nafion-GOx/GO/ZnO or Nafion-GOx/GO/AZO were measured in 0.1 M PBS (pH 7.0) solutions with different glucose concentrations, ranging from 0 to 14 mM, by using the V-T measurement system. The average response voltages (mean) and the error bars (standard deviation, SD) were obtained from the response voltages of the six windows (1.77 mm2), and then the average sensitivity and linearity were calculated by Origin 7.0. Next, the average sensitivities and linearities of both types of sensors were recorded and analyzed. As shown in Figure 7, the glucose biosensors over a glucose concentration range (2–10 mM) exhibited a linear variation in the response voltages. When the glucose concentration was out of this range, the variation in response voltages was reduced, i.e., the response curve was flatter. Therefore, the linear range of the glucose biosensors was 2–10 mM. In addition, the difference between intervals over the tested glucose concentration range (2–10 mM) were extremely significant, according to the results shown in Table S1. As shown in Figure 7 and Table 1, the glucose biosensor based on Nafion-GOx/GO/AZO performed well, with excellent average sensitivity (15.44 mV/mM), which was markedly higher than that of the glucose biosensor based on Nafion-GOx/GO/ZnO (11.92 mV/mM). The enhancement of the average sensitivity can be attributed to the electrical conductivity of the matrix. By doping a small amount (2 wt%) of Al into ZnO, Al3+ ions replaced Zn2+ ions in the ZnO lattice, resulting in the lower electrical resistivity of ZnO, thereby improving the sensing characteristics. Apart from this, the level of the response voltages was shifted upward when AZO was used as the matrix of the glucose biosensor.
After determining the average sensitivity of the potentiometric arrayed glucose biosensor based on Nafion-GOx/GO/AZO, the response time and limit of detection (LOD) were then characterized via the V-T measurement system. In order to determine the baseline of the biosensor, the response voltage of the biosensor was measured in pure 0.1 M PBS solutions (pH 7.0) without glucose (measurement times, N = 7); the baseline of the potentiometric glucose biosensor is 157.02 ± 2.01 mV, as shown in Table 1. According to the obtained baseline, the LOD of the potentiometric glucose biosensor was calculated, which was the lowest concentration for the detection of analytes at a specified signal-to-noise ratio (S/N = 3) [39,40]. The LOD was 1.89 mM, which the value was in accordance with the measured results. Finally, the 5 mM glucose was added into a pure PBS solution (pH 7.0) to examine the response time of the potentiometric arrayed glucose biosensor. The response time was the period of time required to achieve 95% of the steady state (containing analytes) from the origin state (without analytes) over the whole concentration range [41]. According to the experimental results, the response time of the potentiometric arrayed glucose biosensor based on Nafion-GOx/GO/AZO was 26 s.

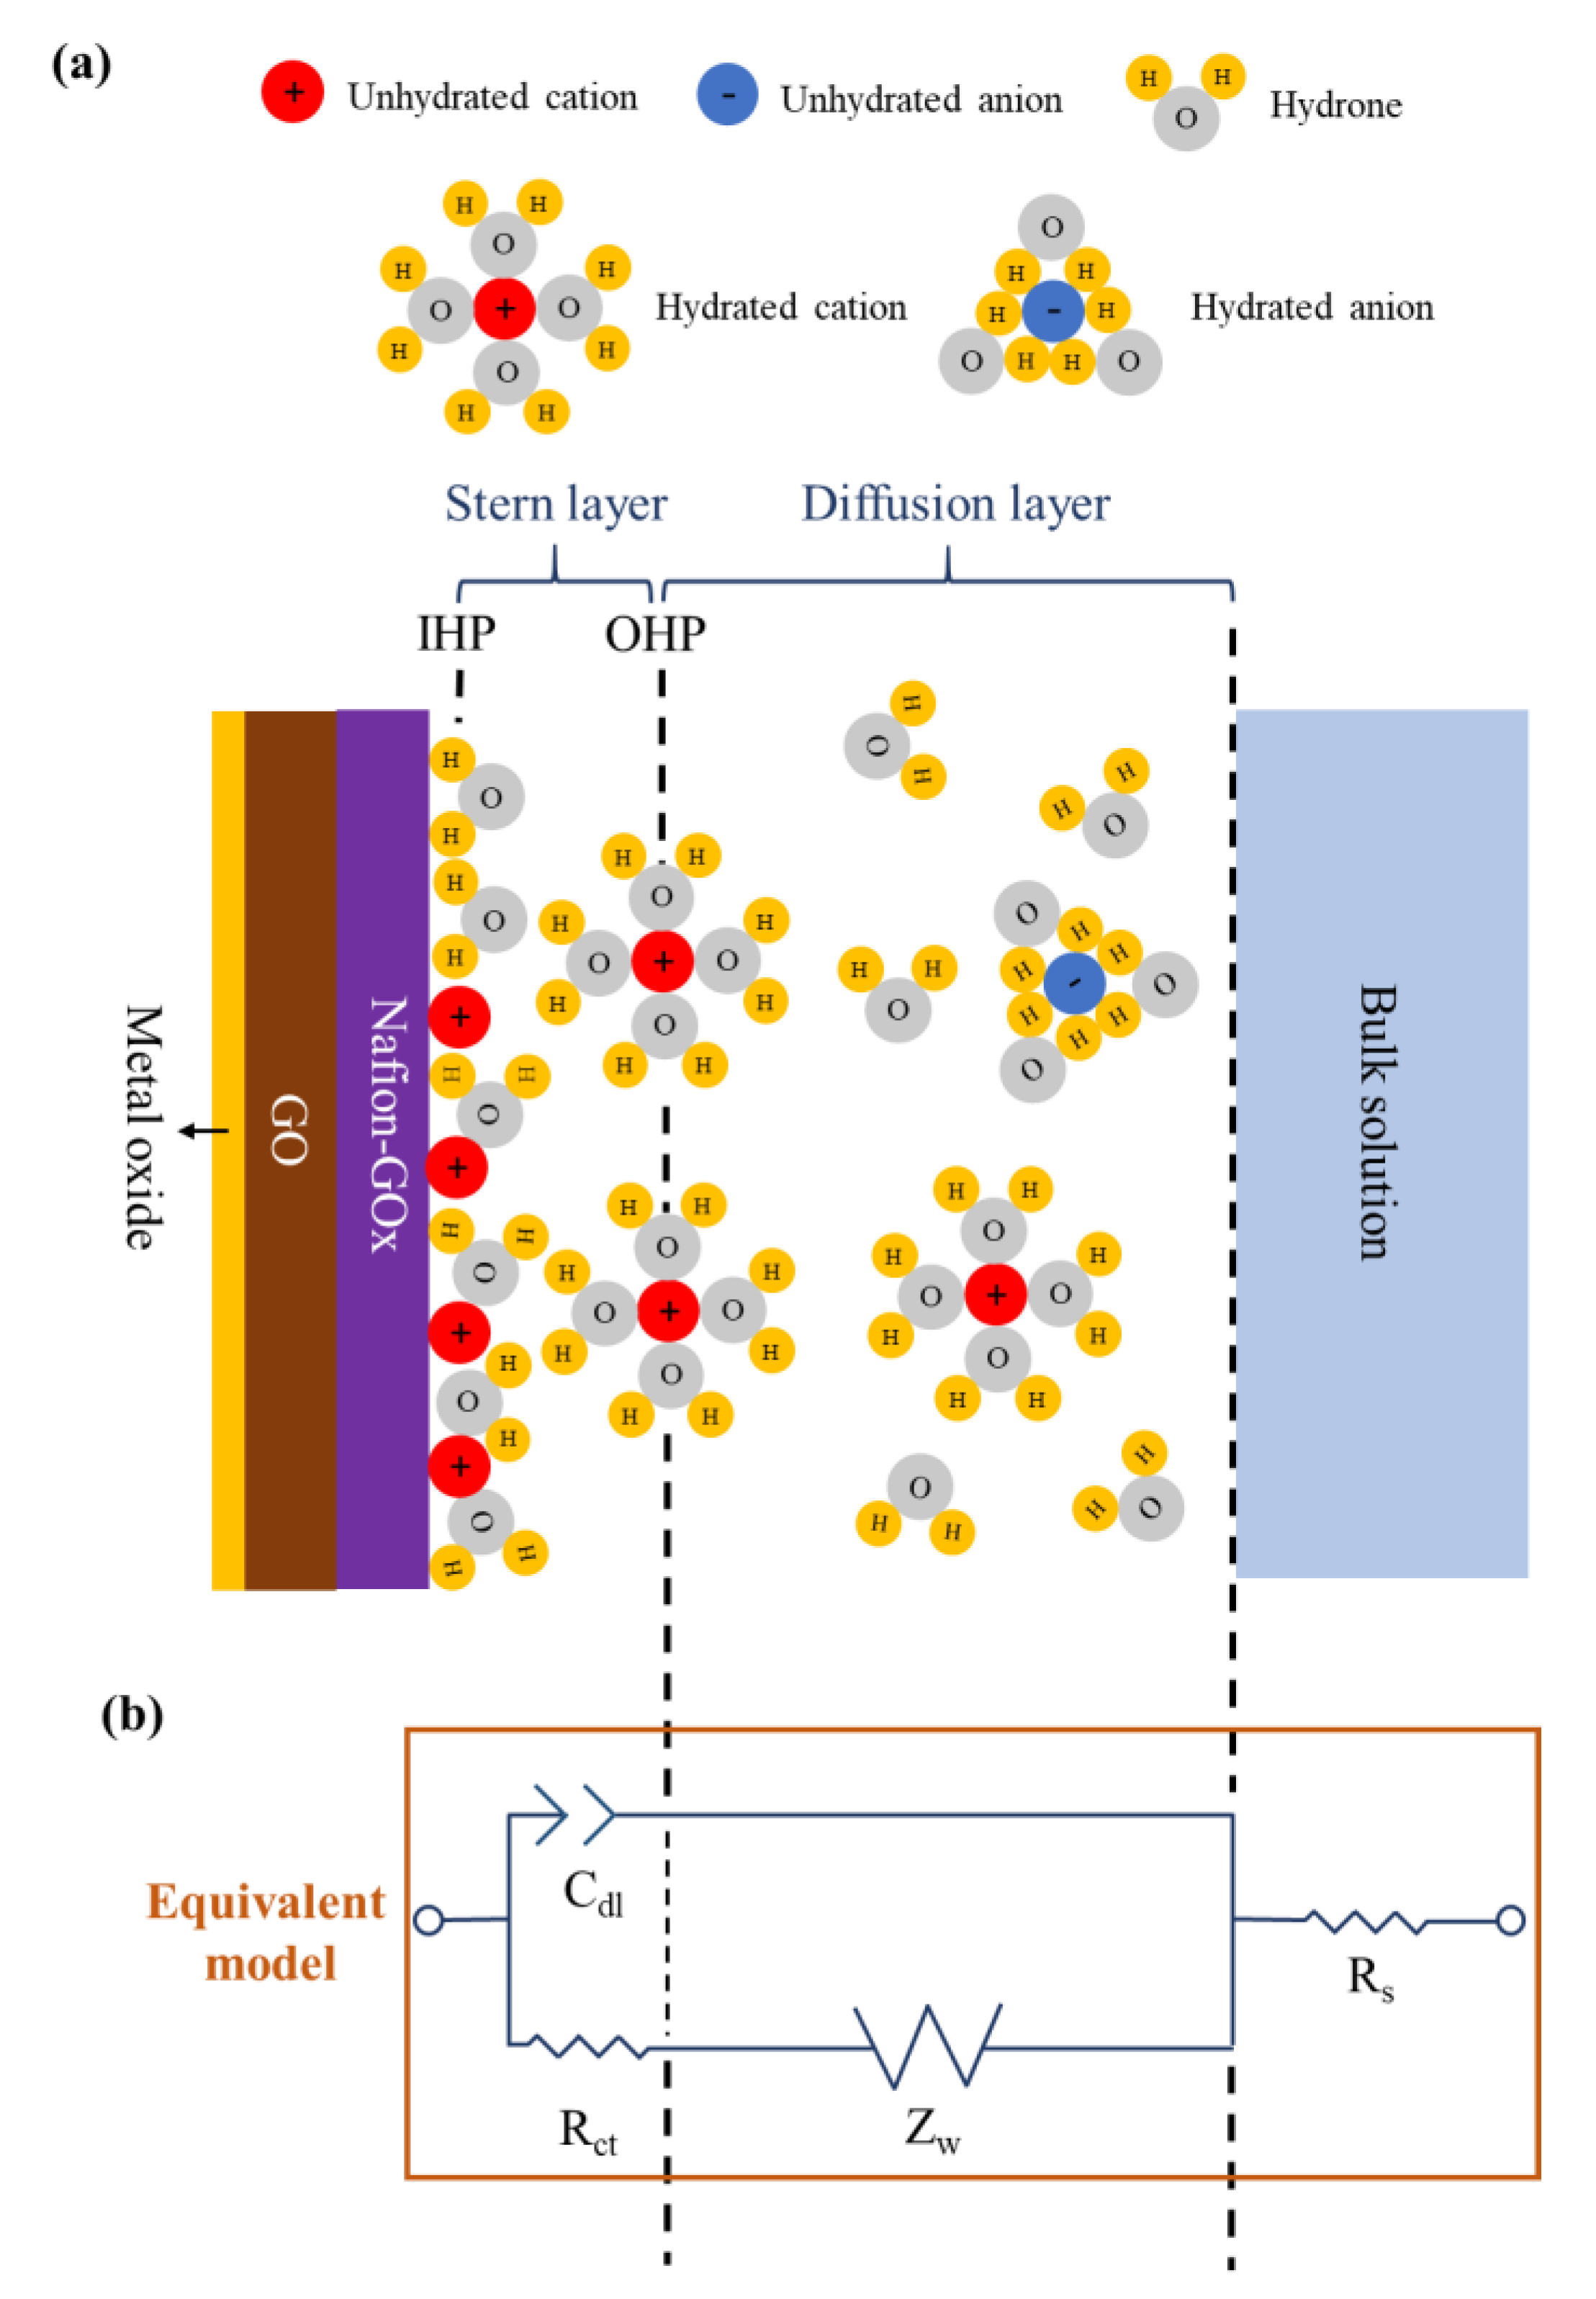
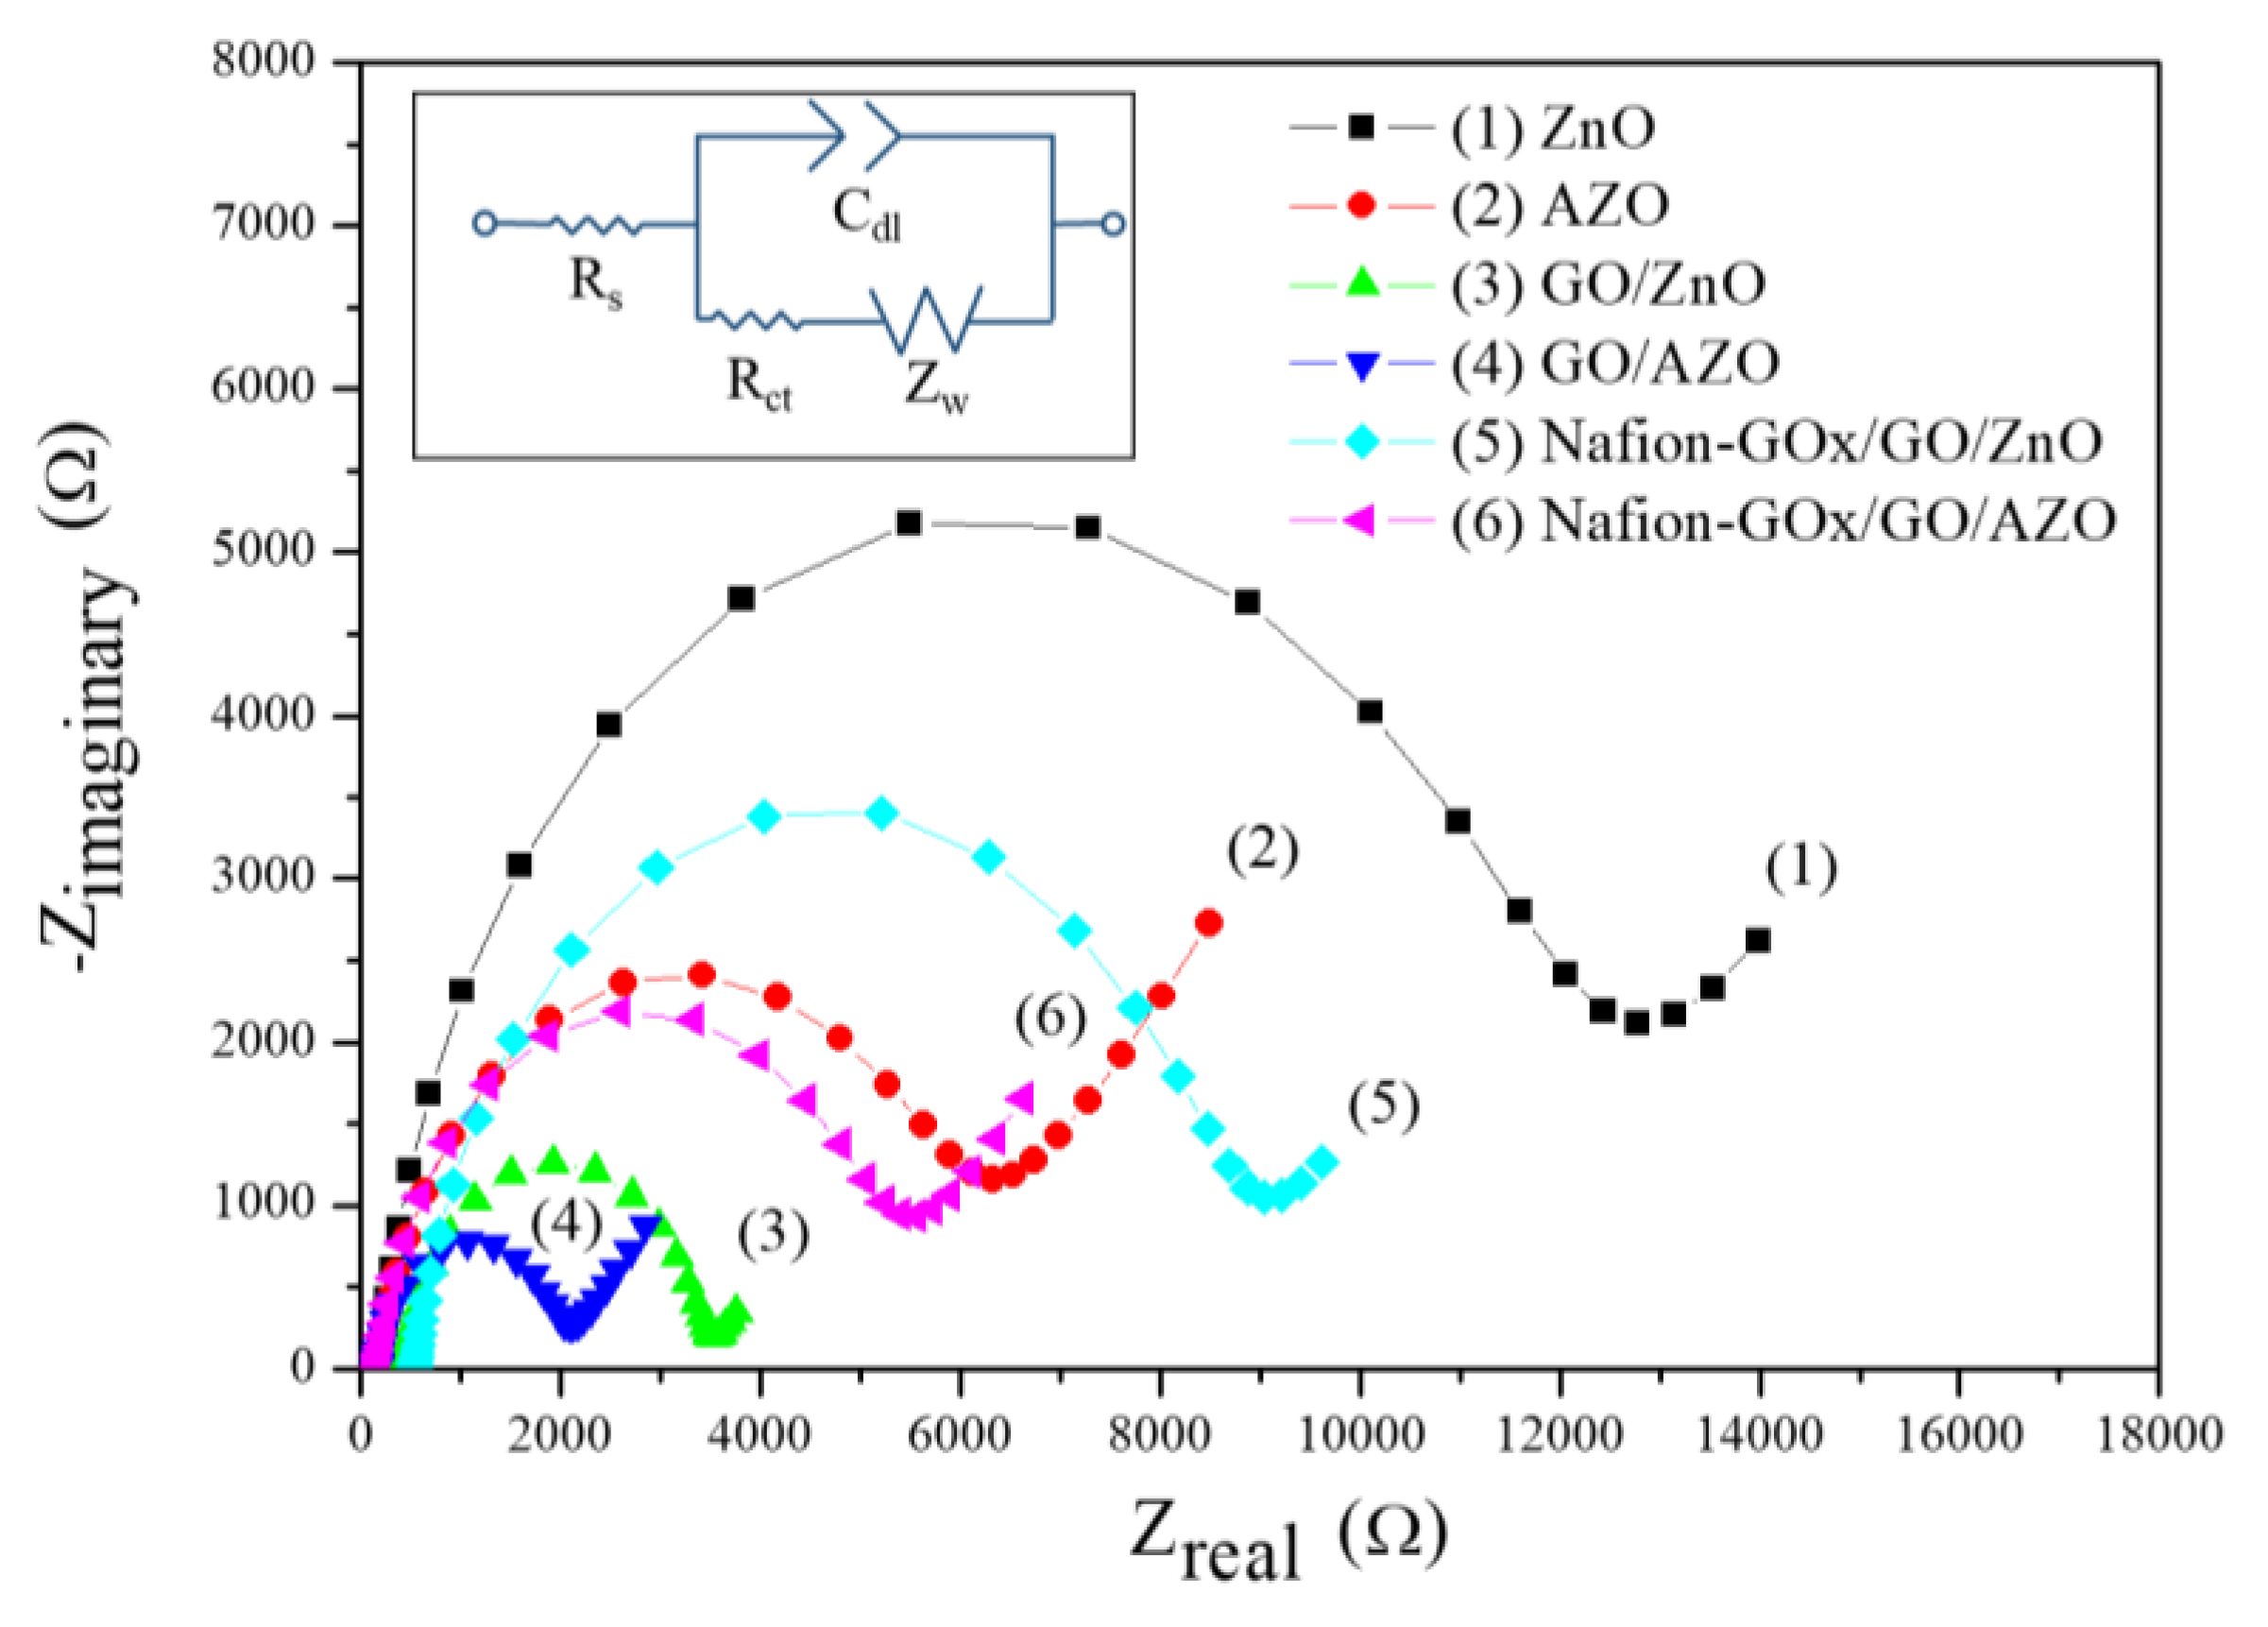
3.3. Electrochemical Impedance Spectroscopy

Electrochemical impedance spectroscopy (EIS) detects variations in electrochemical impedance within an electrochemical system by applying alternating current (AC) signals with different frequencies through an electrode, and an equivalent circuit model is used to describe the electrochemical impedance of the interface [42,43,44]. The membrane–solution interface can be described by the Stern–Grahame model [44], as shown in Figure 8a. The equivalent circuit model is shown in Figure 8b, the solution resistance (Rs) represents the solution resistance within the working electrode and the reference electrode; the charge transfer resistance (Rct) represents the transfer process of charges within the electrodes and the electroactive species when the electrochemical reaction occurs; the double-layer capacitance (Cdl) represents the electrical double layer (EDL) on the electrode surface; the Warburg impedance (ZW) represents the diffusion layer formed by ions in the solution. In this study, the focus of our investigation was Rct, i.e., the charge transfer ability of the membranes.
As shown in Figure 9 and Table 2, the charge transfer resistance (Rct) of AZO was lower than the Rct of ZnO. The results are in accordance with the previous study [16]. Next, the membranes were further modified by GO. The results show that the semicircle diameters of the GO-modified membranes (GO/ZnO and GO/AZO) were smaller than those of the non-modified membranes (ZnO and AZO), which suggests that the presence of GO can facilitate the charge transfer between the solution and membrane. This is due to the superior electrocatalytic activity of GO [45], which decreases the Rct of the membrane. Finally, the GOx was immobilized on the membranes and immersed in a PBS solution (pH 7.0) containing 5 mM glucose to observe the variation of Rct. The Rct of the membranes was greatly increased. Even if the catalytic reactions occurred, the values of Rct were still higher than those obtained from bare membranes according to the results. The increase in Rct can be attributed to the non-conductivities of the enzyme and Nafion. This finding indicated that the GOx was steadily immobilized on the membrane, causing the obstruction of the charge transfer [46,47].

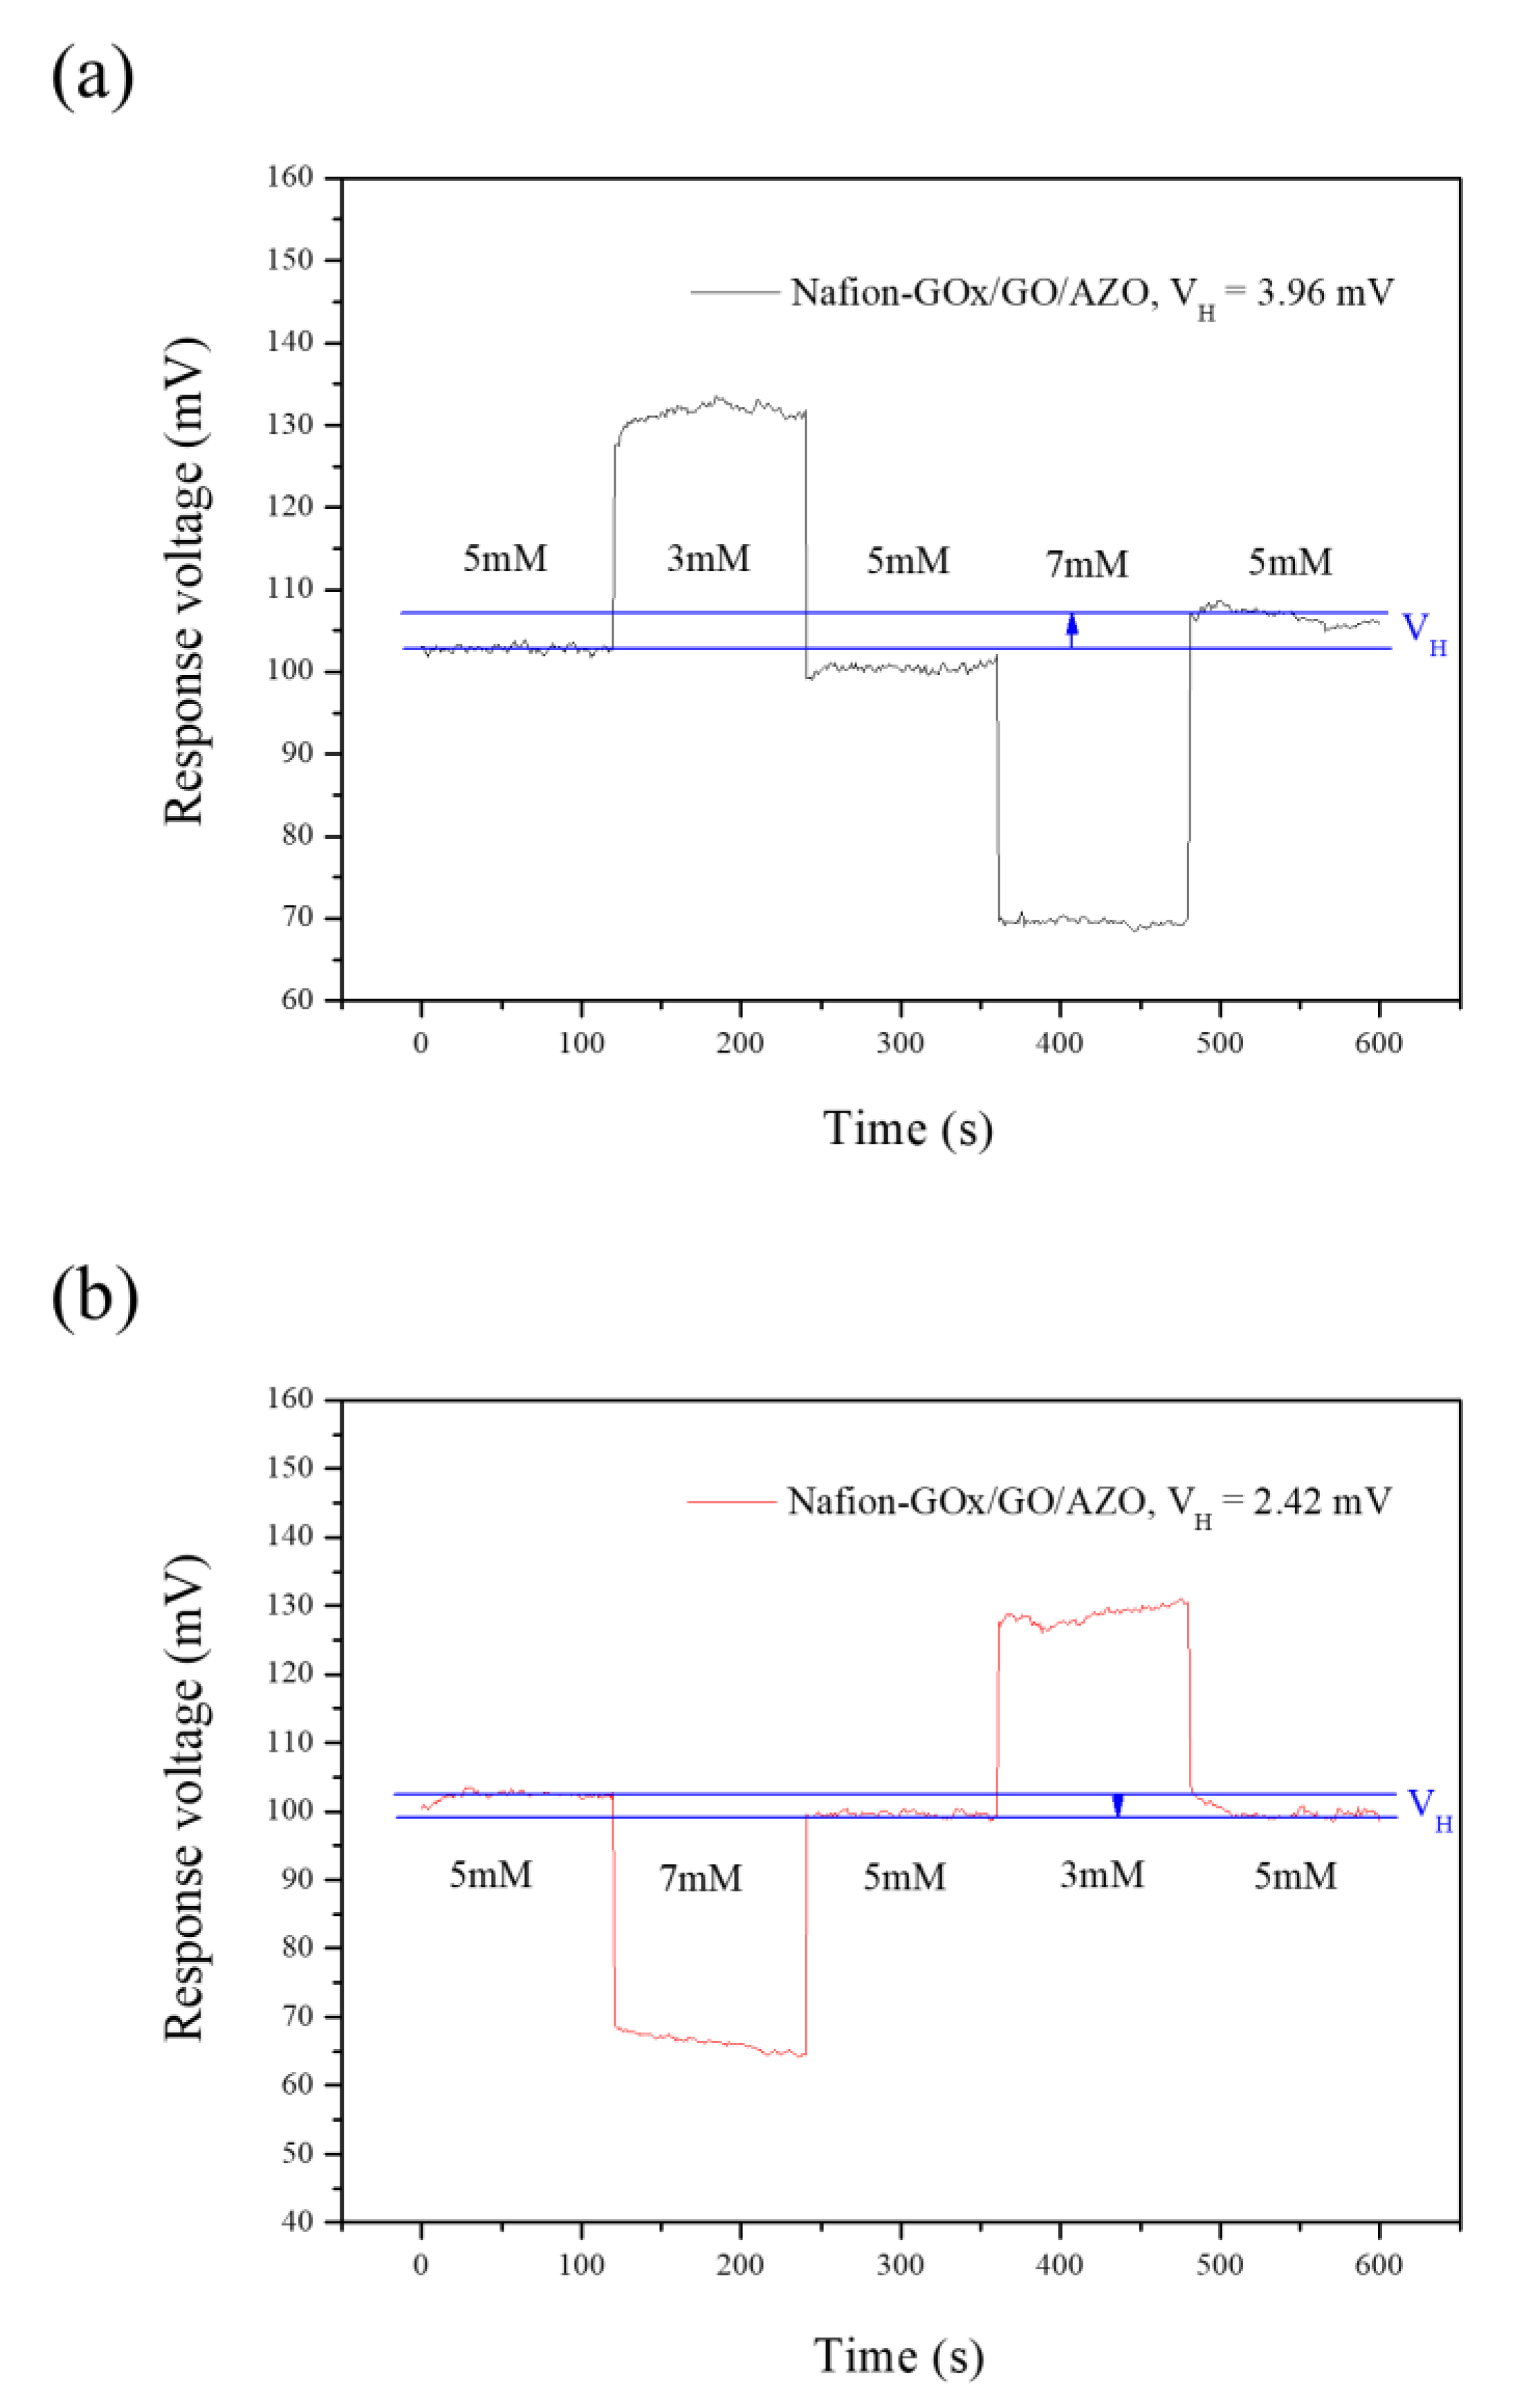
3.4. Hysteresis of Potentiometric Arrayed Glucose Biosensor Based on Nafion-GOx/GO/AZO

Hysteresis is a type of non-ideal memory effect response in a potentiometric biosensor, causing a delay in potential responses [48]. The phenomenon is due to the residual potential within the solid–liquid interface arising from hydrated ions during repeated measurements, thereby resulting in the errors of response output errors. Hysteresis curves can be used to evaluate the evaluation for the stability and reversibility of a potentiometric biosensor, where VH is the hysteresis voltage, which is defined as the voltage shift between initial response voltage and final response voltage [49].
The hysteresis curves of the potentiometric arrayed glucose biosensor based on Nafion-GOx/GO/AZO were obtained across multiple cycles of different glucose concentrations (5 mM → 3 mM→ 5 mM→ 7 mM→ 5 mM and 5 mM → 7 mM→ 5 mM→ 3 mM→ 5 mM), as shown in Figure 10. The VH were 3.96 mV and 2.42 mV in the forward cycle and reverse cycle, respectively. Although the local pH in the microsurrounding of electrodes was changed by the catalytic reaction of GOx, the residual potential arising from hydrated ions still caused some deviation in the response potential. The response potential did not change in accordance with expectations. This was due to the sudden change in glucose concentration, which caused a delay in the response. This phenomenon is inevitable in potentiometric biosensors. According to the VH values that were obtained, the potentiometric arrayed glucose biosensor based on Nafion-GOx/GO/AZO showed good reversibility and stability.

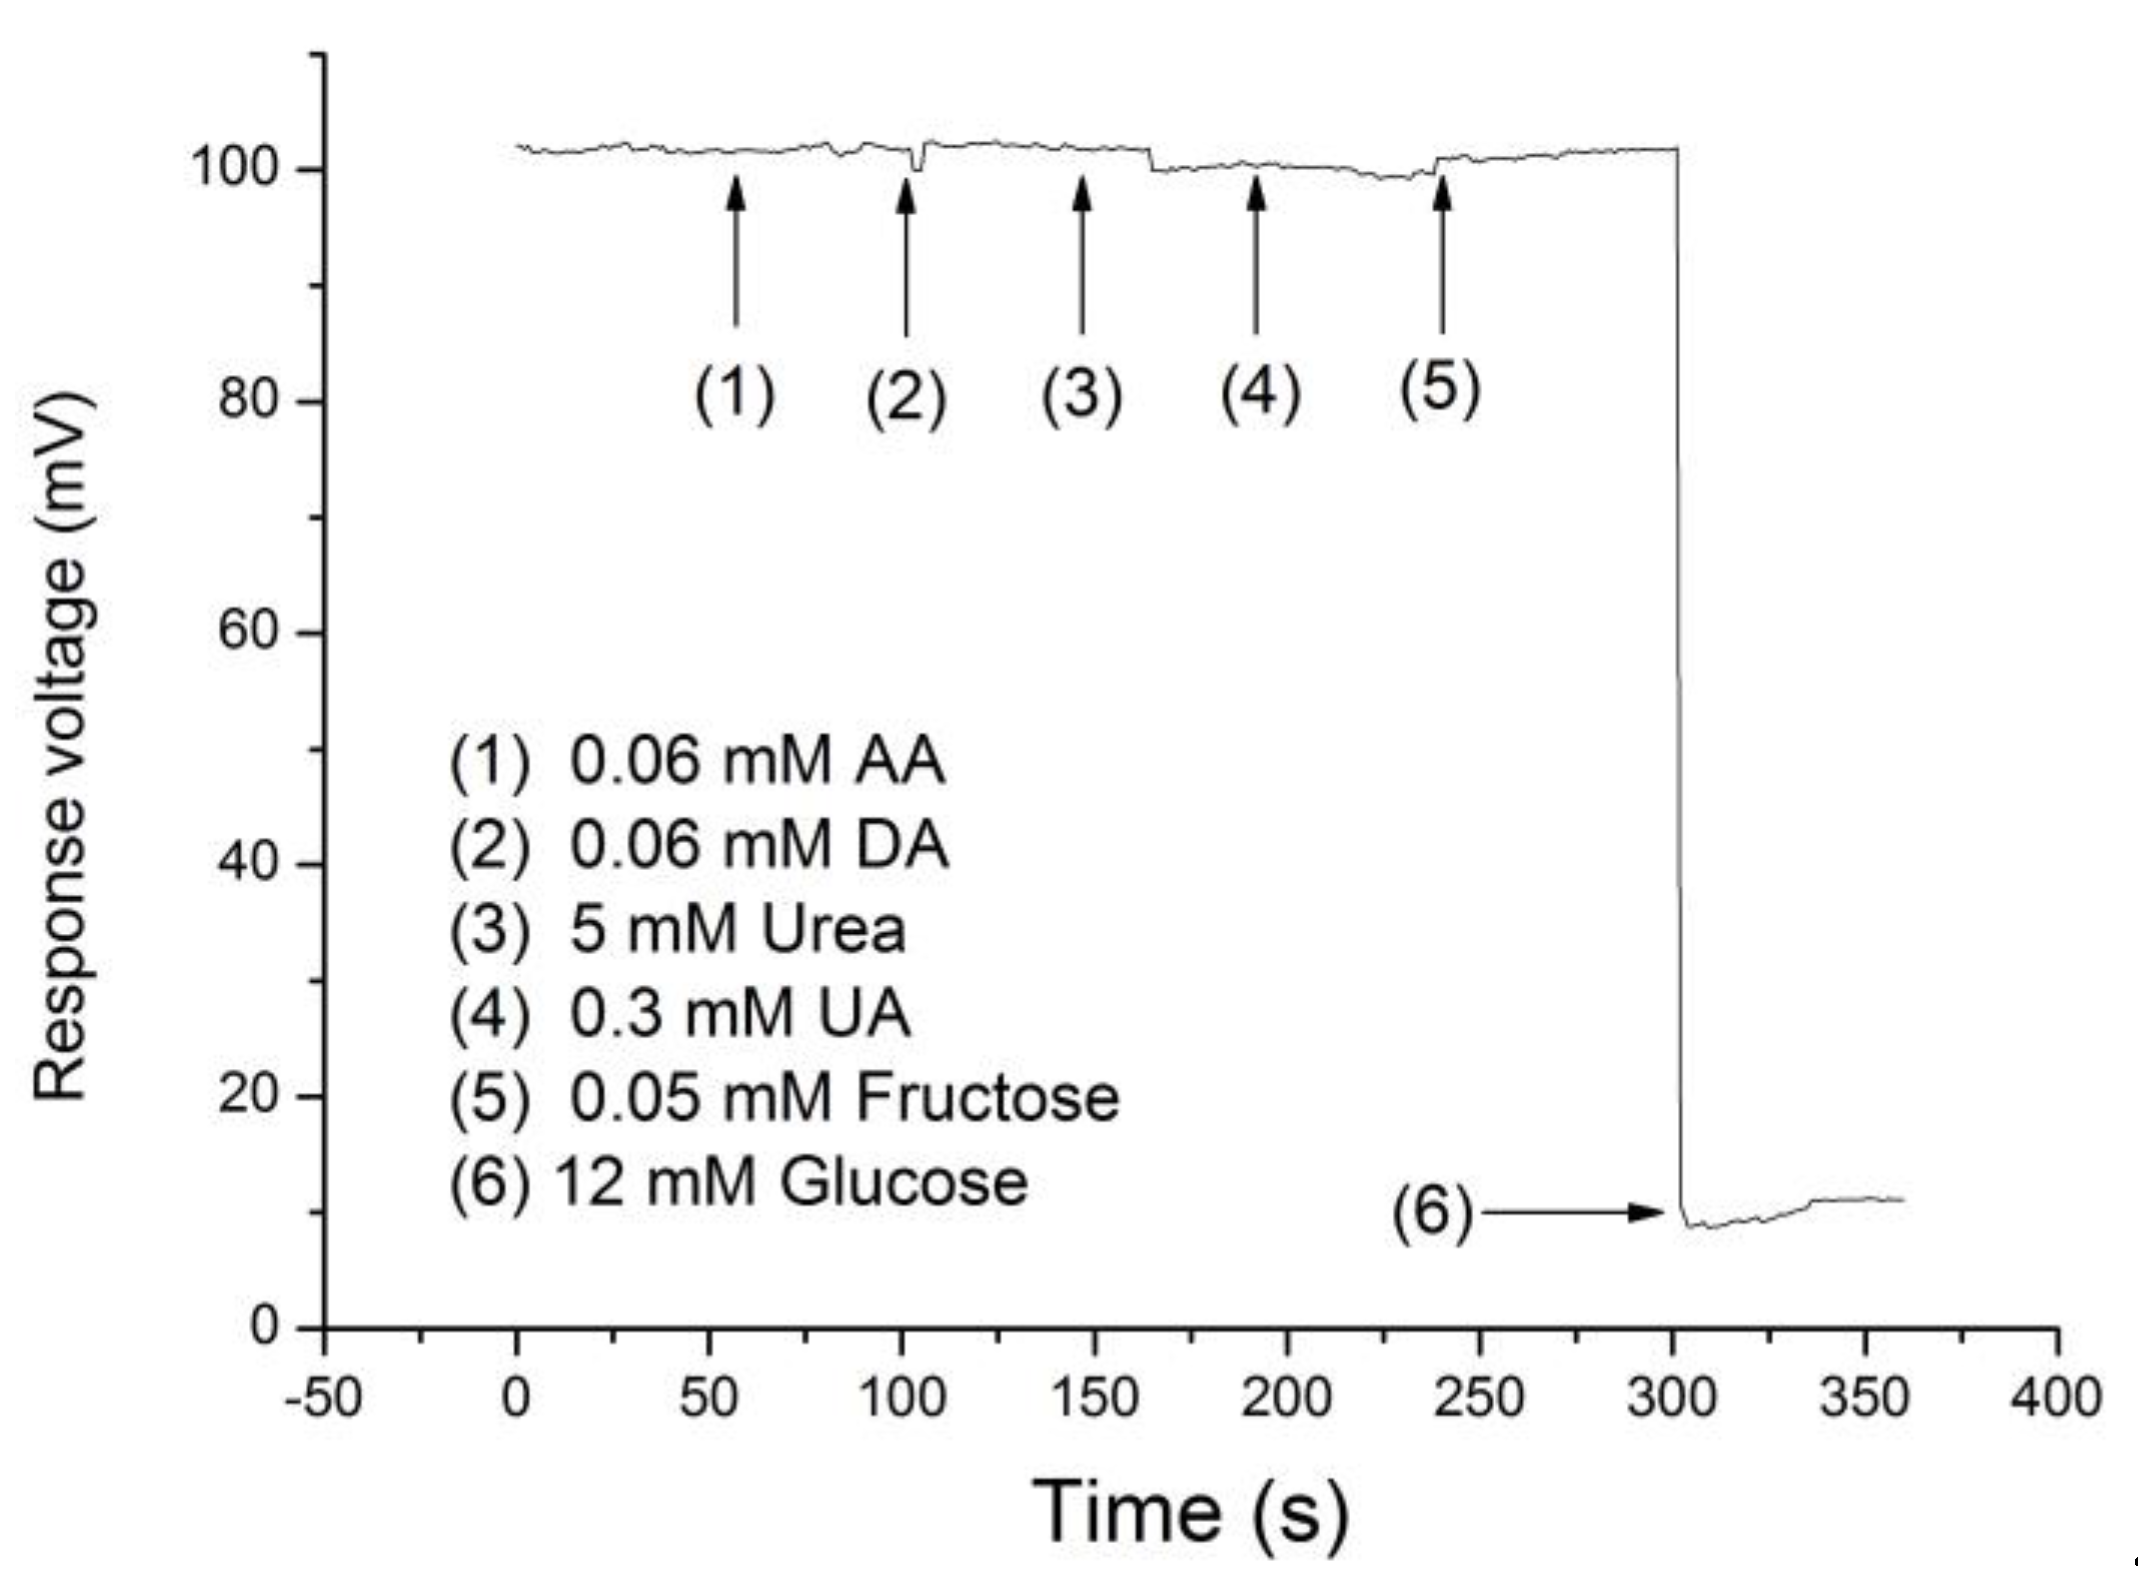
3.5. Anti-Interference Ability of Potentiometric Arrayed Glucose Biosensor Based on Nafion-GOx/GO/AZO

Selectivity is a key evaluation criterion in biosensors. In this study, we selected the potential interfering substances in human blood to test the selectivity of the potentiometric glucose biosensor based on Nafion-GOx/GO/AZO, such as ascorbic acid (AA), urea, and uric acid (UA), dopamine (DA), and fructose. Substances that commonly cause interference in amperometric biosensors, such as AA and UA, can also be used to test the selectivity of potentiometric biosensors because they are highly likely to have an effect on the potential response of potentiometric biosensors [32,50,51]. Firstly, the glucose biosensor was immersed in a 0.1 M PBS solution with 5 mM glucose concentration until the response voltage was steady. The interference analytes, such as 0.06 mM AA, 5 mM urea, and 0.3 mM UA were added into the PBS solution per 60 s, sequentially. Finally, glucose was added to the same PBS solution (achieve 12 mM). The response voltage changed as expected and remained stable.
As shown in Figure 11, the results demonstrated that the interference analytes only generated a tiny amount of noise, i.e., there was a negligible effect on the response voltage of the biosensor. Due to the high selectivity of GOx, urea did not affect the potentiometric glucose biosensor. According to a study conducted by Adeloju et al., AA had a significant influence on the glucose potentiometric biosensor [52]. However, the presence of AA and UA in our study only had a slight effect on the response signal of the biosensor. The potentiometric glucose biosensor based on Nafion-GOx/GO/AZO exhibited an excellent specificity for glucose.

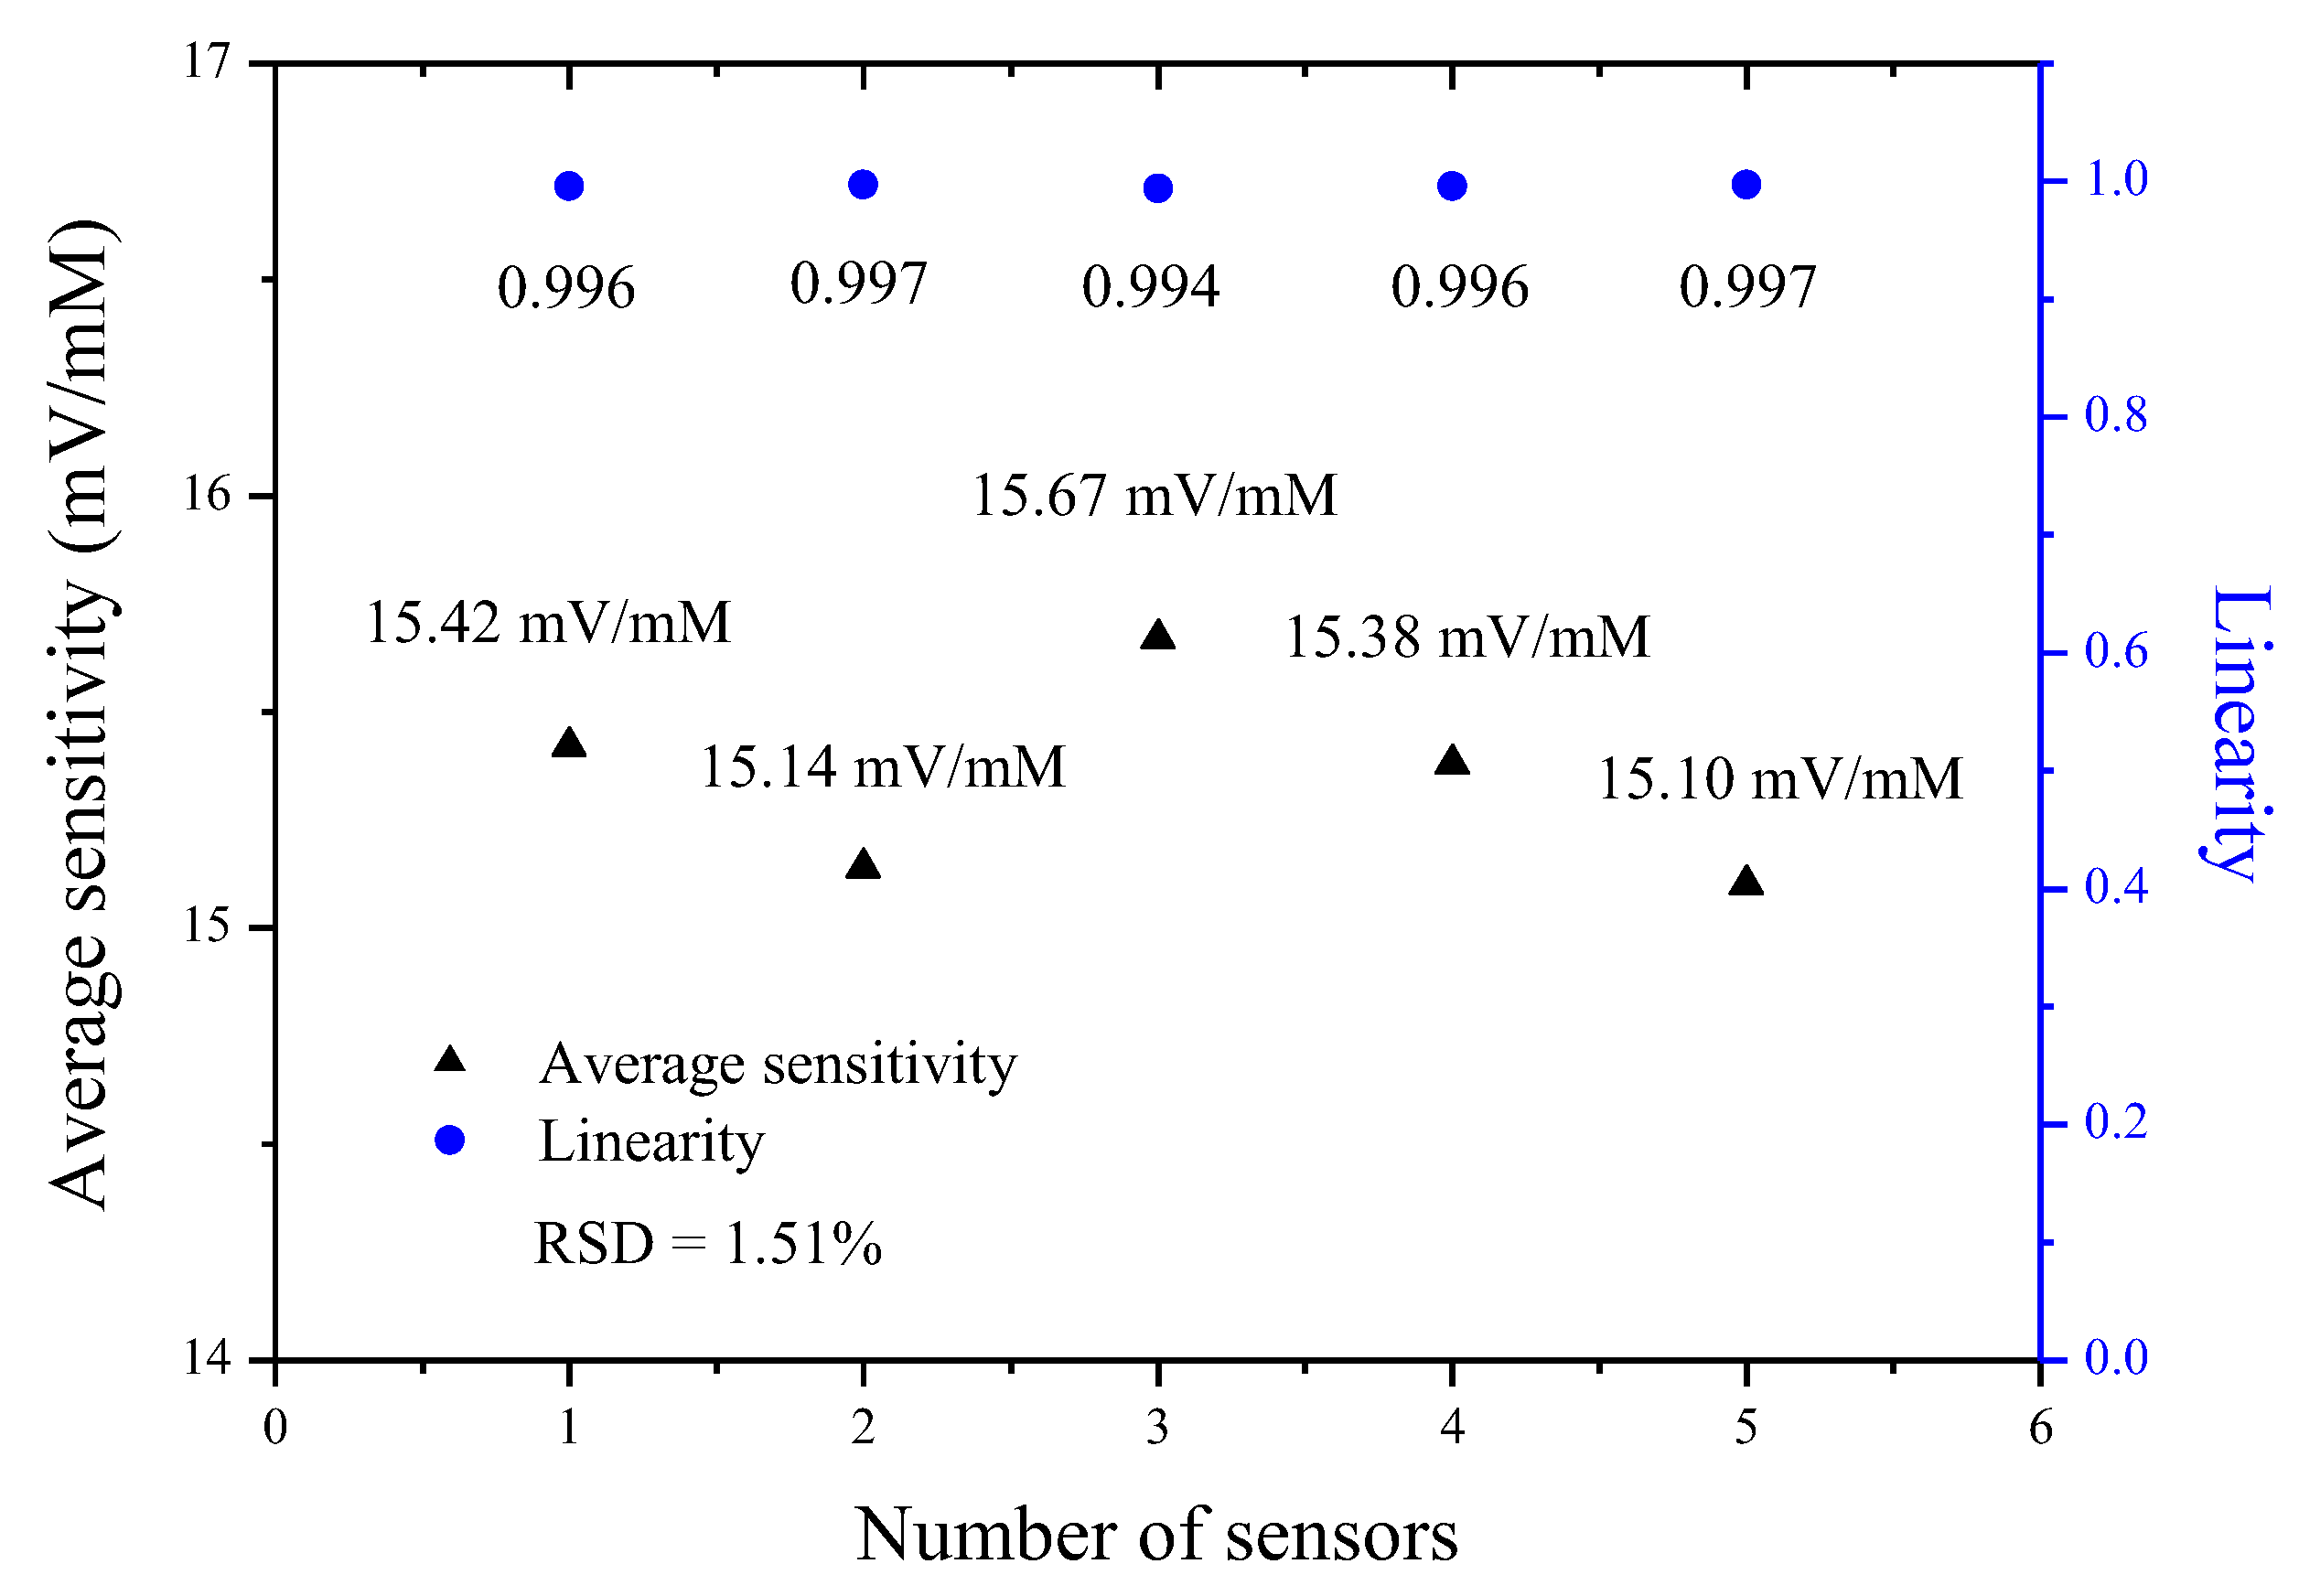
3.6. Reproducibility of Potentiometric Arrayed Glucose Biosensor Based on Nafion-GOx/GO/AZO

In order to evaluate the reproducibility of the potentiometric arrayed glucose biosensor based on Nafion-GOx/GO/AZO, we fabricated the 15 biosensors in three batches and then selected the five sensors (number of sensors, N = 5), which had the optimal and similar performance among them to test (the fabrication of five biosensors in one batch). Next, the five biosensors were respectively measured in PBS solutions (pH 7.0) with glucose concentrations ranging from 2 to 10 mM, followed by calculating their average sensitivity and linearity, as shown in Figure 12 and Table 3. In Figure 12 and Table 3, it can be seen that the response voltages of biosensors were not significantly different, and the average sensitivities and linearities also showed little variation. Finally, the relative standard deviation (RSD) of the average sensitivities was determined. RSD is defined as the ratio of the standard deviation to the mean, is expressed by Equation (5):
RSD =   σ / μ
where σ represents the standard deviation and μ represents the mean. Herein, we used five values of the average sensitivities to find out the mean and standard deviation, as shown in Table 3. The mean of the average sensitivities was 15.34 mV/mM; the standard deviation of the average sensitivities was 0.23 mV/mM. From Equation (5), the RSD of the average sensitivities was 1.51%. These results indicated good reproducibility of the potentiometric biosensors and demonstrated that this facile fabrication was reliable.

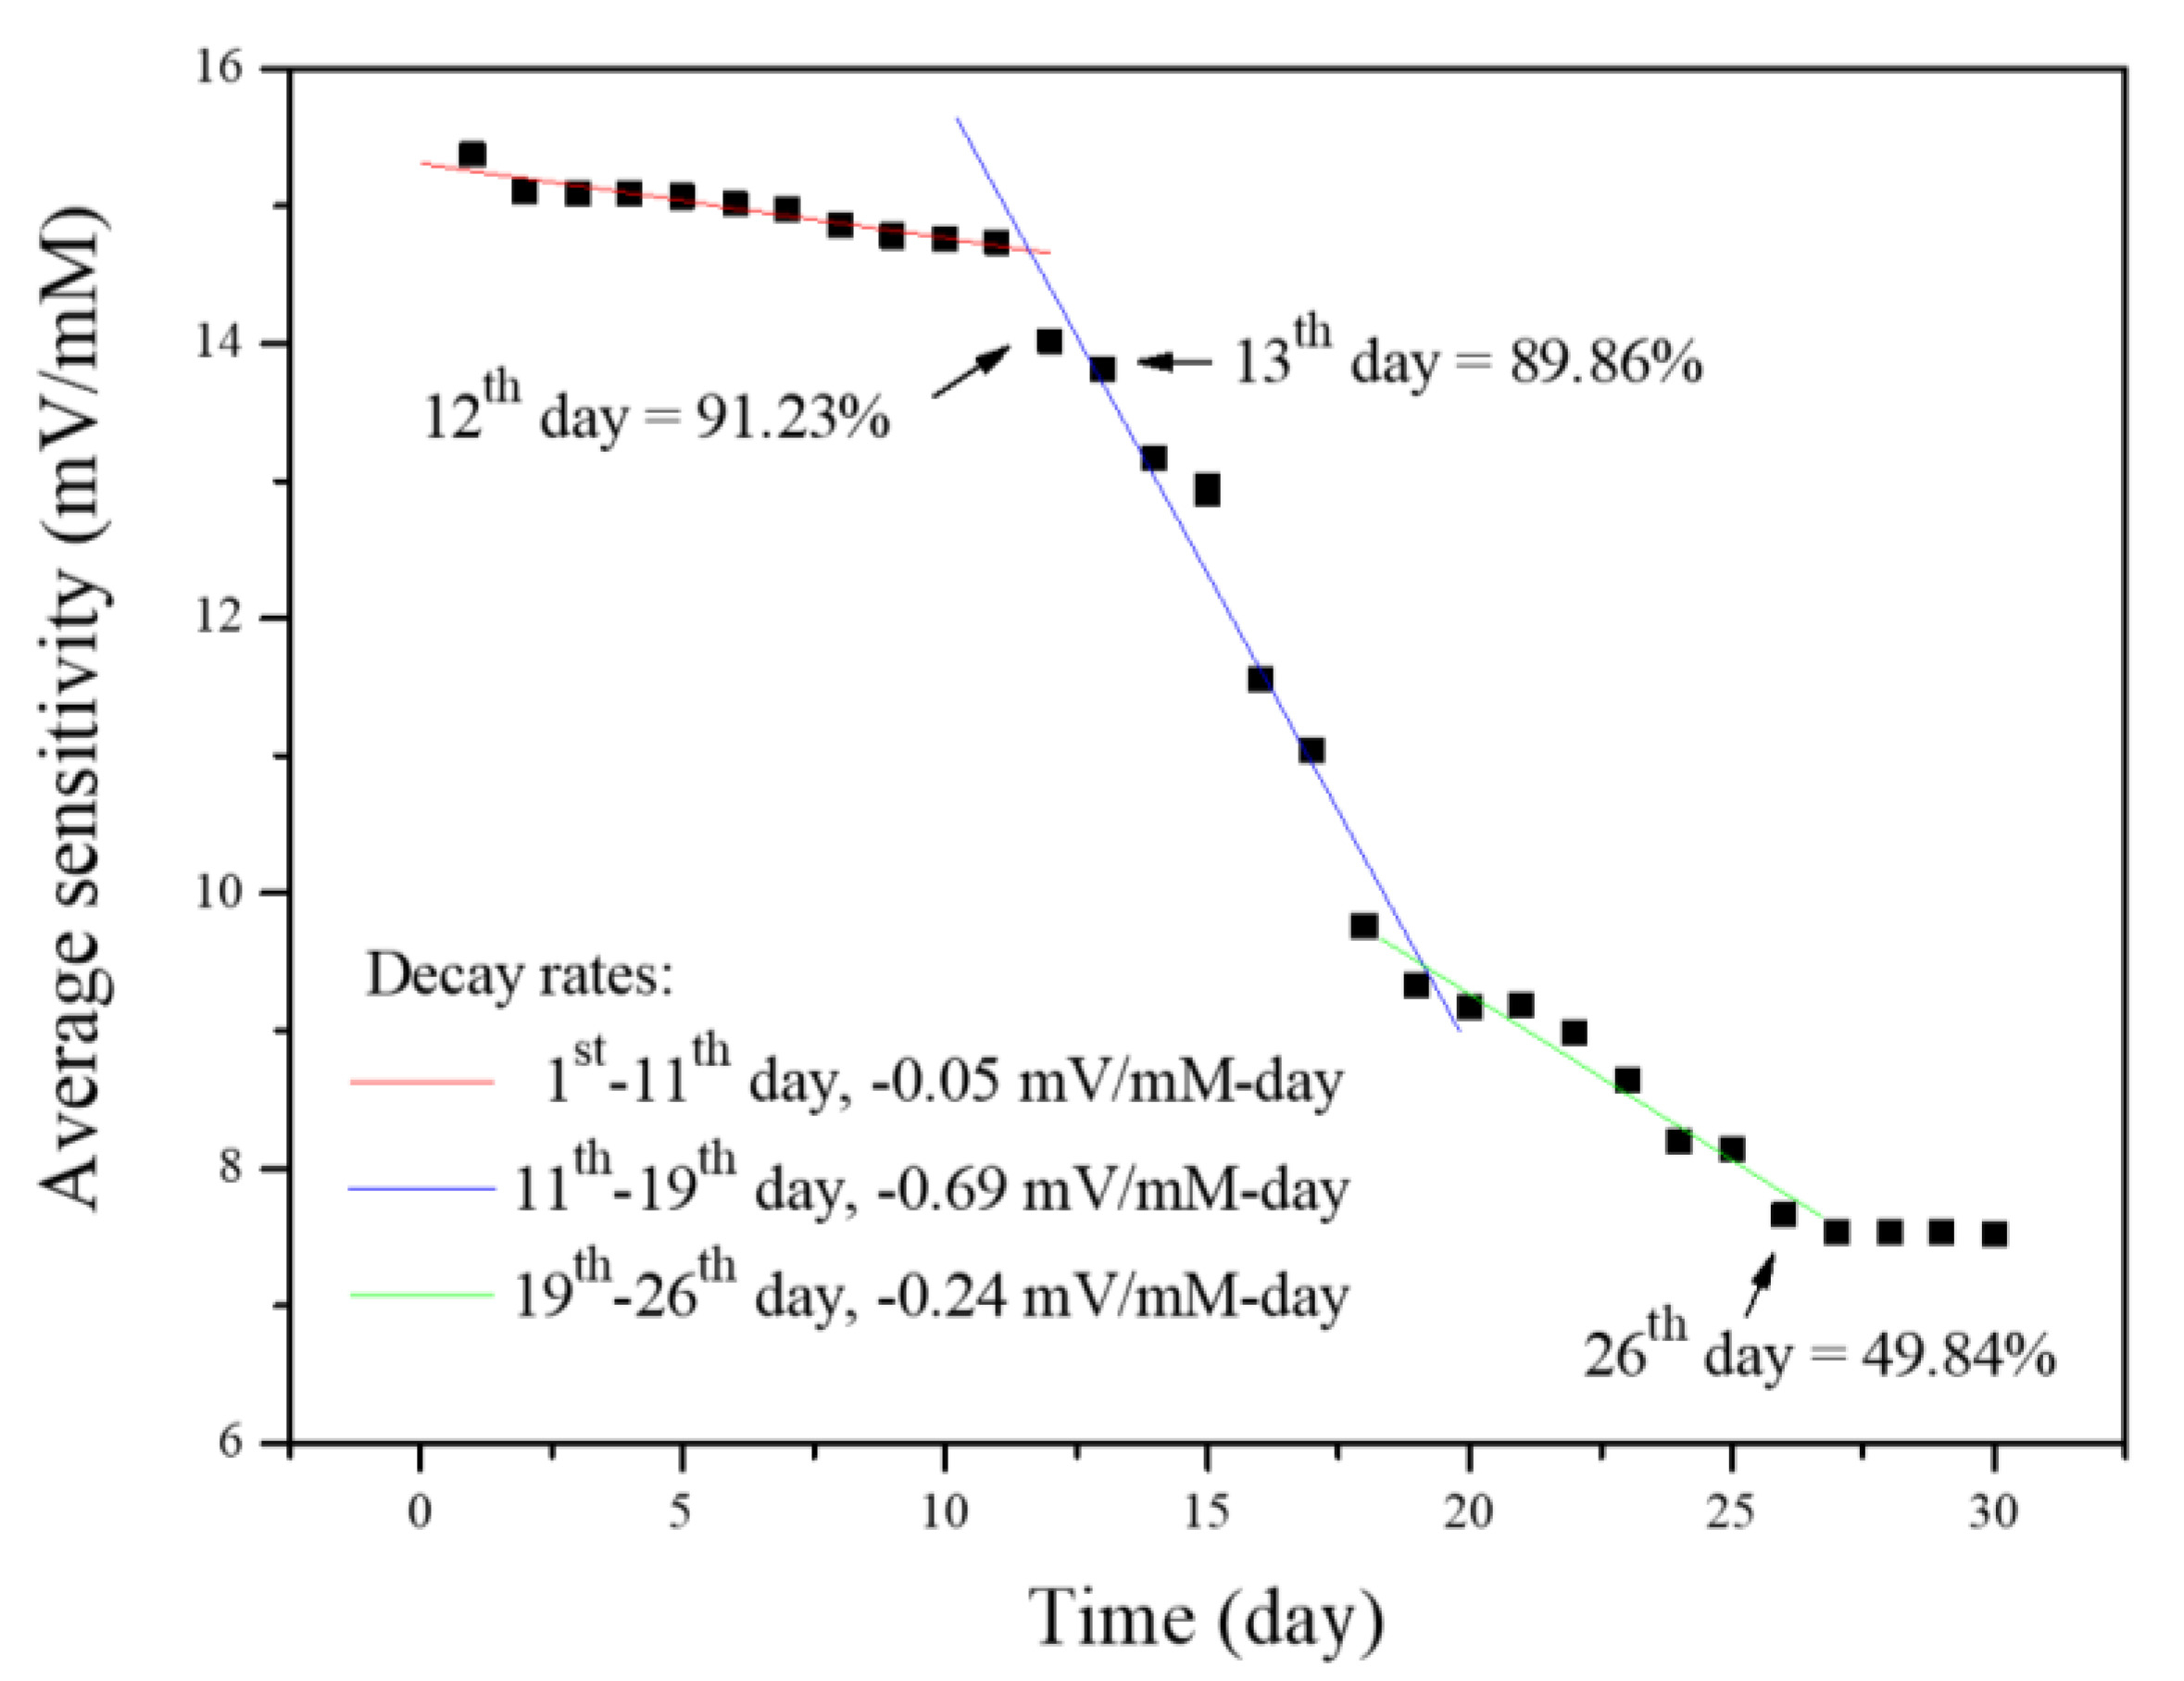
3.7. Lifetime of Potentiometric Arrayed Glucose Biosensor Based on Nafion-GOx/GO/AZO

In the evaluation of a biosensor, it is crucial to establish the lifetime of the sensor, particularly as potentiometric arrayed glucose biosensors use biological materials, such as enzymes. In this study, we investigated the average sensitivity of the potentiometric glucose biosensor at different times to evaluate the lifetime. Firstly, the average sensitivity of the biosensor was recorded on the first day, which served as the datum value. Next, we measured the average sensitivities of the potentiometric arrayed glucose biosensor based on Nafion-GOx/GO/AZO every day. The data were divided by the datum value (the average sensitivity of the biosensor recorded on the 1st day), respectively, and the relative average sensitivities were subsequently obtained. Besides, the biosensor was stored at 4 °C when not in use. The lifetime of the proposed biosensor was obtained by carrying out this test, and the measuring period was a month.
The average sensitivity variation of the biosensor through a month is shown in Figure 13. From the 1st to the 11th day, there was a little decrease in average sensitivity; the decay rate was −0.05 mV/mM/day. From the 11th to the 19th day, it could be seen that the average sensitivity decayed obviously; the decay rate was −0.69 mV/mM/day. It was due to the large reduction of the enzyme activity and the gradual destruction of the membrane during repeated measurements. From the 19th to the 26th day, the average sensitivity still continued to decrease until the 26th day; the decay rate was −0.24 mV/mM/day. In this period, the biosensor merely relied on the residual enzymes of the membranes to remain the average sensitivity. After the 26th day, there was no variation in average sensitivity. The relative average sensitivity was about 49.84%; this value seems to be the cut-off value of the average sensitivity. The lifetime of the biosensor was determined according to the following definition; lifetime was defined as the storage or operational time required to obtain a decrease in sensitivity to 90% within the linear concentration range [52]. As shown in Figure 13, the relative average sensitivities on the 12th and the 13th day, respectively, were 91.23% and 89.86%. Therefore, the lifetime of the potentiometric arrayed glucose biosensor based on Nafion-GOx/GO/AZO was 12 days. The short lifetime was due to the restriction, which GOx caused. In addition, the lifetime of 12 days compared to similar reports [53,54] is relatively long. We also conducted the reproducibility for the sensor, as shown in Figure S2. The results showed that the average lifetime of the sensors is 12 days for the different samples, which proves that the sensors have good stability and reproducibility in this study. Biological materials inevitably shorten the lifespan of biosensors, and this is a critical challenge in the field of biosensing research. In fact, a lifetime of 12 days may be considered acceptable if this biosensor is used as a disposable device.

3.8. Comparisons of Glucose Biosensors

The comparisons of currently available potentiometric glucose biosensors are presented in Table 4 [8,9,10,55,56,57,58]. It can be seen in Table 4 that ZnO nanostructures applied to biosensors are prepared in two stages using both sol–gel and aqueous chemical growth deposition techniques [8,9,10]. Their difference regards the types of used electrodes and whether BSA modifies the membrane. According to the investigation by Ali et al. [8], the sensor containing BSA showed the larger linear ranges compared to the other sensor that did not contain BSA. Fulati et al. [10] reported that the sensitivity was augmented largely because the surface-to-volume ratio of ZnO NFs was higher than that of ZnO NRs. Therefore, the intracellular glucose biosensor based on a BSA-GOx/ZnO NFs/Al microelectrode showed the best sensitivity (65.2 mV/decade) and the widest linear range (500 nM to 10 mM) [10]. The potentiometric arrayed glucose biosensor based on Nafion-GOx/GO/AZO was compared to other potentiometric biosensors. However, compared to the literature [10], the experiments described here were long, and there was no further experimental analysis for the long-time measurement of the literature [10]. In this article, the stability analysis was performed in Section 3.4, and it also showed a good hysteresis voltage. Moreover, this study also showed the 12-day lifetime in Section 3.7. All biosensors are based on a single electrode such as glassy carbon electrodes (GCE) or ion-selective electrodes (ISE). Since the sensing area did not need to be determined, these single electrodes could be modified easily by the dip-coating method and aqueous chemical growth deposition techniques to grow the nanostructures. However, the proposed biosensor possessed the arrayed electrodes, and so we applied carbon nanomaterials such as GO to the modification of the electrodes by the drop-coating method, instead of the aqueous growth deposition. Although the proposed biosensor did not have a wide linear range for the detection of glucose, the sensitivity and linearity were excellent compared with other potentiometric glucose biosensors (reaching 15.44 mV/mM over a narrow glucose concentration range). In this study, the potentiometric arrayed glucose biosensor based on Nafion-GOx/GO/AZO showed good analytical performances, including an excellent average sensitivity of 15.44 mV/mM and linearity of 0.996 over a glucose concentration range (2 mM to 10 mM), a response time of 26 s, and an LOD of 1.89 mM. Moreover, we had more experiments about the stability of the biosensor, such as the temperature effect, hysteresis, and lifetime. Due to the stability for the biosensors being very important, if the biosensors were not stably sufficient, it may cause a measurement error. This is a serious problem for biosensors. According to the results, the performances of the biosensors were satisfactory in the condition of facile processes.
In this study, the potentiometric arrayed glucose biosensor based on Nafion-GOx/GO/AZO can be fabricated by using a facile method and has other advantages, including miniaturization, low cost, and feasibility of mass production. However, the analytical parameters of the proposed biosensor have room for improvement. Apart from this, the limitations induced by GOx (e.g., lifetime) should be overcome, although the glucose biosensor using GOx has excellent reproducibility and anti-interference ability. In order to develop a practical device for measuring blood glucose, further research studies will be conducted to improve the performances of the glucose biosensor. Therefore, we plan to investigate the application of nanostructures (e.g., quantum dot) or BSA to modify the enzymatic membrane [8,9], so as to enhance the linear range and response time of the biosensor. The denaturation rate of GOx must be decreased to extend the lifetime of the glucose biosensor. Finally, the measurement system and the glucose biosensor will be applied to measuring glucose in biofluid (e.g., serum) to realize a rapid, accurate, and simple detection of blood glucose.

4. Conclusions

We proposed a facile method for the development of the potentiometric arrayed glucose biosensor based on a PET substrate. The analytical performances were evaluated via the V-T measurement system. The average sensitivity of the potentiometric arrayed glucose biosensor based on Nafion-GOx/GO/AZO was higher than that of Nafion-GOx/GO/ZnO. The reason was attributed to the improvement of the electrical conductivity after doping Al in the ZnO lattice. Furthermore, the EIS analysis revealed that the charge transfer resistance of AZO was lower than that of ZnO. Compared to the glucose biosensors developed in recent years, the glucose biosensor based on Nafion-GOx/GO/AZO exhibited good analytical performances, such as an excellent average sensitivity of 15.44 mV/mM over a glucose concentration range (2–10 mM), a response time of 26 s, and good reproducibility. Our findings demonstrated that AZO may be a promising sensing platform, with superior performance compared with ZnO. The proposed sensor involves a relatively facile process, and the results presented herein could be useful in the development of an effective, appropriate, and easily fabricated potentiometric glucose biosensor. In the future, we hope to propose a comprehensive flexible arrayed potentiometric biosensor and realize the miniaturization of the device. Modification of the different types of the enzyme oxidase on a plurality of the working electrodes is required so that cross-comparison and integration of the data on the platform can realize the convenient detection equipment.

Supplementary Materials

The following are available online at https://www.mdpi.com/1424-8220/20/4/964/s1, Figure S1: EDX spectra of different membranes: (a) ZnO and (b) AZO, Figure S2: The reducibility test for the lifetime of the glucose biosensors, Table S1: p-value for response voltages intervals under different glucose concentrations.

Author Contributions

Conceptualization, J.-C.C.; Data curation, S.-H.L. and T.-Y.L.; Formal analysis, S.-H.L. and T.-Y.L.; Funding acquisition, J.-C.C.; Investigation, S.-H.L.; Methodology, J.-C.C. and S.-H.L.; Resources, J.-C.C. and Y.-H.N.; Supervision, P.-Y.K., C.-H.L., and Y.-H.N.; Validation, S.-H.L., T.-Y.L., P.-Y.K., and T.-Y.S.; Writing—original draft, S.-H.L.; Writing—review and editing, J.-C.C., S.-H.L., P.-Y.K., C.-H.L., and Y.-H.N. All authors have read and agreed to the published version of the manuscript.

Funding

This research received no external funding.

Acknowledgments

This study has been supported by Ministry of Education, Taiwan, under the contract (107-A055-8) and Ministry of Science and Technology, Taiwan, under the contracts (MOST 107-2221-E-224-030 and MOST 108-2221-E-224 -020).

Conflicts of Interest

The authors declare no conflict of interest.

References

  1. Vashist, S.K.; Zhenga, D.; Al-Rubeaan, K.; Luonge, J.H.T.; Sheu, F.S. Technology behind commercial devices for blood glucose monitoring in diabetes management: A review. Anal. Chim. Acta 2011, 703, 124–136. [Google Scholar] [CrossRef] [PubMed]
  2. American Diabetes Association. Diabetes Care 2008, 31, 12–54.
  3. Available online: https://doi.org/10.2337/dc14-S014 (accessed on 21 January 2019).
  4. Lai, J.; Yi, Y.; Zhu, P.; Shen, J.; Wu, K.; Zhang, L.; Liu, J. Polyaniline-based glucose biosensor: A review. J. Electroanal. Chem. 2016, 782, 138–153. [Google Scholar] [CrossRef]
  5. Krishnamoorthy, S.; Iliadis, A.A. Properties of high sensitivity ZnO surface acoustic wave sensors on SiO2/(1 0 0) Si substrates. Solid-State Electron. 2008, 52, 1710–1716. [Google Scholar] [CrossRef]
  6. Wei, A.; Sun, X.W.; Wang, J.X.; Lei, Y.; Cai, X.P.; Li, C.M.; Dong, Z.L.; Huang, W. Enzymatic glucose biosensor based on ZnO nanorod array grown by hydrothermal decomposition. Appl. Phys. Lett. 2006, 89, 123902. [Google Scholar] [CrossRef]
  7. Pazur, J.H.; Kleppe, K. The oxidation of glucose and related compounds by glucose oxidase from aspergillus niger. Biochemistry 1964, 3, 578–583. [Google Scholar] [CrossRef]
  8. Gupta, V. ZnO based third generation biosensor. Thin Solid Films 2010, 519, 1141–1144. [Google Scholar] [CrossRef]
  9. Ali, S.M.U.; Nur, O.; Willander, M.; Danielsson, B. A fast and sensitive potentiometric glucose microsensor based on glucose oxidase coated ZnO nanowires grown on a thin silver wire. Sens. Actuators B Chem. 2010, 145, 869–874. [Google Scholar]
  10. Fulati, A.; Ali, S.M.U.; Asif, M.H.; Alvia, N.H.; Willander, M.; Brännmark, C.; Strålfors, P.; Börjesson, S.I.; Elinder, F.; Danielssond, B. An intracellular glucose biosensor based on nanoflake ZnO. Sens. Actuators B Chem. 2010, 150, 673–680. [Google Scholar] [CrossRef] [Green Version]
  11. Wahab, H.A.; Salama, A.A.; Saeid, A.A.E.; Willander, M.; Nur, O.; Battisha, I.K. Zinc oxide nano-rods based glucose biosensor devices fabrication. Results Phys. 2018, 9, 809–814. [Google Scholar] [CrossRef]
  12. Zhao, J.; Mu, F.; Qin, L.; Jia, X.; Yang, C. Synthesis and characterization of MgO/ZnO composite nanosheets for biosensor. Mater. Chem. Phys. 2015, 166, 176–181. [Google Scholar] [CrossRef]
  13. Chu, X.; Zhu, X.; Dong, Y.; Chen, T.; Ye, M.; Sun, W. An amperometric glucose biosensor based on the immobilization of glucose oxidase on the platinum electrode modified with NiO doped ZnO nanorods. J. Electroanal. Chem. 2012, 676, 20–26. [Google Scholar] [CrossRef]
  14. Fidal, V.T.; Chandra, T.S. Effect of neutral red incorporation on Al-doped ZnO thin membranes and its bio-electrochemical interaction with NAD+/NADP+ dependent enzymes. Enzym. Microb. Technol. 2018, 116, 57–63. [Google Scholar]
  15. Janotti, A.; Van De Walle, C.G. Fundamentals of zinc oxide as a semiconductor. Rep. Prog. Phys. 2009, 72, 126501. [Google Scholar] [CrossRef] [Green Version]
  16. Shakti, N.; Gupta, P. Structural and optical properties of Al & Li doped ZnO nanorods. Mater. Today Proc. 2018, 5, 10149–10153. [Google Scholar]
  17. Fidal, V.T.K.P.; Inguva, S.; Krishnamurthy, S.; Marsili, E.; Mosnier, J.P.; Chandra, T.S. Mediator-free interaction of glucose oxidase, as model enzyme for immobilization, with Al-doped and undoped ZnO thin membranes laser-deposited on polycarbonate supports. Enzym. Microb. Technol. 2017, 96, 67–74. [Google Scholar]
  18. Wilkins, E.; Atanasov, P.; Muggenburg, B.A. Integrated implantable device for long-term glucose monitoring. Biosens. Bioelectron. 1995, 10, 485–494. [Google Scholar] [CrossRef]
  19. Ghosh, J.; Ghosh, R.; Giri, P.K. Tuning the visible photoluminescence in Al doped ZnO thin membrane and its application in label-free glucose detection. Sens. Actuators. B Chem. 2018, 254, 681–689. [Google Scholar] [CrossRef]
  20. Khan, M.S.; Misra, S.K.; Dighe, K.; Wang, Z.; Schwartz-Duval, A.S.; Sar, D.; Pan, D. Electrically-receptive and thermally-responsive paper-based sensor chip for rapid detection of bacterial cells. Biosens. Bioelectron. 2018, 110, 132–140. [Google Scholar] [CrossRef] [Green Version]
  21. Lawal, A.T. Progress in utilisation of graphene for electrochemical biosensors. Biosens. Bioelectron. 2018, 106, 149–178. [Google Scholar] [CrossRef]
  22. Park, C.S.; Yoon, H.; Kwon, O.S. Graphene-based nanoelectronic biosensors. J. Ind. Eng. Chem. 2016, 38, 13–22. [Google Scholar] [CrossRef]
  23. Justino, C.I.; Gomes, A.R.; Freitas, A.C.; Duarte, A.C.; Rocha-Santos, T.A. Graphene based sensors and biosensors. TrAC Trends Anal. Chem. 2017, 91, 53–66. [Google Scholar] [CrossRef]
  24. Pumera, M. Graphene in biosensing. Mater. Today. 2011, 14, 308–315. [Google Scholar] [CrossRef]
  25. He, H.; Klinowski, J.; Forster, M.; Lerf, A. A new structural model for graphite oxide. Chem. Phys. Lett. 1998, 287, 53–56. [Google Scholar] [CrossRef]
  26. Zhang, L.; Li, Y.; Li, D.W.; Karpuzov, D.; Long, Y.T. Electrocatalytic oxidation of NADH on graphene oxide and reduced graphene oxide modified screen-printed electrode. Int. J. Electrochem. Sci. 2011, 6, 819–829. [Google Scholar]
  27. Shi, J.; Zhang, H.; Snyder, A.; Wang, M.; Xie, J.; Porterfield, D.M.; Stanciu, L.A. An aqueous media based approach for the preparation of a biosensor platform composed of graphene oxide and Pt-black. Biosens. Bioelectron. 2012, 38, 314–320. [Google Scholar] [CrossRef] [PubMed] [Green Version]
  28. Li, Z.; Zhu, W.; Zhang, J.; Jiang, J.; Shen, G.; Yu, R. A label-free amplified fluorescence DNA detection based on isothermal circular strand-displacement polymerization reaction and graphene oxide. Analyst 2013, 138, 3616–3620. [Google Scholar] [CrossRef]
  29. Shen, J.; Hu, Y.; Shi, M.; Lü, X.; Qin, C.; Li, C.; Ye, M. Fast and Facile Preparation of Graphene Oxide and Reduced Graphene Oxide Nanoplatelets. Chem. Mater. 2009, 21, 3514–3520. [Google Scholar] [CrossRef]
  30. Derkus, B. Applying the miniaturization technologies for biosensor design. Biosens. Bioelectron. 2016, 79, 901–913. [Google Scholar] [CrossRef]
  31. Arduini, F.; Micheli, L.; Moscone, D.; Palleschi, G.; Piermarini, S.; Ricci, F.; Volpe, G. Electrochemical biosensors based on nanomodified screen-printed electrodes: Recent applications in clinical analysis. TrAC Trends Anal. Chem. 2016, 79, 114–126. [Google Scholar] [CrossRef] [Green Version]
  32. Chen, J.S. The Research of Integrating the Differential Reference Electrode as Well as Magnetic Beads and Graphene Modified in Arrayed Flexible IGZO Glucose Biosensor Based on Microfluidic Framework and the Fabrication of Multifunctional Enzyme Real-Time Sensing System. Master’s Thesis, National Yunlin University of Science and Technology, Douliou, Taiwan, June 2016. [Google Scholar]
  33. Chou, J.C.; Lin, C.Y.; Liao, Y.H.; Chen, J.T.; Tsai, Y.L.; Chen, J.L.; Chou, H.T. Data fusion and fault diagnosis for flexible arrayed pH sensor measurement system based on LabVIEW. IEEE Sens. J. 2014, 14, 1405–1411. [Google Scholar] [CrossRef]
  34. Huang, Y.; Xue, Y.; Zeng, J.; Li, S.; Wang, Z.; Dong, C.; Li, G.; Liang, J.; Zhou, Z. Non-enzymatic electrochemical hydrogen peroxide biosensor based on reduction graphene oxide-persimmon tannin-platinum nanocomposite. Mater. Sci. Eng. C. 2018, 92, 590–598. [Google Scholar] [CrossRef] [PubMed]
  35. Dresselhaus, M.; Dresselhaus, G.; Hofmann, M. Raman spectroscopy as a probe of graphene and carbon nanotubes. Philos. Trans. R. Soc. A Math. Phys. Eng. Sci. 2007, 366, 231–236. [Google Scholar] [CrossRef] [PubMed]
  36. Pimenta, M.A.; Dresselhaus, G.; Dresselhaus, M.S.; Cançado, L.G.; Jorio, A.; Saito, R. Studying disorder in graphite-based systems by Raman spectroscopy. Phys. Chem. Chem. Phys. 2007, 9, 1276–1290. [Google Scholar] [CrossRef] [PubMed]
  37. Yin, F.; Wu, S.; Wang, Y.; Wu, L.; Yuan, P.; Wang, X. Self-assembly of mildly reduced graphene oxide monolayer for enhanced Raman scattering. J. Solid State Chem. 2016, 237, 57–63. [Google Scholar] [CrossRef]
  38. Ameen, S.; Akhtar, M.S.; Shin, H.S. Nanocages-augmented aligned polyaniline nanowires as unique platform for electrochemical non-enzymatic glucose biosensor. Appl. Catal. 2016, 517, 21–29. [Google Scholar] [CrossRef]
  39. Sardarinejad, A.; Maurya, D.K.; Alameh, K. The effects of sensing electrode thickness on ruthenium oxide thin-film pH sensor. Sens. Actuators A Phys. 2014, 214, 15–19. [Google Scholar] [CrossRef]
  40. Rajaković, L.V.; Marković, D.D.; Rajaković-Ognjanović, V.N.; Antanasijević, D.Z. Review: The approaches for estimation of limit of detection for ICP-MS trace analysis of arsenic. Talanta 2012, 102, 79–87. [Google Scholar] [CrossRef]
  41. Khan, M.S.; Dighe, K.; Wang, Z.; Srivastava, I.; Schwartz-Duval, A.S.; Misra, S.K.; Pan, D. Electrochemical-digital immunosensor with enhanced sensitivity for detecting human salivary glucocorticoid hormone. Analyst 2018, 144, 1448–1457. [Google Scholar] [CrossRef]
  42. Khuna, K.; Ibupoto, Z.H.; Lu, J.; AlSalhi, M.S.; Atif, M.; Ansari, A.A.; Willander, M.; Hsieh, J.H. Potentiometric glucose sensor based on the glucose oxidase immobilized ironferrite magnetic particle/chitosan composite modified gold coated glass electrode. Sens. Actuators B Chem. 2012, 173, 698–703. [Google Scholar] [CrossRef]
  43. Muñoz, J.; Montes, R.; Baeza, M. Trends in electrochemical impedance spectroscopy involving nanocomposite transducers: Characterization, architecture surface and bio-sensing. TrAC Trends Anal. Chem. 2017, 97, 201–215. [Google Scholar] [CrossRef]
  44. Pajkossy, T.; Jurczakowski, R. Electrochemical impedance spectroscopy in interfacial studies. Curr. Opin. Electrochem. 2017, 1, 53–58. [Google Scholar] [CrossRef] [Green Version]
  45. Usui, S. Electrical double-layer interaction between oppositely charged dissimilar oxide surfaces with charge regulation and Stern–Grahame layers. J. Colloid Interface Sci. 2008, 320, 353–359. [Google Scholar] [CrossRef] [PubMed]
  46. Roy, S.; Bajpai, R.; Misra, D.S.; McLaughlin, J.A.; Roy, S.S.; Soin, N. Graphene oxide for electrochemical sensing applications. J. Mater. Chem. 2011, 21, 14725–14731. [Google Scholar] [CrossRef]
  47. Chen, X.; Zhu, J.; Chen, Z.; Xu, C.; Wang, Y.; Yao, C. A novel bienzyme glucose biosensor based on three-layer Au–Fe3O4@SiO2 magnetic nanocomposite. Sens. Actuators B Chem. 2011, 159, 220–228. [Google Scholar] [CrossRef]
  48. Wang, A.-J.; Li, Y.-F.; Li, Z.-H.; Feng, J.-J.; Sun, Y.-L.; Chen, J.-R. Amperometric glucose sensor based on enhanced catalytic reduction of oxygen using glucose oxidase adsorbed onto core-shell Fe3O4@silica@Au magnetic nanoparticles. Mater. Sci. Eng. C 2012, 32, 1640–1647. [Google Scholar] [CrossRef]
  49. Bousse, L.; Van Den Vlekkert, H.; De Rooij, N.F. Hysteresis in Al2O3-gate ISFETs. Sens. Actuators B 1990, 2, 103–110. [Google Scholar] [CrossRef]
  50. Chou, J.C.; Chen, J.S.; Huang, M.S.; Liao, Y.H.; Lai, C.H.; Wu, T.Y.; Yan, S.J. The Characteristic Analysis of IGZO/Al pH Sensor and Glucose Biosensor in Static and Dynamic Measurements. IEEE Sens. J. 2016, 16, 8509–8516. [Google Scholar] [CrossRef]
  51. Deng, H.; Liang Teo, A.K.; Gao, Z. An interference-free glucose biosensor based on a novel low potential redox polymer mediator. Sens. Actuators B Chem. 2014, 191, 522–528. [Google Scholar] [CrossRef]
  52. Adeloju, S.B.; Moline, A.N. Fabrication of ultra-thin polypyrrole–glucose oxidase membrane from supporting electrolyte-free monomer solution for potentiometric biosensing of glucose. Biosens. Bioelectron. 2001, 16, 133–139. [Google Scholar] [CrossRef]
  53. Theâvenot, D.R.; Toth, K.; Durst, R.A.; Wilson, G.S. Electrochemical biosensors: Recommended definitions and classification. Biosens. Bioelectron. 2001, 16, 121–131. [Google Scholar] [CrossRef] [Green Version]
  54. Wang, F.; Gong, W.; Wang, L.; Chen, Z. Enhanced amperometric response of a glucose oxidase and horseradish peroxidase based bienzyme glucose biosensor modified with a film of polymerized toluidine blue containing reduced graphene oxide. Microchim. Acta 2015, 182, 1949–1956. [Google Scholar] [CrossRef]
  55. Wang, W.; Xie, Y.; Wang, Y.; Du, H.; Xia, C.; Tian, F. Glucose biosensor based on glucose oxidase immobilized on unhybridized titanium dioxide nanotube arrays. Microchim. Acta 2013, 181, 381–387. [Google Scholar] [CrossRef]
  56. Yang, Z.; Zhang, C.; Zhang, J.; Bai, W. Potentiometric glucose biosensor based on core–shell Fe3O4–enzyme–polypyrrole nanoparticles. Biosens. Bioelectron. 2014, 51, 268–273. [Google Scholar] [CrossRef] [PubMed]
  57. Çiftci, H.; Tamer, U.; Teker, M. Şen; Pekmez, N. Özçiçek An enzyme free potentiometric detection of glucose based on a conducting polymer poly (3-aminophenyl boronic acid-co-3-octylthiophene). Electrochim. Acta 2013, 90, 358–365. [Google Scholar] [CrossRef]
  58. Ngeontae, W.; Janrungroatsakul, W.; Maneewattanapinyo, P.; Ekgasit, S.; Aeungmaitrepirom, W.; Tuntulani, T. Novel potentiometric approach in glucose biosensor using silver nanoparticles as redox marker. Sens. Actuators B Chem. 2009, 137, 320–326. [Google Scholar] [CrossRef]
  59. Widayani, S.; Yanti, T.; Wungu, T.D.K. Suprijadi Preliminary Study of Molecularly Imprinted Polymer-based Potentiometric Sensor for Glucose. Procedia Eng. 2017, 170, 84–87. [Google Scholar] [CrossRef]
Figure 1. Schematic diagrams of the potentiometric arrayed glucose biosensor: (a) cross-section view and (b) top view. (c) Optical image of the potentiometric arrayed glucose biosensor based on Nafion-GOx/GO/AZO (dimensions annotated in yellow).
Sensors 20 00964 g001
Figure 2. Experimental system diagram of the voltage–time (V-T) measurement system: (a) schematic view and (b) experimental setup.
Sensors 20 00964 g002
Figure 3. Working schematics of the potentiometric measurement, which utilizes the voltage difference between a working electrode and a reference electrode to perform. LT1167 is the amplifier used in the readout circuit (inset).
Sensors 20 00964 g003
Figure 4. Raman spectrum of graphene oxide (GO).
Sensors 20 00964 g004
Figure 5. Field-emission scanning electron microscope (FE-SEM) images of different membranes: (a) silver, (b) GO, (c) zinc oxide (ZnO), and (d) aluminum-doped zinc oxide (AZO).
Sensors 20 00964 g005
Figure 6. 2D and 3D atomic force microscope (AFM) images of GO membrane.
Sensors 20 00964 g006
Figure 7. Response curves of the glucose biosensors over glucose concentrations ranging from 0 to 14 mM, for Nafion-GOx/GO/ZnO and Nafion-GOx/GO/AZO. AZO: aluminum-doped zinc oxide, GOx: glucose oxidase.
Sensors 20 00964 g007
Figure 8. (a) Schematic diagram of the membrane–solution interface. (b) Equivalent circuit model for electrochemical impedance spectroscopy (EIS).
Sensors 20 00964 g008
Figure 9. Nyquist plots of different membranes obtained by fitting of EIS.
Sensors 20 00964 g009
Figure 10. Hysteresis curves of the potentiometric arrayed glucose biosensor based on Nafion-GOx/GO/AZO across multiple cycles of (a) 5 mM→ 3 mM→ 5 mM→ 7 mM→ 5 mM and (b) in the cycle of 5 mM→ 7 mM→ 5 mM→ 3 mM→ 5 mM, respectively.
Sensors 20 00964 g010
Figure 11. Interference effects of the potentiometric arrayed glucose biosensor based on Nafion-GOx/GO/AZO upon the addition of ascorbic acid (AA) (0.06 mM), dopamine DA (0.06 mM), urea (5 mM), uric acid (UA) (0.3 mM), fructose (0.05 mM) and glucose (12 mM).
Sensors 20 00964 g011
Figure 12. Average sensitivities and linearities of the five potentiometric arrayed glucose biosensors based on Nafion-GOx/GO/AZO over glucose concentrations ranging from 2 to 10 mM (number of sensors, N = 5).
Sensors 20 00964 g012
Figure 13. Average sensitivity variation of the potentiometric arrayed glucose biosensor based on Nafion-GOx/GO/AZO through a month.
Sensors 20 00964 g013
Table 1. Sensing parameters of the potentiometric arrayed glucose biosensors over a glucose concentration ranging from 0 to 14 mM.
MembraneGlucose Concentration
(mM)
Response Voltage
(Mean ± SD, mV)
Average Sensitivity (mV/mM)Linearity
Nafion-GOx/GO/ZnO0118.73 ± 1.7611.920.998
2111.64 ± 3.77
494.10 ± 4.36
667.54 ± 3.68
843.20 ± 4.16
1017.88 ± 6.36
127.13 ± 5.17
141.83 ± 5.45
Nafion-GOx/GO/AZO0157.02 ± 2.0115.440.997
2145.13 ± 5.57
4123.12 ± 4.80
690.32 ± 5.47
853.49 ± 6.38
1025.50 ± 7.71
1215.56 ± 6.58
1410.72 ± 5.49
Table 2. Charge transfer resistances obtained by the fitting of EIS. PBS: phosphate-buffered saline.
MembraneSolutionRct (Ω)
ZnOPBS1.17 × 104
AZOPBS5.72 × 103
GO/ZnOPBS2.99 × 103
GO/AZOPBS1.83 × 103
Nafion-GOx/GO/ZnOPBS (5 mM glucose)3.53 × 10³
Nafion-GOx/GO/AZOPBS (5 mM glucose)2.31 × 10³
Table 3. Reproducibility of the five independent potentiometric arrayed glucose biosensors based on Nafion-GOx/GO/AZO over glucose concentrations ranging from 2 to 10 mM (number of sensors, N = 5).
Number of SensorsGlucose Concentration
(mM)
Response Voltage
(Mean ± SD, mV)
Average Sensitivity (mV/mM)Linearity
12146.64 ± 3.7715.420.996
4121.10 ± 4.36
691.54 ± 3.68
850.20 ± 4.16
1027.88 ± 6.36
22145.13 ± 4.5715.140.997
4123.12 ± 4.80
690.31 ± 5.47
853.49 ± 6.38
1028.50 ± 5.71
32142.87 ± 5.4615.670.994
4125.10 ± 4.92
689.35 ± 5.16
851.34 ± 6.01
1023.07 ± 6.38
42145.25 ± 4.2515.380.996
4124.69 ± 5.28
692.10 ± 6.16
853.46 ± 5.74
1027.03 ± 5.95
52144.51 ± 6.3415.100.997
4119.39 ± 4.31
689.37 ± 5.84
850.86 ± 3.17
1027.79 ± 5.06
Table 4. Potentiometric glucose biosensors based on different electrodes [8,9,10,55,56,57,58].
ElectrodeLinear RangeSensitivityLinearityResponse TimeLODRef.
Nafion-GOx/GO/AZO/Ag2 mM to 10 mM15.44 mV/mM0.99726 s1.89 mMThis study
BSA-Nafion-GOx/ZnO NWs/Ag0.5–1000 μM35 mV/decadeN/A1–4 sN/A[9] 2010
BSA-GOx/ZnO NFs/Al500 nM to 10 mM65.2 mV/decade0.9904 sN/A[10] 2010
GOx/ZnO NRs/Ag1 µM to 10mM2.51 mV/decade0.980N/AN/A[11] 2018
Fe3O4-GOx-Ppy/MGCE0.5 μM t 34 mM19.4 mV/decade0.9986 s0.3 μM[56] 2014
PAPBAOT/GCE5–50 mM0.58 mV/mM0.992200 s0.5 mM[57] 2013
AgNPs-GOx/Ag-ISE0.1–3 mM8.62 mV/decadeN/AN/A10 μM[58] 2009
MIP-based on MAA0.02–7 mM43.7 mV/mM0.980N/AN/A[59] 2017
Note: GOx: glucose oxidase; GO: graphene oxide; AZO: aluminum-doped zinc oxide; ZnO: zinc oxide; NWs: nanowires; BSA: bovine serum albumin; NFs: nanoflakes; Ppy: polypyrrole; MGCE: magnetic glassy carbon electrode; GCE: glassy carbon electrode; PAPBAOT: poly (3-aminophenyl boronic acid-co-3-octylthiophene); MIP: molecularly imprinted polymer; MAA: methacrylic acid; NRs: nanorods.

