Hurdle Clearance Detection and Spatiotemporal Analysis in 400 Meters Hurdles Races Using Shoe-Mounted Magnetic and Inertial Sensors


Abstract
1. Introduction
2. Materials and Methods
2.1. Protocol
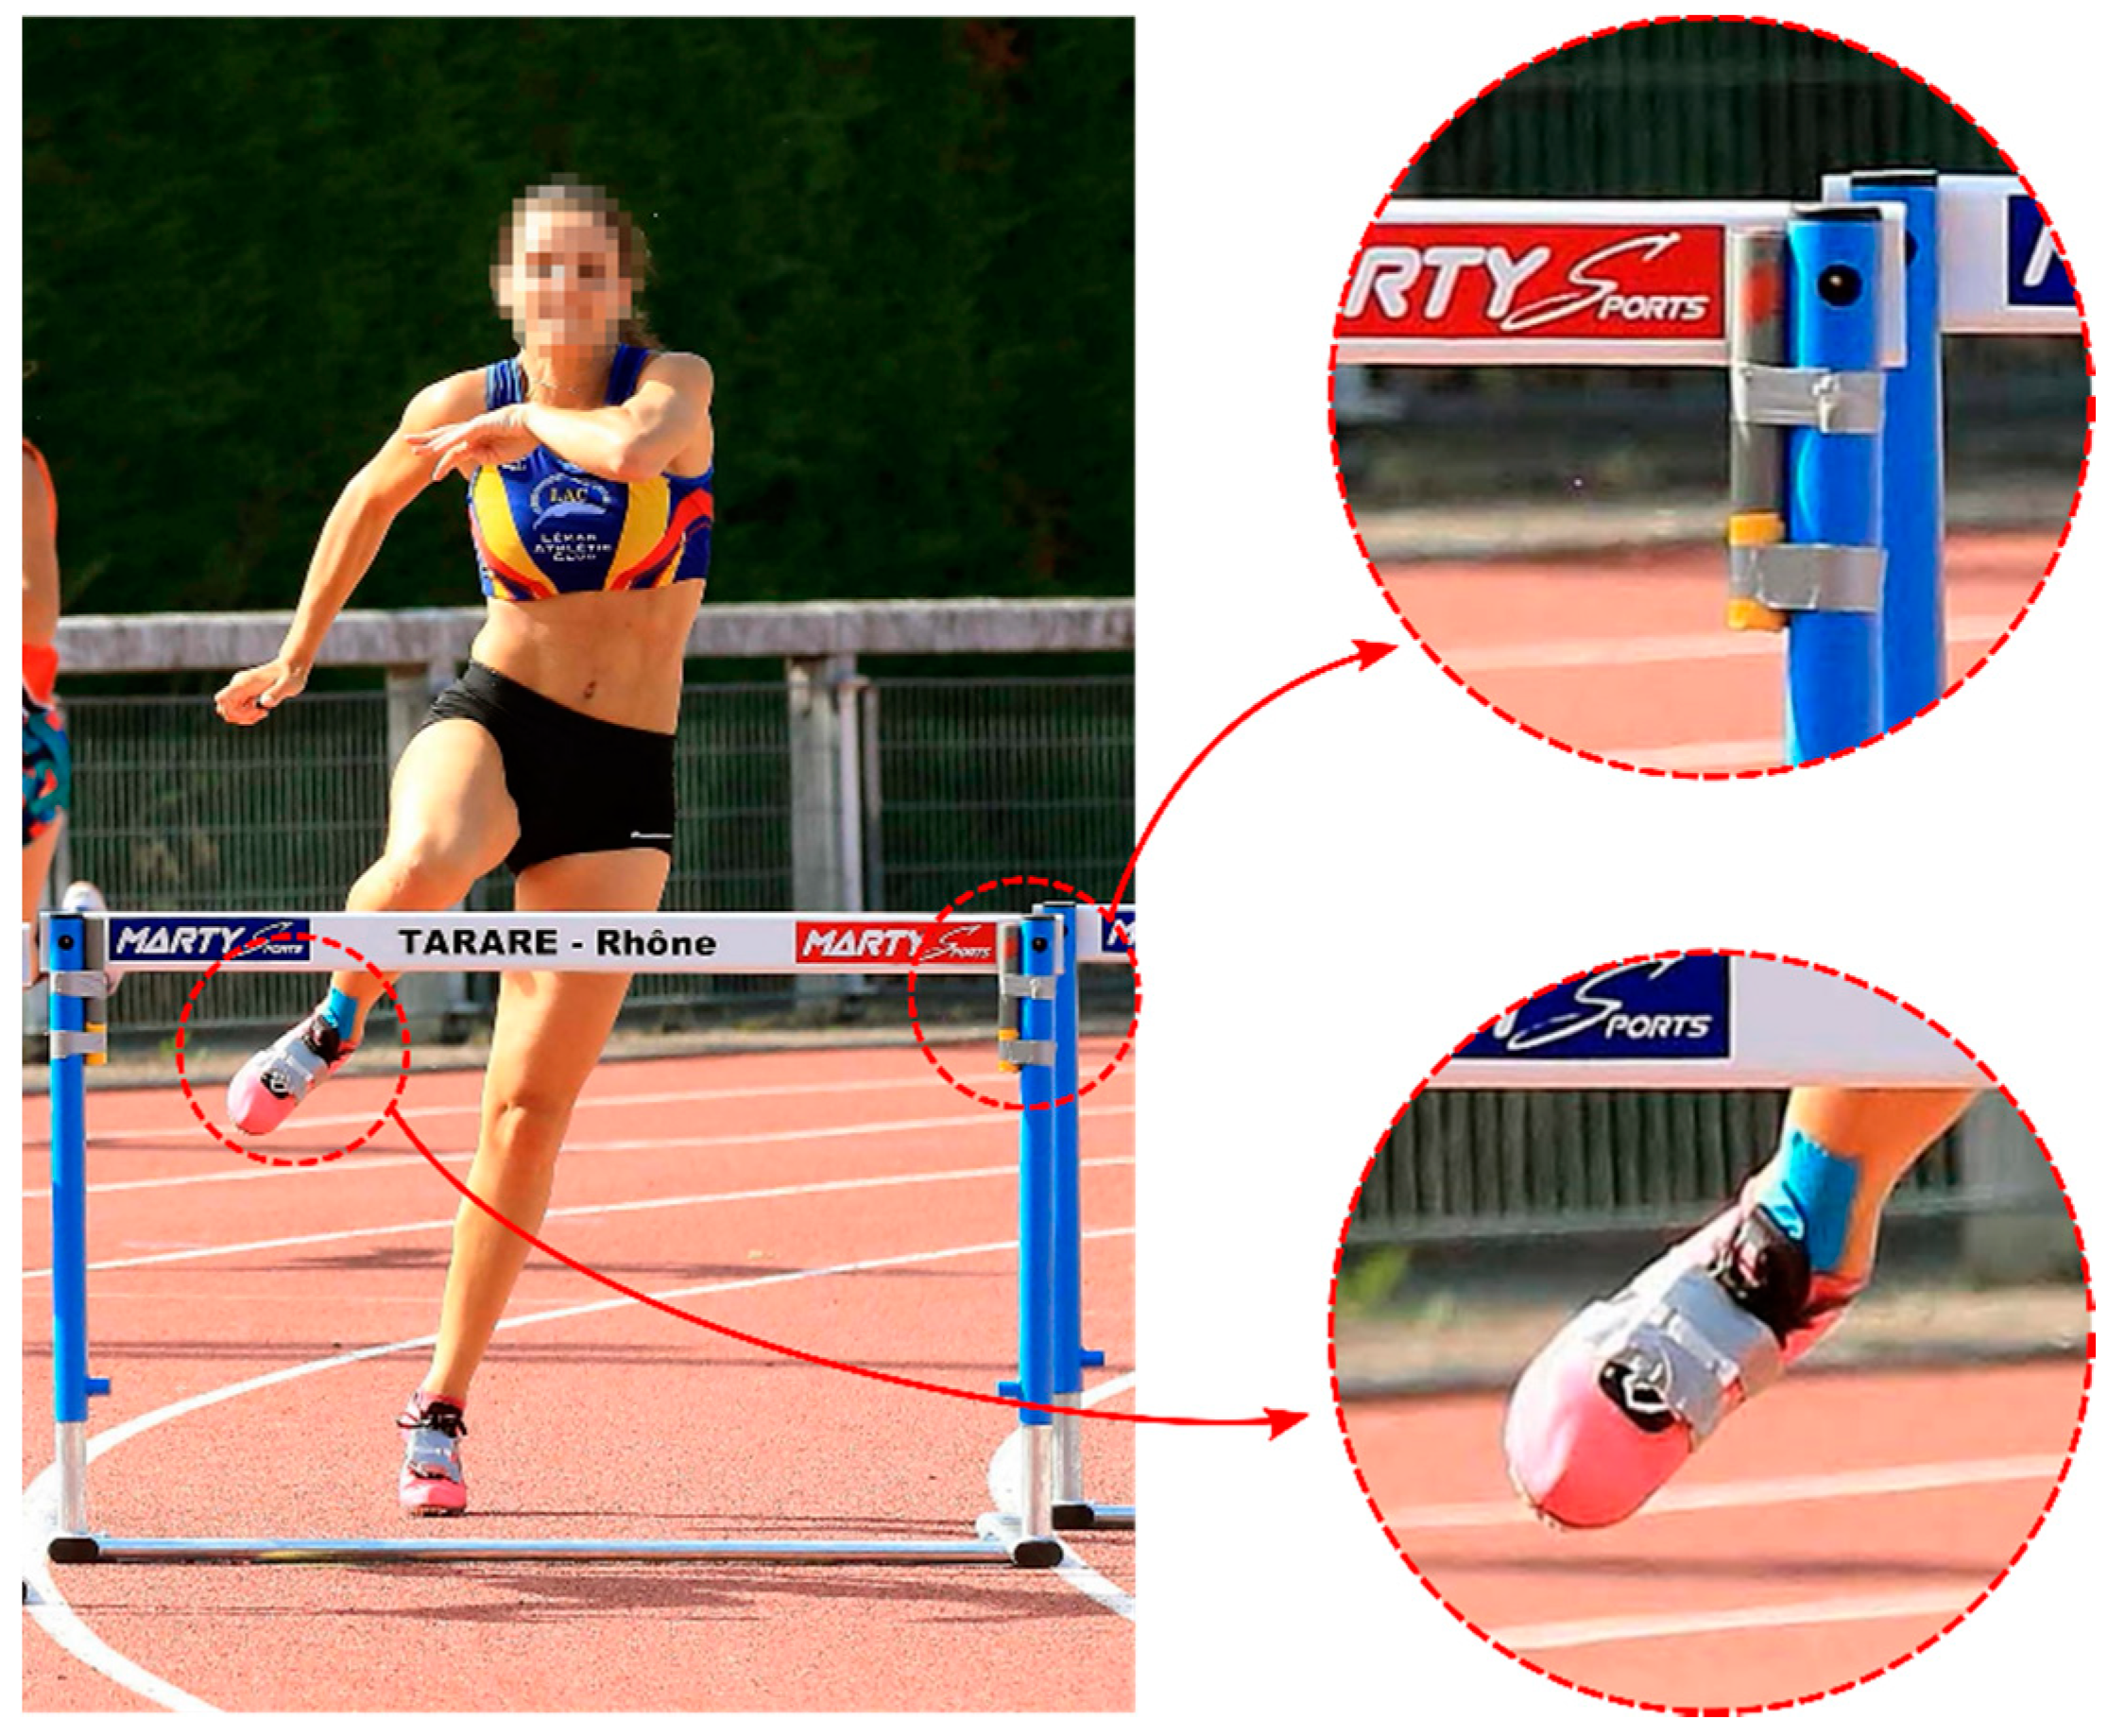
2.2. Instrumentation
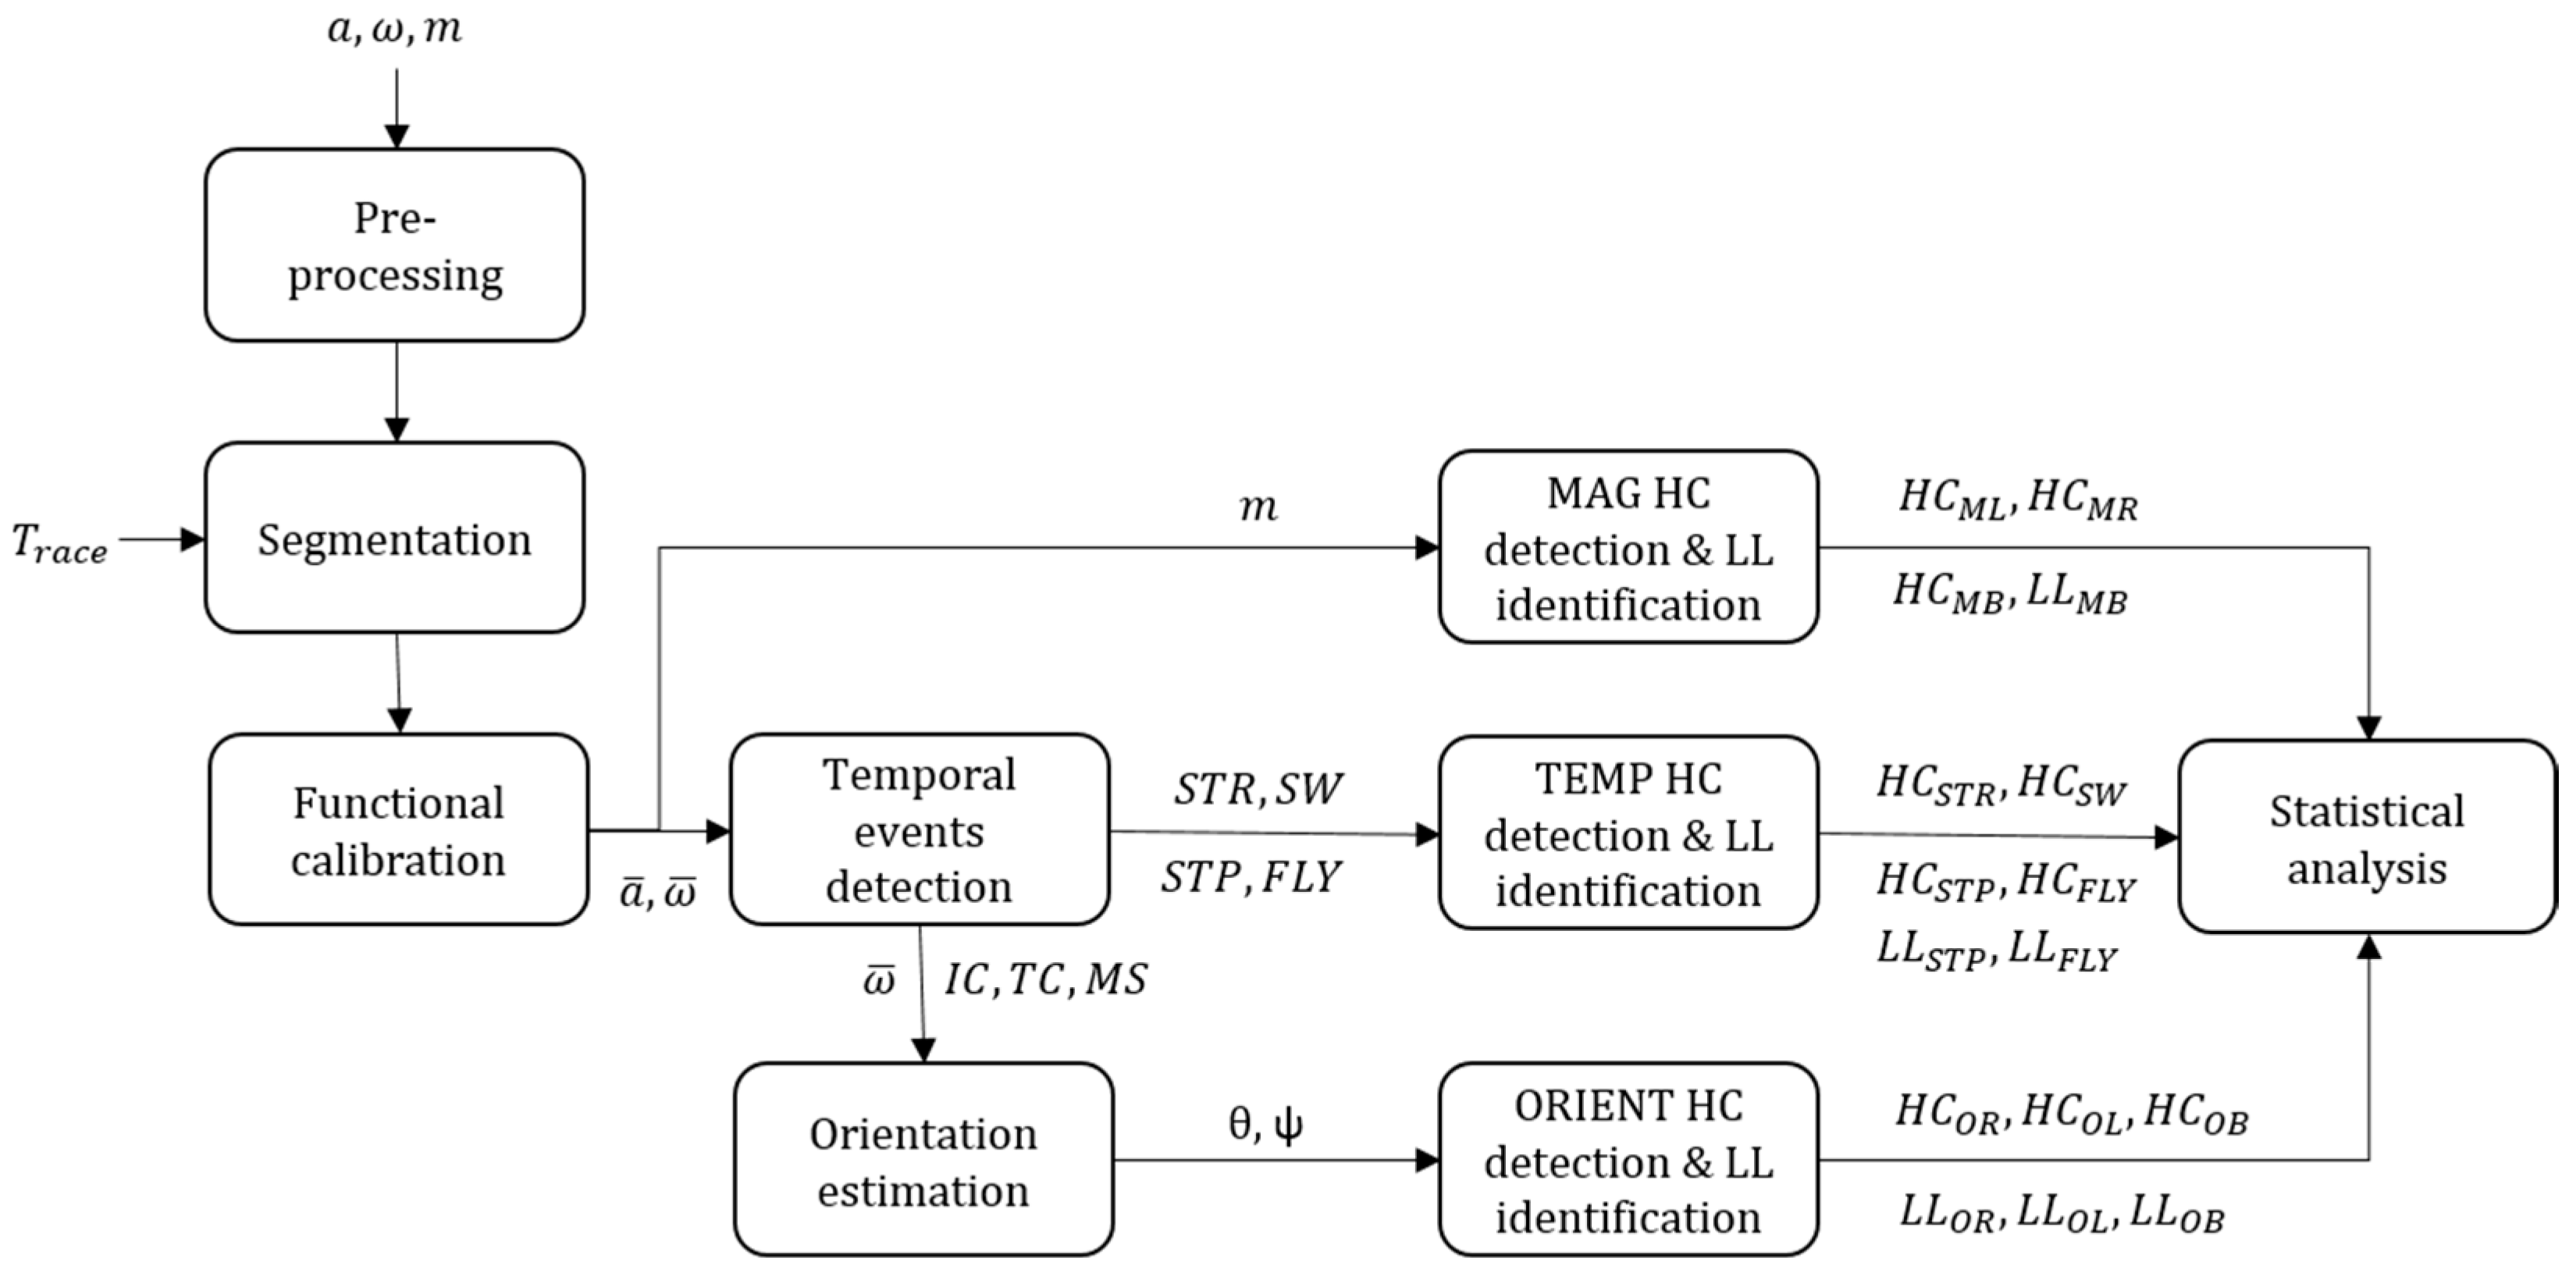
2.3. Data Processing
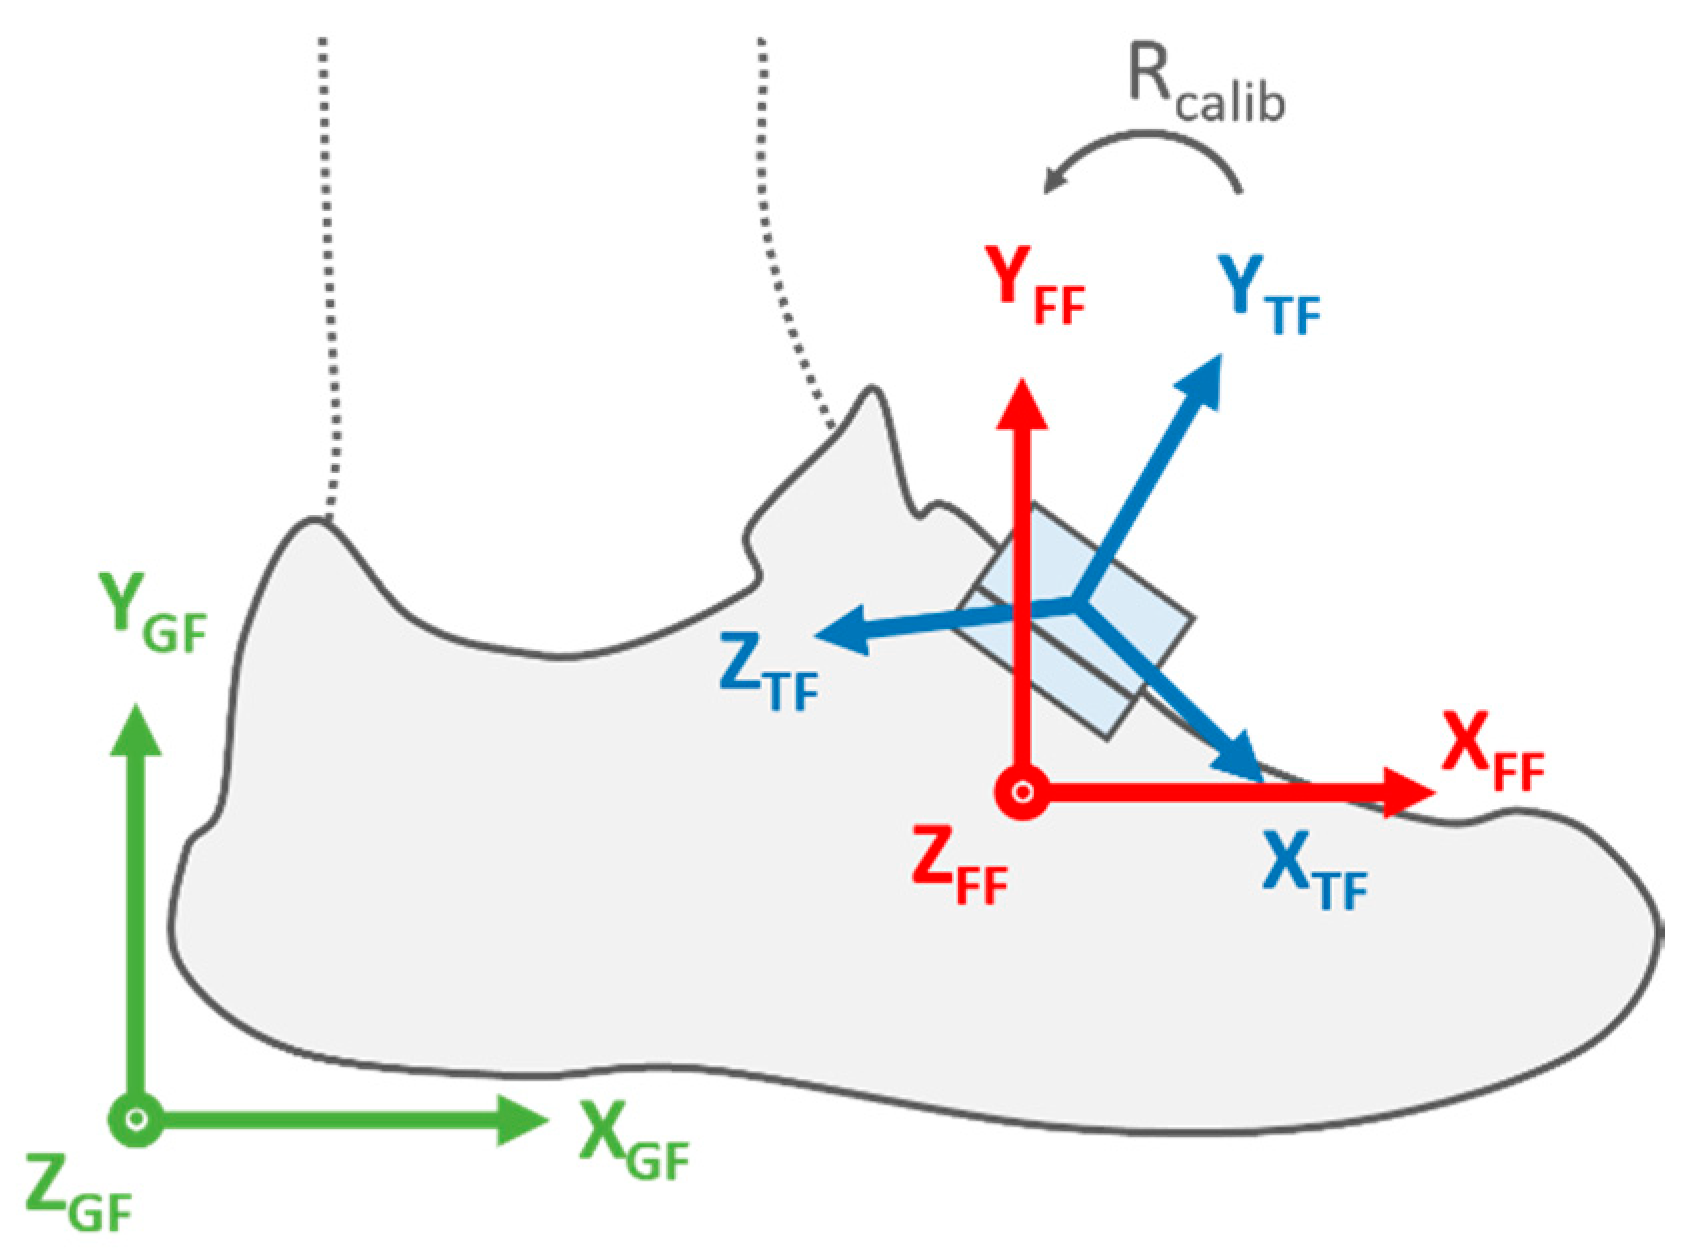
2.3.1. Preprocessing, Calibration, and Segmentation
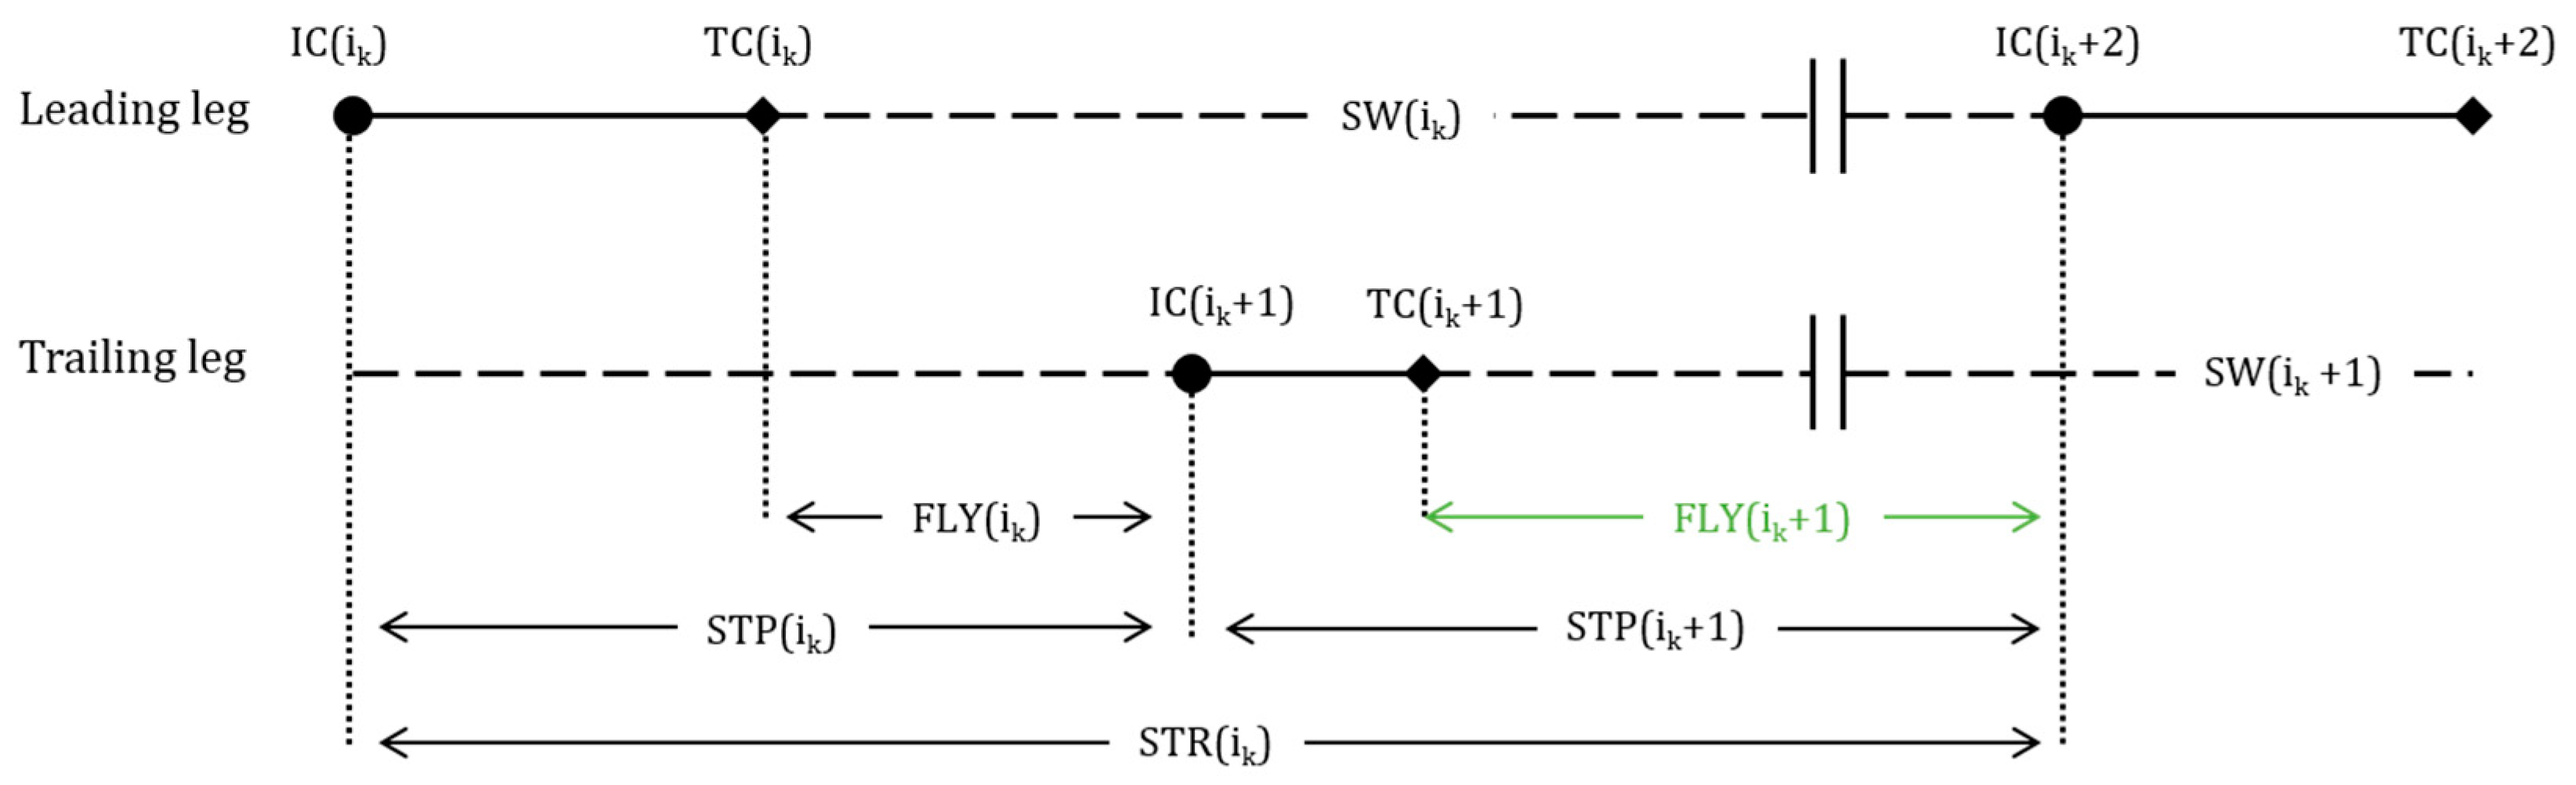
2.3.2. Temporal Analysis and Orientation Estimation
2.4. Hurdle Clearance Detection
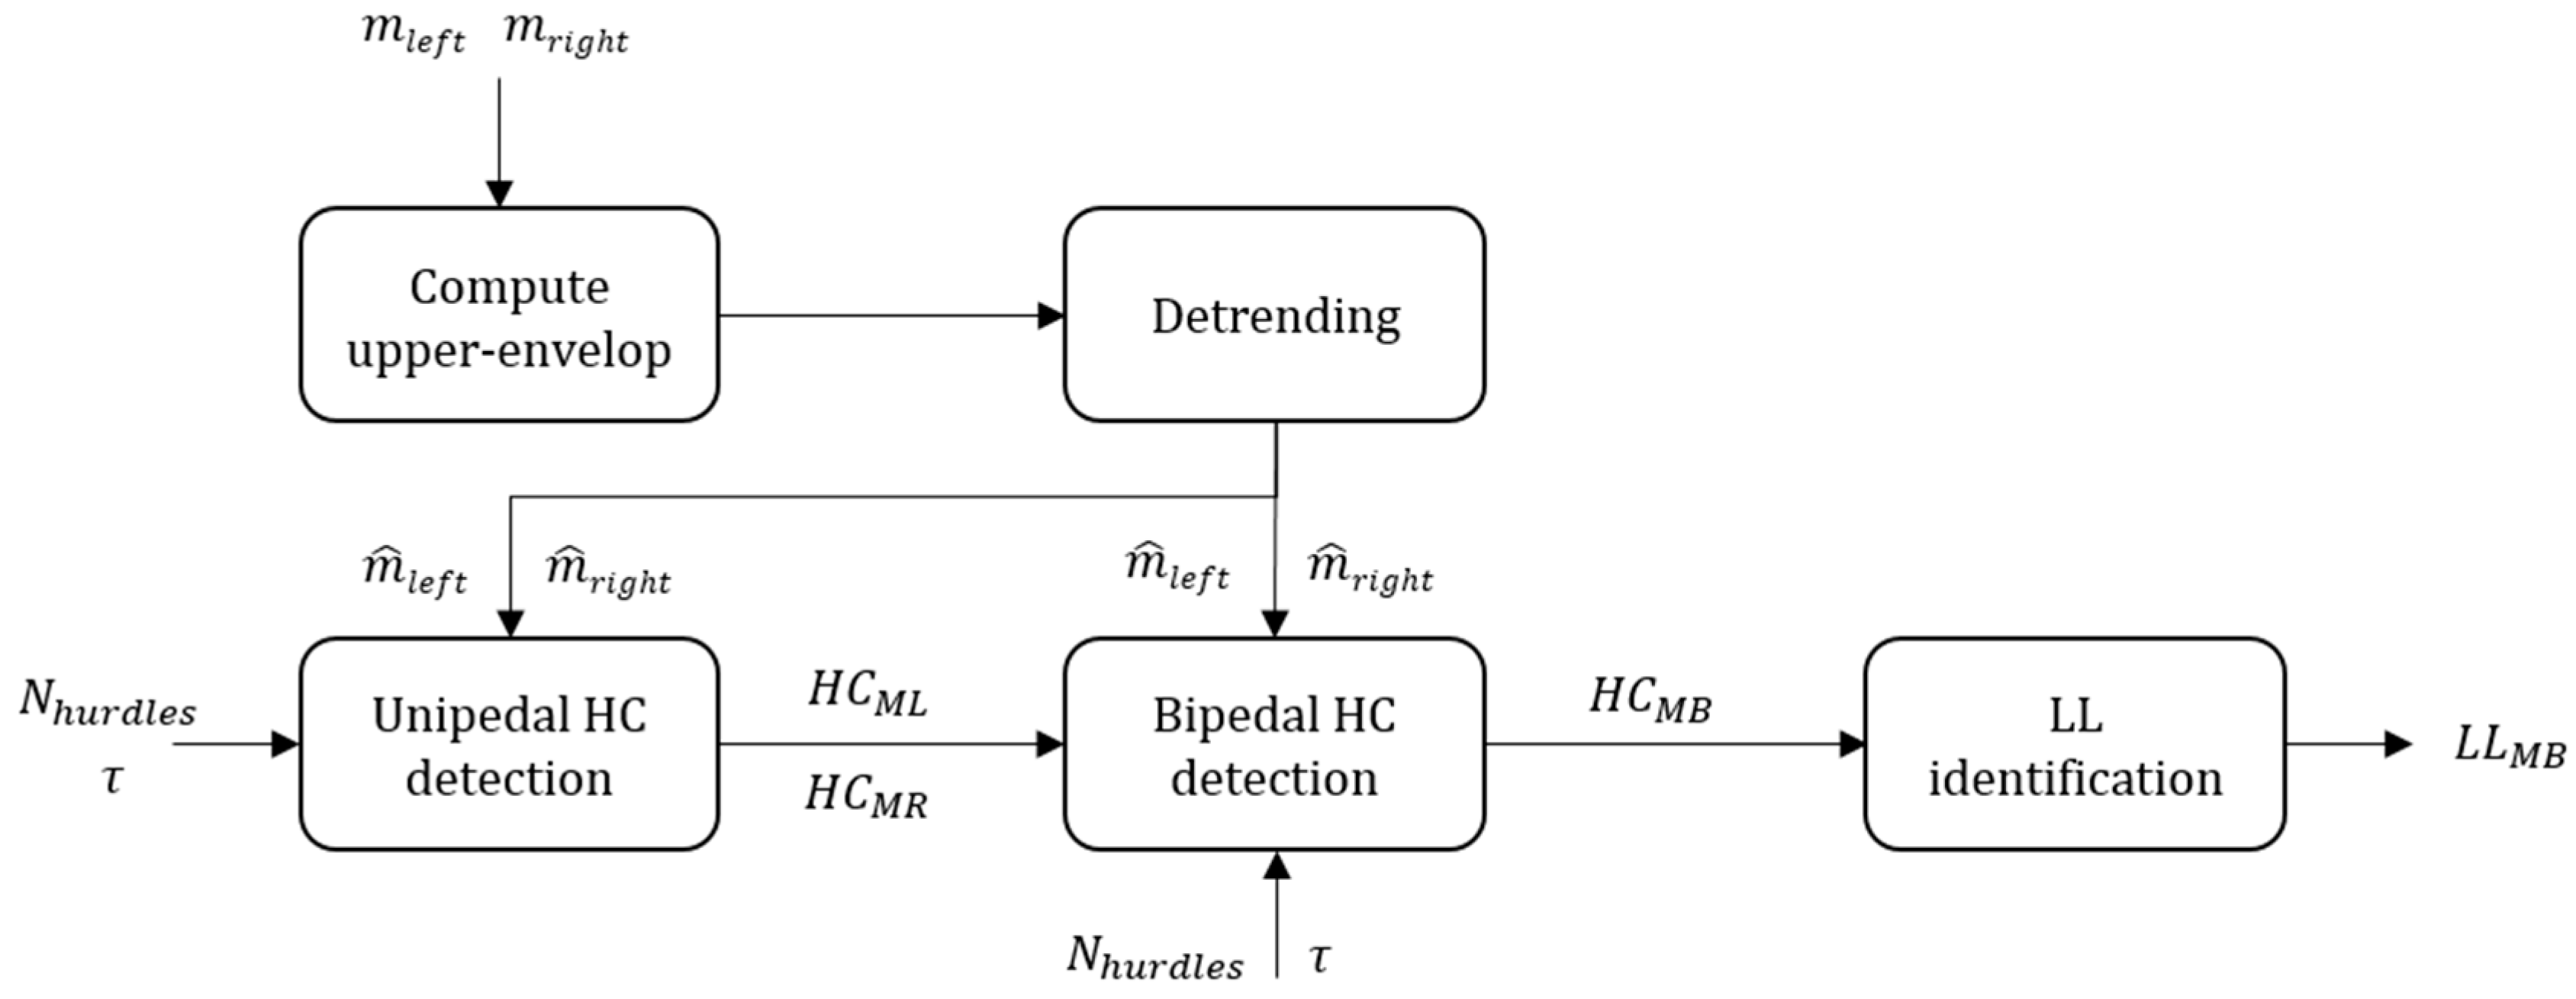
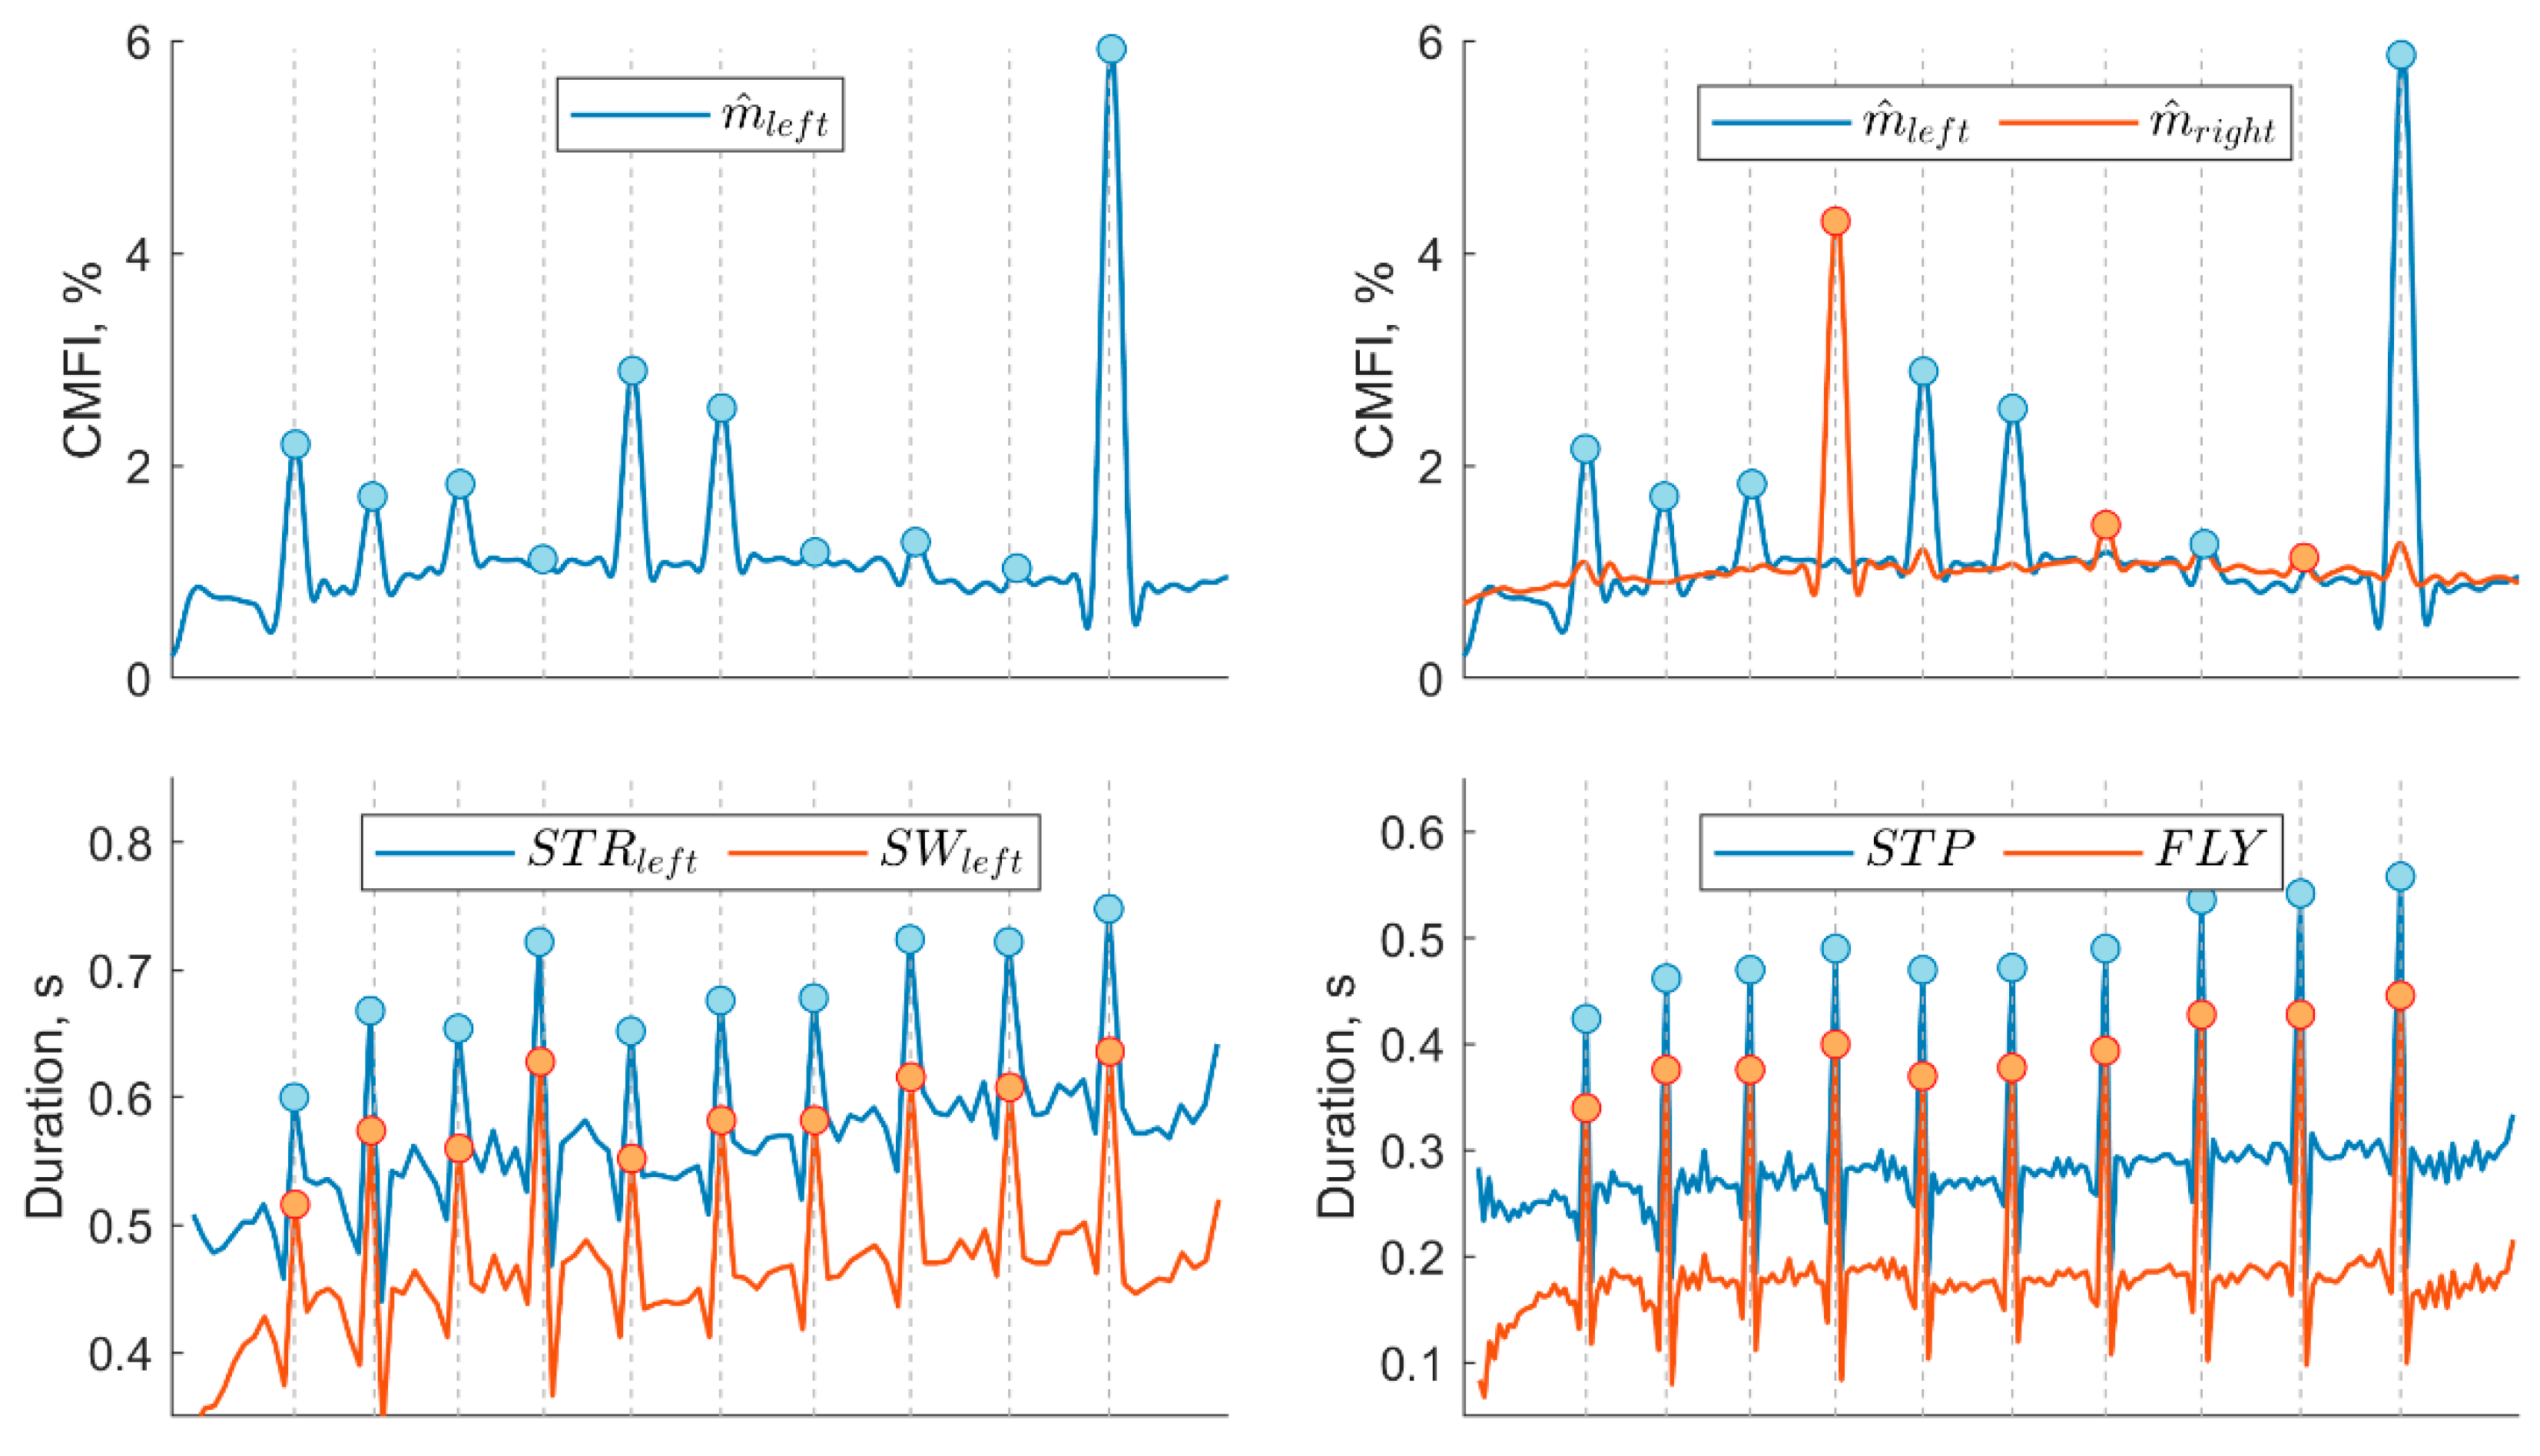
2.4.1. MAG: Magnets and Magnetometer Based Detection
- (1)
- If |HCML(i) − HCMR(j)| < 0.4 s, i and j ∈ {1, …, Nhurdles}, then 0.5 * (HCML(i) + HCMR(j)) was added to HCMB. Here, we assumed that if two HC events occurred within a short period (i.e., 0.4 s = average flight time in [22]) and were detected on the left and right foot distinctively, then these events were likely to correspond to a true HC. As we could not predict which of the left or right event was more accurate, we defined the time of the true HC event as the average of the left and right foot events.
- (2)
- The i and j indices not considered in step 1 were recursively added to HCMB until dim(HCMB) = Nhurdles. The greatest peaks were added first if they were minimum τ = 3 s away from all the HC already in HCMB. Finally, the results were sorted in their order of appearance within the race.
2.4.2. TEMP: Temporal Event-Based Detection
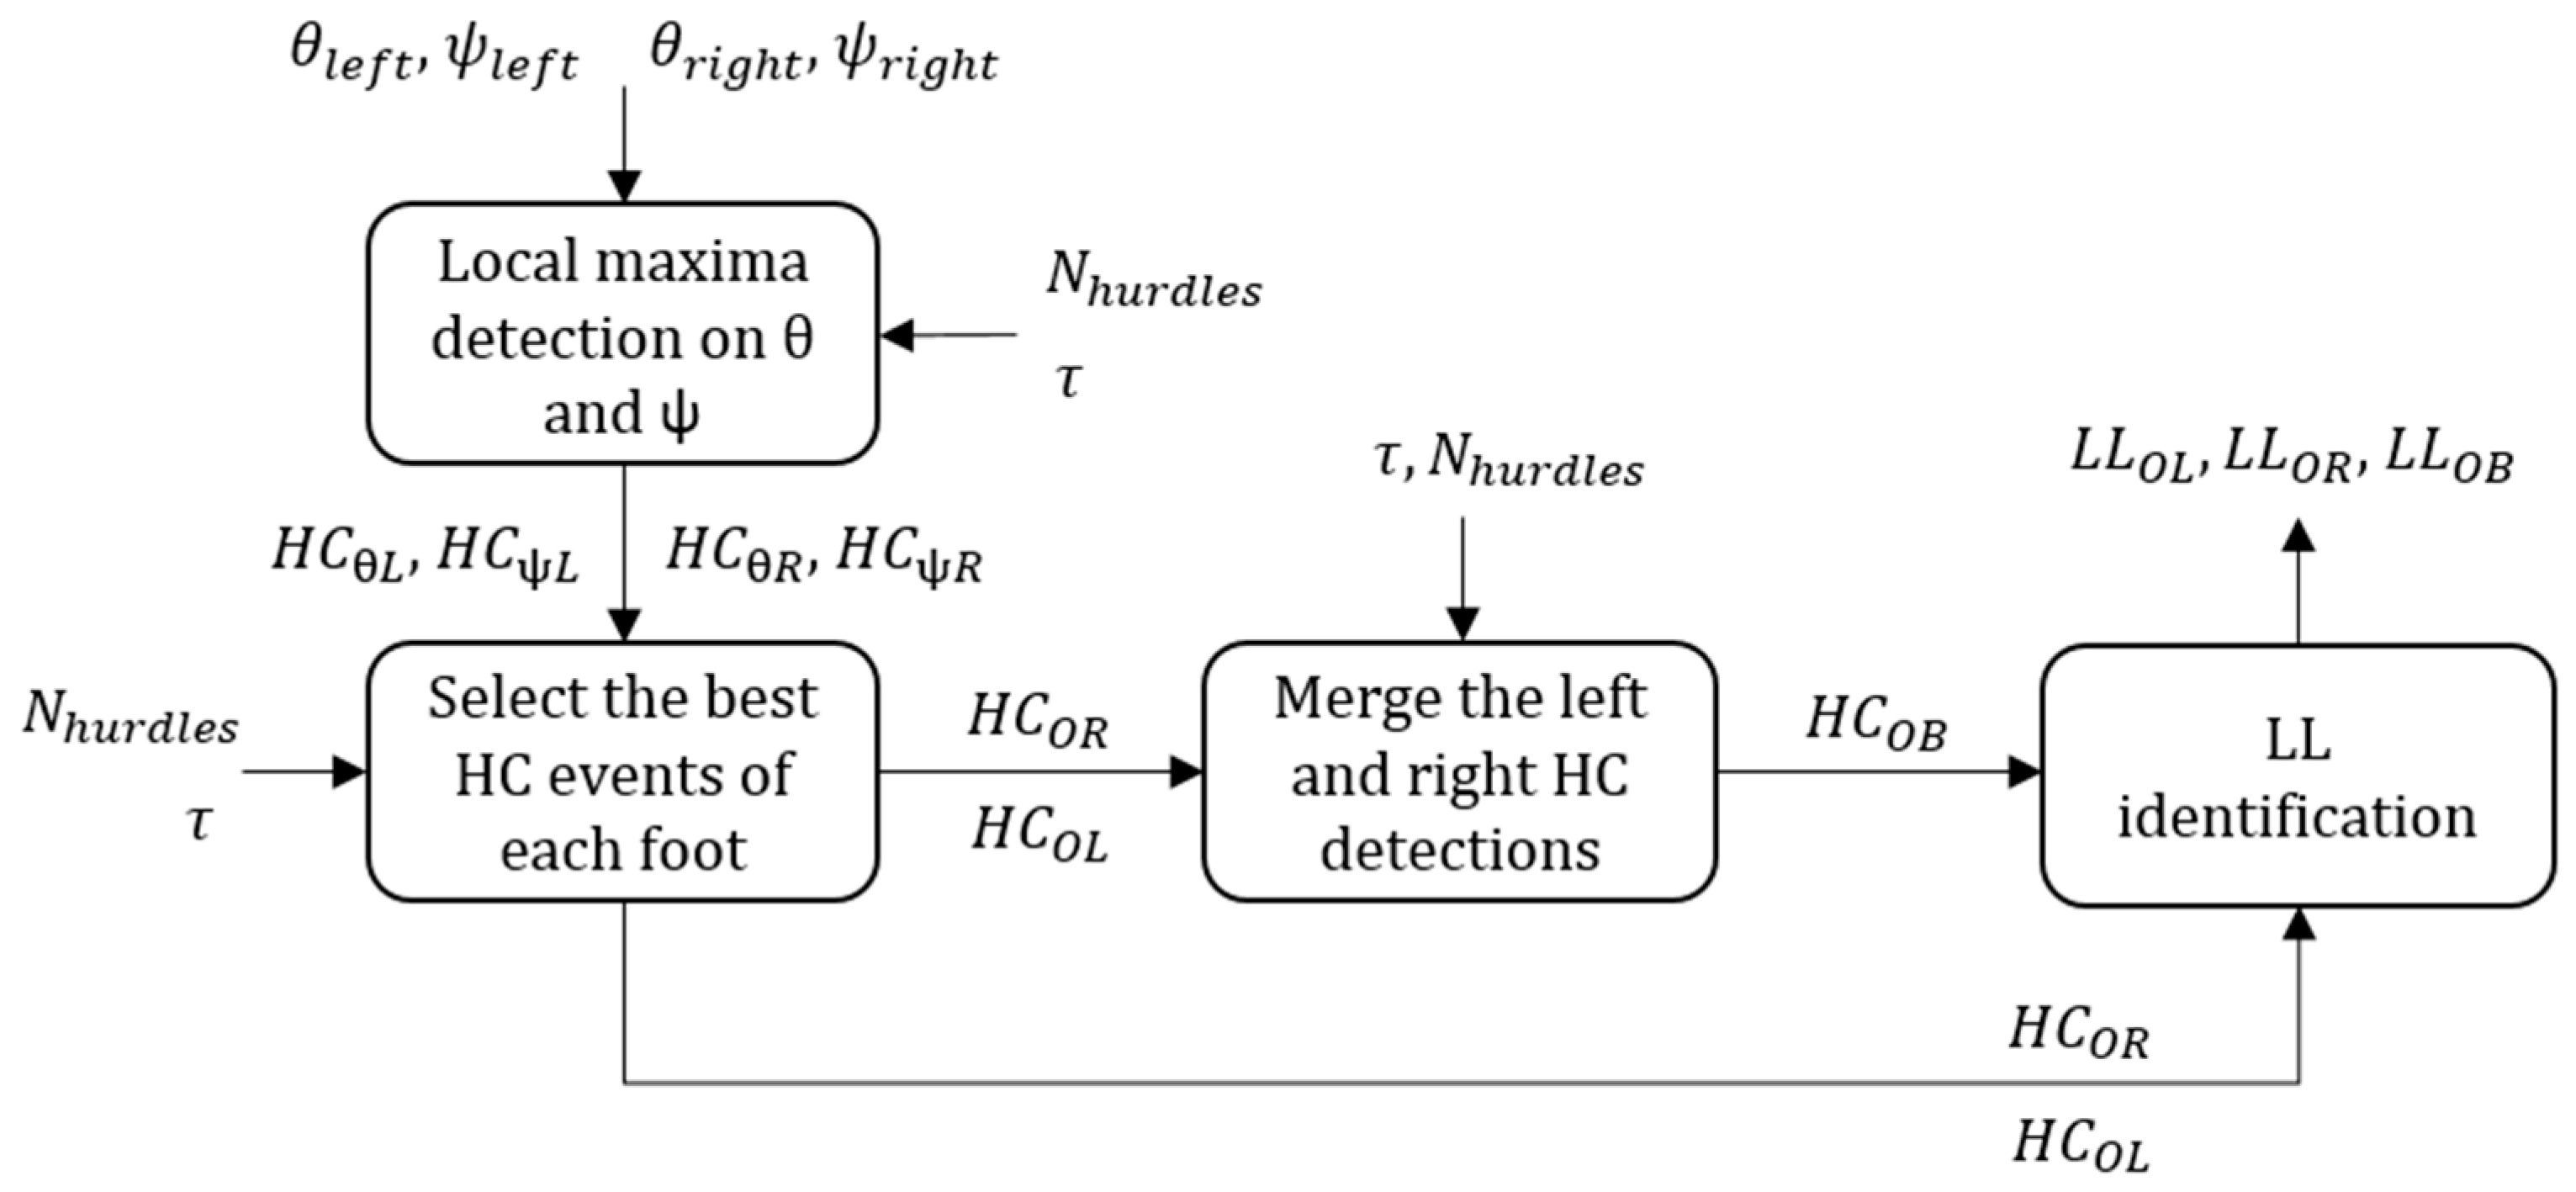
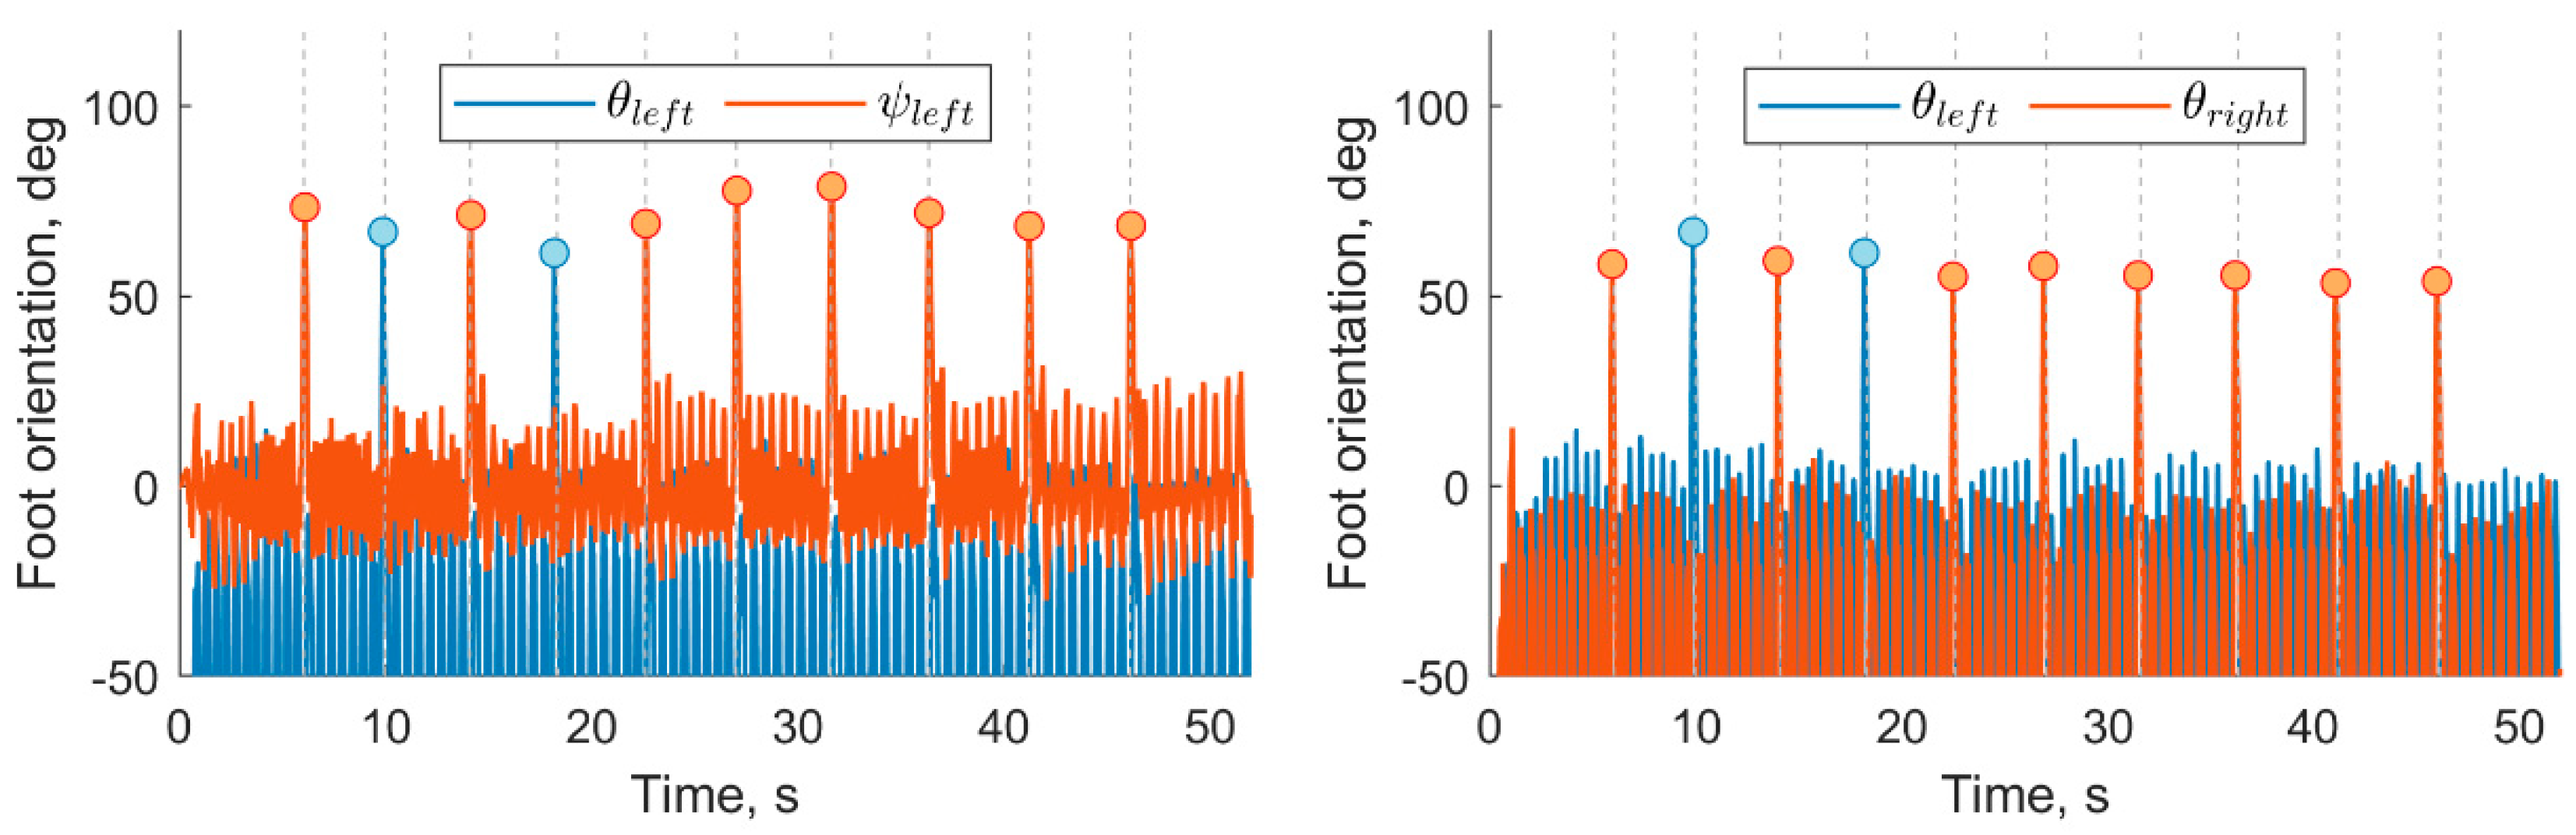
2.4.3. ORIENT: Orientation based Detection
- (1)
- If |HCOL(i) – HCOR(j)| < 0.4 s, i and j ∈ {1, …, Nhurdles}, then 0.5 * (HCOL(i) + HCOR(j)) was added to HCOB. Here, we assumed that if two HC events occurred within a short period (i.e., 0.4 s = average flight time in [22]) and were detected on the left and right foot distinctively, then these events were likely to correspond to a true HC. As we could not predict which of the left or right event was more accurate, we defined the time of the true HC event as the average of the left and right foot events.The i and j indices not considered in step 1 were recursively added to HCOB until dim(HCOB) = Nhurdles. The greatest peaks were added first if they were minimum τ = 3 s away from all the HC already in HCOB. Finally, the results were sorted in their order of appearance within the race.
2.5. Data Analysis
3. Results
4. Discussion
5. Conclusions
Author Contributions
Funding
Acknowledgments
Conflicts of Interest
Abbreviation
| Acronyms | Definition |
| AvCT(k) | Average CT within the kth interval expressed relatively to AvCT(2) |
| AvFLY(k) | Average FLY within the kth interval expressed relatively to AvFLY(2) |
| AvSPE(k) | Average SPE within the kth interval expressed relatively to AvSPE(2) |
| AvSTF(k) | Average STF within the kth interval expressed relatively to AvSTF(2) |
| CMFI | Calibrated magnetic field intensity |
| CT | Contact time |
| DH | Distance between the hurdles |
| FF | Functional frame |
| FLY | Flight phase duration |
| GF | Global frame |
| HC | Hurdle clearance |
| HCFLY | HC detection results of the FLY parameter in the TEMP method |
| HCMB | Bipedal HC detection results of the MAG method |
| HCML | Left foot HC detection results of the MAG method |
| HCMR | Right foot HC detection results of the MAG method |
| HCψL | Left foot HC detection results based on ψleft in the ORIENT method |
| HCψR | Right foot HC detection results based on ψright in the ORIENT method |
| HCOB | Bipedal HC detection results of the ORIENT method (HCOL and HCOR combined) |
| HCOL | Left foot HC detection results of the ORIENT method (HCθL and HCψL combined) |
| HCOR | Right foot HC detection results of the ORIENT method (HCθR and HCψR combined) |
| HCref | Reference HC time |
| HCSTP | HC detection results of the STP parameter in the TEMP method |
| HCSTR | HC detection results of the STR parameter in the TEMP method |
| HCSW | HC detection results of the SW parameter in the TEMP method |
| HCθL | Left foot HC detection results based on θleft in the ORIENT method |
| HCθR | Right foot HC detection results based on θright in the ORIENT method |
| IC | Initial contact |
| IMU | Inertial measurement unit |
| LL | Leading leg |
| LLFLY | Bipedal LL detection results of the TEMP method using the FLY parameter |
| LLMB | Bipedal LL detection results of the MAG method |
| LLSTP | Bipedal LL detection results of the TEMP method using the STP parameter |
| mleft | Magnetometer signal recorded on the left foot |
| left | Preprocessed magnetometer signal from the left foot |
| mright | Magnetometer signal recorded on the right foot |
| right | Preprocessed magnetometer signal from the right foot |
| MAG | Magnetometer based method for HC and LL detection |
| MIMU | Magnetic inertial measurement unit |
| MS | Mid-stance |
| Nhurdles | Total number of hurdles |
| ORIENT | Orientation based method for HC and LL detection |
| ψ | Yaw angle |
| Normalized yaw angle | |
| ψleft | Yaw angle measured on the left foot |
| ψright | Yaw angle measured on the right foot |
| SPE | Speed |
| STF | Step frequency |
| STP | Step duration |
| STR | Stride time |
| SW | Swing phase duration |
| τ | Minimum time difference between two consecutive HC |
| Trace | Official race time of a participant |
| tstart | Time of the start of the race |
| ΔtHC | Differences in HC detection time |
| TC | Terminal contact |
| TEMP | Temporal parameter-based method for HC and LL detection |
| θ | Pitch angle |
| Normalized pitch angle | |
| θleft | Pitch angle measured on the left foot |
| θright | Pitch angle measured on the right foot |
| Vmax | Maximum running speed considered (42 km/h) |
References
- Macadam, P.; Cronin, J.; Neville, J.; Diewald, S. Quantification of the validity and reliability of sprint performance metrics computed using inertial sensors: A systematic review. Gait Posture 2019, 73, 26–38. [Google Scholar] [CrossRef] [PubMed]
- Bergamini, E.; Picerno, P.; Pillet, H.; Natta, F.; Thoreux, P.; Camomilla, V. Estimation of temporal parameters during sprint running using a trunk-mounted inertial measurement unit. J. Biomech. 2012, 45, 1123–1126. [Google Scholar] [CrossRef] [PubMed]
- Ammann, R.; Taube, W.; Wyss, T. Accuracy of PARTwear inertial sensor and Optojump optical measurement system for measuring ground contact time during running. J. Strength Cond. Res. 2016, 30, 2057–2063. [Google Scholar] [CrossRef] [PubMed]
- Purcell, B.; Channells, J.; James, D.; Barrett, R. Use of accelerometers for detecting foot-ground contact time during running. In BioMEMS and Nanotechnology II; International Society for Optics and Photonics: Bellingham, WA, USA, 2006; Volume 6036, p. 603615. [Google Scholar]
- Bergamini, E.; Guillon, P.; Camomilla, V.; Pillet, H.; Skalli, W.; Cappozzo, A. Trunk inclination estimate during the sprint start using an inertial measurement unit: A validation study. J. Appl. Biomech. 2013, 29, 622–627. [Google Scholar] [CrossRef]
- Channells, J.; Purcell, B.; Barrett, R.; James, D. Determination of rotational kinematics of the lower leg during sprint running using accelerometers. In BioMEMS and Nanotechnology II; International Society for Optics and Photonics: Bellingham, WA, USA, 2006; Volume 6036, p. 603616. [Google Scholar]
- Setuain, I.; Lecumberri, P.; Ahtiainen, J.P.; Mero, A.A.; Häkkinen, K.; Izquierdo, M. Sprint mechanics evaluation using inertial sensor-based technology: A laboratory validation study. Scand. J. Med. Sci. Sports 2018, 28, 463–472. [Google Scholar] [CrossRef]
- Gurchiek, R.D.; McGinnis, R.S.; Needle, A.R.; McBride, J.M.; van Werkhoven, H. The use of a single inertial sensor to estimate 3-dimensional ground reaction force during accelerative running tasks. J. Biomech. 2017, 61, 263–268. [Google Scholar] [CrossRef]
- Gurchiek, R.D.; McGinnis, R.S.; Needle, A.R.; McBride, J.M.; van Werkhoven, H. An adaptive filtering algorithm to estimate sprint velocity using a single inertial sensor. Sports Eng. 2018, 21, 389–399. [Google Scholar] [CrossRef]
- Mertens, J.C.; Boschmann, A.; Schmidt, M.; Plessl, C. Sprint diagnostic with GPS and inertial sensor fusion. Sports Eng. 2018, 21, 441–451. [Google Scholar] [CrossRef]
- Gurchiek, R.D.; Don Rupasinghe Arachchige, H.S.; Pelawa Watagoda, L.C.; McGinnis, R.S.; van Werkhoven, H.; Needle, A.R.; Arnholt, A.T. Sprint Assessment Using Machine Learning and a Wearable Accelerometer. J. Appl. Biomech. 2019, 35, 164–169. [Google Scholar] [CrossRef]
- Ho, C.S.; Chang, C.Y.; Lin, K.C. The wearable devices application for evaluation of 110 meter high hurdle race. J. Hum. Sport Exerc. 2020, 15. in press. [Google Scholar] [CrossRef]
- Iskra, J.; Przednowek, K.; Krzeszowski, T.; Wiktorowicz, K.; Pietrzak, M. Kinematic Analysis of the Upper Limbs in Stepping over the Hurdle—The Use of IMU-based Motion Capture. In Proceedings of the 5th International Congress on Sport Sciences Research and Technology Support, Funchal, Portugal, 30–31 October 2017. [Google Scholar]
- Iskra, J.; Coh, M. Biomechanical studies on running the 400 m hurdles. Hum. Mov. 2011, 12, 315–323. [Google Scholar] [CrossRef]
- Fasel, B.; Spörri, J.; Kröll, J.; Müller, E.; Aminian, K. A Magnet-Based Timing Tystem to Detect Gate Crossings in Alpine Ski Racing. Sensors 2019, 19, 940. [Google Scholar] [CrossRef] [PubMed]
- Ferraris, F.; Grimaldi, U.; Parvis, M. Procedure for effortless in-field calibration of three-axis rate gyros and accelerometers. Sens. Mater. 1995, 7, 311. [Google Scholar]
- Bonnet, S.; Bassompierre, C.; Godin, C.; Lesecq, S.; Barraud, A. Calibration methods for inertial and magnetic sensors. Sens. Actuators A Phys. 2009, 156, 302–311. [Google Scholar] [CrossRef]
- Falbriard, M.; Meyer, F.; Mariani, B.; Millet, G.P.; Aminian, K. Accurate estimation of running temporal parameters using foot-worn inertial sensors. Front. Physiol. 2018, 9, 610. [Google Scholar] [CrossRef]
- Brosnan, K.C.; Hayes, K.; Harrison, A.J. Effects of false-start disqualification rules on response-times of elite-standard sprinters. J. Sports Sci. 2017, 35, 929–935. [Google Scholar] [CrossRef]
- Favre, J.; Jolles, B.M.; Siegrist, O.; Aminian, K. Quaternion-based fusion of gyroscopes and accelerometers to improve 3D angle measurement. Electron. Lett. 2006, 42, 612–614. [Google Scholar] [CrossRef]
- Hanon, C.; Gajer, B. Velocity and stride parameters of world-class 400-meter athletes compared with less experienced runners. J. Strength Cond. Res. 2009, 23, 524–531. [Google Scholar] [CrossRef]
- Salo, A.; Grimshaw, P.N.; Marar, L. 3-D biomechanical analysis of sprint hurdles at different competitive levels. Med. Sci. Sports Exerc. 1997, 29, 231–237. [Google Scholar] [CrossRef]
- Coh, M.; Dolenec, A.; Tomazin, K.; Zvan, M. Dynamic and kinematic analysis of the hurdle clearance technique. Biomech. Diagn. Methods Athl. Train. 2008, 109–116. [Google Scholar]
- LaFortune, M.A. Biomechanical analysis of 110 m hurdles. Track Field News 1988, 105, 3355–3365. [Google Scholar]
- McLean, B. The biomechanics of hurdling: Force plate analysis to assess hurdling technique. In Proceedings of the ISBS-Conference Proceedings Archive, Budapest-Siófok, Hungary, 2–6 July 1994; Volume 1. [Google Scholar]
- Tidow, G. Model technique analysis sheets for the hurdles. Part VII: High hurdles. New Stud. Athl. 1991, 6, 51–66. [Google Scholar]
- Amara, S.; Mkaouer, B.; Chaabene, H.; Negra, Y.; Bensalah, F.Z. Key kinetic and kinematic factors of 110-m hurdles performance. J. Phys. Educ. Sport 2019, 19, 658–668. [Google Scholar]
- Otsuka, M.; Isaka, T. Intra-athlete and inter-group comparisons: Running pace and step characteristics of elite athletes in the 400-m hurdles. PLoS ONE 2019, 14, e0204185. [Google Scholar] [CrossRef] [PubMed]
- Przednowek, K.; Krzeszowski, T.; Iskra, J.; Wiktorowicz, K. Markerless Motion Tracking in Evaluation of Hurdle Clearance Parameters. In Proceedings of the icSPORTS, Rome, Italy, 24–26 October 2014; pp. 129–136. [Google Scholar]
- Nummela, A.; Vuorimaa, T.; Rusko, H. Changes in force production, blood lactate and EMG activity in the 400-m sprint. J. Sports Sci. 1992, 10, 217–228. [Google Scholar] [CrossRef] [PubMed]


| Parameters | Detection Required | ||
|---|---|---|---|
| IC | TC | Configuration | |
| STR | yes | no | Unipedal |
| SW | yes | yes | Unipedal |
| STP | yes | no | Bipedal |
| FLY | yes | yes | Bipedal |
| Methods | HC Detection per Trial | Correct HC | ΔtHC (ms) | LL Accuracy | ||||
|---|---|---|---|---|---|---|---|---|
| Mean | SD | min | max | /Total HC | Mean | SD | % (Total) | |
| Unipedal | ||||||||
| MAG | 4.63 | 2.76 | 0 | 9 | 139/300 | −12 | 100 | - |
| TEMPSTR | 9.97 | 0.18 | 9 | 10 | 299/300 | −138 | 106 | - |
| TEMPSW | 10 | 0 | 10 | 10 | 300/300 | −78 | 104 | - |
| ORIENT | 9.53 | 0.82 | 7 | 10 | 286/300 | −47 | 96 | 99.7 (285) |
| Bipedal | ||||||||
| MAG | 7.33 | 1.76 | 2 | 9 | 110/150 | 15 | 94 | 39.1 (43) |
| TEMPSTP | 10 | 0 | 10 | 10 | 150/150 | 2 | 4 | 100 (150) |
| TEMPFLY | 10 | 0 | 10 | 10 | 150/150 | 0 | 0 | 100 (150) |
| ORIENT | 9.6 | 0.91 | 7 | 10 | 144/150 | −42 | 33 | 99.3 (143) |
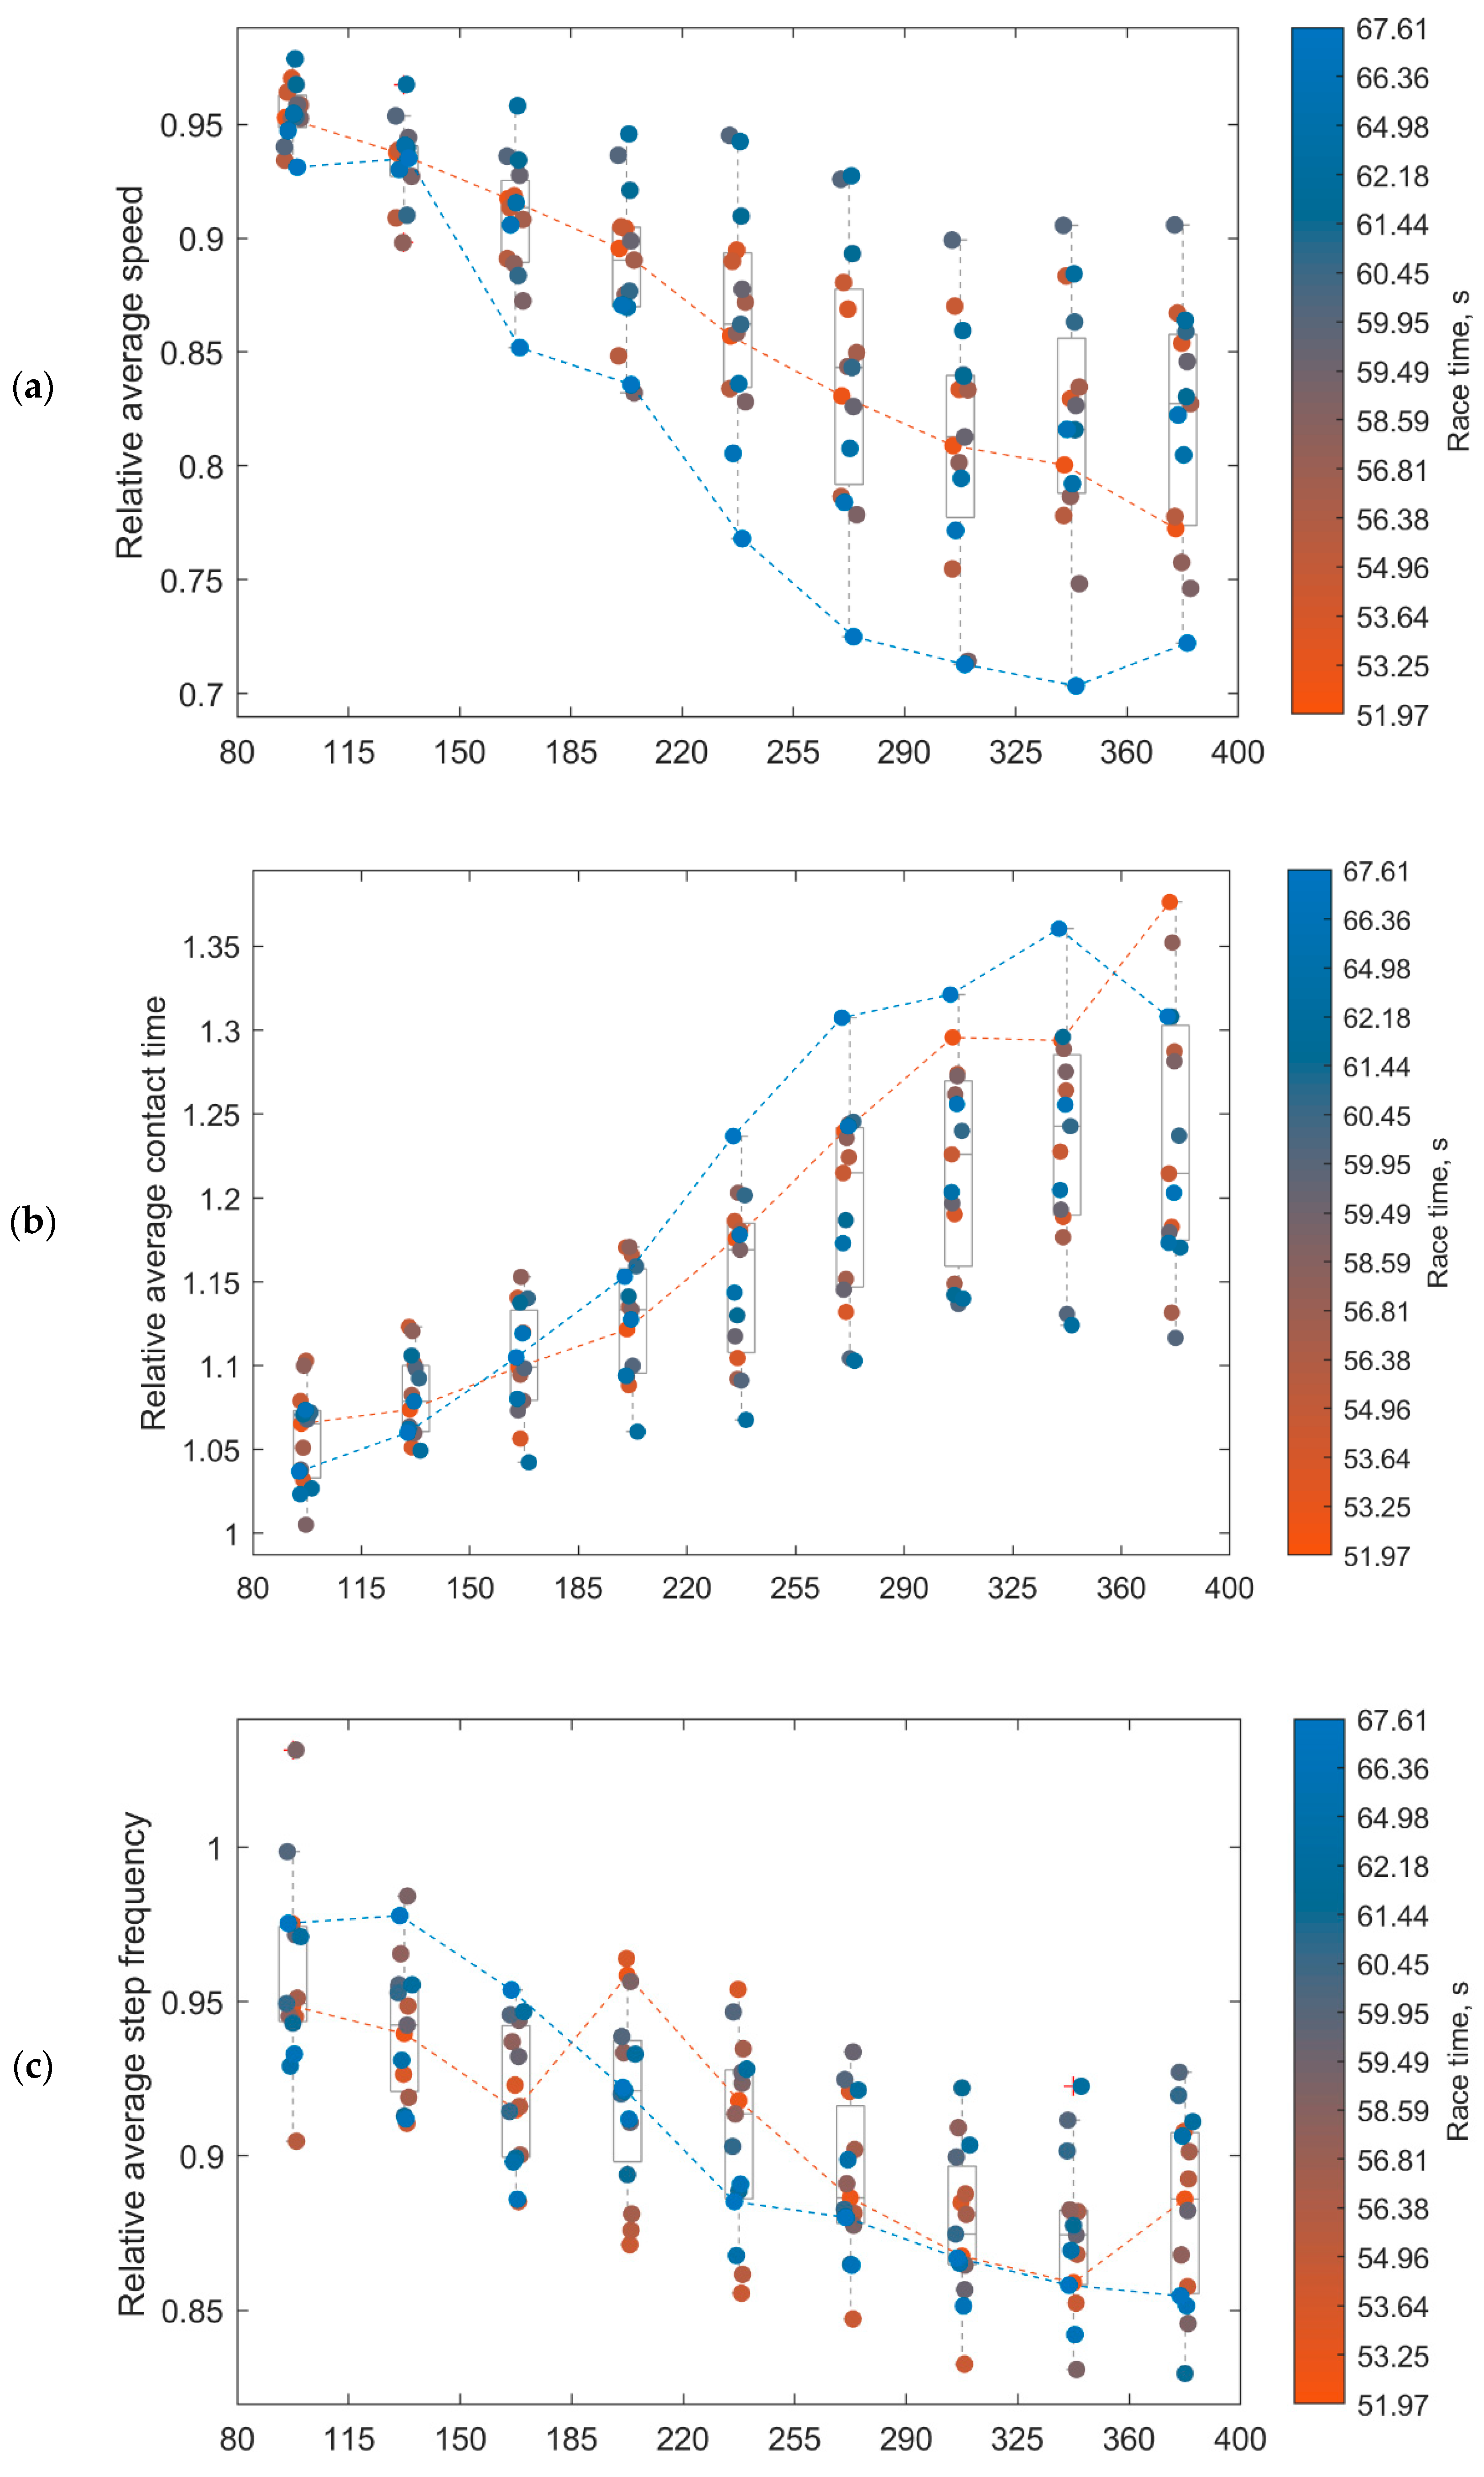
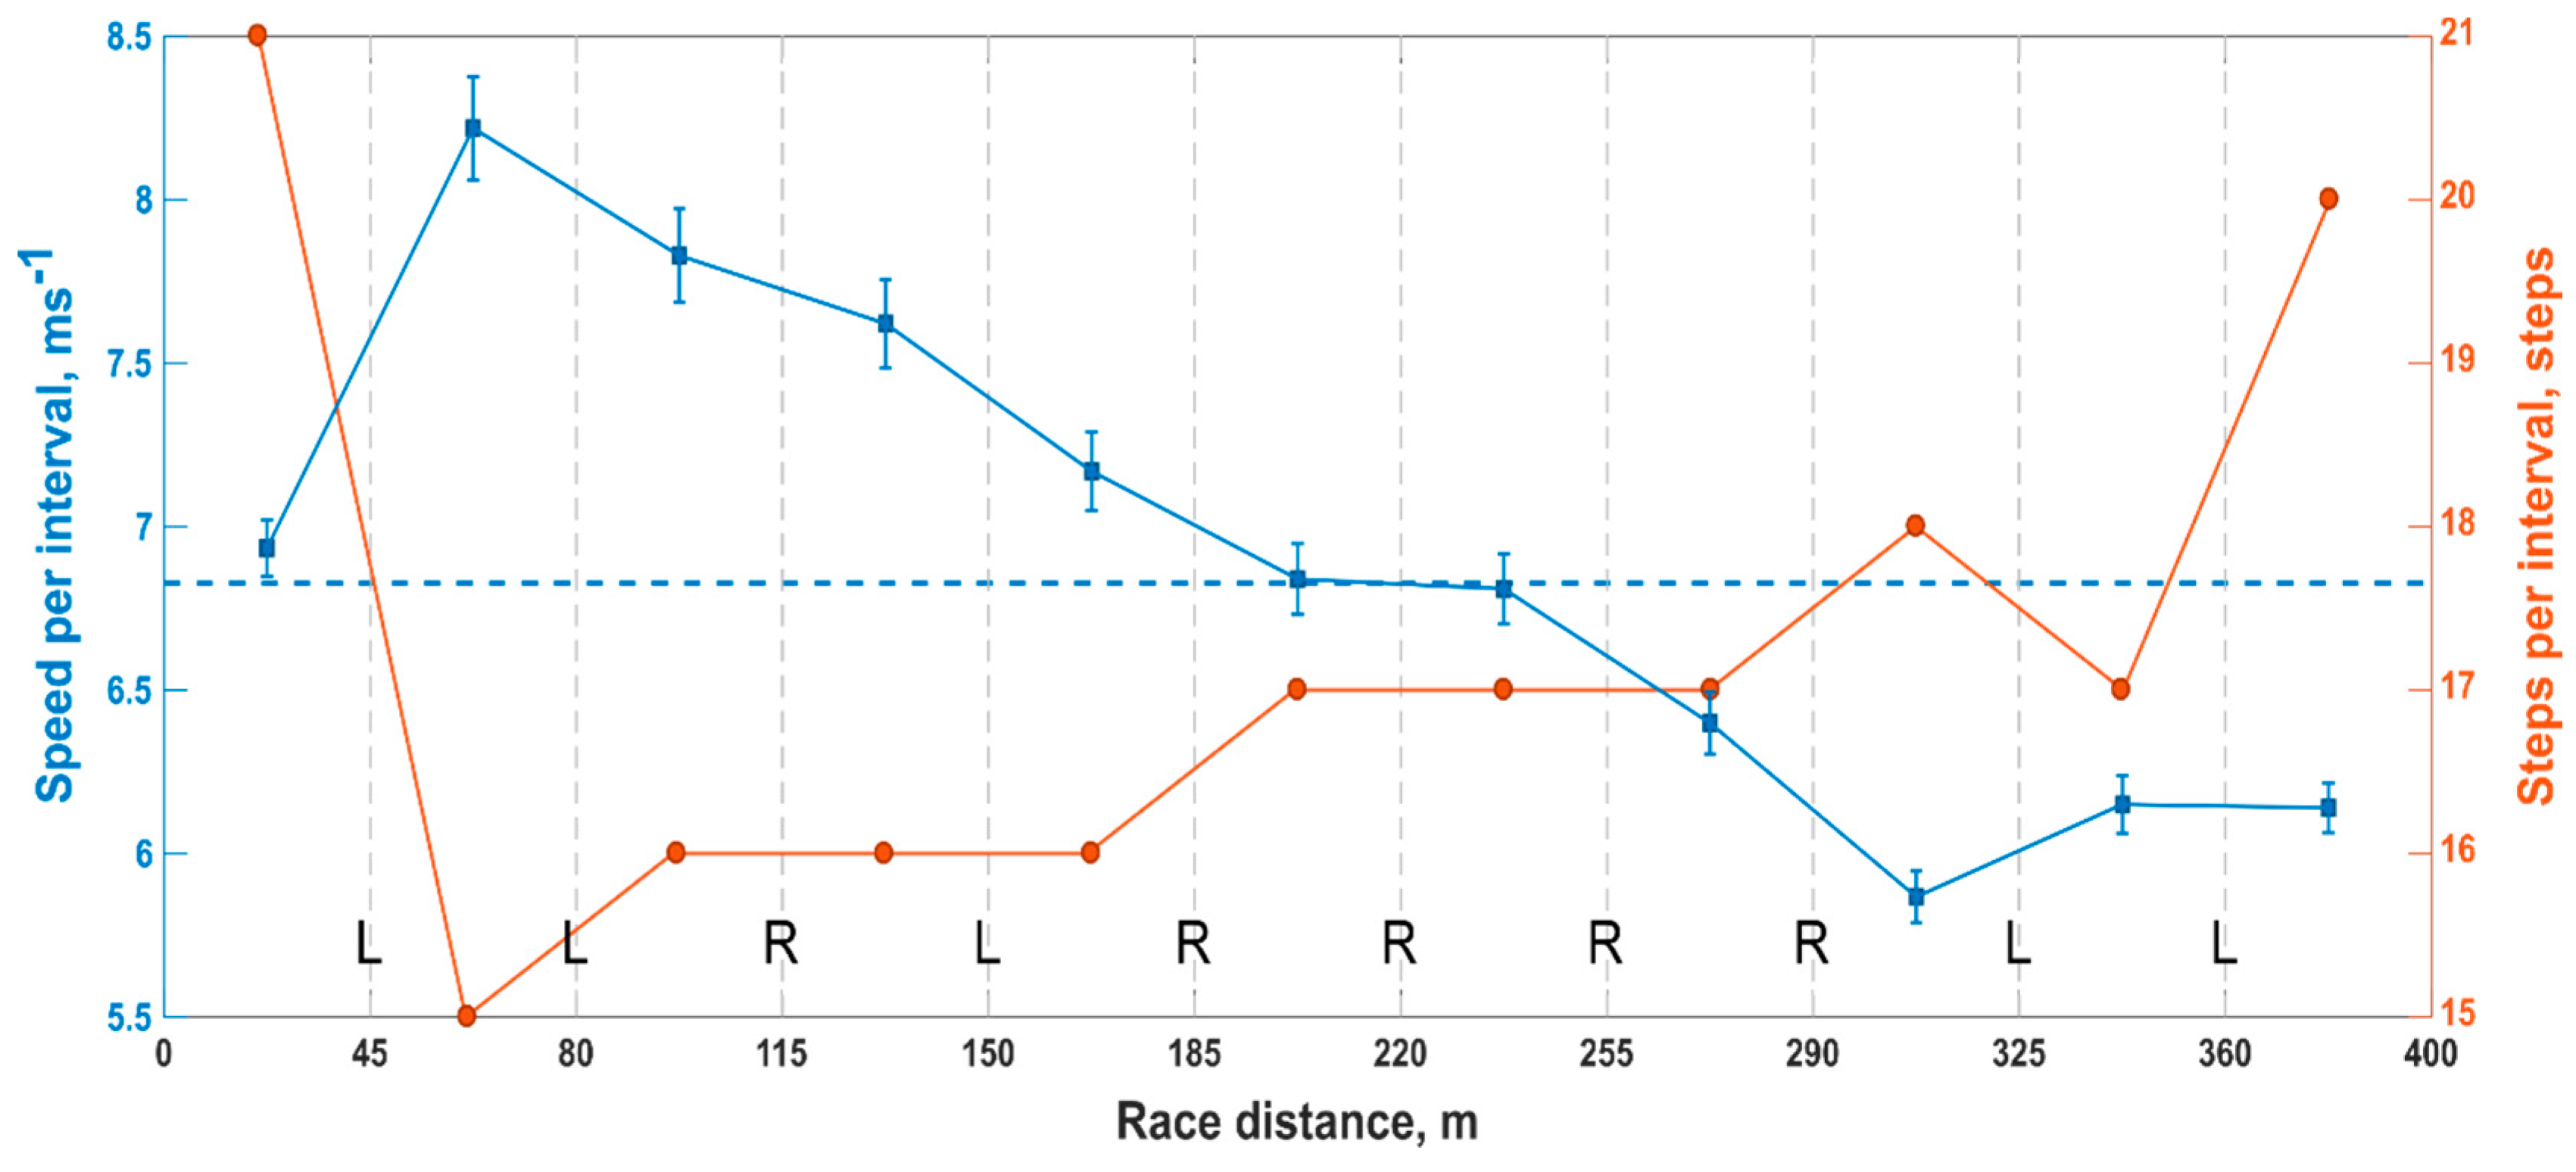
| Interval | Distance, m | CT, ms | FLY, ms | STF, Hz | SPE, ms−1 | ||||
|---|---|---|---|---|---|---|---|---|---|
| Mean | SD | Mean | SD | Mean | SD | Mean | SD | ||
| 1 | 0–45 | 110 | 7 | 154 | 11 | 3.8 | 0.15 | 6.73 | 0.44 |
| 2 | 45–80 | 104 | 8 | 160 | 10 | 3.81 | 0.11 | 7.77 | 0.64 |
| 3 | 80–115 | 110 | 9 | 165 | 10 | 3.65 * | 0.13 | 7.41 | 0.61 |
| 4 | 115–150 | 113 | 9 | 167 | 10 | 3.59 ** | 0.11 | 7.24 | 0.55 |
| 5 | 150–185 | 115 | 10 | 171 | 10 | 3.51 ** | 0.1 | 7.05 * | 0.57 |
| 6 | 185–220 | 118 ** | 10 | 169 | 7 | 3.5 ** | 0.11 | 6.88 ** | 0.56 |
| 7 | 220–255 | 120 ** | 10 | 170 | 8 | 3.46 ** | 0.11 | 6.72 ** | 0.63 |
| 8 | 255–290 | 125 ** | 11 | 170 | 9 | 3.4 ** | 0.09 | 6.5 ** | 0.64 |
| 9 | 290–325 | 127 ** | 10 | 173 * | 11 | 3.35 ** | 0.13 | 6.28 ** | 0.61 |
| 10 | 325–360 | 129 ** | 12 | 172 * | 13 | 3.33 ** | 0.11 | 6.34 ** | 0.59 |
| 11 | 360–400 | 128 ** | 10 | 170 | 10 | 3.36 ** | 0.11 | 6.34 ** | 0.54 |
© 2020 by the authors. Licensee MDPI, Basel, Switzerland. This article is an open access article distributed under the terms and conditions of the Creative Commons Attribution (CC BY) license (http://creativecommons.org/licenses/by/4.0/).
Share and Cite
Falbriard, M.; Mohr, M.; Aminian, K. Hurdle Clearance Detection and Spatiotemporal Analysis in 400 Meters Hurdles Races Using Shoe-Mounted Magnetic and Inertial Sensors. Sensors 2020, 20, 354. https://doi.org/10.3390/s20020354
Falbriard M, Mohr M, Aminian K. Hurdle Clearance Detection and Spatiotemporal Analysis in 400 Meters Hurdles Races Using Shoe-Mounted Magnetic and Inertial Sensors. Sensors. 2020; 20(2):354. https://doi.org/10.3390/s20020354
Chicago/Turabian StyleFalbriard, Mathieu, Maurice Mohr, and Kamiar Aminian. 2020. "Hurdle Clearance Detection and Spatiotemporal Analysis in 400 Meters Hurdles Races Using Shoe-Mounted Magnetic and Inertial Sensors" Sensors 20, no. 2: 354. https://doi.org/10.3390/s20020354
APA StyleFalbriard, M., Mohr, M., & Aminian, K. (2020). Hurdle Clearance Detection and Spatiotemporal Analysis in 400 Meters Hurdles Races Using Shoe-Mounted Magnetic and Inertial Sensors. Sensors, 20(2), 354. https://doi.org/10.3390/s20020354