Letter

Paper-Based Analytical Devices for the Rapid and Direct Electrochemical Detection of Hydrogen Peroxide in Tomato Leaves Inoculated with Botrytis cinerea

1
Department of Biological Sciences, School of Life Sciences, Nantong University, 9 Seyuan Rd, Nantong 226019, Jiangsu, China
2
National Key Laboratory for Rice Biology, Institute of Biotechnology, Zhejiang University, Hangzhou 310029, Zhejiang, China
3
Department of Agronomy and Center for Plant Biology, Purdue University, West Lafayette, IN 47907, USA
*
Author to whom correspondence should be addressed.
These authors contributed equally to this work.
Sensors 2020, 20(19), 5512; https://doi.org/10.3390/s20195512
Submission received: 13 August 2020 / Revised: 23 September 2020 / Accepted: 24 September 2020 / Published: 26 September 2020
(This article belongs to the Section Biosensors)

Abstract

:
Hydrogen peroxide (H2O2) is an important signaling molecule and plays key roles in multiple plant physiological processes. The rapid and direct monitoring of H2O2 could improve our understanding of its regulatory mechanisms in plants. In this study, we developed a paper-based analytical device consisting of a disposable nano-gold modified indium tin oxide working electrode to provide a platform for the rapid and direct detection of H2O2. The total analytical time was dramatically shortened to be approximate 3 min due to the avoidance of the time-consuming and complex treatment of plant samples. In addition, the amount of plant samples required was less than 3 mg in our approach. We used this system to monitor the concentrations of H2O2 in tomato leaves infected by Botrytis cinerea within 24 h. Our results showed that the concentration of H2O2 in tomato leaves was increased in the initial phase, peaked at 1.5 μmol gFW−1 at 6 h, and then decreased. The production trend of H2O2 in tomato leaves inoculated with Botrytis cinerea detected with our approach is similar to the 3,3-diaminobenzidine staining method. Taken together, our study offers a rapid and direct approach for the detection of H2O2, which will not only pave the way for the further investigation of the regulation mechanisms of H2O2 in plants, but also promote the development of precision agriculture technology.

1. Introduction

Hydrogen peroxide (H2O2), a simple molecule discovered by Louis Jacques Denard 100 years ago, is one of the primary reactive oxygen species (ROS) in plants [1,2,3]. Compared to other ROS, such as superoxide anion radicals (O2•−) and hydroxyl radicals (OH•), H2O2 is relatively stable, less reactive, and electrically neutral. These characteristics of H2O2 enable the molecule to translocate cell membranes and reach cell locations that are distant from the site of its formation [1,2,3]. H2O2 can be produced via various metabolic pathways in plant organelles, including chloroplasts, mitochondria, and peroxisomes [4,5,6]. H2O2 plays key roles in multiple plant physiological processes, including participating in responses to biotic stresses [1,2,7,8]. The possible mechanisms of the H2O2 response to pathogen infection have been documented, including the modification of the cell wall, the signal transduction pathway, programmed cell death, and system-acquired resistance [7,8]. When plants are infected by pathogens, H2O2 is produced and accumulated at the infected sites (oxidative burst), which can trigger programmed cell death to prevent the further spread of the pathogen [9]. H2O2 also crosstalks with plant hormones such as salicylic acid, jasmonates, and auxin to regulate the plant defense reactions [10,11,12,13,14]. For example, the concentration of H2O2 could be increased under salicylic acid-binding protein inhabitable catalase activity [15,16], while salicylic acid can increase the quantity of H2O2, which induces the expression of defense-related genes associated with systemic-acquired resistance [16].
Although studies on the roles of H2O2 in biotic stress responses have made great advances [1,2,7,8], there is still no direct evidence for the biosynthesis sites, synthesis initiation times, and transport of H2O2 during the interaction between plant and pathogen, which greatly limits the capacity to determine the distribution of H2O2 and its dynamic change in plants. Therefore, the rapid monitoring of H2O2 is essential in understanding its regulatory mechanisms in plants. Currently, the detection of H2O2 is carried out mostly via techniques such as titration, spectroscopy colorimetry, chromatography, chemiluminescence, and fluorescence [17,18,19,20,21,22]. Such methods have limited success due to the long duration required to prepare samples. For example, plant samples need to be separated and ground before detection. The complex and time-consuming pre-treatments may lead to the loss or alteration of H2O2 concentrations or forms, which makes it a challenging task to accurately obtain the concentration of H2O2.
Electrochemical methods provide a convenient means for the detection of H2O2 due to their relative ease of operation, high selectivity, and sensitivity in molecule detection and quantification [23]. For the electrochemical detection of H2O2 in plants, only a few reports involving microelectrode sensors have been described to detect the H2O2 in plant cells [24,25] or leaves [26,27] in situ and in real time. For example, a dual-function platinum disc microelectrode sensor was used for the in situ monitoring of H2O2 produced in Agave tequilana leaves after inoculation with their endophytic bacteria [27]. Paper-based electroanalytical devices also provide a potential alternative approach for the detection of H2O2 in plants in situ and in real time. In our previous reports, we have integrated paper-based electrochemical devices with MWCNTS-Nafion-modified carbon tape electrodes directly on tomato leaves for the in situ determination of salicylic acid concentrations with the sample volume of several microliters [28]. The concentrations of both indole-3-acetic acid and salicylic acid could be rapidly quantified in plant samples to the microgram level [29].
In the present study, an electrochemical detection platform consisting of a paper-based analysis device, a disposable nano-gold-modified indium tin oxide (ITO) working electrode, and an electrochemical workstation for the detection of H2O2 in plants were developed. Compared with traditional methods for the detection of H2O2, our study provided a rapid and direct approach for the detection of H2O2 in plants, which will help to further investigate the regulating mechanisms of H2O2 in plants. In addition, assisted by a portable electrochemical workstation, our system allows the detection of H2O2 in plants grown in the field, which will promote the development of precision agriculture technology.

2. Materials and Methods

2.1. Chemicals and Materials

Hydrogen tetrachloroaurate (III) trihydrate (HAuCl4•3H2O), abscisic acid, indole-3-acetic acid, salicylic acid, jasmonic acid, methyl jasmonate, and ascorbic acid were purchased from Sigma (St. Louis, MO, USA). The H2O2 (30% wt. in water) was purchased from Shanghai Chemical Reagent Company. All the other chemical reagents were of analytical grade. The ITO conductive glass (40.64 × 35.56 × 0.11 cm STN, 10 ohm) was obtained from Nanbo Display Technology Co., Ltd. (Shenzhen, Guangdong, China). The Whatman No. 1 qualitative filter paper was obtained from GE Healthcare Bio-Sciences (Pittsburgh, PA, USA). The Harris Uni-CoreTM (Tip ID 4.0 mm) Miltex® was purchased from Ted Pella Inc. (Redding, CA, USA). The tomato seeds (Shanghai 906, one-generation hybrid) were purchased from Lintong Changfeng Vegetable Breeding Farm in Xi’an City. The H2O2 was obtained from Shanghai Zhanyun Chemical Co. Ltd. (Shanghai, China). Double-distilled water was used in all the experiments.

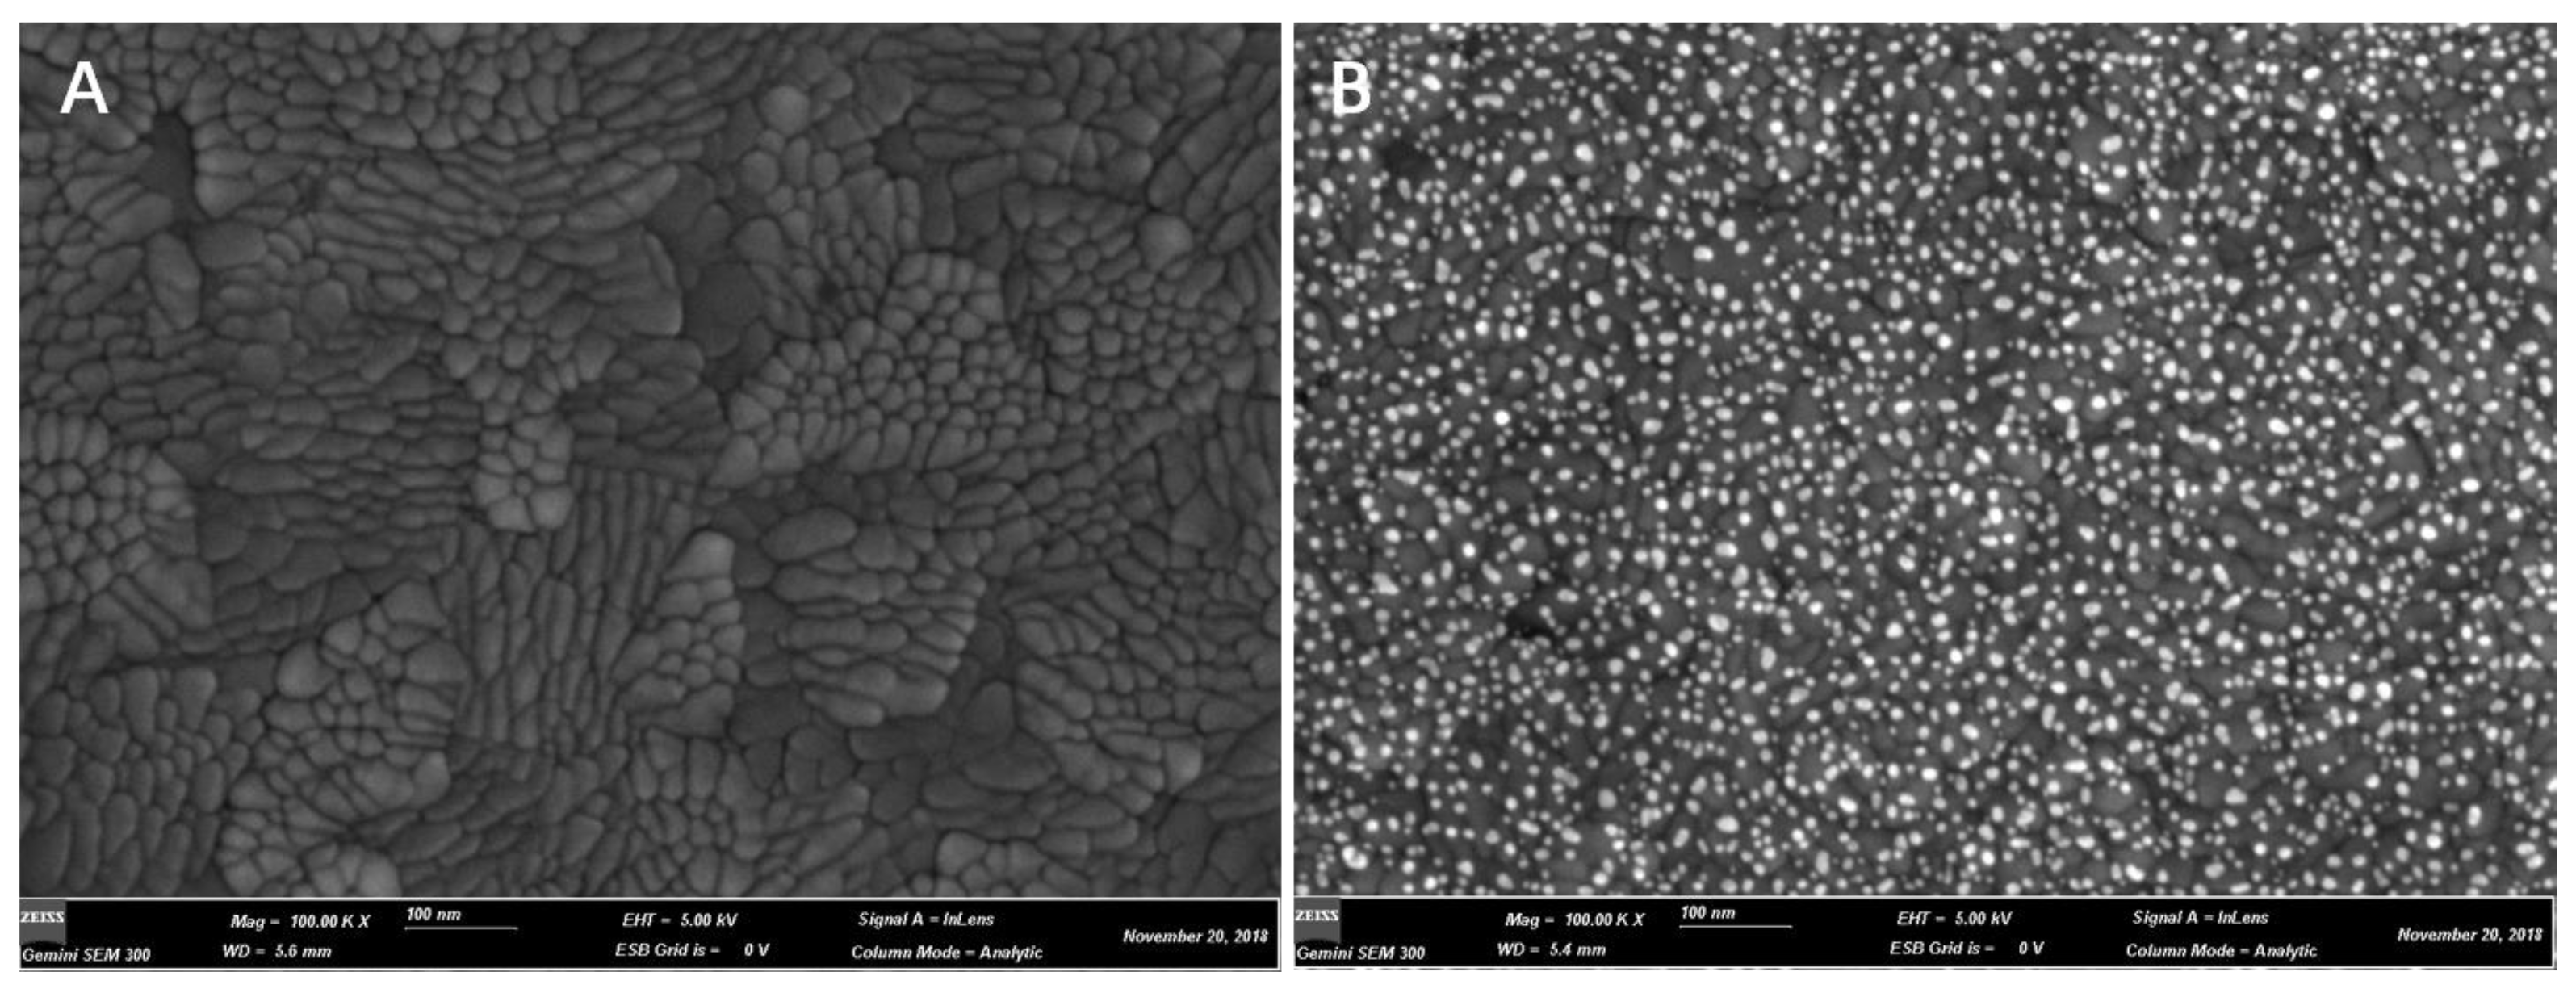
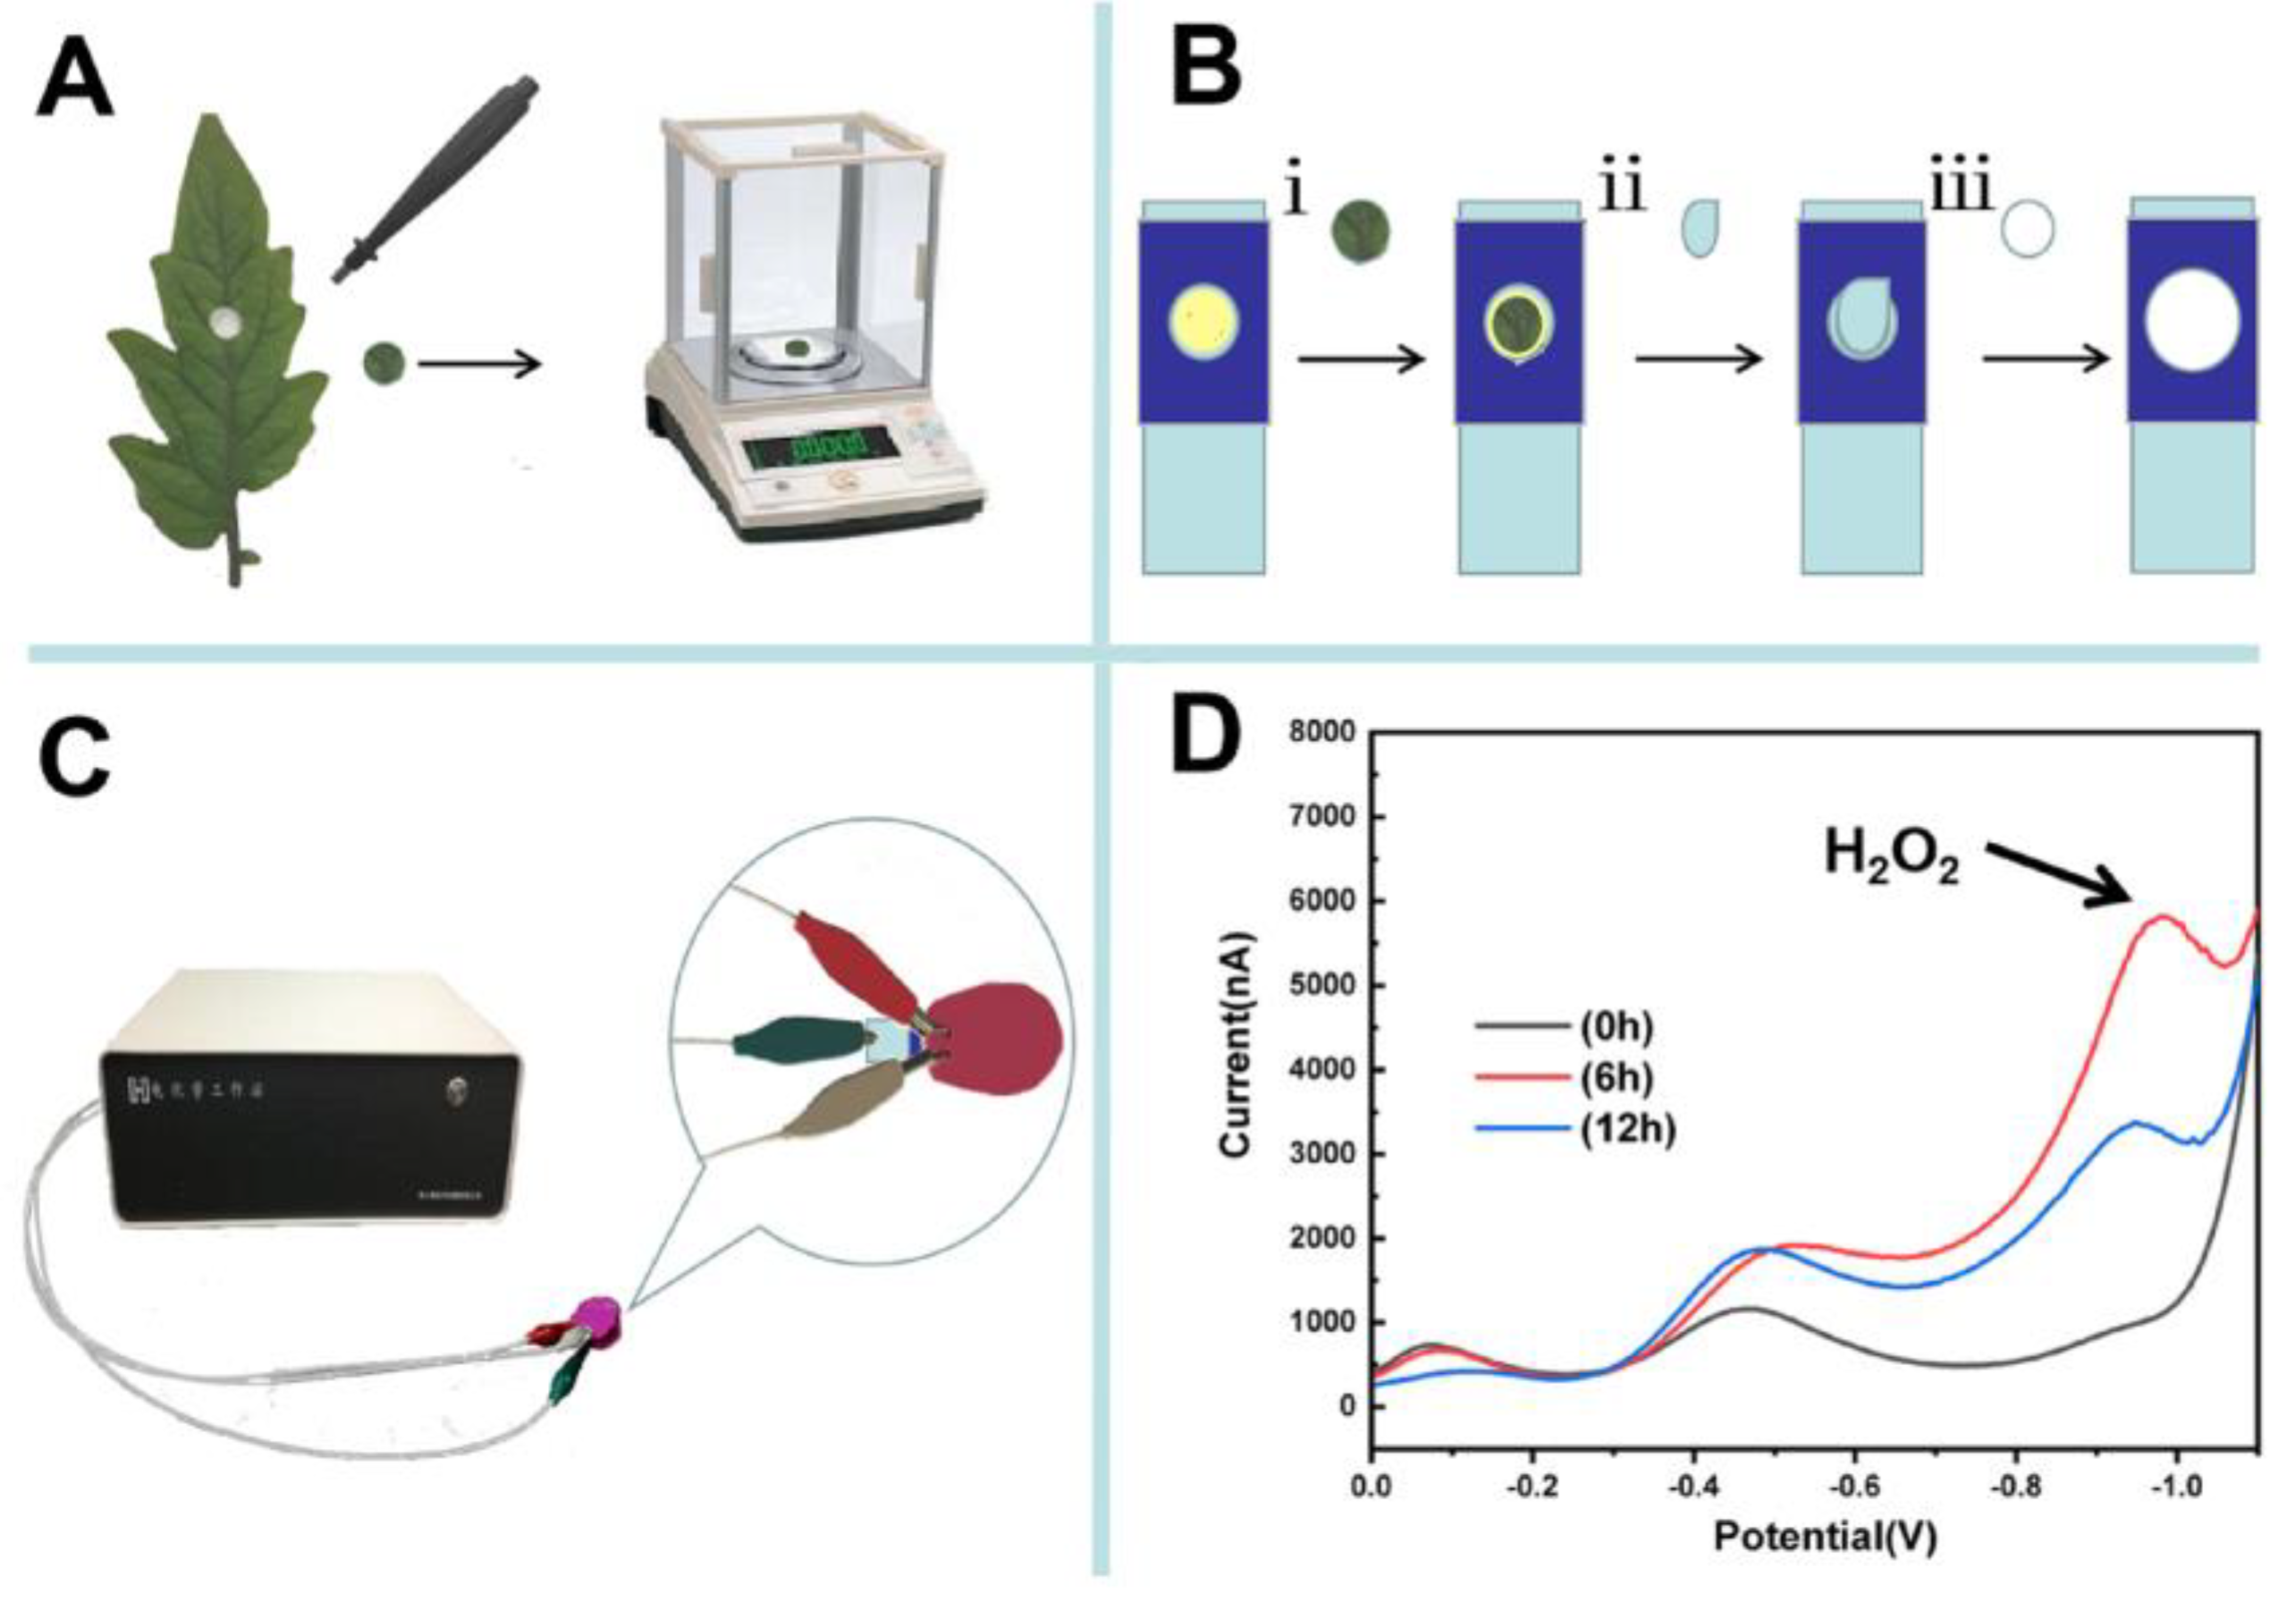
2.2. Material Preparation

HAuCl4•3H2O (10 g/L, 34 μL) was added to 1 mmol/L of KCl (200 μL), then 3766 μL of double-distilled water was added to prepare 4 mL of 0.25 mmol/L HAuCl4•3H2O, and stored in a refrigerator at 4 °C for later use in electroplating. The H2O2 (30% wt. in water) was diluted using 0.1 M of phosphate buffered solution (pH 7.0) for detection. Tomato plants were grown in a mixture of perlite: vermiculite: plant ash (1:6:2) in a growth room at 22 °C under a 16 h light and 8 h dark regime. For analysis of the concentration of H2O2 produced in response to pathogen infection, four-week-old tomato leaves were sprayed with spore suspensions or a buffer as mock inoculation (control). Briefly, spores were collected in 1% maltose buffer from 10-day-old Botrytis cinerea cultures grown on 2 × V8 agar (36% V8 juice, 0.2% CaCO3, 2% agar) by passing through two layers of cheesecloth with a spore density of 1 × 10⁵ spores mL-1. The inoculated plants were covered with a transparent plastic film and maintained in a growth chamber with conditions similar to plant growth conditions. Leaves from at least four individual plants were used in each experiment.

2.3. Paper-Based Electroanalytical Devices and Electrochemical Detection

For the nano-gold-modified ITO electrode preparation, the ITO glass was cut into 20 × 8 mm pieces and washed using acetone and ethanol ultrasonically for 10 min. The washed ITO glasses were cleaned repeatedly with double-distilled water to remove acetone and ethanol. The cleaned ITO glasses were dried in an oven at 50 °C. As showed in the Scheme 1, 10 μL of HAuCl4•3H2O solution was dropped on the conductive surfaces of the ITO glasses adhered with a layer of perforated (4 mm) transparent tape. An Ag/AgCl electrode and a platinum wire electrode were used as a reference electrode and counter electrode, respectively. Then, the HAuCl4•3H2O solution was electroplated on the conductive surfaces of the ITO glasses (4-mm holes) by cyclic voltammetry with the parameters −1–0.2 V potential range, 0.1 V/s scanning speed, 10 scanning segments, 0.001-V sampling intervals, and 2 s standing time. The modified electrode was named a nano-gold-modified ITO electrode.
For electrochemical detection, tomato leaves inoculated with spore suspensions of Botrytis cinerea or buffer solution (Mock) were obtained using a Miltex Biopsy Punch with a diameter of 4 mm (Scheme 2A). The circular forms of the retrieved leaf samples were weighed and placed on the surface of a nano-gold-modified ITO electrode, then 10 μL of phosphate buffer solution with a pH of 7.0 was dropped on the electrode, and the electrode surface was covered with a piece of filter paper (Scheme 2B). H2O2 was detected in tomato leaf using a CHI 1240C electrochemical workstation (CH Instruments Inc., Austin, TX, USA). A three-electrode system consisting of a modified nano-gold electrode (working electrode), an Ag/AgCl electrode (reference electrode), and a platinum wire electrode (counter electrode) was used (Scheme 2C). The H2O2 was detected using differential pulse voltammetry with a −1.2–0 V potential range, a potential increment of 0.005 V, an amplitude of 0.05 V, a pulse width of 0.2 s, a sampling width of 0.067 s, a pulse period of 0.5 s, and a standing time of 2 s. Before each test, the counter electrode and the reference electrode were washed with double-distilled water thoroughly. The H2O2 concentrations in tomato leaves infected with Botrytis cinerea were determined directly and rapidly (Scheme 2D).

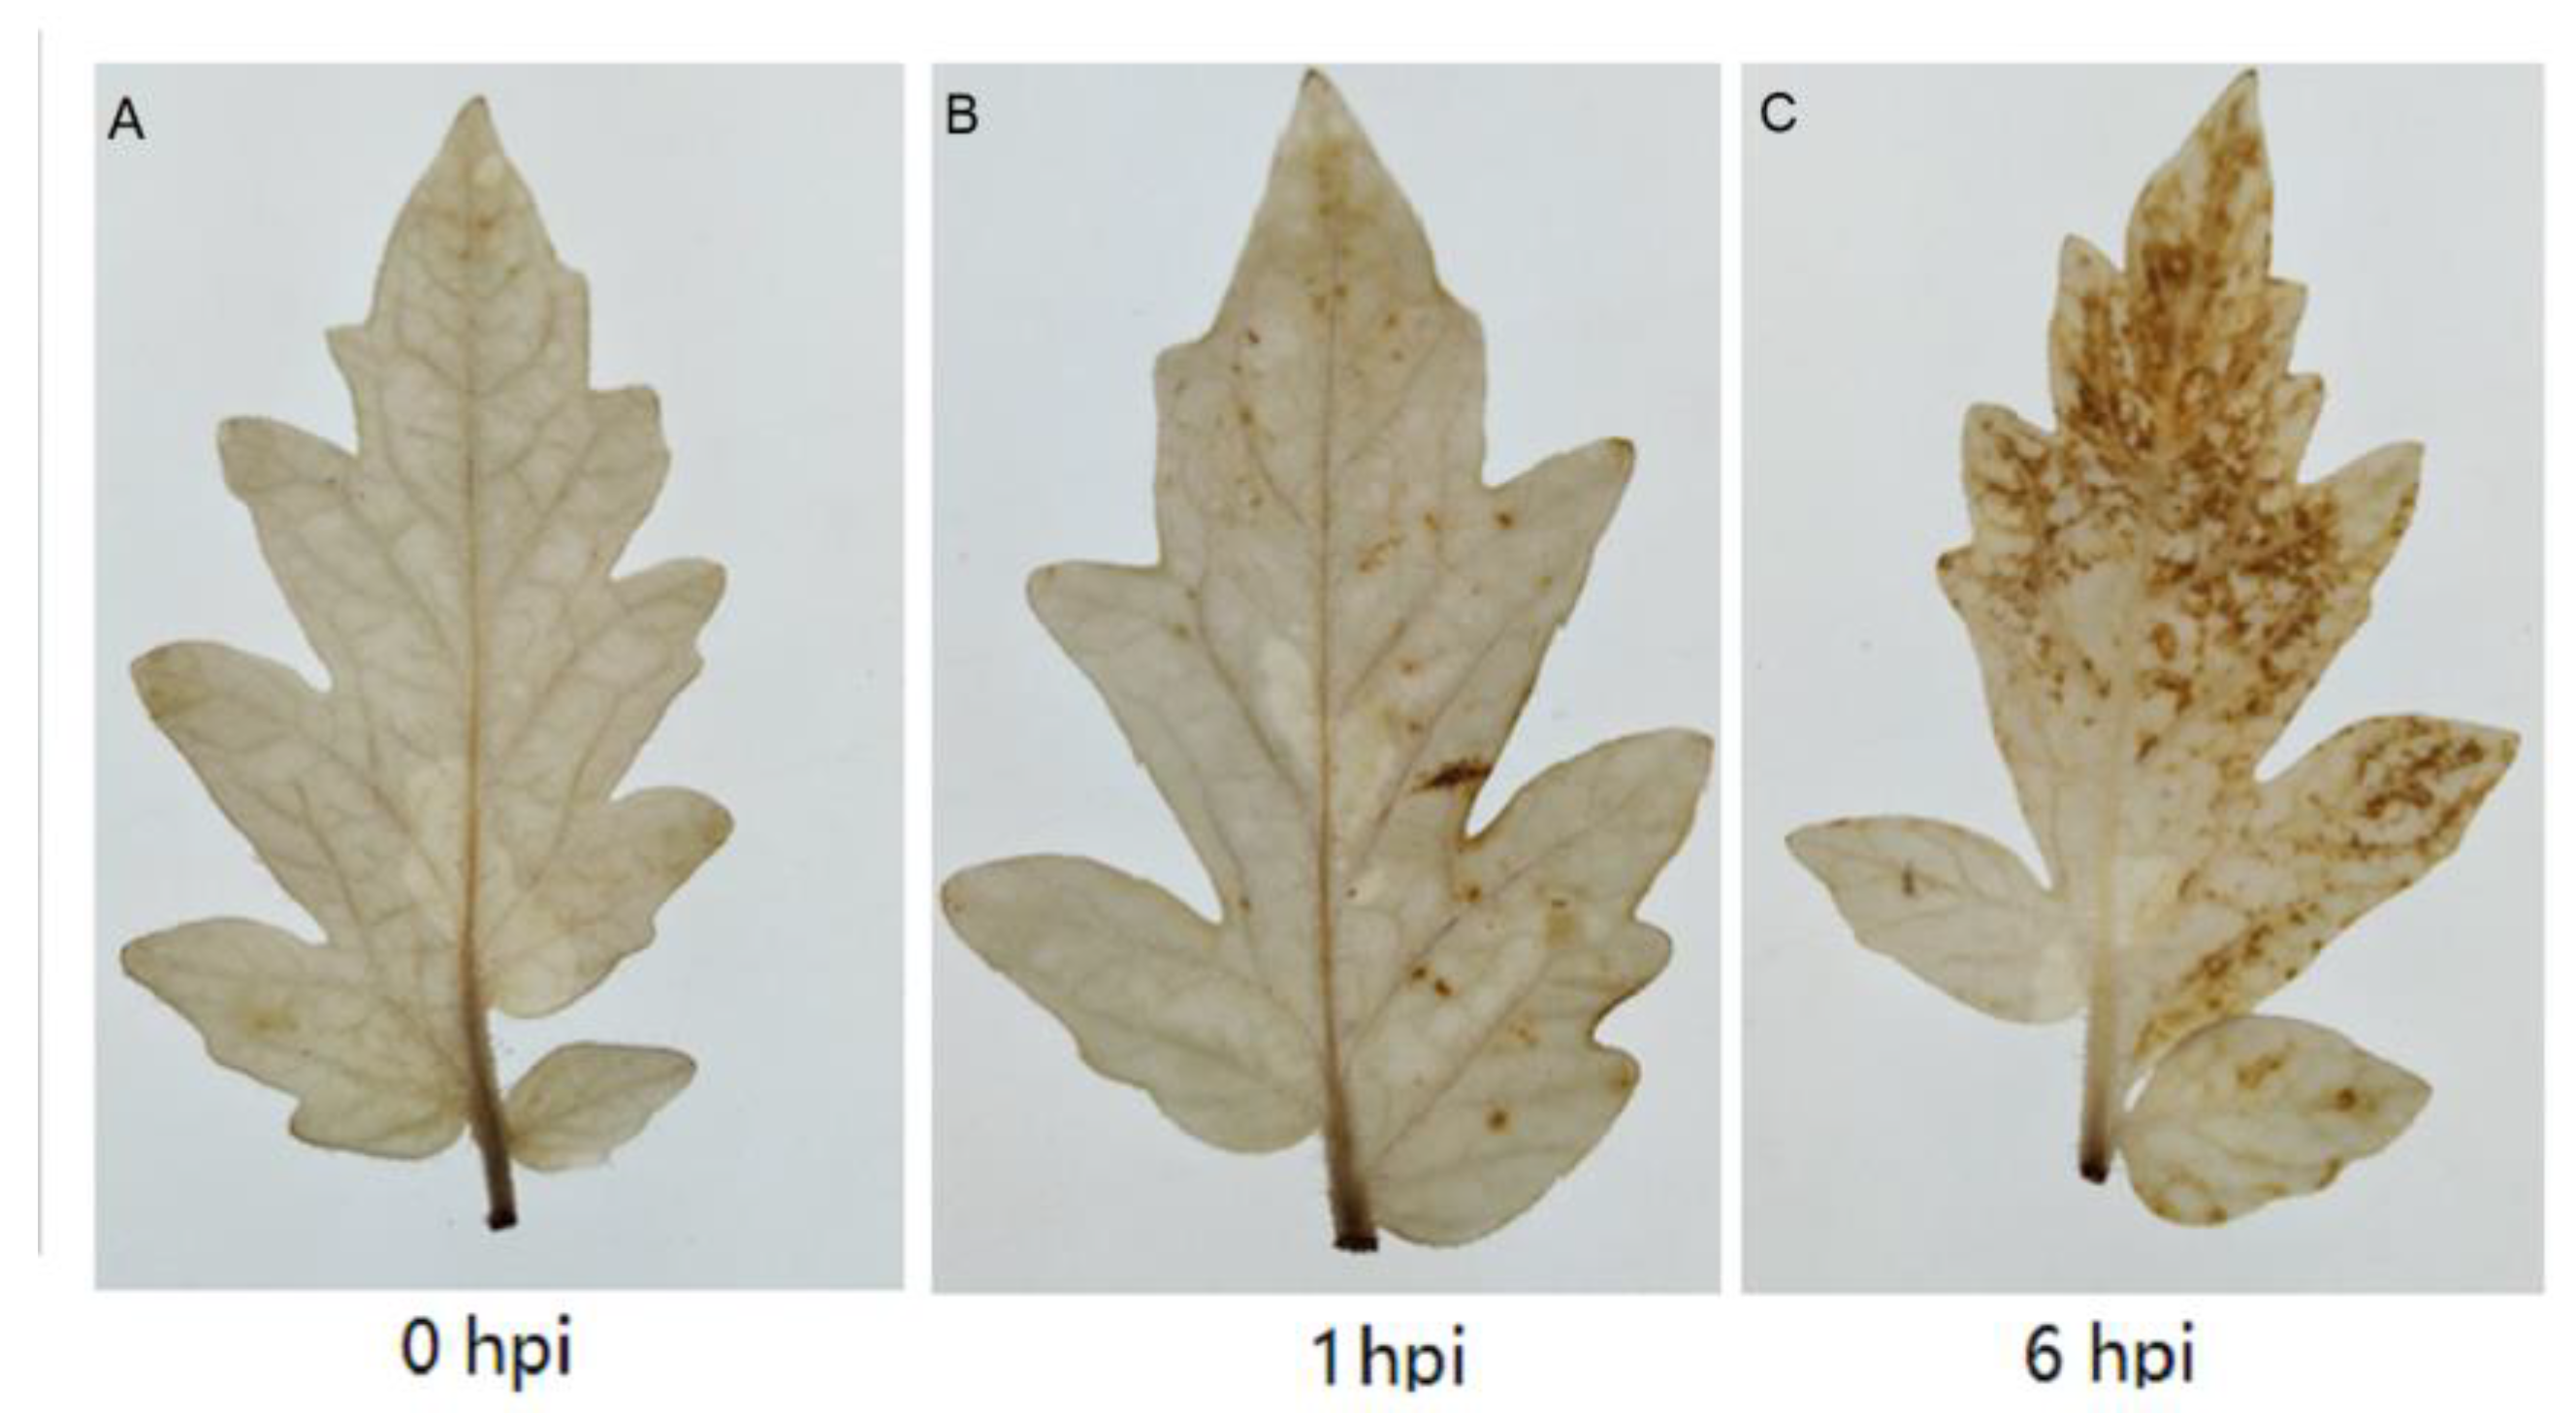
2.4. Diaminobenzidine Staining

To validate our approach for the detection of H2O2 in tomato leaves, 3-3′ diaminobenzidine (DAB) staining was performed according to the methods described previously [30]. Briefly, tomato leaves were collected from inoculated plants 0, 1, and 6 h after inoculation with Botrytis cinerea spores and dipped into DAB solution (0.5 mg/mL, pH 3.8) for 8 h in the dark at room temperature. The DAB-treated leaves were placed into 95% ethanol at 80 °C for 30 min to remove chlorophyll. Subsequently, the leaves were maintained in 60% glycerol and the accumulation of H2O2 was visualized using a digital camera.

3. Results and Discussion

Since the nano-gold-modified ITO electrodes was fabricated by electroplating HAuCl4•3H2O on the surface of the ITO electrodes, we investigated the influence of different concentrations of HAuCl4•3H2O at the ITO electrodes on the electrochemical responses of 200 μM of H2O2. We observed that the 0.25 mM of HAuCl4•3H2O-electroplated ITO electrodes exhibited higher electrochemical responses to the H2O2 (Figure 1A). Notably, there were no electrochemical responses to H2O2 on the bare ITO electrodes. The potential of H2O2 further increased from −0.925 V to −0.775 V when the concentration of HAuCl4•3H2O was increased (Figure 1B). In addition, the potential of H2O2 on the 0.25 mM of HAuCl4•3H2O-modified ITO electrodes was more stable. The surface characterizations of the bare ITO electrode and the 0.25mM of HAuCl4•3H2O-electroplated ITO electrodes were observed using a Hitachi S-3400 II scanning electron microscope. Compared to the bare ITO electrode, the 5~10 nm gold nanoparticles homogeneously distributed throughout the surface of the ITO electrode (Figure 2).
In the present study, H2O2 was quantified and verified based on the differential pulse voltammetry peak heights and potentials. In order to study the influence of the air on the H2O2 detection, prior to each experiment a stream of highly pure nitrogen was gently blown inside a plastic bag with the detection device to maintain the nitrogen atmosphere for at least 20 min. Figure 3 illustrates differential pulse voltammetry curves of H2O2 with various concentrations at the nano-gold-modified ITO electrodes in the air or nitrogen atmosphere. There were two peaks at approximately −0.4 and −0.9 V potentials. The peaks at −0.9 V further increased when the H2O2 concentration was increased, while the peaks at −0.4 V were irregular (Figure 3A,C). The oxidation peak currents of H2O2 displayed a linear response to the concentrations of H2O2 from 10 to 1000 μM in the air or nitrogen atmosphere (Figure 3B,D). The linear relationship between the peak current and the concentration was Y = 2.692X + 259.943 (R2 = 0.9687) in the air atmosphere and Y = 2.296X + 26.66 (R2 = 0.9897) in the nitrogen atmosphere (X: concentration of H2O2; Y: peak current magnitude). There were no obvious differences except for the base currents between the detection of H2O2 in the air and the nitrogen atmosphere. Considering the importance of the rapid detection of H2O2 from the plant sample, a strategy for the direct detection of H2O2 in the air was selected.
The detection limit and reproducibility are important parameters for the evaluation of sensor performance. The detection limit of our system was estimated to be 1 μM based on a signal-to-noise ratio of six. The reproducibility of the nano-gold-modified ITO electrode was estimated from the response to 100 μM of H2O2 using six different electrodes. The relative standard deviation was found to be 5.8%, indicating a good reproducibility for the sensor preparation. We investigated the potential interferences with the determination of H2O2 in the plants from plant signaling molecules, and found that there were no significant interferences in the presence of abscisic acid, indole-3-acetic acid, salicylic acid, jasmonic acid, methyl jasmonate, and ascorbic acid under 100 or 500 μM of H2O2 (Figure 4). The results indicated that nano-gold-modified ITO electrodes could facilitate the determination of H2O2 in plant samples. More importantly, the nano-gold-modified ITO electrodes could be fabricated as one-time-use disposable electrodes, which could avoid the contamination of electrodes. In addition, the fabrication of the nano-gold-modified ITO electrodes was feasible (less than five minutes to prepare one electrode) and suitable for mass production. Compared with previous reports, our strategy was superior regarding the simple work electrode preparation, good analytical performance, volume of buffer solution, and simple sample preparation for the H2O2 detection in plants (Table 1).
As a necrotrophic pathogen, Botrytis cinerea can colonize senescent or dead plant tissues and cause gray mold disease [34,35]. Botrytis cinerea infects over 200 dicot crop hosts such as tomato, grapes, and strawberry. Therefore, it could cause substantial economic losses [34,35]. In our experiments, typical disease symptoms—e.g., necrotic lesions—could be observed in tomato leaves inoculated with Botrytis cinerea spore suspensions at 3 dpi. Figure 5A illustrates the typical differential pulse voltammetry detection curves of H2O2 in the tomato leaf samples inoculated with Botrytis cinerea spores at different time points. H2O2 in the tomato leaf samples could be identified at a DPV peak potential of −0.90 V. It is necessary to emphasize that the total analytical time was dramatically shortened to approximately 3 min because our method avoided the time-consuming and complex treatment of tomato leaf samples. In addition, the amount of tomato leaf samples was less than 3 mg in our approach. The concentrations of H2O2 in the tomato leaf samples inoculated with B. cinerea increased at the initial phase and peaked at 1.5 μmol (gFW)−1 6 h after inoculation, then decreased gradually until the presence of H2O2 could not be detected 24 h after inoculation (Figure 5B). In the normal tomato leaves, for comparison, almost no H2O2 could be observed at different time points (Figure 5B).
In order to compare and evaluate the ability of our approach in detecting H2O2 production after tomato leaves were inoculated with Botrytis cinerea, DAB staining was also employed. As showed in Figure 6A, no significant accumulation of H2O2 was observed in tomato leaves 0 h after inoculation. One hour post-inoculation, a few spots due to the presence of H2O2 could be noticed (Figure 6B). Six hours after inoculation, much H2O2 could be visualized throughout the leaves. The production trend of H2O2 in tomato leaves inoculated with Botrytis cinerea based on DAB staining was similar in our method. Patykowski and Urbanek also reported that the H2O2 concentrations of tomato leaves inoculated with Botrytis cinerea increased as early as 5 h after inoculation, increasing to 0.2 μmol (gFW)−1 [36]. These results implied that our approach could offer a rapid and effective means of studying H2O2 dynamics in plants.

4. Conclusions

In the present study, we developed a platform using paper-based analytical devices coupled with nano-gold-modified ITO working electrodes for detecting H2O2. Our approach could detect H2O2 in plant samples at the milligram scale. In addition, the complex and time-consuming pre-treatment procedures required in conventional methods for the quantification of H2O2 in plant samples were avoided, and thus our method could determine the concentrations of H2O2 in plants more rapidly and directly. Using our approach, differentiable H2O2 concentrations were obtained in tomato leaves after infection with Botrytis cinerea. Our study presents a valid method that not only facilitates the investigation of the regulating mechanisms of H2O2 in plants but also promotes the development of precision agriculture technology.

Author Contributions

L.S. for the study design, literature search, data analysis, data interpretation, and writing. Y.P. and J.W. for the data collection, data analysis, and figures. D.Z. and M.H. for data collection and data analysis. S.Z., X.Z. and D.L. for data analysis and data interpretation. F.S. and C.Z. for writing. All authors have read and agreed to the published version of the manuscript.

Funding

This research was funded by the National Natural Science Foundation of China (numbers 31770399 and 31400315); the Natural Science Foundation of Jiangsu Province (No.: BK20130389), the Qing Lan Project of Jiangsu Province, six talent peaks project in Jiangsu Province (No.: SWYY-061); the Jiangsu Government Scholarship for overseas studies (No.: JS-2018-205); and the science and technology innovation project of Jiangsu Province (201810304094X).

Conflicts of Interest

The authors declare no conflict of interest.

References

  1. Cerny, M.; Habanova, H.; Berka, M.; Luklova, M.; Brzobohaty, B. Hydrogen peroxide: Its role in plant biology and crosstalk with signalling networks. Int. J. Mol. Sci. 2018, 19, 2812. [Google Scholar] [CrossRef] [PubMed] [Green Version]
  2. Das, K.; Roychoudhury, A. Reactive oxygen species (ROS) and response of antioxidants as ROS-scavengers during environmental stress in plants. Front. Environ. Sci. 2014, 2, 1–13. [Google Scholar] [CrossRef] [Green Version]
  3. Smirnoff, N.; Arnaud, D. Hydrogen peroxide metabolism and functions in plants. New Phytol. 2019, 221, 1197–1214. [Google Scholar] [CrossRef] [PubMed]
  4. Dietz, K.J.; Turkan, I.; Krieger-Liszkay, A. Redox and reactive oxygen species-dependent signaling into and out of the photosynthesizing chloroplast. Plant Physiol. 2016, 171, 1541–1550. [Google Scholar] [CrossRef]
  5. Huang, S.; Van Aken, O.; Schwarzlander, M.; Belt, K.; Millar, A.H. The roles of mitochondrial reactive oxygen species in cellular signaling and stress response in plants. Plant Physiol. 2016, 171, 1551–1559. [Google Scholar] [CrossRef] [Green Version]
  6. Wrzaczek, M.; Brosche, M.; Kangasjarvi, J. ROS signaling loops—Production, perception, regulation. Curr. Opin. Plant Biol. 2013, 16, 575–582. [Google Scholar] [CrossRef]
  7. Wojtaszek, P. Oxidative burst: An early plant response to pathogen infection. Biochem. J. 1997, 322, 681–692. [Google Scholar] [CrossRef] [Green Version]
  8. Gill, S.S.; Tuteja, N. Reactive oxygen species and antioxidant machinery in abiotic stress tolerance in crop plants. Plant Physiol Biochem. 2010, 48, 909–930. [Google Scholar] [CrossRef]
  9. Levine, A.; Tenhaken, R.; Dixon, R.; Lamb, C. H2O2 from the oxidative burst orchestrates the plant hypersensitive disease resistance response. Cell 1994, 79, 583–593. [Google Scholar] [CrossRef]
  10. Saxena, I.; Srikanth, S.; Chen, Z. Cross talk between H2O2 and interacting signal molecules under plant stress response. Front. Plant Sci. 2016, 7, 570. [Google Scholar] [CrossRef] [Green Version]
  11. Verma, V.; Ravindran, P.; Kumar, P.P. Plant hormone-mediated regulation of stress responses. BMC Plant Biol. 2016, 16, 86. [Google Scholar] [CrossRef] [Green Version]
  12. Ma, K.W.; Ma, W. Phytohormone pathways as targets of pathogens to facilitate infection. Plant Mol. Biol. 2016, 91, 713–725. [Google Scholar] [CrossRef] [PubMed] [Green Version]
  13. Liu, X.; Rockett, K.S.; Korner, C.J.; Pajerowska-Mukhtar, K.M. Salicylic acid signalling: New insights and prospects at a quarter-century milestone. Essays Biochem. 2015, 58, 101–113. [Google Scholar]
  14. Fu, J.; Wang, S. Insights into auxin signaling in plant-pathogen interactions. Front. Plant Sci. 2011, 2, 74. [Google Scholar] [CrossRef] [PubMed] [Green Version]
  15. Chen, Z.; Silva, H.; Klessig, D.F. Active oxygen species in the induction of plant systemic acquired resistance by salicylic acid. Science 1993, 262, 1883–1886. [Google Scholar] [CrossRef] [PubMed]
  16. Chen, Z.; Klessig, D.F. Identification of a soluble salicylic acid-binding protein that may function in signal transduction in the plant disease-resistance response. Proc. Natl. Acad. Sci. USA 1991, 88, 8179–8183. [Google Scholar] [CrossRef] [PubMed] [Green Version]
  17. Klassen, N.V.; Marchington, D.; McGowan, H.C.E. H2O2 determination by the I3-method and by KMnO4 titration. Anal. Chem. 1994, 66, 2921–2925. [Google Scholar] [CrossRef]
  18. Elnemma, E. Spectrophotometric determination of hydrogen peroxide by a hydroquinone-aniline system catalyzed by molybdate. Bull. Korean Chem. Soc. 2004, 25, 127–129. [Google Scholar]
  19. Pick, E.; Keisari, Y. A simple colorimetric method for the measurement of hydrogen peroxide produced by cells in culture. J. Immunol. Methods 1980, 38, 161–170. [Google Scholar] [CrossRef]
  20. Takahashi, A.; Hashimoto, K.; Kumazawa, S.; Nakayama, T. Determination of hydrogen peroxide by high-performance liquid chromatography with a cation-exchange resin gel column and electrochemical detector. Anal. Sci. 1999, 15, 481–483. [Google Scholar] [CrossRef] [Green Version]
  21. Segawa, T.; Kamidate, T.; Watanabe, H. Determination of hydrogen peroxide with fluorescein chemiluminescence catalyzed by horseradish peroxidase. Anal. Sci. 1990, 6, 763–764. [Google Scholar] [CrossRef] [Green Version]
  22. Onoda, M.; Uchiyama, T.; Mawatari, K.; Kaneko, K.; Nakagomi, K. Simple and rapid determination of hydrogen peroxide using phosphine-based fluorescent reagents with sodium tungstate dihydrate. Anal. Sci. 2006, 22, 815–817. [Google Scholar] [CrossRef] [PubMed] [Green Version]
  23. Pundir, C.S.; Deswal, R.; Narwal, V. Quantitative analysis of hydrogen peroxide with special emphasis on biosensors. Bioprocess. Biosyst. Eng. 2018, 41, 313–329. [Google Scholar] [CrossRef] [PubMed]
  24. Ai, F.; Chen, H.; Zhang, S.H.; Liu, S.Y.; Wei, F.; Dong, X.Y.; Cheng, J.K.; Huang, W.H. Real-time monitoring of oxidative burst from single plant protoplasts using microelectrochemical sensors modified by platinum nanoparticles. Anal. Chem. 2009, 81, 8453–8458. [Google Scholar] [CrossRef] [PubMed]
  25. Gonzalez-Sanchez, M.I.; Gonzalez-Macia, L.; Perez-Prior, M.T.; Valero, E.; Hancock, J.; Killard, A.J. Electrochemical detection of extracellular hydrogen peroxide in Arabidopsis thaliana: A real-time marker of oxidative stress. Plant Cell Environ. 2013, 36, 869–878. [Google Scholar] [CrossRef] [PubMed]
  26. Ren, Q.Q.; Yuan, X.J.; Huang, X.R.; Wen, W.; Zhao, Y.D.; Chen, W. In vivo monitoring of oxidative burst on aloe under salinity stress using hemoglobin and single-walled carbon nanotubes modified carbon fiber ultramicroelectrode. Biosens. Bioelectron. 2013, 50, 318–324. [Google Scholar] [CrossRef] [PubMed]
  27. Lima, A.S.; Prieto, K.R.; Santos, C.S.; Paula, V.H.; Garcia-Ochoa, E.Y.; Huerta-Robles, A.; Beltran-Garcia, M.J.; Di Mascio, P.; Bertotti, M. In-vivo electrochemical monitoring of H2O2 production induced by root-inoculated endophytic bacteria in Agave tequilana leaves. Biosens. Bioelectron. 2018, 99, 108–114. [Google Scholar] [CrossRef]
  28. Sun, L.J.; Feng, Q.M.; Yan, Y.F.; Pan, Z.Q.; Li, X.H.; Song, F.M.; Yang, H.; Xu, J.J.; Bao, N.; Gu, H.Y. Paper-based electroanalytical devices for in situ determination of salicylic acid in living tomato leaves. Biosens. Bioelectron. 2014, 60, 154–160. [Google Scholar] [CrossRef]
  29. Sun, L.J.; Xie, Y.; Yan, Y.F.; Yang, H.; Gu, H.Y.; Bao, N. Paper-based analytical devices for direct electrochemical detection of free IAA and SA in plant samples with the weight of several milligrams. Sens. Actuators B Chem. 2017, 247, 336–342. [Google Scholar] [CrossRef]
  30. Thordal-Christensen, H.; Zhang, Z.; Wei, Y.; Collinge, D. Subcellular localization of H2O2 in plants. H2O2 accumulation in papillae and hypersensitive response during the barley-powdery mildew interaction. Plant J. 1997, 11, 1187–1194. [Google Scholar] [CrossRef]
  31. Cao, S.; Yuan, R.; Chai, Y.; Zhang, L.; Li, X.; Gao, F. A mediator-free amperometric hydrogen peroxide biosensor based on HRP immobilized on a nano-Au/poly 2,6-pyridinediamine-coated electrode. Bioprocess. Biosyst. Eng. 2007, 30, 71–78. [Google Scholar] [CrossRef] [PubMed]
  32. Wang, J.; Wang, L.; Di, J.; Tu, Y. Electrodeposition of gold nanoparticles on indium/tin oxide electrode for fabrication of a disposable hydrogen peroxide biosensor. Talanta 2009, 77, 1454–1459. [Google Scholar] [CrossRef] [PubMed]
  33. Jiménez-Pérez, R.; González-Rodríguez, J.; González-Sánchez, M.-I.; Gómez-Monedero, B.; Valero, E. Highly sensitive H2O2 sensor based on poly (azure A)-platinum nanoparticles deposited on activated screen printed carbon electrodes. Sens. Actuators B Chem. 2019, 298, 126878. [Google Scholar] [CrossRef] [Green Version]
  34. Gonzalez-Fernandez, R.; Valero-Galvan, J.; Gomez-Galvez, F.J.; Jorrin-Novo, J.V. Unraveling the in vitro secretome of the phytopathogen Botrytis cinerea to understand the interaction with its hosts. Front. Plant Sci. 2015, 6, 839. [Google Scholar] [CrossRef] [Green Version]
  35. AbuQamar, S.; Moustafa, K.; Tran, L.S. Mechanisms and strategies of plant defense against Botrytis cinerea. Crit. Rev. Biotechnol. 2017, 37, 262–274. [Google Scholar] [CrossRef]
  36. Patykowski, J. Activity of enzymes related to H2O2 generation and metabolism in leaf apoplastic fraction of tomato leaves infected with botrytis cinerea. J. Phytopathol. 2003, 151, 153–161. [Google Scholar] [CrossRef]
Scheme 1. Schematic diagram of the nano-gold modified indium tin oxide (ITO) electrode. (i) A total of 10 μL of HAuCl4•3H2O solution was dropped on the conductive surfaces of the ITO glasses (4 mm holes), (ii) the HAuCl4•3H2O solution was electroplated on the conductive surfaces of the ITO glasses by cyclic voltammetry.
Sensors 20 05512 sch001
Scheme 2. Schematic diagram of the rapid and direct detection of H2O2 in tomato leaves. (A) Leaves of tomato inoculated with spores of Botrytis cinerea or buffer solution were retrieved by the Miltex® Biopsy Punch. The collected tomato leaf samples with diameters of 4 mm were weighted. (B) The collected tomato leaf samples were kept on the surface of a nano-gold-modified ITO electrode, then 10 μL of buffer was dropped on the tissue surface and a piece of filter paper was used to cover the electrode surface. (C) Detection of H2O2 in the tomato leaf samples with a CHI 1240C electrochemical station. (D) The typical differential pulse voltammetry detection curves of H2O2 in the tomato leaf samples inoculated with spores of Botrytis cinerea.
Sensors 20 05512 sch002
Figure 1. Dependence of the differential pulse voltammetry peak heights (A) and potential (B) of H2O2 (200 μM) on the ITO electrodes modified with different concentrations of HAuCl4•3H2O by electroplating. The average values and standard deviations were obtained based on 6 results.
Sensors 20 05512 g001
Figure 2. The scanning electron microscope images of the bare ITO electrode (A) and the ITO electrode modified with 0.25 mM (B) by electroplating.
Sensors 20 05512 g002
Figure 3. The differential pulse voltammetry curves of H2O2 with different concentrations (0~1000 μM) on the nano-gold-modified ITO electrodes (A) and the calibration curve between the differential pulse voltammetry peak currents and the H2O2 concentrations in the air (B), the differential pulse voltammetry curves of H2O2 with different concentrations (0~1000 μM) on the nano-gold-modified ITO electrodes (C), and the calibration curve between the differential pulse voltammetry peak currents and the H2O2 concentrations in the N2 atmosphere (D). The average values and standard deviations were obtained based on 6 replicates.
Sensors 20 05512 g003
Figure 4. Electrochemical responses of signal molecules (abscisic acid (ABA), indole-3-acetic acid (IAA), salicylic acid (SA), jasmonic acid (JA), methyl jasmonate (MeJA), ascorbic acid (AA)) in plants with 100 μM (A) or 500 μM (B). The average values and standard deviations were obtained based on 6 replicates.
Sensors 20 05512 g004
Figure 5. The typical differential pulse voltammetry detection curves (A) and contents of H2O2 (B) in tomato leaves at different times after being inoculated with Botrytis cinerea. The average values and standard deviations were obtained based on 12 replicates.
Sensors 20 05512 g005
Figure 6. The detection of H2O2 production in tomato leaves after inoculation with Botrytis cinerea by DAB: 0 h (A), 1 h (B), 6 h (C).
Sensors 20 05512 g006
Table 1. List of the analytical performances of the electrochemical methods for the detection of H2O2 in plants.
Electrode SystemMethodApplied
Potential
Liner RangeLimit of DetectionSample
Application
Volume of Buffer SolutionRef.
WE:
Hb/SWCNTs/CFUMEs
CE: Pt wire
RE: Ag/AgCl (sat. kCl)
Amperometric−0.1 V4.9~0.405 mM4 µMDetection of aloe leaves in vivoNo description[25]
WE: Platinum disc microelectrode
RE: Silver expoxy coat,
Ag/AgCl (sat. kCl)
Cyclic voltammogram−1.0~0 V
(−0.7 V)
100~100 mM100 µMDetection of agave tequilana leaves in vivoNo description[26]
WE: HRP/colloidal Au/ pPA/Pt electrode
CE: Pt wire
RE: Saturated calomel electrode
Amperometric0 V0.42~1.5 mM0.14 µMDetection of the extraction solution of the plant leaves5 mL
BR
[31]
WE: HRP/Cys/AuNPs/ITO
CE: platinum foil
RE: Saturated calomel electrode
Amperometric−0.15 V8~3 mM2 µMDetection of the extraction solution of the plant leaves10 mL PBS[32]
WE:
PtNPs/PAA/aSPCEs
CE: Platinum wire
RE:
Ag/AgCl wire
Amperometric0.1 V0~300 µM51.6 nMLiquid oxygen solution for plants10 mL PBS[33]
WE: Au nanodots-ITO
CE: Platinum wire
RE:
Ag/AgCl wire
Differential pulse voltammetry−0.90 V0~1 mM1 µMDetection of the direct tomato leaves (3 mg)10 µl PBSThis study
Note: WE, work electrode; CE, counter electrode; RE, reference electrode; Hb/SWCNTs/CFUMEs, hemoglobin/single-walled carbon nanotubes/carbon fiber ultramicroelectrode; HRP/colloidal Au/ pPA/Pt electrode, horseradish peroxidase/colloidal Au/poly2,6-pyridinediamine/platinum wire electrode; HRP/Cys/AuNPs/ITO, horseradish peroxidase/L-Cysteine/gold nanoparticles/indium tin oxide; PtNPs/PAA/aSPCEs, poly (azure A)-platinum nanoparticles deposited on activated screen-printed carbon electrodes.

