Methodology for Energy Optimization in Wastewater Treatment Plants. Phase III: Implementation of an Integral Control System for the Aeration Stage in the Biological Process of Activated Sludge and the Membrane Biological Reactor

 ,
,  and
and 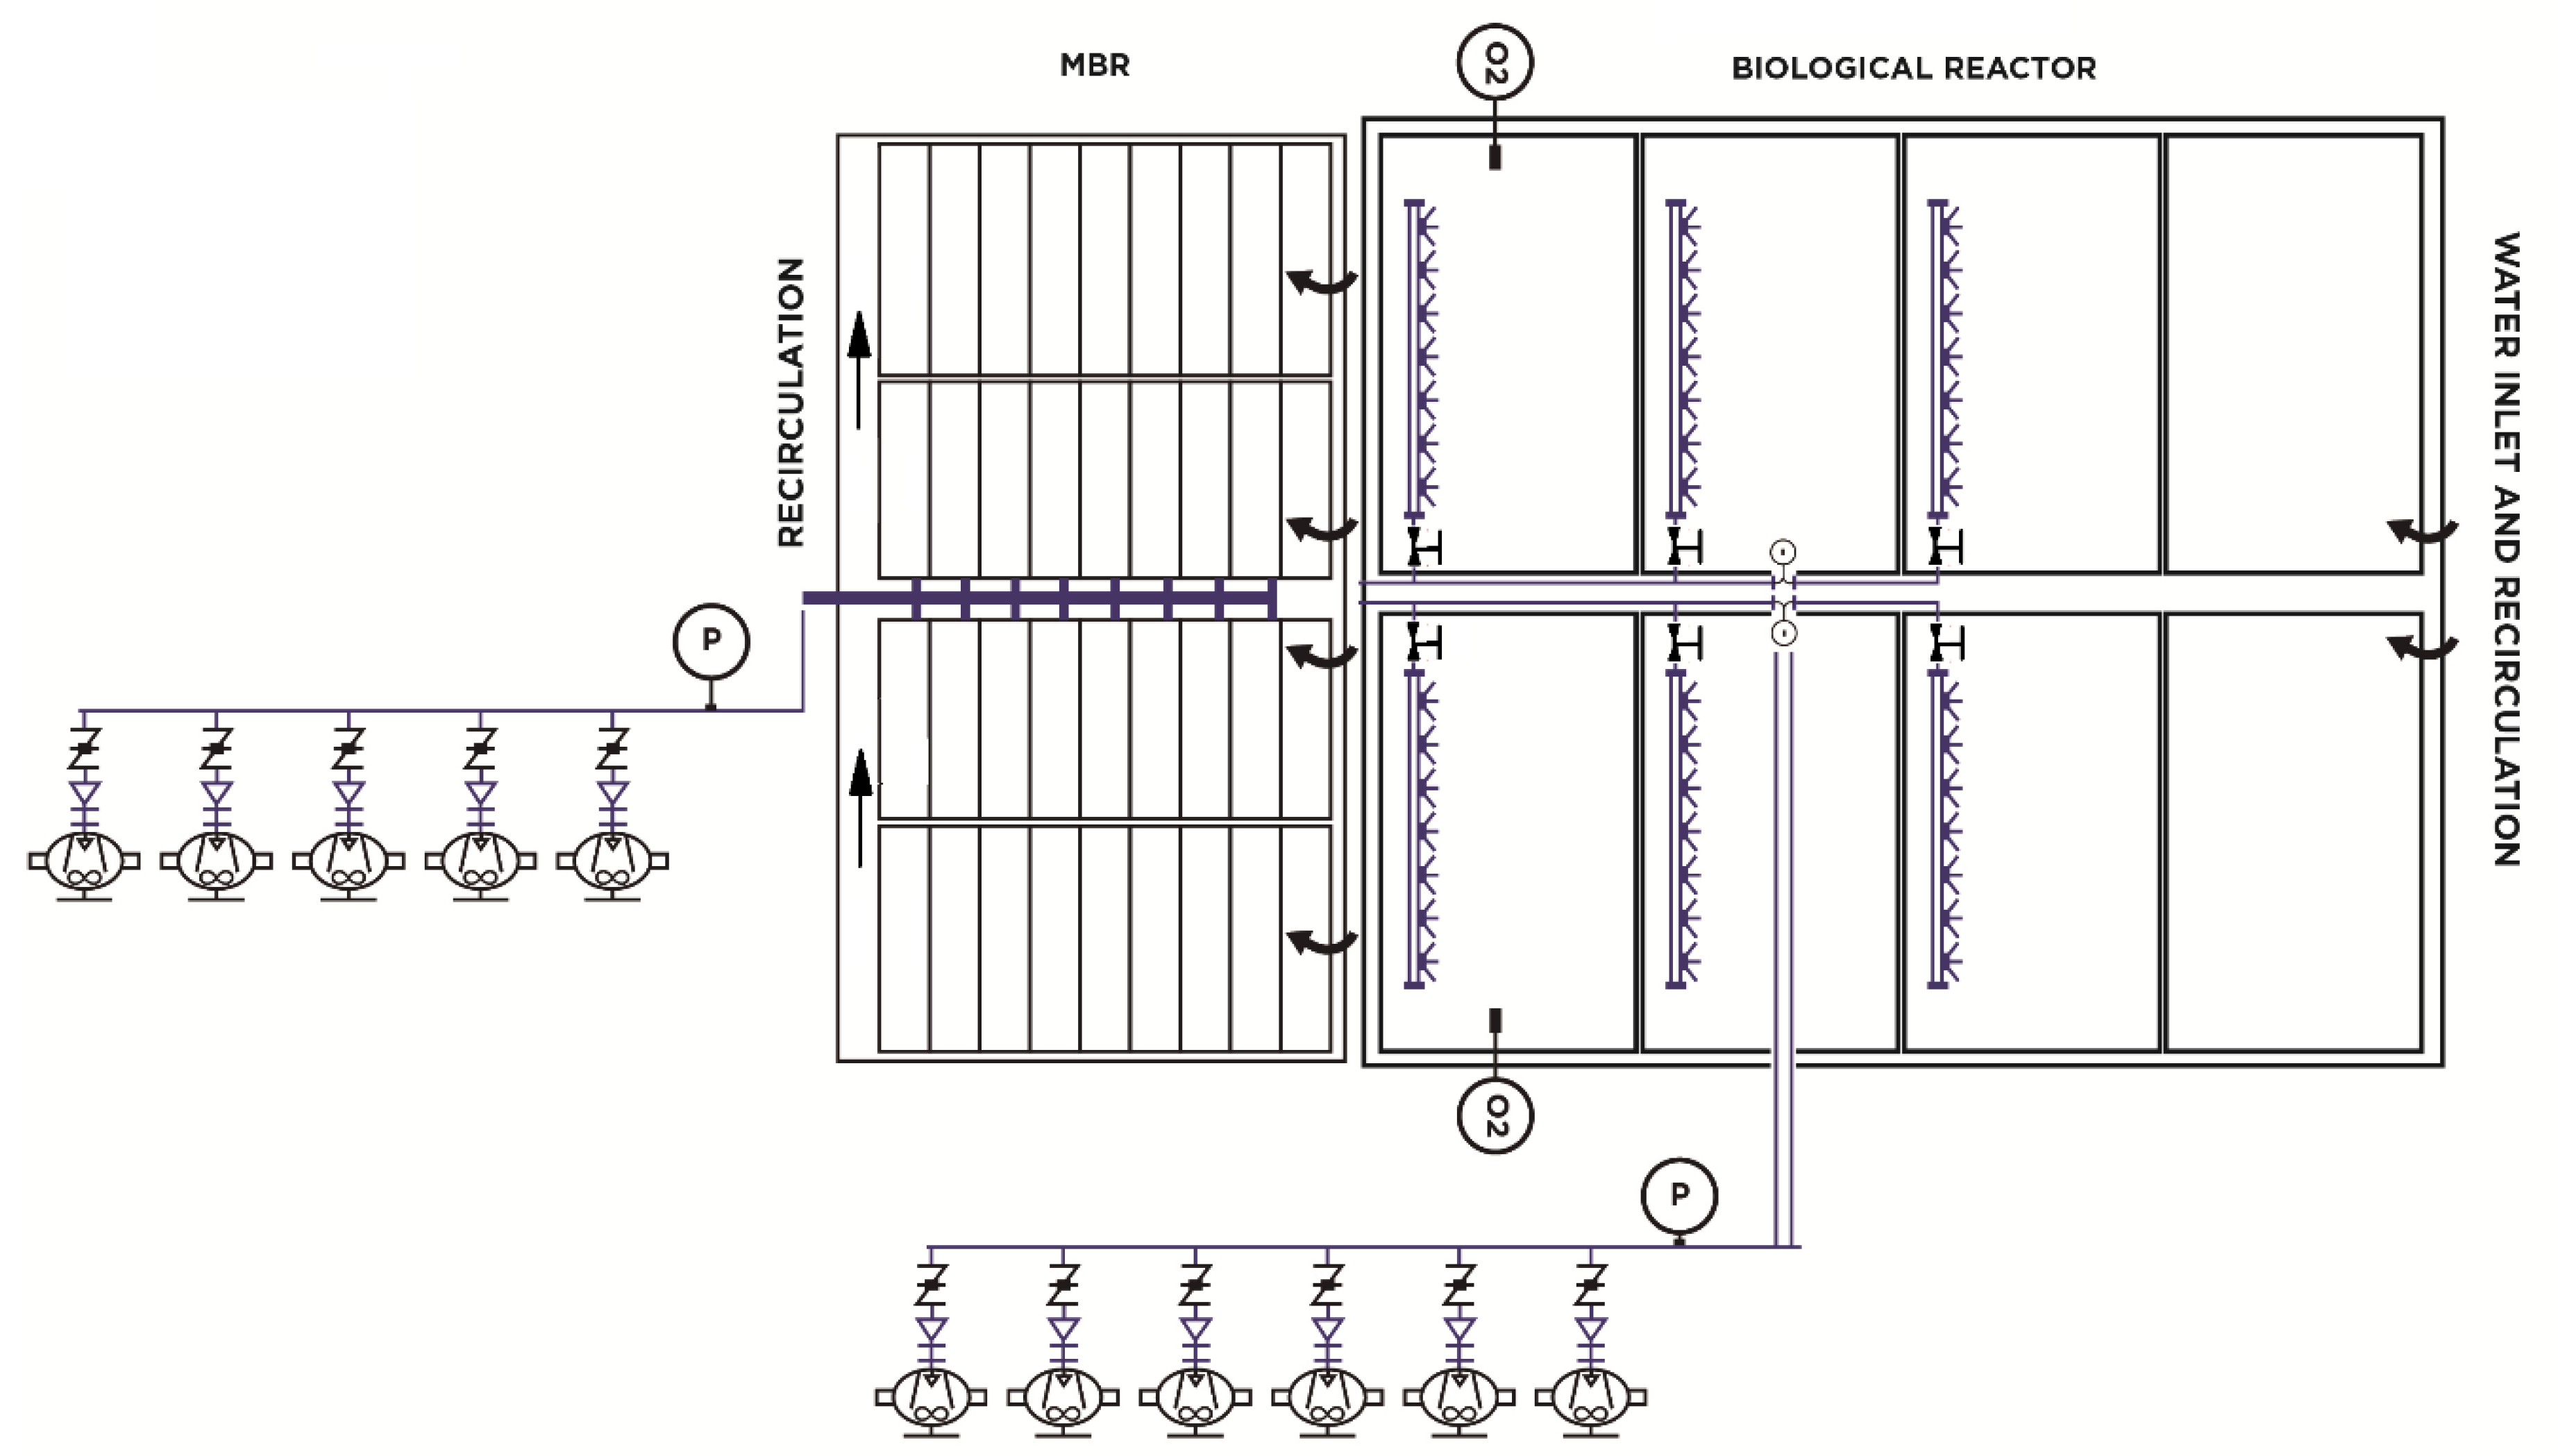
Abstract
:1. Introduction
- -
- Ensure the correct functioning of the different components involved in the operation of the WWTP, maximize the performance of the available equipment, coordinate the operation of the different process units in order to get the most out of them and reduce the impact of the disturbances on the final recipients of the treated water.
- -
- Guarantee the quality of the effluent.
- -
- Save energy by automatic control and by using the tariff system, by making possible the displacement of part of the energy consumption in aeration to the most economic tariffs.
- -
2. Initial Operating Conditions of the Control Systems Regulating the Biological Aeration Stage
- ➢
- Operation with time-based start-stop aeration cycles, regardless of the oxygen values achieved
- ➢
- Cycle operation with start-stop aeration according to pre-established oxygen settings in oxic chamber No. 3, regardless of the real oxygen requirements of the system
- -
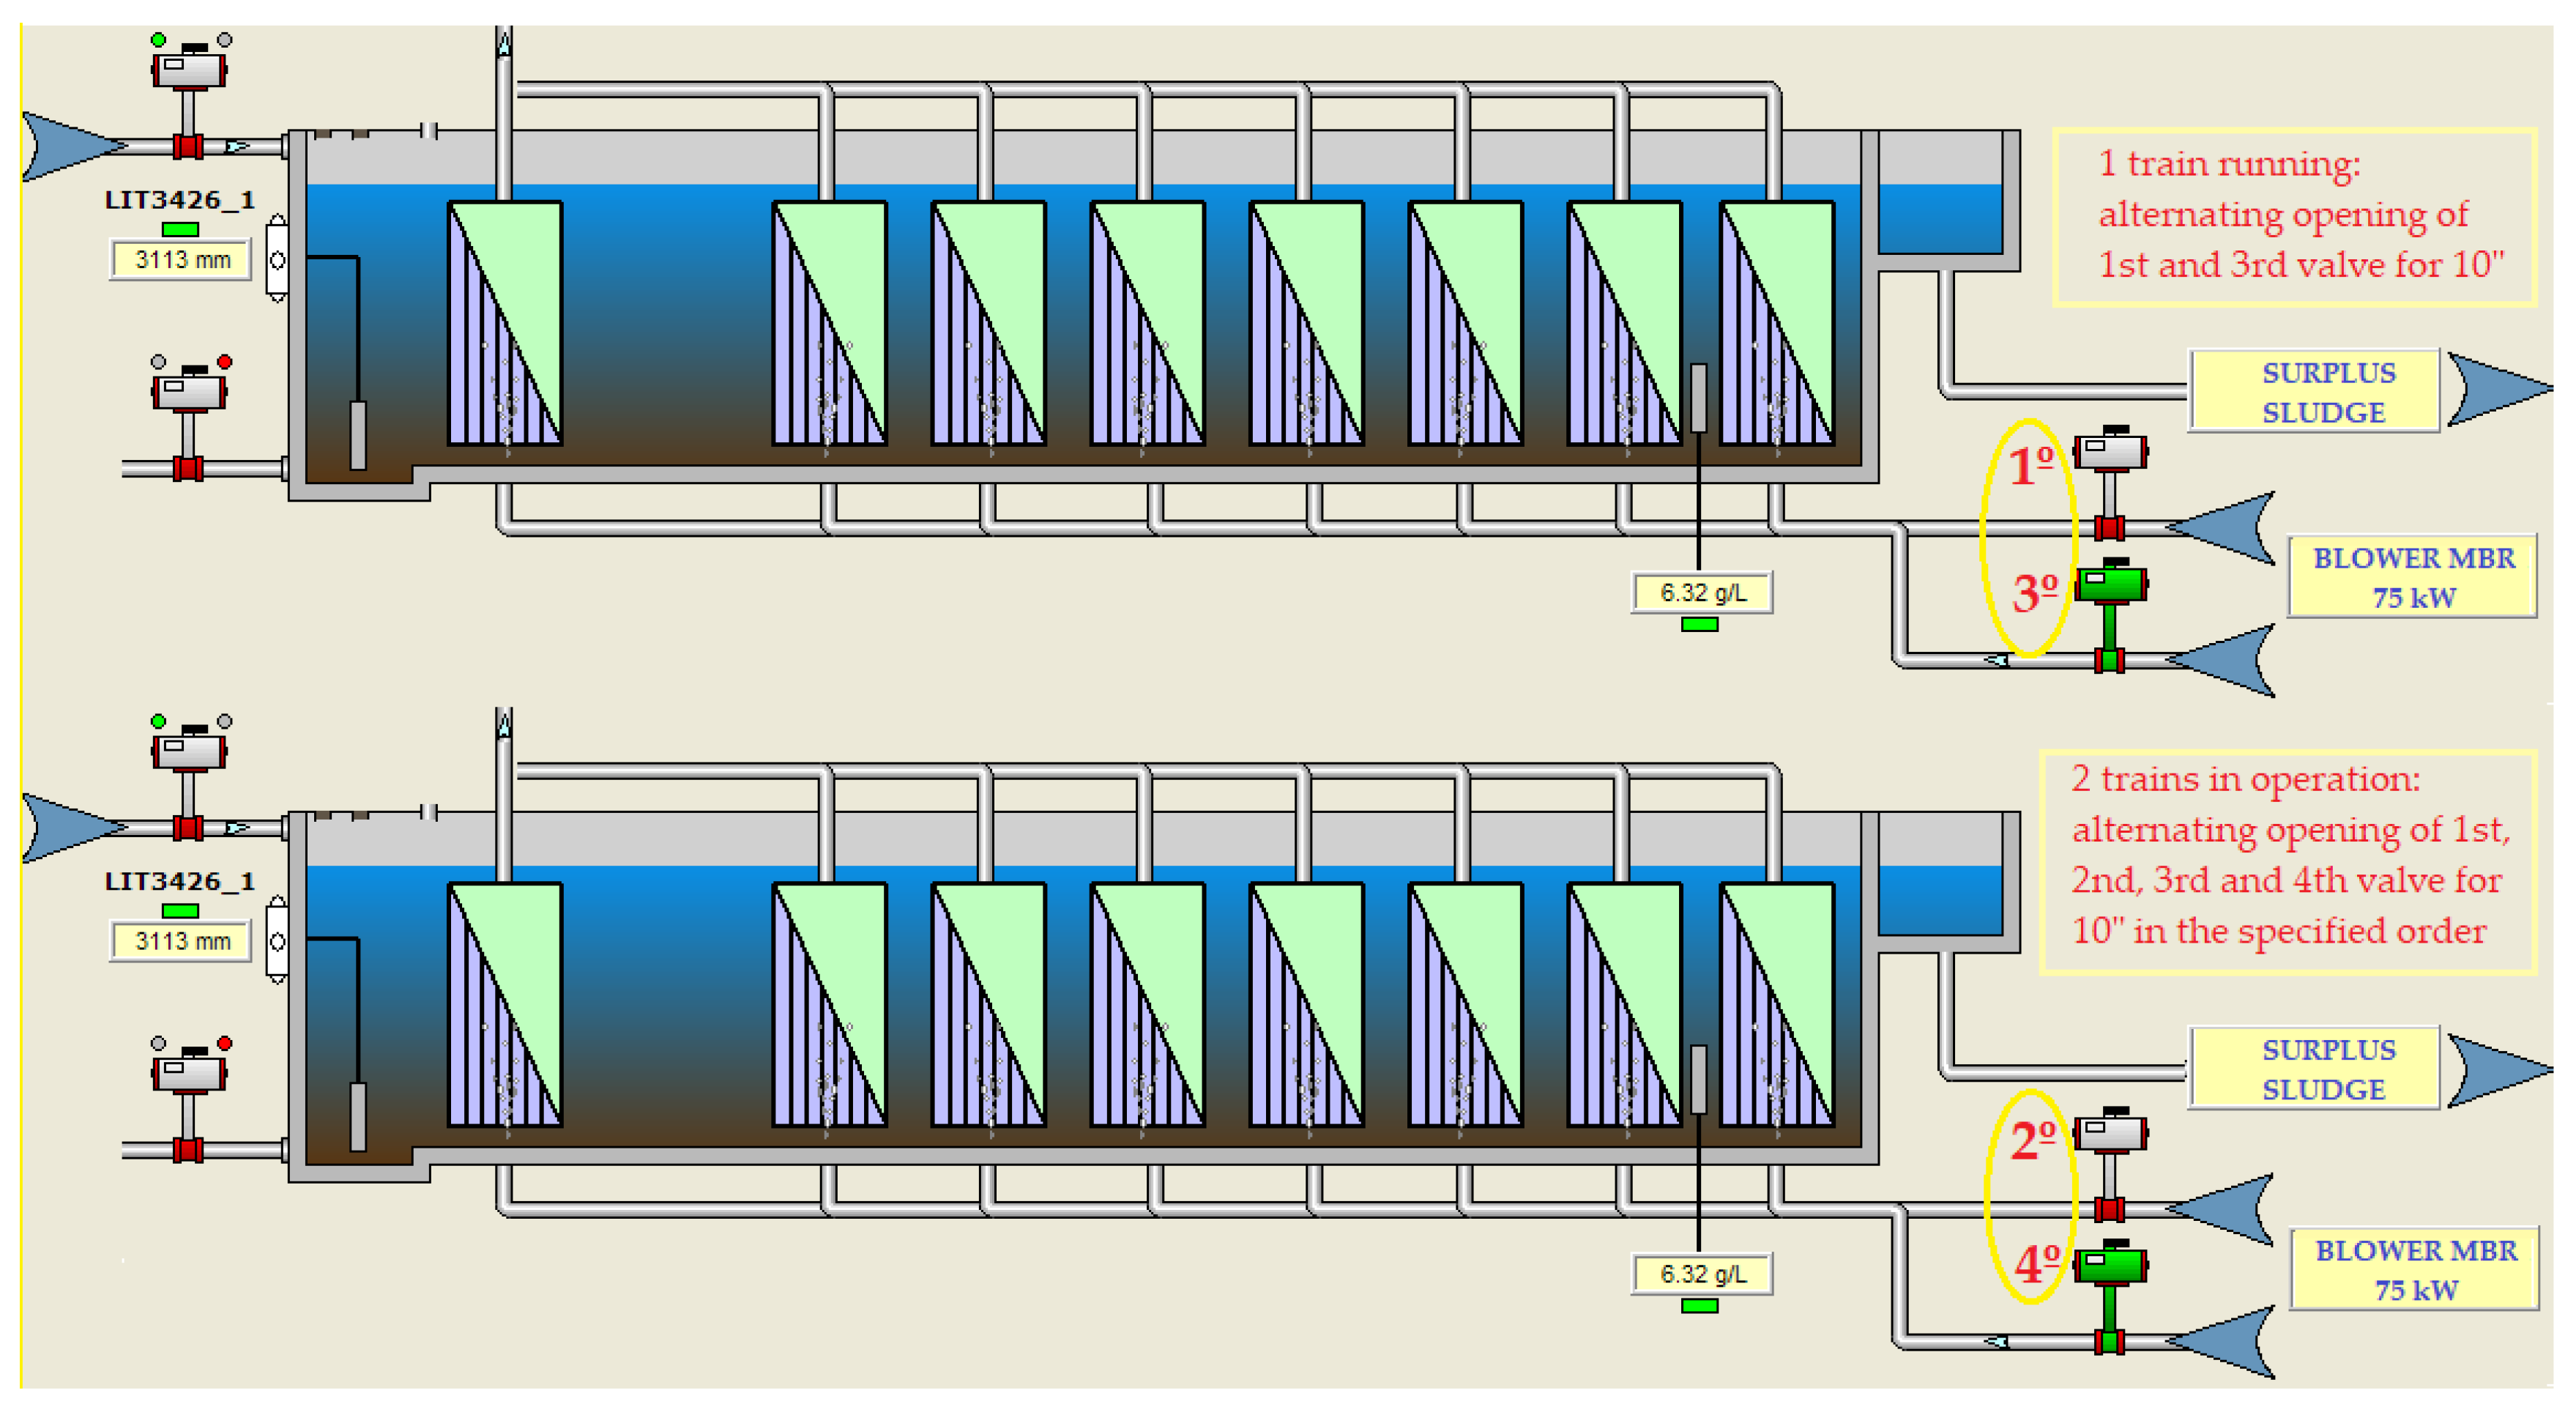
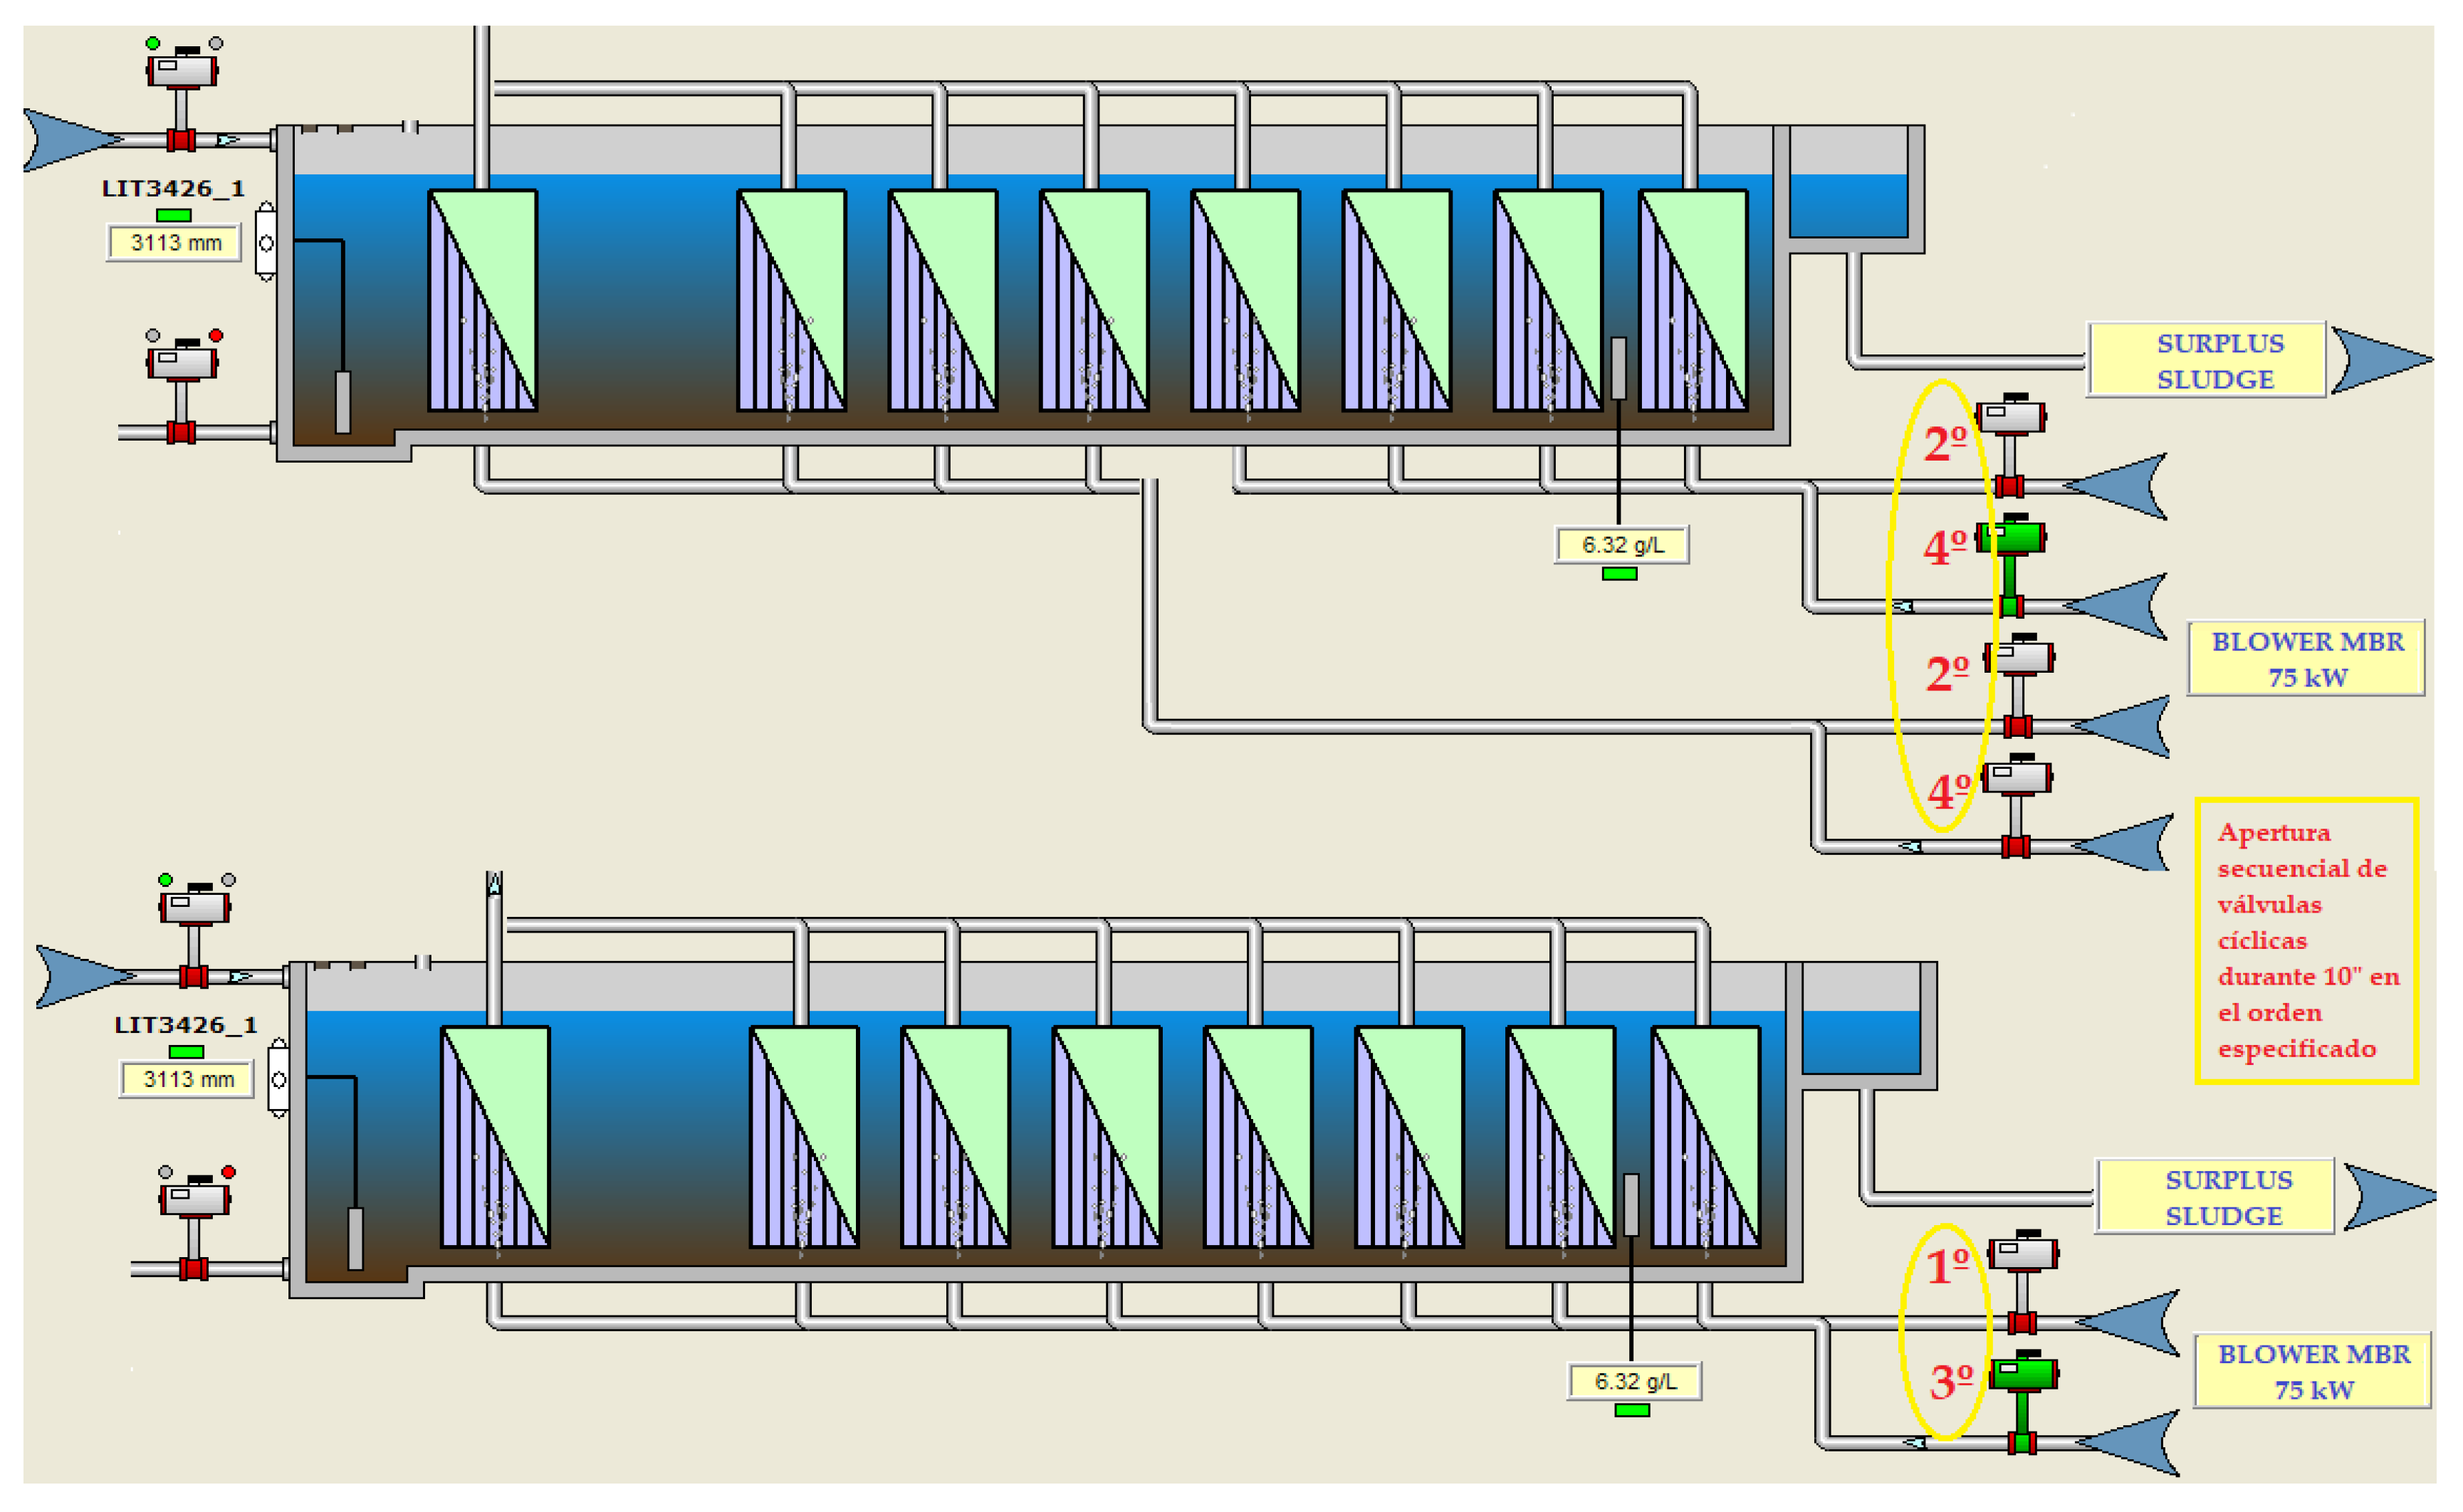
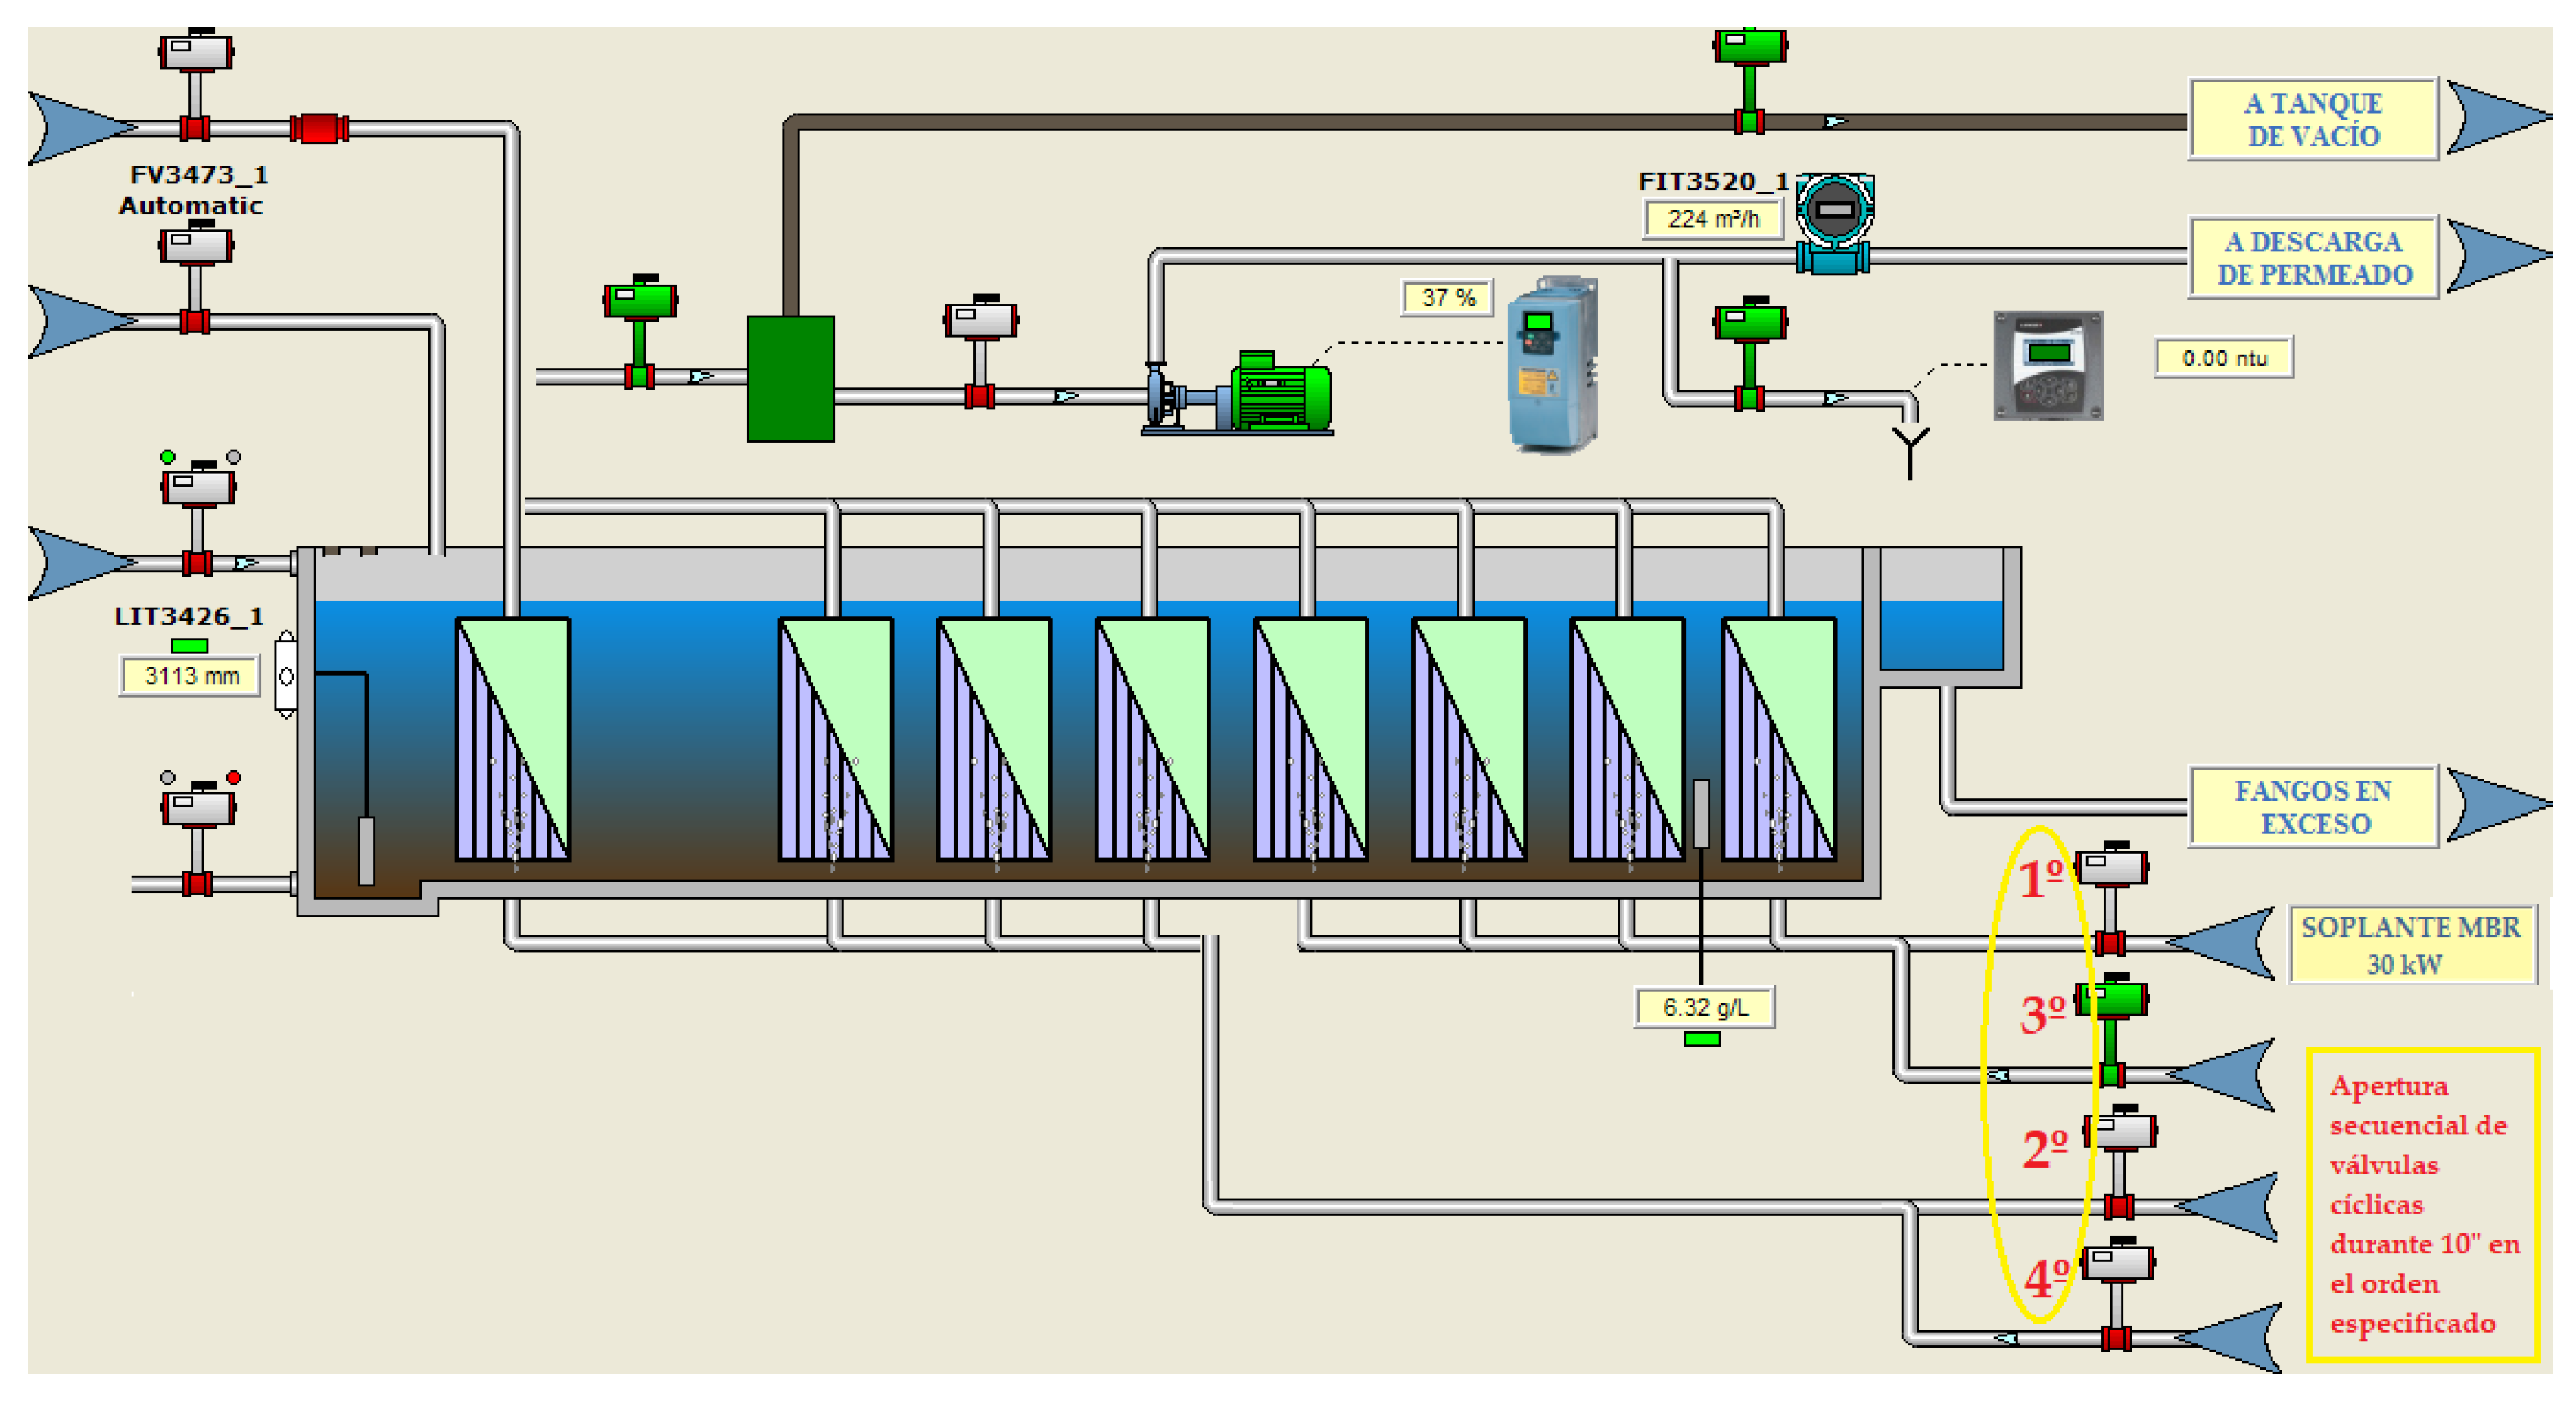
- For water flows below 300 m3/h, one membrane train with a 75-kW aeration blower was in operation. This blower provided a unit air flow of approximately 3650 Nm3/h at 3.72 m.w.c. distributed through two cyclic valves with a 10”/10” actuation mode. One of the valves would be open for 10 s, ventilating one part of the membrane cassette, and closed for 10 s, ventilating the other part of the cassette by alternating operation of the other valve, thus uninterruptedly (Figure 2).
- -
- For water flows of 300–600 m3/h, two membrane trains and a 75-kW aeration unit were in operation. The air distribution was done by four cyclic valves with a 10”/30” aeration mode. These valves would act sequentially; they would open for 10 s and remain closed for 30 s, with the actuation sequence being repeated indefinitely while the trains were in operation (Figure 2).
- -
- For water flows of 600–900 m3/h, three membrane trains would come into operation, and, for flows of 900–1200 m3/h, four membrane trains would be required to be in operation. In both cases, two 75-kW blowers were operated following the same valve actuation sequence mentioned above for one or two trains.
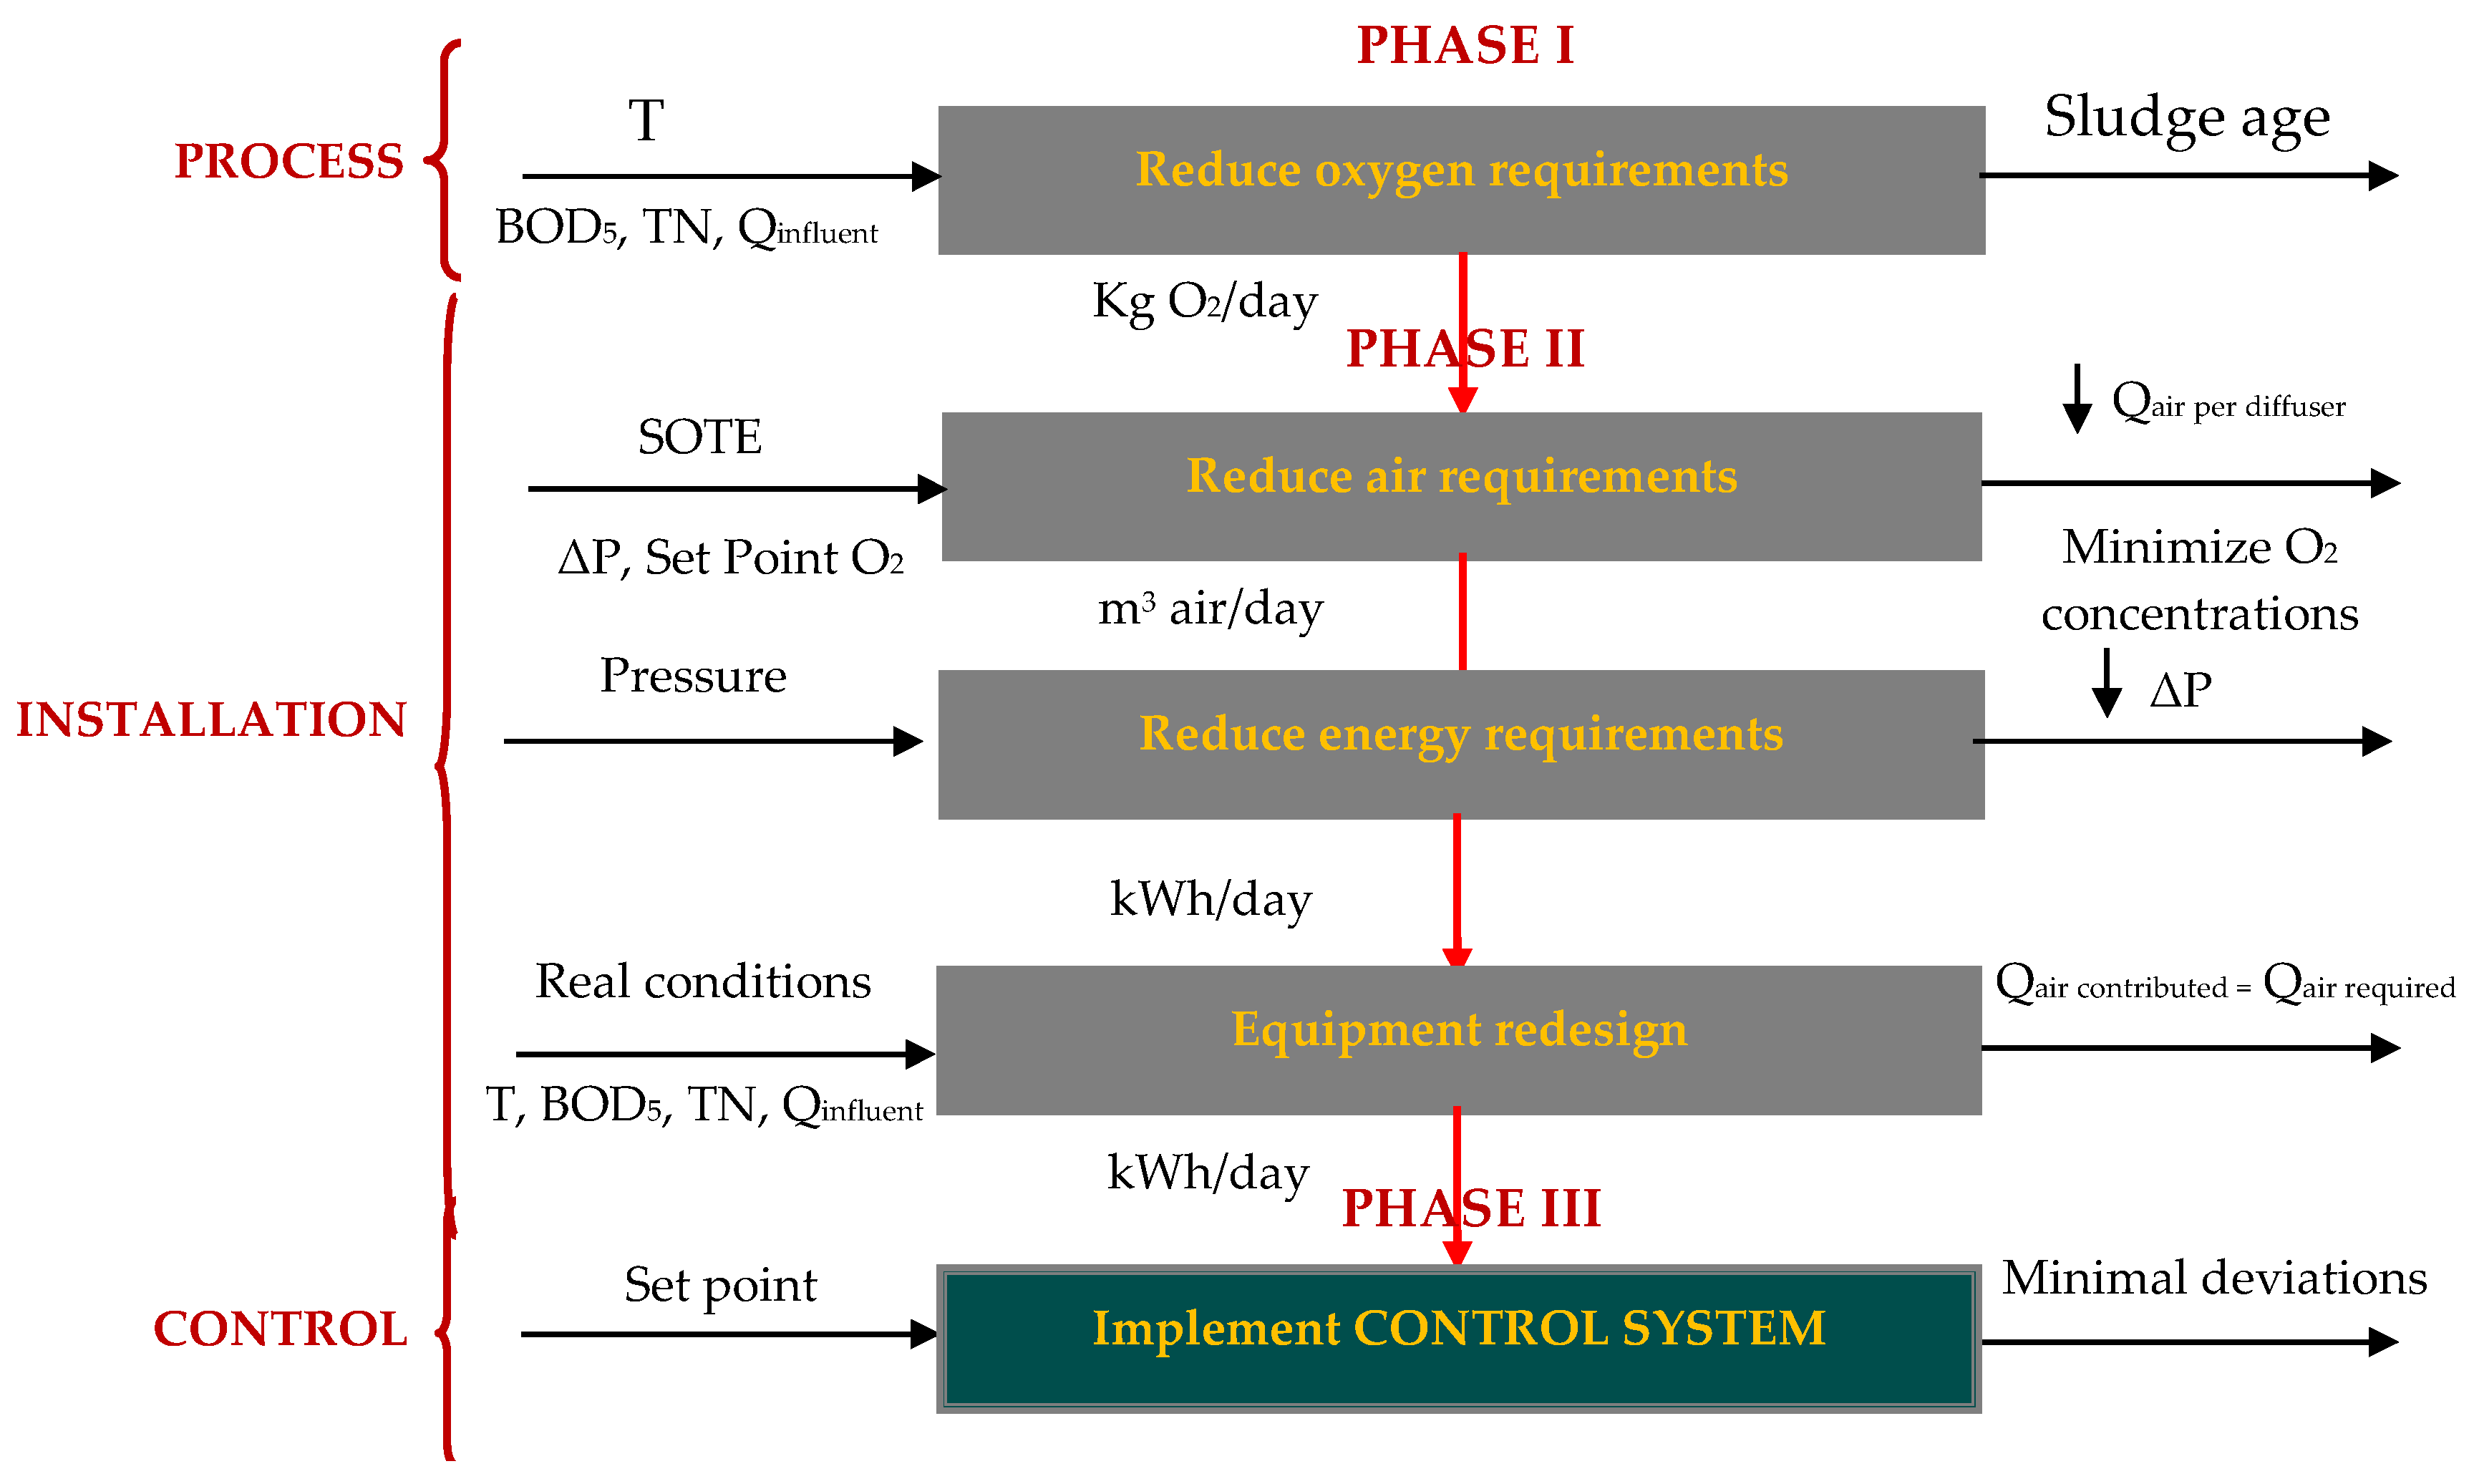
3. Method for the Design of the Aeration Control System
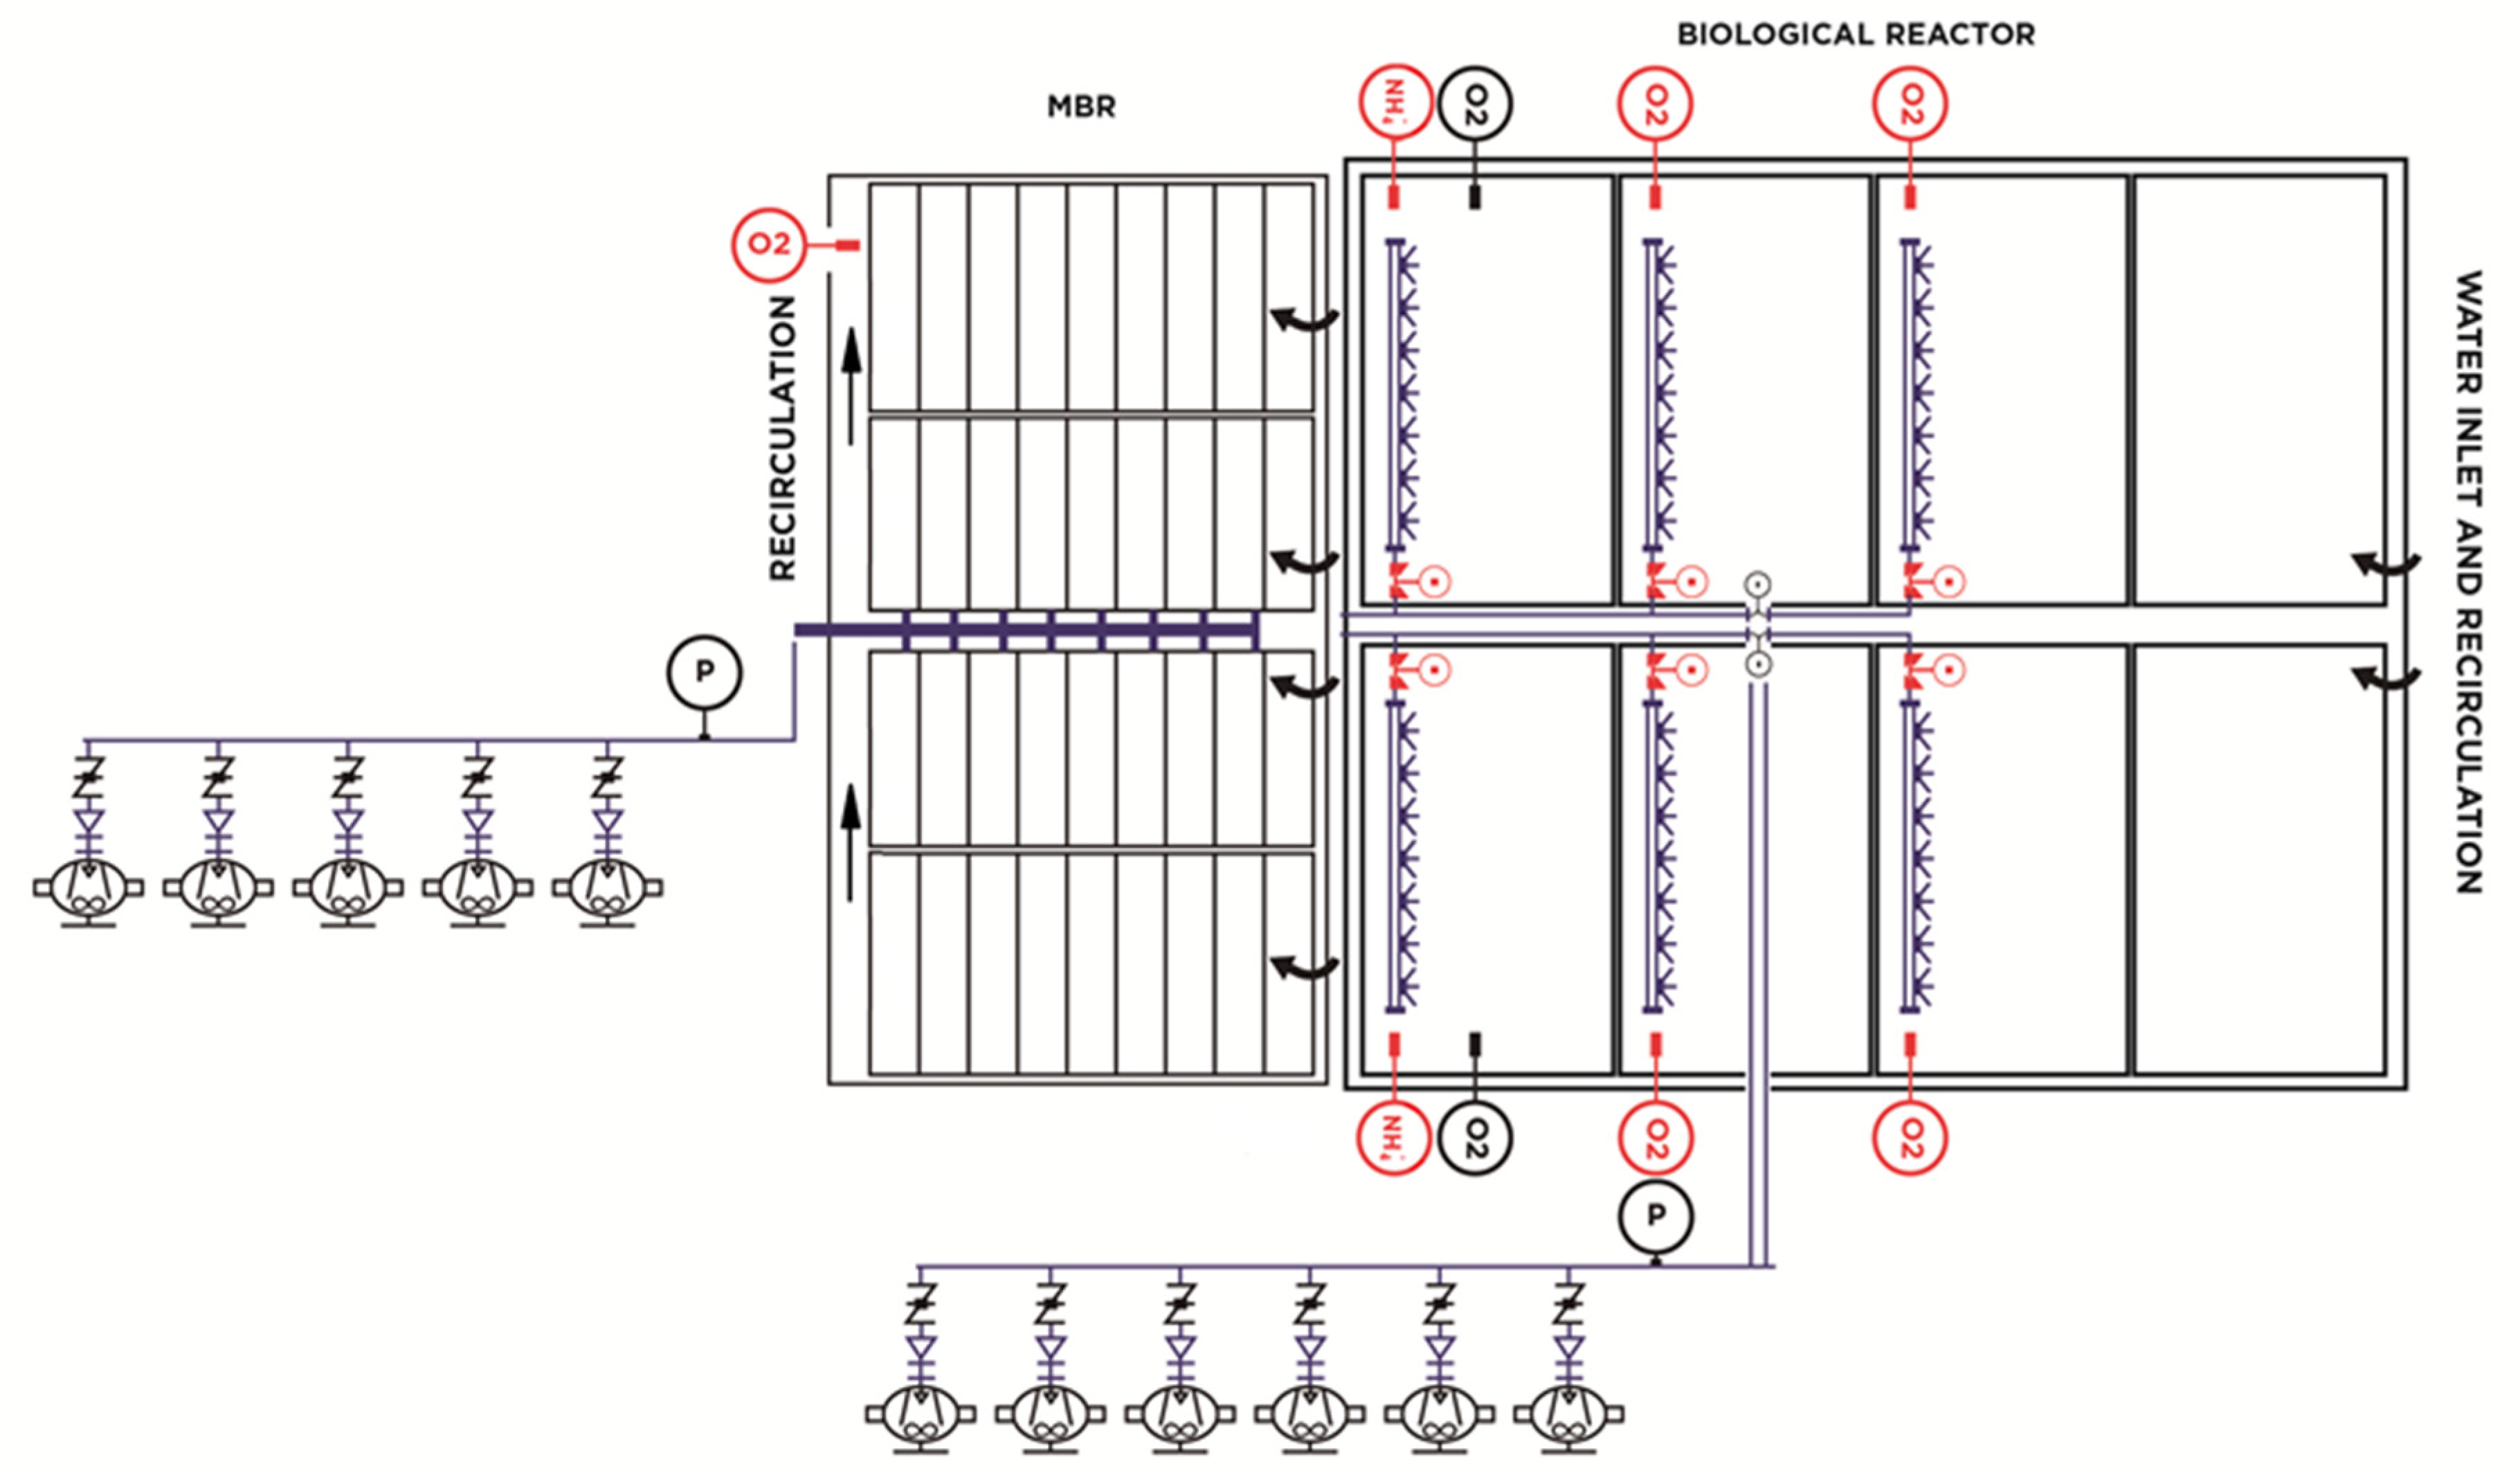
3.1. Design of the Aeration Control System of the Activated Sludge Biological Reactor
- -
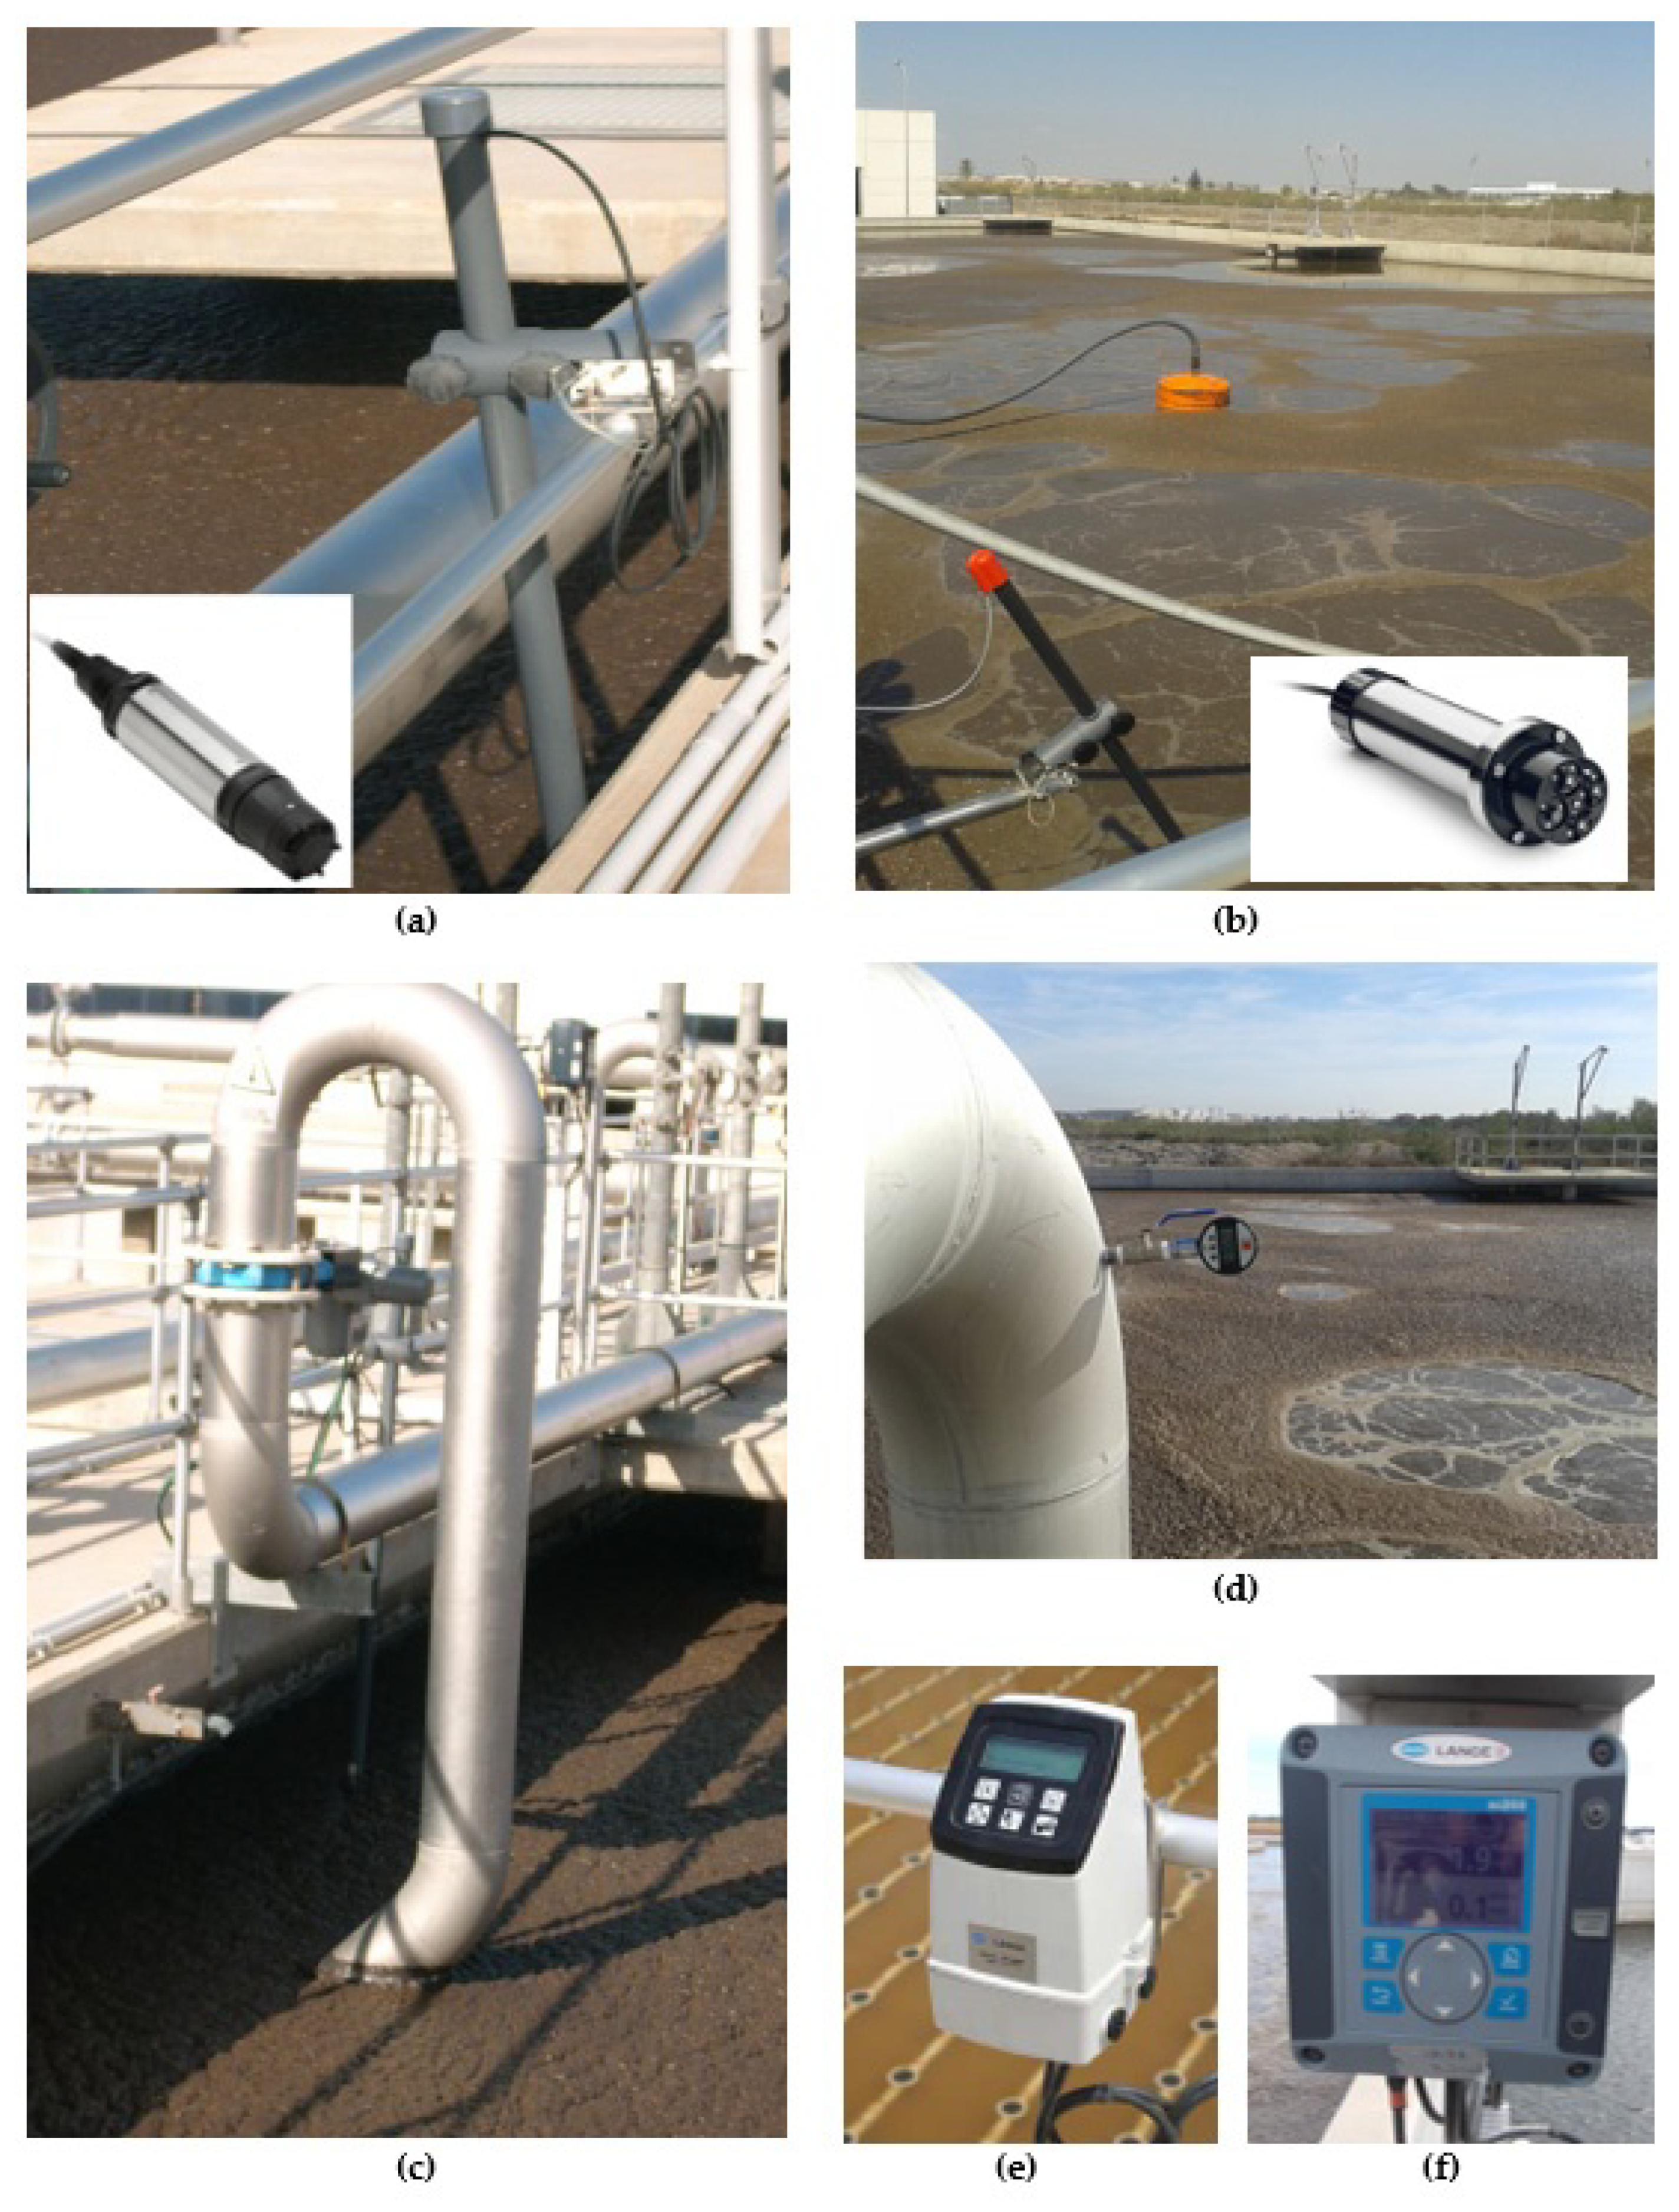
- Installation of a sensor for continuous measurement of ammonium and nitrate in each line of the reactor, located at the end of oxic chamber No. 3, formed by a combined sensor for continuous measurement, by selective electrode, of the ammonium and nitrate ions, with a measurement range of 0.5–1000 mg/L NH4+-N and 0.5–1000 mg/L NO3-N.
- -
- Installation of additional sensors for the measurement of dissolved oxygen (DO) in oxic chamber Nos. 1 and 2 of both biological reactors. This, together with the sensors in oxic chamber No. 3, allowed the dissolved oxygen concentration to be determined by luminescence in each of the chambers, with a measurement range of 0–20 mg/L.
- -
- Installation of a dissolved oxygen (DO) sensor in the MBR, specifically in the sludge recirculation channel common to all the membrane trains. This made it possible to determine the dissolved oxygen concentration by luminescence in the mixed liquor, with a measurement range of 0–20 mg/L O2/0–50 °C.
- -
- Installation of motorized guillotine valves in each downpipe to regulate the air flow in the oxic chambers with variable dimensions depending on the density of diffusers in each chamber with WAFER connections, and a cast iron body. An AUMA MATIC electric actuator was also installed, with regulation by means of a 0–20-mA signal.
- -
- Installation of pressure sensors in each airline to control the pressure, with a measurement range of 0–1 bar.
- -
- Programming in the PLC of the new control loop according to the measured parameters (NH4+-N, NO3−-N and DO) and the pressure in the manifold, as well as implementation in the plant Supervisory Control and Data Acquisition (SCADA) system.
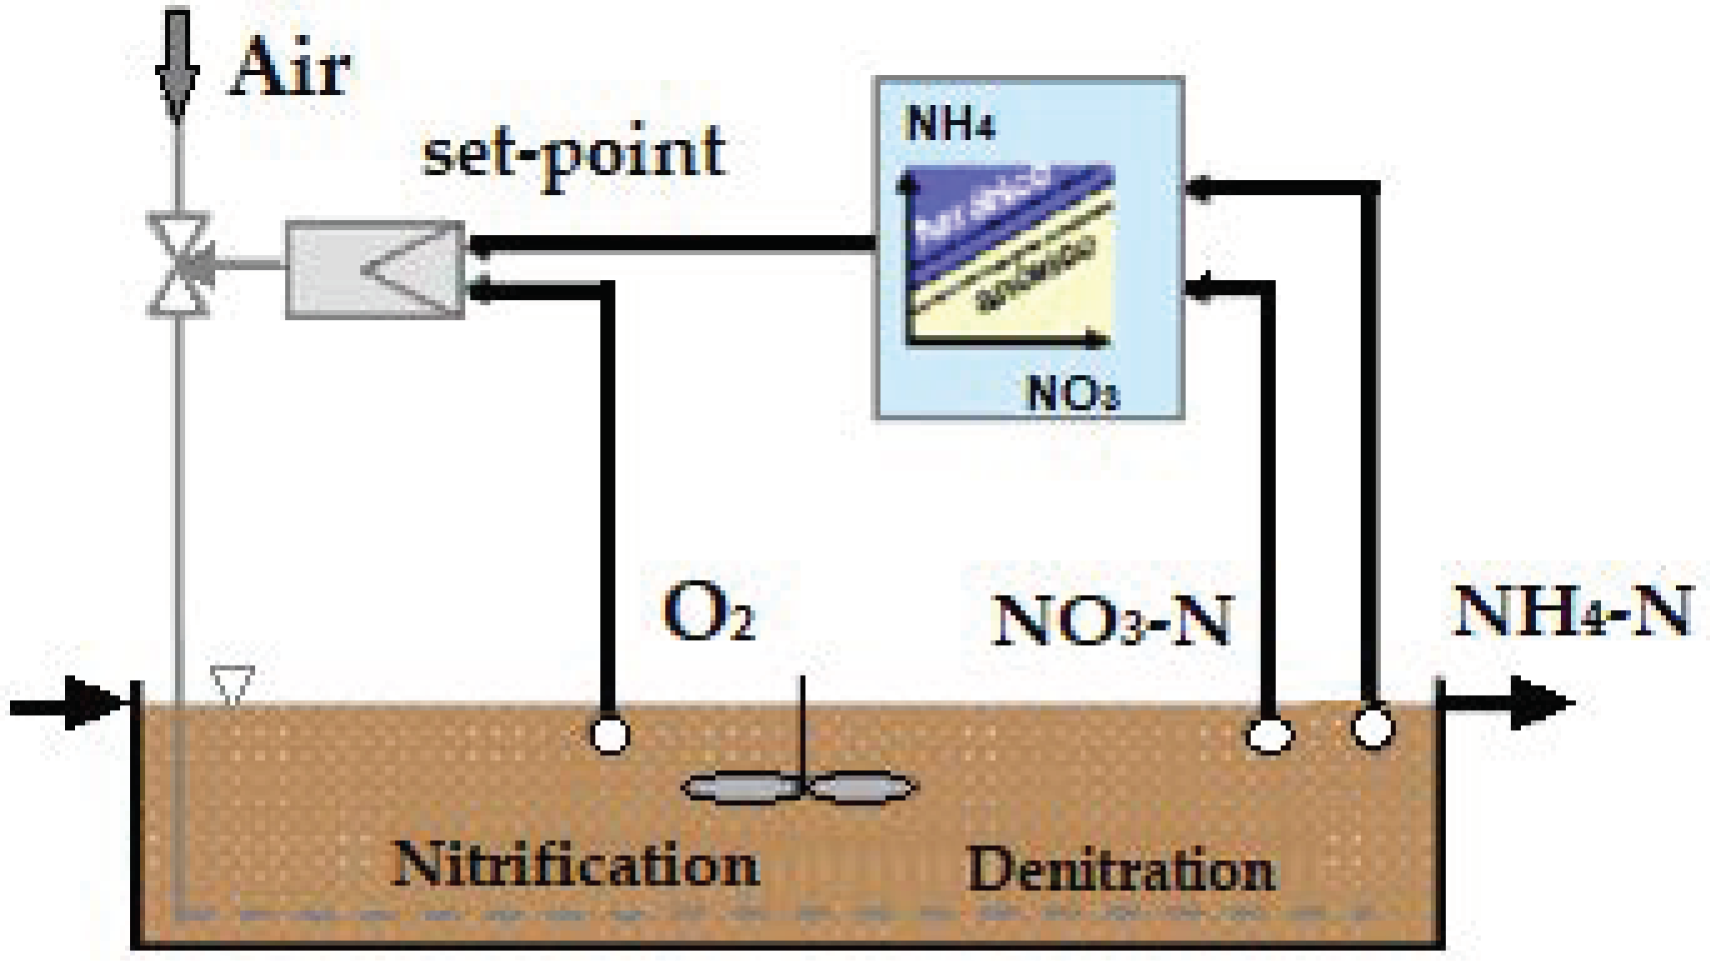
3.1.1. Criteria for Establishing Aeration Cycles Based on the N-NH4+/N-NO3− Content in the Water
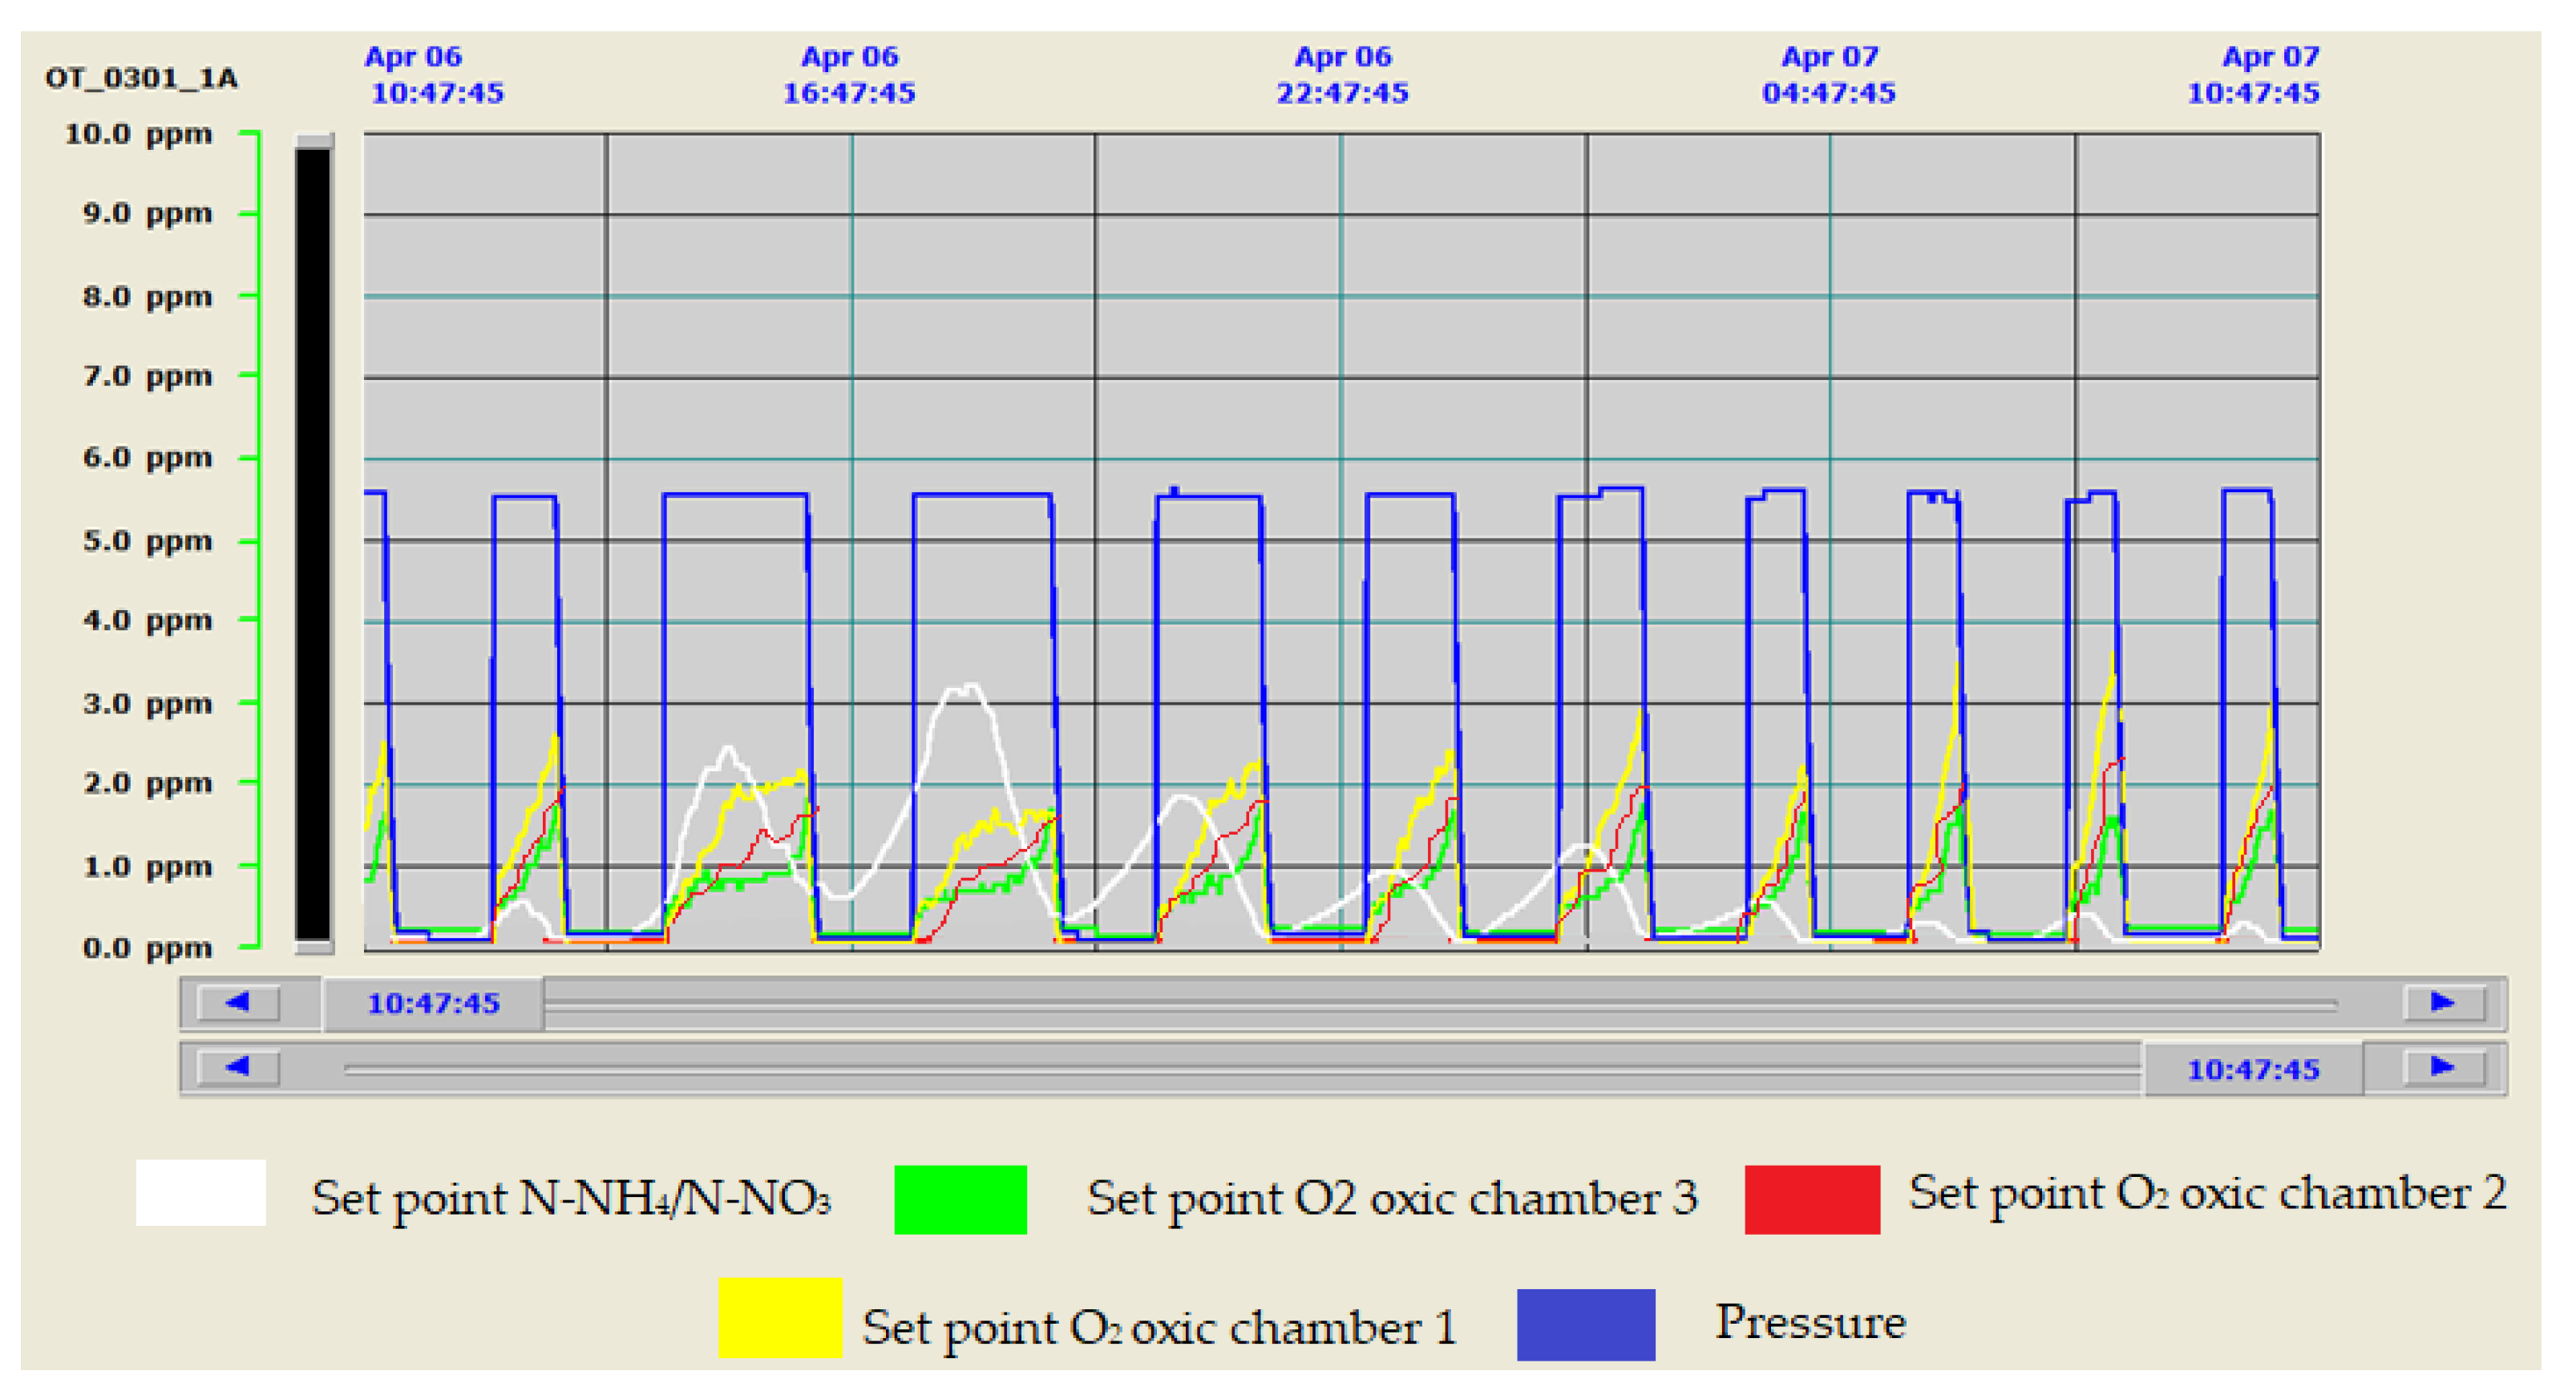
3.1.2. Criteria for Establishing Oxygen Set Points in Aerated Areas
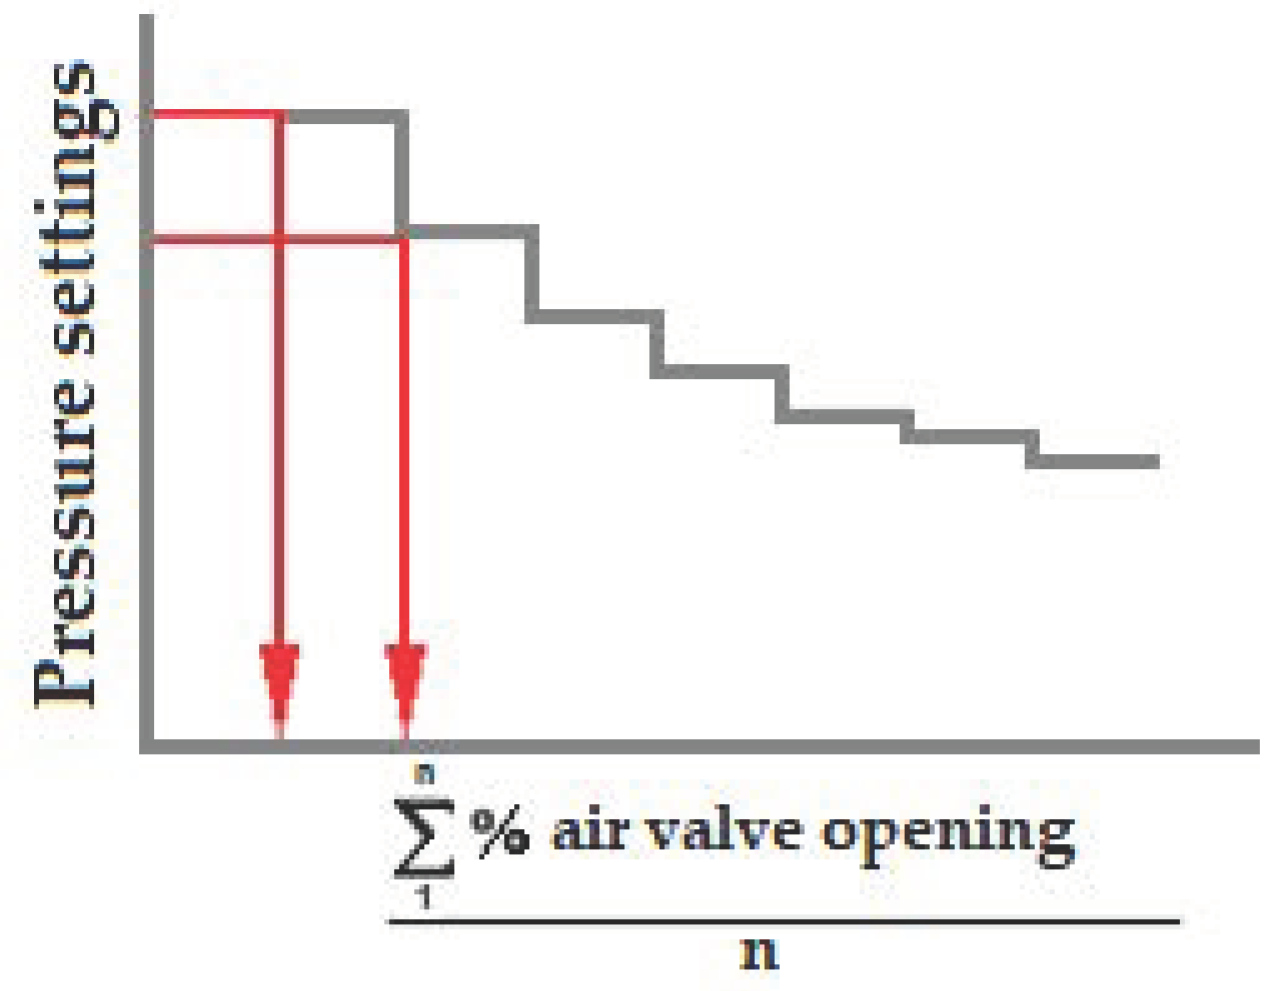
3.1.3. Criteria for Establishing Working Pressure Setpoints
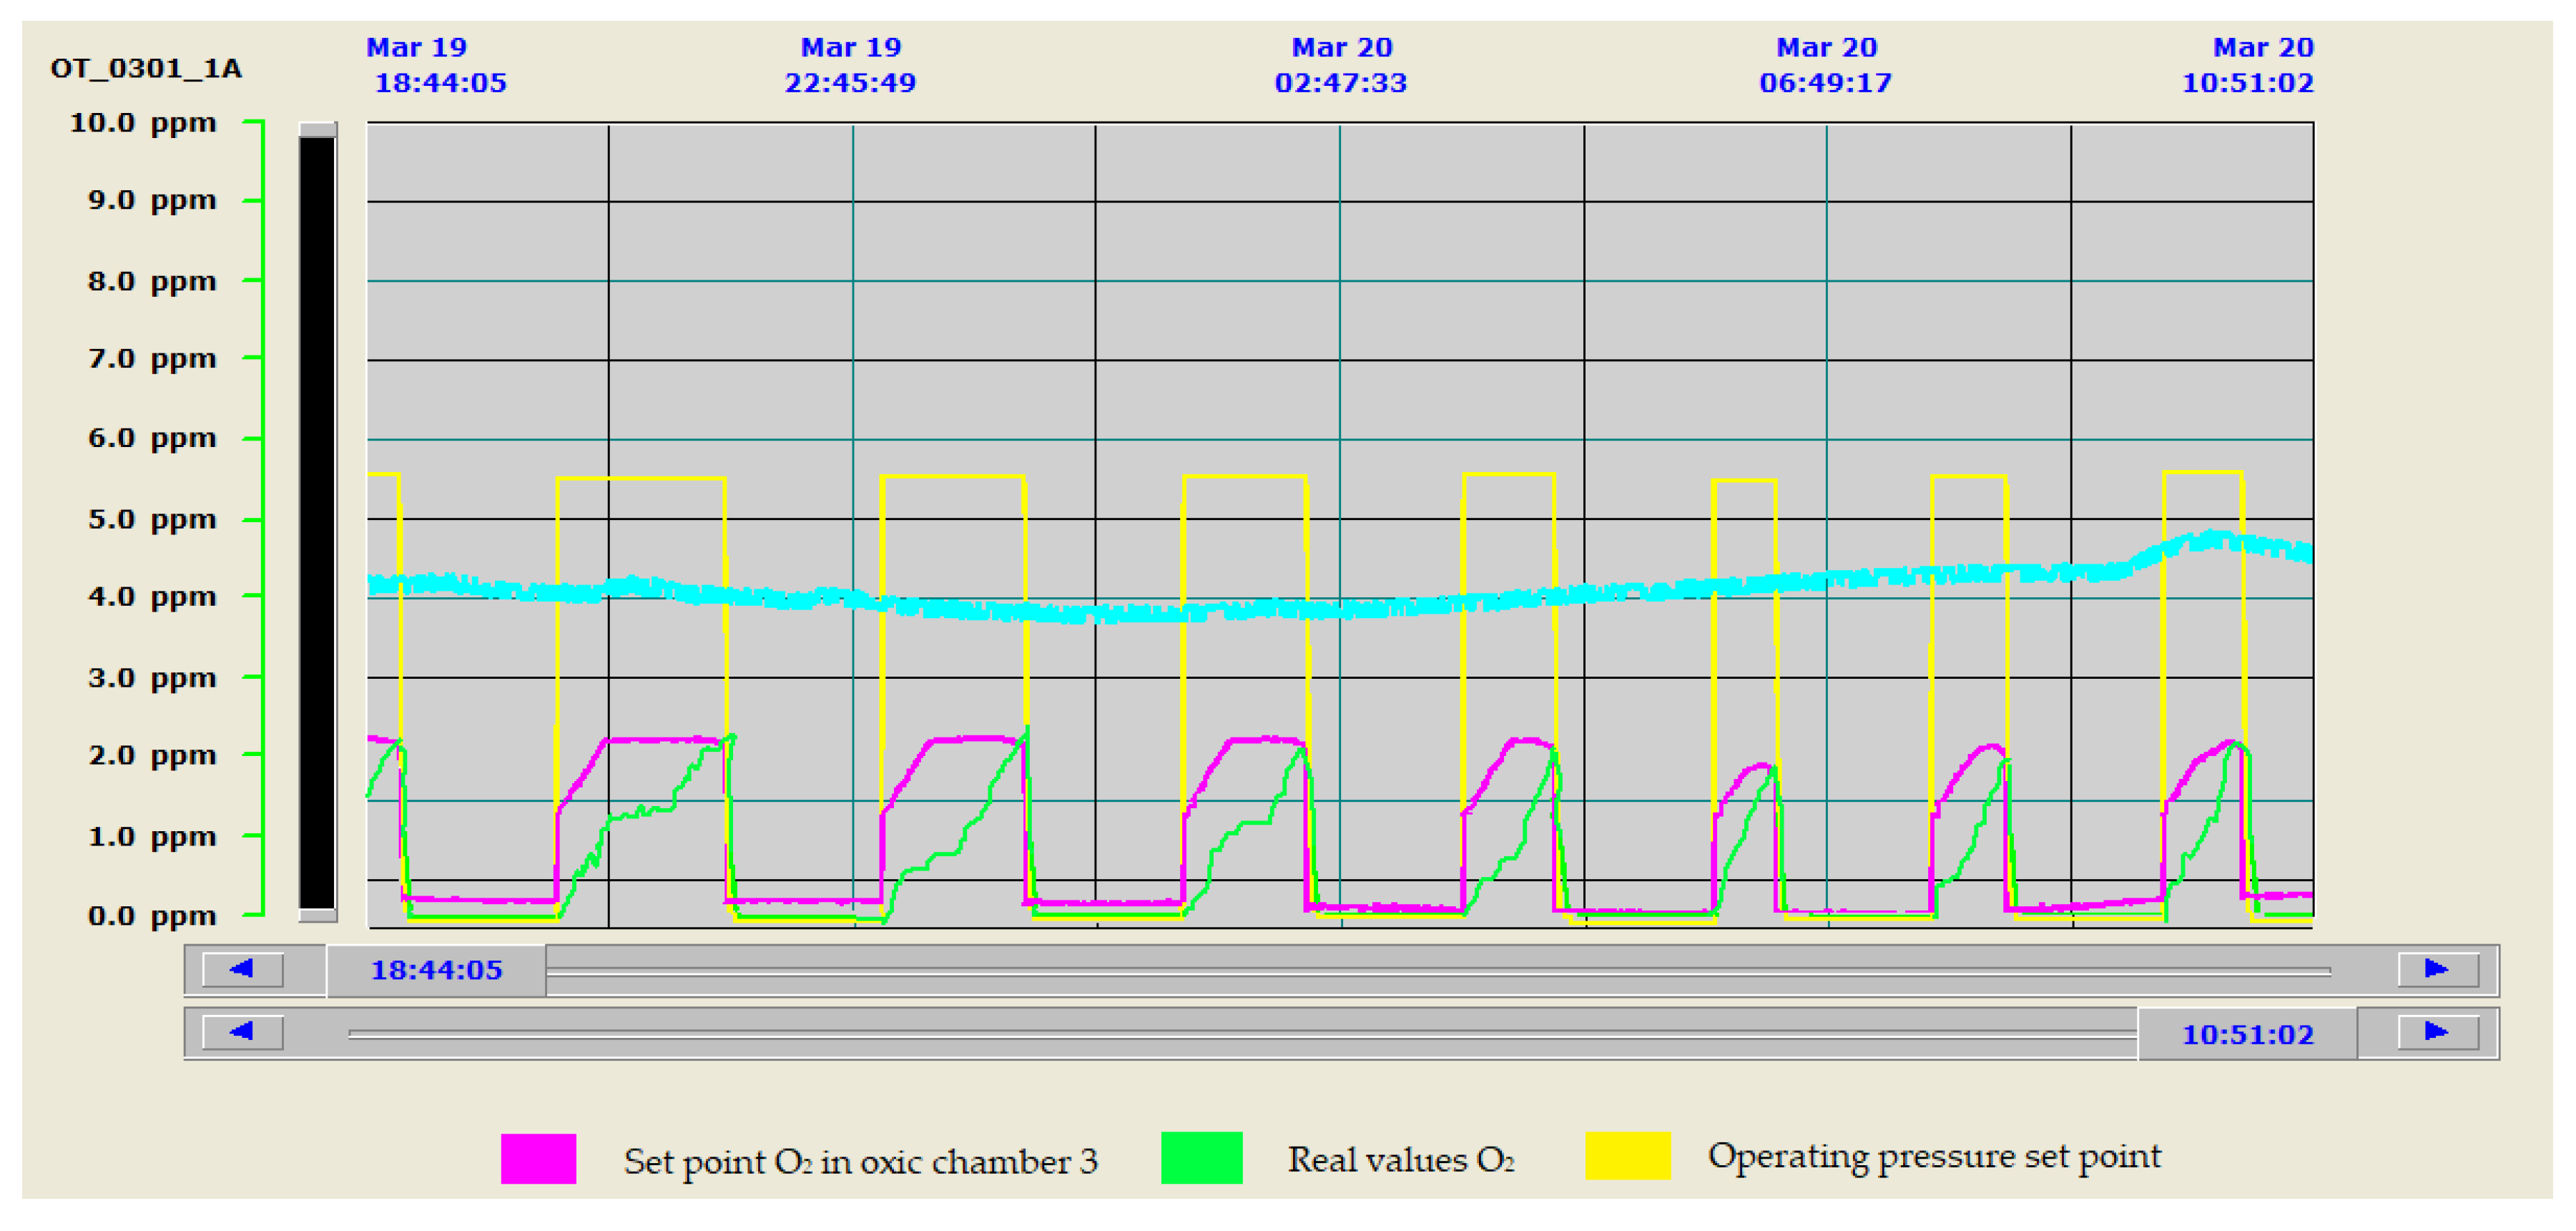
- Tests with constant pressure settings.
- 2.
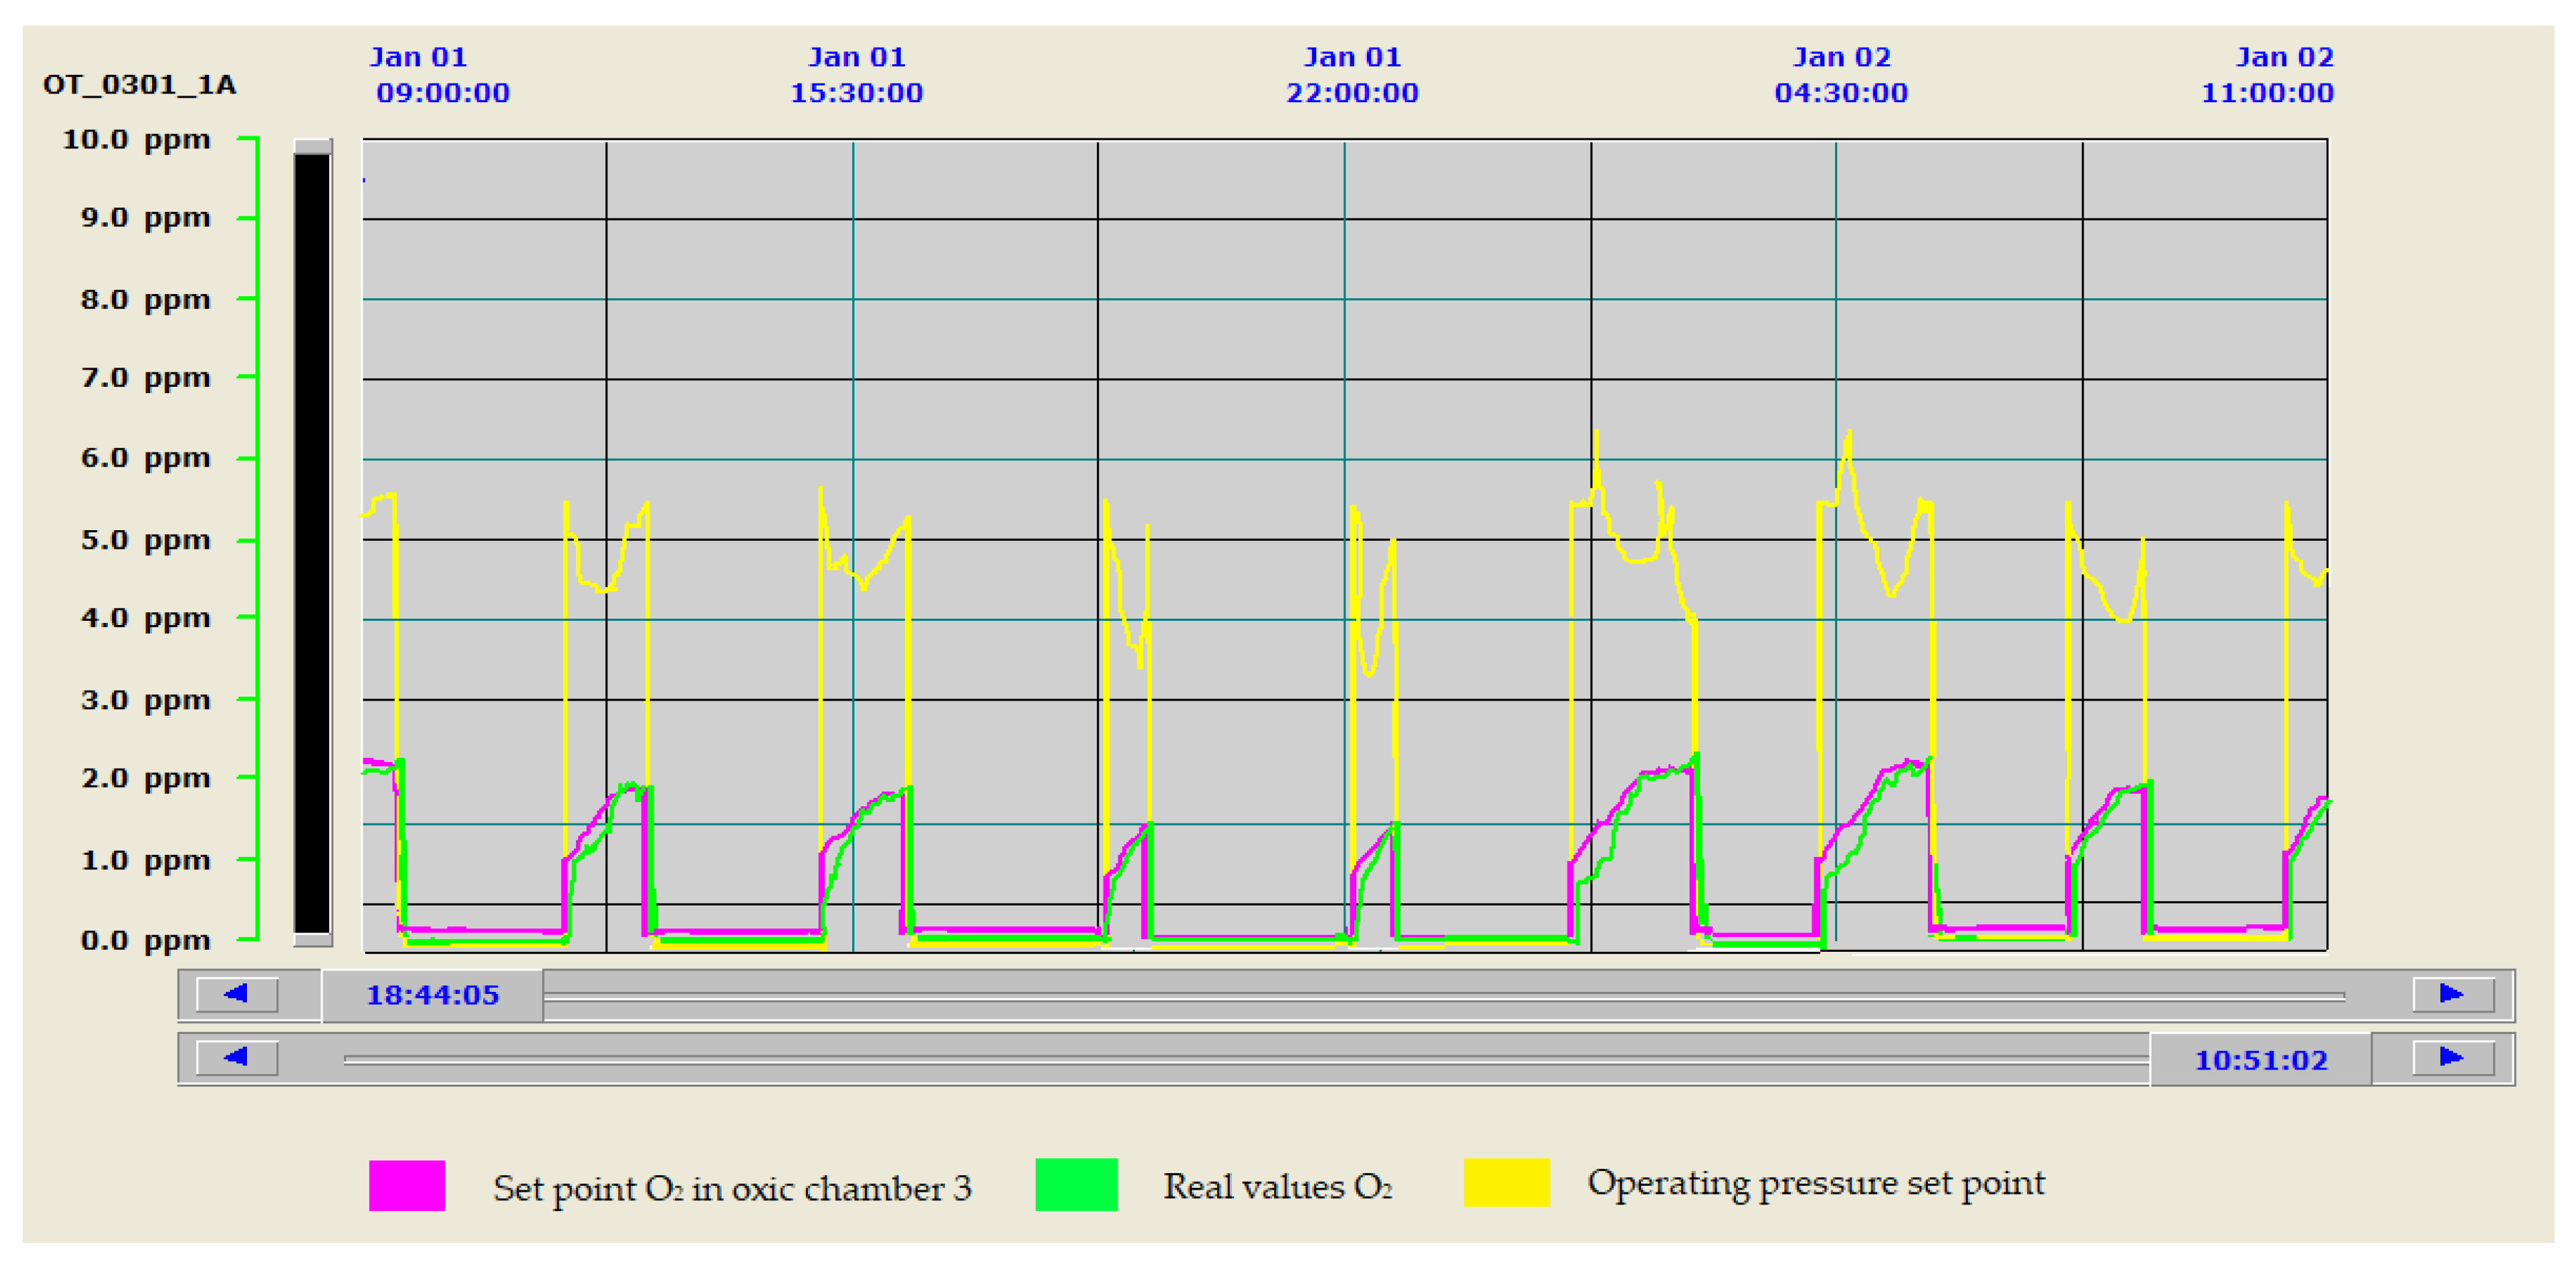
- Tests with variable pressure set points.
- -
- When in one of the zones, the control system requests that the position of the corresponding valve in one of the chambers is above the maximum opening threshold set (80%, value configurable from the SCADA system) as the oxygen setpoint is not reached in the zone and is lower than the setpoint by a certain value (setpoint + 0.01). This situation is maintained for a certain time (5 min), and then the setpoint of the PID pressure controller is increased by a certain amount (0.002 bar). The resulting increase in pressure in the main line has the effect of increasing the measured oxygen value in the tank in question, bringing it back to the setpoint. This reduces the opening of the corresponding valve, positioning it in a more desirable range for control purposes.
- -
- If, on the other hand, the control system requires the position of the corresponding valve in one of the chambers to be below the minimum opening threshold set (50%, value configurable from the SCADA system), because the oxygen measurement is higher than its setpoint by a certain value (setpoint−0.01), and this situation is maintained for a certain time (5 min), the PID pressure controller setpoint is decreased by a certain value (0.002 bar). The resulting decrease in pressure in the main line has the effect of decreasing the measured oxygen value in the area in question, reducing it to its set point, and increasing the opening of the corresponding valve, positioning it in a more desirable range for control purposes.
3.2. Design of the Aeration Control System for the Membrane Bioreactor
- ➢
- Reduce the air flow supplied to the membrane system.
- -
- Set a fixed blower operating speed
- -
- Set two different speeds with a settable time so they follow each other cyclically
- ➢
- Separate the aeration shared between membrane trains.
- ➢
- Reduce the aeration flow rate of one of the installed equipment to 50%.To do this, an economic study was carried out, considering the possibilities:
- -
- Replacing an existing 75-kW aeration unit with a new unit with an installed power of 30 kW, with a normal air flow rate of approximately 1825 Nm3/h at 300 mbar.
- -
- Mechanical modification of the transmission system of one of the existing blowers to achieve the reduction in operating speed required to obtain the desired flow rate, no less than 1825 Nm3/h at 300 mbar.
- ➢
- Modify the air supply line to isolate the aeration between trains.The intervention was made to two trains, identified as No. 2 and No. 3. For each modified train, it was necessary to install:
- -
- Two new pneumatically operated cyclic valves with 1/4” BSP connection actuator and a maximum pressure of 8 bar.
- -
- A new pneumatic panel, where all the electric and pneumatic control elements were included: electrovalves, pressure regulator, etc.
- -
- A manual butterfly valve type WAFER Butterfly DN-300 and manual reducer to facilitate the maintenance of the cyclic valves.
- -
- Pressure sensors in each airline to control the pressure, with a measurement range of 0–1 bar.
- ➢
- Program PLC and SCADA with a new control strategy based on the number of trains running:
- -
- When the demand for water treatment requires the startup of a single train (single-train mode), train No. 2 or train No. 3 is activated according to its availability in the SCADA system with actuation of both the blower with a 30 kW motor and the four cyclic valves located in the same train with 10/30” opening and closing (Figure 8.)
- -
- When the demand for water treatment requires the start-up of two trains (two-train mode) there is an option to start up trains Nos. 1 and 2 or trains Nos. 3 and 4, depending on their availability in the SCADA with a 75-kW blower motor. The operation criterion followed will be the same as up to now (10/30” opening and closing) but it is necessary to set up four cyclic valves (Figure 9).
- -
- When the demand for water treatment requires the implementation of three trains, the operation is a combination of the two previous cases, in which a 75-kW blower for two-train operation (two-train mode) with 10”/30” aeration and a 30-kW blower for single-train operation (single-train mode) with 10/30” aeration would come into operation (Figure 8 and Figure 9).
- -
- When the demand for water treatment requires the operation of four trains, all available trains with two 75-kW blowers and the performance criterion developed for the two-train mode are put into operation (Figure 9).
4. Results and Discussion
4.1. Design of the Aeration Control System of the Activated Sludge Biological Reactor
4.2. Design of the Aeration Control System for the Membrane Bioreactor
4.3. Overall Results on Energy Consumption at the WWTP
5. Conclusions
- -
- It offers important operational advantages since it is possible to work with both lines of the reactor. This offers a greater capacity for action in the event of an unforeseen event.
- -
- It increases efficiency in oxygen transfer and minimizes air requirements and therefore energy demand, with the correct selection of oxygen concentration and pressure set points.
- -
- It improves process control and provides stability.
- -
- It ensures values in the WWTP outlet water below 1.5 mg/L NH4+-N and between 1 and 3 mg/L NO3−N. Ammonium and nitrate removal performance in the effluent water is considerably higher than that required by current regulations.
- -
- It guarantees energy savings of more than 20% in the aeration process of the AS system, by means of exhaustive control of the nitrification and denitrification processes and by adjusting the higher air demand to the most economical electricity rates. Results are in line with those obtained in Phase II of optimization [9].
- -
- Increased control of the aeration of the MBR system reduces the energy consumption of the plant by more than 9.3%.
- -
- It completes a methodology to optimize operating costs in wastewater treatment plants, compatible with European energy policies that promote energy savings and sustainable development through the 17 Sustainable Development Goals. It allows for the consolidation of reductions of more than 40% in the energy ratio expressed in kWh/m3.
- -
- The re-engineering of the processes carried out is based on the principles of the circular economy and represents the previous step to digitalization of the installation.
Author Contributions
Funding
Acknowledgments
Conflicts of Interest
References
- The Council of the European Communities. Council Directive of 21 May 1991 concerning urban waste-water treatment (91/271/EEC). Off. J. Eur. Communities 1991, 135, 40–52. [Google Scholar]
- Olsson, G.; Nielsen, M.; Yuan, Z.; Lynggaard-Jensen, A.; Steyer, J.-P. Instrumentation, control, and automation in wastewater systems. Water Intell. Online 2015, 4. [Google Scholar] [CrossRef]
- General Directorate of Water. II General Plan of Sanitation and Purification of the Region of Murcia 2015–2025; Ministry of Water, Agriculture and Environment: Region of Murcia, Spain, 2017. Available online: https://www.carm.es/web/pagina?IDCONTENIDO=139623&IDTIPO=60&RASTRO=c511$m4688,53146,54059 (accessed on 26 November 2019).
- Lozano, A.B.; del Cerro, F.; Llorens, M. Methodology for Energy Optimization in Wastewater Treatment Plants. Phase I: Control of the Best Operating Conditions. Sustainability 2019, 11, 3919. [Google Scholar] [CrossRef] [Green Version]
- Ferrero, G.; Rodríguez-Roda, I.; Comas, J. Automatic control systems for submerged membrane bioreactors: A state-of-the-art review. Water Res. 2012, 46, 3421–3433. [Google Scholar] [CrossRef]
- Judd, S. The MBR Book: Principles and Applications of Membrane Bioreactors for Water and Wastewater Treatment, 2nd ed.; Elsevier: Amsterdam, The Netherlands, 2011; pp. 236–330. ISBN1 9780080966823. ISBN2 9780080967677. [Google Scholar]
- Krzeminski, P.; Van Der Graaf, J.H.J.M.; Van Lier, J.B. Specific energy consumption of membrane bioreactor (MBR) for sewage treatment. Water Sci. Technol. 2012, 65, 380–392. [Google Scholar] [CrossRef]
- De la Torre García, T.; Alvarez Guerrero, A.M.; Rodríguez López, C.; Malfeito Sánchez, J.J. New control strategies to reduce energy consumption from aeration in treatment plants. Retema 2017, 199, 48–52. [Google Scholar]
- Lozano, A.B.; del Cerro, F.; Llorens, M. Methodology for Energy Optimization in Wastewater Treatment Plants. Phase II: Reduction of air requirements and redesign of the biological aeration installation. Water 2020, 12, 1143. [Google Scholar] [CrossRef]
- United Nations Organization (UNO). Transforming Our World: The 2030 Agenda for Sustainable Development; UNO: New York, NY, USA, 2015; pp. 1–41. Available online: https://sustainabledevelopment.un.org/content/documents/21252030%20Agenda%20for%20Sustainable%20Development%20web.pdf (accessed on 26 November 2019).
- Energy Strategy 2020. Available online: https://ec.europa.eu/energy/en/topics/energy-strategy-and-energyunion/2020-energy-strategy (accessed on 20 June 2019).
- Energy Strategy 2030. Available online: https://ec.europa.eu/energy/en/topics/energy-strategy-and-energyunion/2030-energy-strategy (accessed on 20 June 2019).
- Vilanova, R.; Santín, I.; Pedret, C. Control in Wastewater Treatment Plants: Current status and prospects. Rev. Iberoam. Automática Inf. Ind. 2017, 14, 329–345. [Google Scholar] [CrossRef] [Green Version]
- Manzano, J.; Poch Palou, M.; De Arespacochaga Santiago, N.; Rodríguez Gutiérrez, P.; Rouge, P.; Hurtado Melgar, I.; Aguilera Torrico, Y. Aeration control system using fuzzy logic for small WWTPs. Tecnoaqua 2017, 24, 2–7. [Google Scholar]
- Yuan, Z.; Oehmen, A.; Ingildsen, P. Control of nitrate recirculation flow in predenitrification systems. Water Sci. Technol. 2002, 45, 29–36. [Google Scholar] [CrossRef]
- Baeza, J.A.; Gabriel, D.; Lafuente, J. Effect of internal recycle on the nitrogen removal efficiency of an anaerobic/anoxic/oxic (A2/O) wastewater treatment plant (WWTP). Process. Biochem. 2004, 39, 1615–1624. [Google Scholar] [CrossRef]
- Yong, M.; Yongzhen, P.; Jeppsson, U. Dynamic evaluation of integrated control strategies for enhanced nitrogen removal in activated sludge processes. Control. Eng. Pr. 2006, 14, 1269–1278. [Google Scholar] [CrossRef]
- Liu, Y.; Shi, H.-C.; Xia, L.; Shi, H.; Shen, T.; Wang, Z.; Wang, G.; Wang, Y. Study of operational conditions of simultaneous nitrification and denitrification in a Carrousel oxidation ditch for domestic wastewater treatment. Bioresour. Technol. 2010, 101, 901–906. [Google Scholar] [CrossRef] [PubMed]
- De La Vega, P.M.; De Salazar, E.M.; Jaramillo, M.; Cros, J. New contributions to the ORP & DO time profile characterization to improve biological nutrient removal. Bioresour. Technol. 2012, 114, 160–167. [Google Scholar] [CrossRef]
- Serralta, J.; Ribes, J.; Seco, A.; Ferrer, J. A supervisory system for optimizing nitrogen removal and aeration energy consumption in wastewater treatment plants. Water Sci. Technol. 2002, 45, 309–316. [Google Scholar] [CrossRef] [PubMed]
- Ruano, M.V.; Serralta, J.; Ribes, J.; Seco, A.; Ferrer, J. Combination of cascade fuzzy controllers with a supervisory expert system for controlling aeration in WWTPs. Application to several WWTPs. In Proceedings of the 11th IWA Conference on Instrumentation Control and Automation, Narbonne, France, 18–20 September 2013. [Google Scholar]
- Castell, D.; García Ventoso, M.; Tormos Fibla, I.; Ferrer, C.; Morenilla, J.J.; Bernacer, I.; Basiero, A. Energy optimization of the aeration system of a WWTP. Comparative analysis of two technologies. Water Technol. 2011, 327, 50–56. [Google Scholar]
- Morenilla, J.J. Control Systems and Optimization of Energy Consumption in WWTP. XXV. In Course on Wastewater Treatment and Operation of Wastewater Treatment Plants; CEDEX: Madrid, Spain, 2007; Volume 3, p. 34. [Google Scholar]
- Trillo, I.; Robusté, J. Opportunities of the energy industry linked to the processing process, the selection of electromechanical equipment and strategies of the EDAR operation. In Proceedings of the IV Technical Conference on Management of Wastewater Treatment Systems, Catalan Water Agency, Barcelona, Spain, 1 September 2009. [Google Scholar]
- Ferrer, J.; Seco, A.; Serralta, J.; Ribes, J.; Manga, E.; Asensi, J.J.; Morenilla, F. Llavador Dessas: A software tool for designing, simulating and optimizing WWTPs. Environ. Model. Softw. 2008, 23, 19–26. [Google Scholar] [CrossRef]
- Tanwar, P.; Nandy, T.; Ukey, P.; Manekar, P. Correlating on-line monitoring parameters, pH, DO and ORP with nutrient removal in an intermittent cyclic process bioreactor system. Bioresour. Technol. 2008, 99, 7630–7635. [Google Scholar] [CrossRef]
- Gil, M. Dynamic model of active sludge processes. Int. J. Numer. Methods Calc. Des. Eng. 1990, 6, 387–395. [Google Scholar]
- Simón Andreu, P.; Lardín, C.; Moreno, B.; Ponsoda, J.M.; Rancaño, A. Energy optimization of sludge treatment of the WWTP of Ceutí: Part I: Selection of operating conditions. Water Technol. 2010, 322, 54–63. [Google Scholar]
- Amand, L.; Carlsson, B. Optimal aeration control in a nitrifying activated sludge process. Water Res. 2012, 46, 2101–2110. [Google Scholar] [CrossRef] [PubMed]
- Ruano, M.V.; Robles, A.; Jiménez, E.; Casao, M.; Ribes, J.; Serralta, J.; Seco, A.; Ferrer, J. Optimization of WWTPs using control systems based on pH, redox and oxygen sensors. Retema 2017, 199, 8–14. [Google Scholar]
- Cros, J.; Puigdomènech, C. Energy saving and nutrient removal in a WWTP. Tecnoaqua 2014, 7, 82–86. [Google Scholar]
- Martín Sánchez, J.M. Adaptive Predictive Expert Control System. U.S. Patent No. US 6,662,058 B1, 9 December 2003. [Google Scholar]
- Amand, L.; Olsson, G.; Carlsson, B. Aeration control—A review. Water Sci. Technol. 2013, 67, 2374–2398. [Google Scholar] [CrossRef] [PubMed] [Green Version]
- Clarke, D.W. Advances in Model Based Predictive Control; Oxford University Press: Oxford, UK, 1994. [Google Scholar]
- Ekman, M.; Björlenius, B.; Andersson, M. Control of the aeration volume in an activated sludge process using supervisory control strategies. Water Res. 2006, 40, 1668–1676. [Google Scholar] [CrossRef] [PubMed]
- Benedetti, L.; De Baets, B.; Nopens, I.; Vanrolleghem, P. Multi-criteria analysis of wastewater treatment plant design and control scenarios under uncertainty. Environ. Model. Softw. 2010, 25, 616–621. [Google Scholar] [CrossRef]
- Krause, K.; Böcker, K.; Londong, J. Simulation of a nitrification control concept considering influent ammonium load. Water Sci. Technol. 2002, 45, 413–420. [Google Scholar] [CrossRef] [PubMed]
- Steffens, M.; Lant, P. Multivariable control of nutrient-removing activated sludge systems. Water Res. 1999, 33, 2864–2878. [Google Scholar] [CrossRef]
- Vrečko, D.; Hvala, N.; Stare, A.; Burica, O.; Stražar, M.; Levstek, M.; Cerar, P.; Podbevšek, S.; Ko, D.V.; Ar, M.S.; et al. Improvement of ammonia removal in activated sludge process with feedforward-feedback aeration controllers. Water Sci. Technol. 2006, 53, 125–132. [Google Scholar] [CrossRef]
- Bracken, B.; Flanagan, M. Design recommendations for automatic dissolved oxygen control. Prog. Wat. Tech. 1977, 9, 551–555. [Google Scholar]
- Rundquist, L. Experiences of Self-Tuning Control of an Activated Sludge Process. IFAC Proc. Vol. 1988, 21, 177–182. [Google Scholar] [CrossRef] [Green Version]
- Lindberg, C.-F.; Carlsson, B. Nonlinear and set-point control of the dissolved oxygen concentration in an activated sludge process. Water Sci. Technol. 1996, 34, 135–142. [Google Scholar] [CrossRef]
- Henkel, J.; Cornel, P.; Wagner, M. Oxygen transfer in activated sludge—New insights and potentials for cost saving. Water Sci. Technol. 2011, 63, 3034–3038. [Google Scholar] [CrossRef] [PubMed]
- Henkel, J.; Cornel, P.; Wagner, M. Free water content and sludge retention time: Impact on oxygen transfer in activated sludge. Environ. Sci. Technol. 2009, 43, 8561–8565. [Google Scholar] [CrossRef] [PubMed]
- Fan, H.; Qi, L.; Liu, G.-h.; Zhang, Y.; Chen, X.; Wang, H. Aeration optimization throg operation at low dissolved oxygen concentrations: Evaluation of oxygen mass transfer dynamics in different activated sludge systems. Water Environ. J. 2017, 55, 224–235. [Google Scholar]
- Simón Andreu, P.; Lardín Mifsut, C.; del Cacho Sanz, C.; García Yuste, M. Oxygen transfer: Rapid assessment of the efficiency of aeration systems. Water Technol. 2015, 15, 92–101. [Google Scholar]
- Rosso, D.; Stenstrom, M.K. Surfactant effects on α-factors in aeration systems. Water Res. 2006, 40, 1397–1404. [Google Scholar] [CrossRef]
- Germain, E.; Nelles, F.; Drews, A.; Pearce, P.; Kraume, M.; Reid, E.; Judd, S.; Stephenson, T. Biomass effects on oxygen transfer in membrane bioreactors. Water Res. 2007, 41, 1038–1044. [Google Scholar] [CrossRef] [Green Version]
- Henkel, J.; Lemac, M.; Wagner, M.; Cornel, P. Oxygen transfer in membrane bioreactors treating synthetic greywater. Water Res. 2009, 43, 1711–1719. [Google Scholar] [CrossRef]
- Cornel, P.; Wagner, M.; Krause, S. Investigation of oxygen transfer rates in full scale membrane bioreactors. Water Sci. Technol. 2003, 47, 313–319. [Google Scholar] [CrossRef]
- Martín Sanchez, J.M.; Rodellar, J. Adaptive Predictive Control: From the Concepts to Plant Optimization (Prentice-Hall International Series in Systems and Control Engineering); Prentice Hall: Upper Saddle River, NJ, USA, 1995; ISBN1 0135148618. ISBN2 978-0135148617. [Google Scholar]
- Rancaño, A. Energy optimization of sludge treatment at Ceutí WWTP: Aeration control by means of an adaptive predictive expert control system (ADEX). In Proceedings of the V Technical Conference on Sanitation and Purification, Murcia, Spain, 25–26 November 2009; p. 1. Available online: http://www.esamur.com/historico (accessed on 20 July 2019).
- Simón Andreu, P.; Lardín, C.; Moreno, B.; Ponsoda, J.M.; Beldarían, A.; Rancaño, A. Energy optimization of sludge treatment of the WWTP of Ceutí: Part II: Selection of the control strategy and results. Water Technol. 2010, 323, 48–60. [Google Scholar]
- Lozano, A.B.; Del Cerro, F. Energy Optimization on the Aeration of Aerobic Bioreactors: Analysis of the Biological Process, Equipment Resizing, and Implementation of a Real-Time Control System Based on the Ammonium/Nitrate Measurement (AN-ISE); Final Degree Work; Department of Chemical Engineering, University of Murcia: Murcia, Spain, 2014. [Google Scholar]
- Manesis, S.; Sapidis, D.; King, R. Intelligent control of wastewater treatment plants. Artif. Intell. Eng. 1998, 12, 275–281. [Google Scholar] [CrossRef]
- Guerrero, J.; Guisasola, A.; Vilanova, R.; Baeza, J.A. Improving the performance of a WWTP control system by model-based setpoint optimization. Environ. Model. Softw. 2011, 26, 492–497. [Google Scholar] [CrossRef]
- Turon, C.; Giró, J.; Ripoll, F.; Clara, P.; Freixó, A. Advanced and intelligent control for energy saving in the biological elimination of nutrients. Chem. Eng. 2011, 490, 90–95. [Google Scholar]


© 2020 by the authors. Licensee MDPI, Basel, Switzerland. This article is an open access article distributed under the terms and conditions of the Creative Commons Attribution (CC BY) license (http://creativecommons.org/licenses/by/4.0/).
Share and Cite
Lozano Avilés, A.B.; Del Cerro Velázquez, F.; Lloréns Pascual del Riquelme, M. Methodology for Energy Optimization in Wastewater Treatment Plants. Phase III: Implementation of an Integral Control System for the Aeration Stage in the Biological Process of Activated Sludge and the Membrane Biological Reactor. Sensors 2020, 20, 4342. https://doi.org/10.3390/s20154342
Lozano Avilés AB, Del Cerro Velázquez F, Lloréns Pascual del Riquelme M. Methodology for Energy Optimization in Wastewater Treatment Plants. Phase III: Implementation of an Integral Control System for the Aeration Stage in the Biological Process of Activated Sludge and the Membrane Biological Reactor. Sensors. 2020; 20(15):4342. https://doi.org/10.3390/s20154342
Chicago/Turabian StyleLozano Avilés, Ana Belén, Francisco Del Cerro Velázquez, and Mercedes Lloréns Pascual del Riquelme. 2020. "Methodology for Energy Optimization in Wastewater Treatment Plants. Phase III: Implementation of an Integral Control System for the Aeration Stage in the Biological Process of Activated Sludge and the Membrane Biological Reactor" Sensors 20, no. 15: 4342. https://doi.org/10.3390/s20154342
APA StyleLozano Avilés, A. B., Del Cerro Velázquez, F., & Lloréns Pascual del Riquelme, M. (2020). Methodology for Energy Optimization in Wastewater Treatment Plants. Phase III: Implementation of an Integral Control System for the Aeration Stage in the Biological Process of Activated Sludge and the Membrane Biological Reactor. Sensors, 20(15), 4342. https://doi.org/10.3390/s20154342