Article

3D Microfluidic Devices in a Single Piece of Paper for the Simultaneous Determination of Nitrite and Thiocyanate

School of Materials Science and Engineering, Xiangtan University, Xiangtan 411105, China
*
Author to whom correspondence should be addressed.
Sensors 2020, 20(15), 4118; https://doi.org/10.3390/s20154118
Submission received: 29 June 2020 / Revised: 18 July 2020 / Accepted: 22 July 2020 / Published: 24 July 2020
(This article belongs to the Special Issue Microfluidics for Biosensing Applications)

Abstract

:
The concentrations of nitrite and thiocyanate in saliva can be used as the biomarkers of the progression of periodontitis disease and environmental tobacco smoke exposure, respectively. Therefore, it is particularly necessary to detect these two indicators in saliva. Herein, the three-dimensional single-layered paper-based microfluidic analytical devices (3D sl-μPADs) were, for the first time, fabricated by the spraying technique for the colorimetric detection of nitrite and thiocyanate at the same time. The conditions for 3D sl-μPADs fabrication were optimized in order to well control the penetration depth of the lacquer in a paper substrate. Then, the developed 3D sl-μPADs were utilized to simultaneously detect nitrite and thiocyanate and the limits of detection are 0.0096 and 0.074 mM, respectively. What is more, the μPADs exhibited good specificity, good repeatability, and acceptable recoveries in artificial saliva. Therefore, the developed 3D sl-μPADs show a great potential to determine nitrite and thiocyanate for the assessment of the human health.

1. Introduction

Nitrite (NO2) widely exists in the environment, food, industry, and physiological systems, which is recognized as a hazardous species [1,2]. Although nitrite intake from food plays an important role in human physiology [3], high amount intake of nitrite is extremely harmful for human health and induces severe health issues [4,5]. Moreover, the nitrate in food can be reduced to nitrite by oral microorganisms [6]. Thiocyanate (SCN) is a substance in nature, which is widely found in the tissues and the secretion of the animals [7]. It is also an important chemical raw material in a lot of industrial sectors, including printing, electroplating, pharmaceutical production, and photofinishing [8]. Furthermore, thiocyanate is a metabolite of hydrogen cyanide found in cigarette smoke [9]. A higher concentration of thiocyanate in physiological fluids can bind to trivalent iron ion in cytochrome oxidase in vivo, inhibiting the enzyme activity and causing hypoxia in human tissue and even obvious damage to renal function. [10]. Both of the two anions (i.e., nitrite and thiocyanate) are normally present in saliva, which are the useful biomarkers for periodontitis disease and tobacco smoke exposure, respectively [11,12]. More importantly, people who often smoke are prone to suffering from oral diseases [13]. Therefore, it is of great importance to simultaneously determine nitrite and thiocyanate in saliva, especially for heavy smokers.
Up to now, many assay techniques have been reported for simultaneously detecting nitrite and thiocyanate, such as capillary electrophoresis [14,15,16], ion chromatography [17,18], isotachophoresis [19], capillary chromatography [20], gas chromatography [21,22], and high-performance liquid chromatography [23]. The above-mentioned techniques are sophisticated with a high sensitivity. However, the limitations for their routine application include poor portability, the high cost, the requirement of large reagent and sample volumes, and cumbersome sample treatment.
Alternatively, point-of-care testing (POCT) has been attracted great interest from researchers, allowing for in-home determinations with the absence of the healthcare professionals [24]. Paper-based microfluidic analytical devices (μPADs) combined with colorimetry make POCT practical in daily life [25]. μPADs possess tremendous advantages including fast detection, low consumption of reagent, good portability, and easy usage [26]. Bhakta et al. quantitatively detected the concentration of nitrite in saliva in a non-invasive way to demonstrate the application value of the μPADs [11]. Pena-Pereira et al. developed the cost-effective μPADs to determine thiocyanate in saliva with low detection limit of 0.06 mM [27]. All the μPADs reported for the detection of nitrite or thiocyanate were all based on two-dimensional (2D) μPADs.
In recent years, three-dimensional (3D) μPADs, especially single-layered configurations, have become a growing research field in μPADs. Compared to the 2D configuration, the fluid in 3D channels can flow in both lateral and vertical directions, making it possible to manipulate complex fluid flow and design complicated chips [28]. Most of the time, 3D μPADs are fabricated by the assemblly of multilayers [29]. The fabrication process is tedious and requires precise stacking and alignment of multiple sheets of paper to construct 3D channels, which hinders the large-scale development of 3D μPADs. To avoid the alignment of paper/tape layers, 3D folding μPADs have been developed and a clamping holder was utilized to firmly fix the multi-layered devices [30]. However, the huge challenges in 3D μPADs manufacturing still exist in mass production in particular. To simplify the fabrication process, 3D single-layered μPADs (3D sl-μPADs) have been reported. Geun Jeong et al. fabricated 3D sl-μPADs by wax printing on double sides and heating the printed patterns by a laminator [31]. Li et al. prepared three-dimensional microfluidic channels by a wax printer in a piece of filter paper [28]. Unquestionably, these studies have made a significant breakthrough in 3D sl-μPADs fabrication. However, they defined the channels with wax, which cannot support the solutions such as surfactants and organic solvents [32]. Therefore, there is still an urgent need to search for a new technology for manufacturing 3D sl-μPADs with high chemical resistance. Furthermore, there have been no reports using the 3D μPADs for the simultaneous detection of nitrite and thiocyanate in saliva so far.
Spraying-based technology has been developed for the fabrication 2D μPADs in recent years. With a comparison to the conventional fabrication techniques, a spraying process displaced the printing process to fabricate 2D μPADs, attracting wide interest of researchers. Nurak et al. constructed 2D μPADs to detect nickel (II) ion by a spray-painting method. The analytical performance of Ni2+ assay is very good, and the limit of detection is as low as 8.5 μM [33]. Cardoso et al. fabricated 2D μPADs by the glue-spraying technique. The developed 2D μPADs were highly resistant to chemicals and successfully applied to the colorimetric assays of eight analytes [32]. Our group used the spraying method to deposit patterned adhesive tape in a piece of filter paper to fabricate 2D channels. The developed 2D μPADs provided a simple and cost-effective platform for bioassays [34]. Although these studies have had great breakthroughs in applying the spraying technique to the manufacture of 2D μPADs, there are only a few studies to report the spraying method for fabricating 3D μPADs. Phillips group used the wax-printing technique to make patterned paper and used the glue-spraying method for layers alignment [35]. Their work greatly simplified the assembly steps but still used the wax printer to pattern paper. More importantly, their work was focused on the multi-layered 3D μPADs fabrication. Therefore, there is still a great challenge to apply the spraying method to construct 3D channels in a single piece of filter paper.
In this work, a spraying patterning approach is presented for the fabrication of 3D sl-μPADs relying on double-sided spraying of lacquer. Two important parameters for the fabrication process were optimized: (1) spraying times (the times needed for pressing the spray nozzle), and (2) drying conditions including temperature and time. Under the optimized fabrication conditions, 3D channels were formed in a single piece of paper. The applicability of the fabricated 3D sl-μPADs was demonstrated by simultaneously detecting nitrite and thiocyanate. The results show satisfactory sensitivity, good specificity, good repeatability, and acceptable recoveries in artificial saliva toward nitrite and thiocyanate detection.

2. Experimental

2.1. Reagents and Instruments

The qualitative filter paper (102#) with medium speed was bought from Hangzhou Fuyang Wood Paper Co., Ltd. (Hangzhou, China) and used for 3D sl-μPADs fabrication. The porosity of the filter paper was 15–20 μm and the ash content of the filter paper was less than 0.15%. The thickness of the filter paper was measured to be 170 μm using a digital vernier caliper. The lacquer (400 mL/can, yellow color) was purchased from Guangdong Haoshun ODIS Technology Co., Ltd. (Zhaoqing, China). The principal component of the lacquer is resin and the lacquer has the advantages of high water resistance and good adhesion. The spraying area is 2.5 m2 per can of lacquer. The desired mask was designed using Auto CAD software and cut out from transparent polymethyl methacrylate (PMMA) board with 1 mm in thickness by a local laser cutting shop in China. Black paper binder clips (size 19 mm) were purchased from Deli Co., Ltd. (Ninghai, China) and used to fix the desired mask on the filter paper. Sodium nitrite, potassium thiocyanate, sulphanilamide, N-(1-naphthyl) ethylenediamine dihydrochloride (NED), ferric nitrate nonahydrate, citric acid monohydrate, boric acid, sodium hydroxide, glacial acetic acid, phosphoric acid, sodium carboxymethylcellulose (SCMC) were of analytical grade and purchased from Sinopharm Chemical Reagent Co., Ltd. (Shanghai, China). Poly (acrylic acid) (M.W. ≈3000) was bought from Aladdin-Reagent Company (Shanghai, China). Ultrapure water with electric resistivity of 18.2 MΩ cm was used throughout. The digital photos of the developed assays were taken by a smartphone (MI 8 SE, Beijing Xiaomi Technologies Co., Ltd., Beijing, China) in a foldable photo box. The photo box is equipped with 84 LED lamps and lampshade with the size of 40 × 40 × 40 cm. The distance between the phone and the fabricated 3D sl-μPADs was 8 cm. The digital Red (R), Green (G), and Blue (B) color analysis was done by ImageJ software provided by National Institute of Health (Bethesda, MD, USA).

2.2. Solution Preparation

The NO2 and SCN standard stock solutions were made by the dissolvement of NaNO2 and KSCN in ultrapure water, respectively. The Griess reagent for NO2 detection was made up of 330 mM citric acid, 50 mM sulfanilamide, and 10 mM NED. The Fe (III) reagent solution (600 mM) for SCN assay was made by the dissolvement of ferric nitrate in Britton–Robinson buffer (pH 7). For the recovery test, the artificial saliva was used as the complex sample, consisting of the following in ultrapure water: NaCl 0.4 g/L; KCl 0.4 g/L; CaCl2·2H2O 0.8 g/L; NaH2PO4 0.69 g/L; Na2S·9H2O 0.05 g/L; SCMC 0.1 g/L [36,37].

2.3. 3D sl-μPADs Fabricated by a Two-Step Spraying Technique

The spraying prototyping process for fabricating the 3D sl-μPADs was illustrated and shown in Figure 1. A sheet of filter paper was sandwiched between two PMMA boards with the same design (Figure 1a). To fix the relative position between the filter paper and the PMMA boards, the four corners of the PMMA boards were held with four binder clips (Figure 1b). In the first step of the spraying process, the distance between the spray nozzle of the lacquer and the device is set as 20 cm. Then, the spray nozzle of the lacquer was pressed for two times for each side of the filter paper (Figure 1c). After 10 min at room temperature (RT) (Figure 1d), the chip was sandwiched between another two PMMA boards with different designs (Figure 1e). In the second step, the spray nozzle of the lacquer on the top surface is farther from the chip (25 cm) while on the bottom surface the distance between the spray nozzle and the chip is 20 cm (Figure 1g). The spray nozzle of the lacquer was also pressed for two times for each side of the chip. Afterwards, the chip deposited with lacquer was put in a drying chest at 100 °C for 2 h. Finally, excess materials were trimmed (Figure 1h) and the the finished layout of the 3D sl-μPADs were provided (Figure 1i).

2.4. Simultaneous Colorimetric Detection of Nitrite and Thiocyanate

The detection principles for nitrite and thiocyanate assays are based on the classical Griess diazo-coupling reaction and the coordination reaction between Fe (III) and thiocyanate, respectively [38,39,40]. Both the two reactions are fast and highly selective. At first, the μPAD was prepared by first adding 1.8 μL of poly (acrylic acid) with a concentration of 0.7 g/L to all the assay reservoirs, waiting for 10 min for drying at RT. After that, 1.8 μL of Griess reagent solution was pipetted to the left detection reservoir while 1.8 μL of the Fe (III) reagent solution was pipetted to the right detection reservoir. Both the reagents were dried at RT for 10 min to form the final sensor. The simultaneous detection of both NO2 and SCN was performed. The detection reservoirs on the left were used for nitrite assay and the detection reservoirs on the right for thiocyanate detection. A total of 18 µL of the standard containing two anions was pipetted into the central reservoir for introducing the sample. After a 15-min waiting period, the image of the device was collected with a phone camera in the professional photography box. The color intensities in the RGB mode were measured by the free software, ImageJ. The whole area of the assay zone was selected, and the mean color value was calculated.

2.5. Recovery Test

For the recovery test, the fabrication process of the 3D sl-μPADs was the same as the experimental steps referred to before. The artificial saliva sample was used as the complex sample to detect the recoveries. The addition of SCMC in the artificial saliva was used to mimic human saliva viscosity [41]. The complex sample (18 μL) was spiked with known concentrations of both analytes and was pipetted into the central reservoir afterwards. After waiting for 15 min, the picture of the 3D sl-μPADs was taken by a phone. The color values in the assay zones were measured by the free image processing software.

3. Results and Discussion

3.1. Conditions Optimization for Spraying Prototyping Process

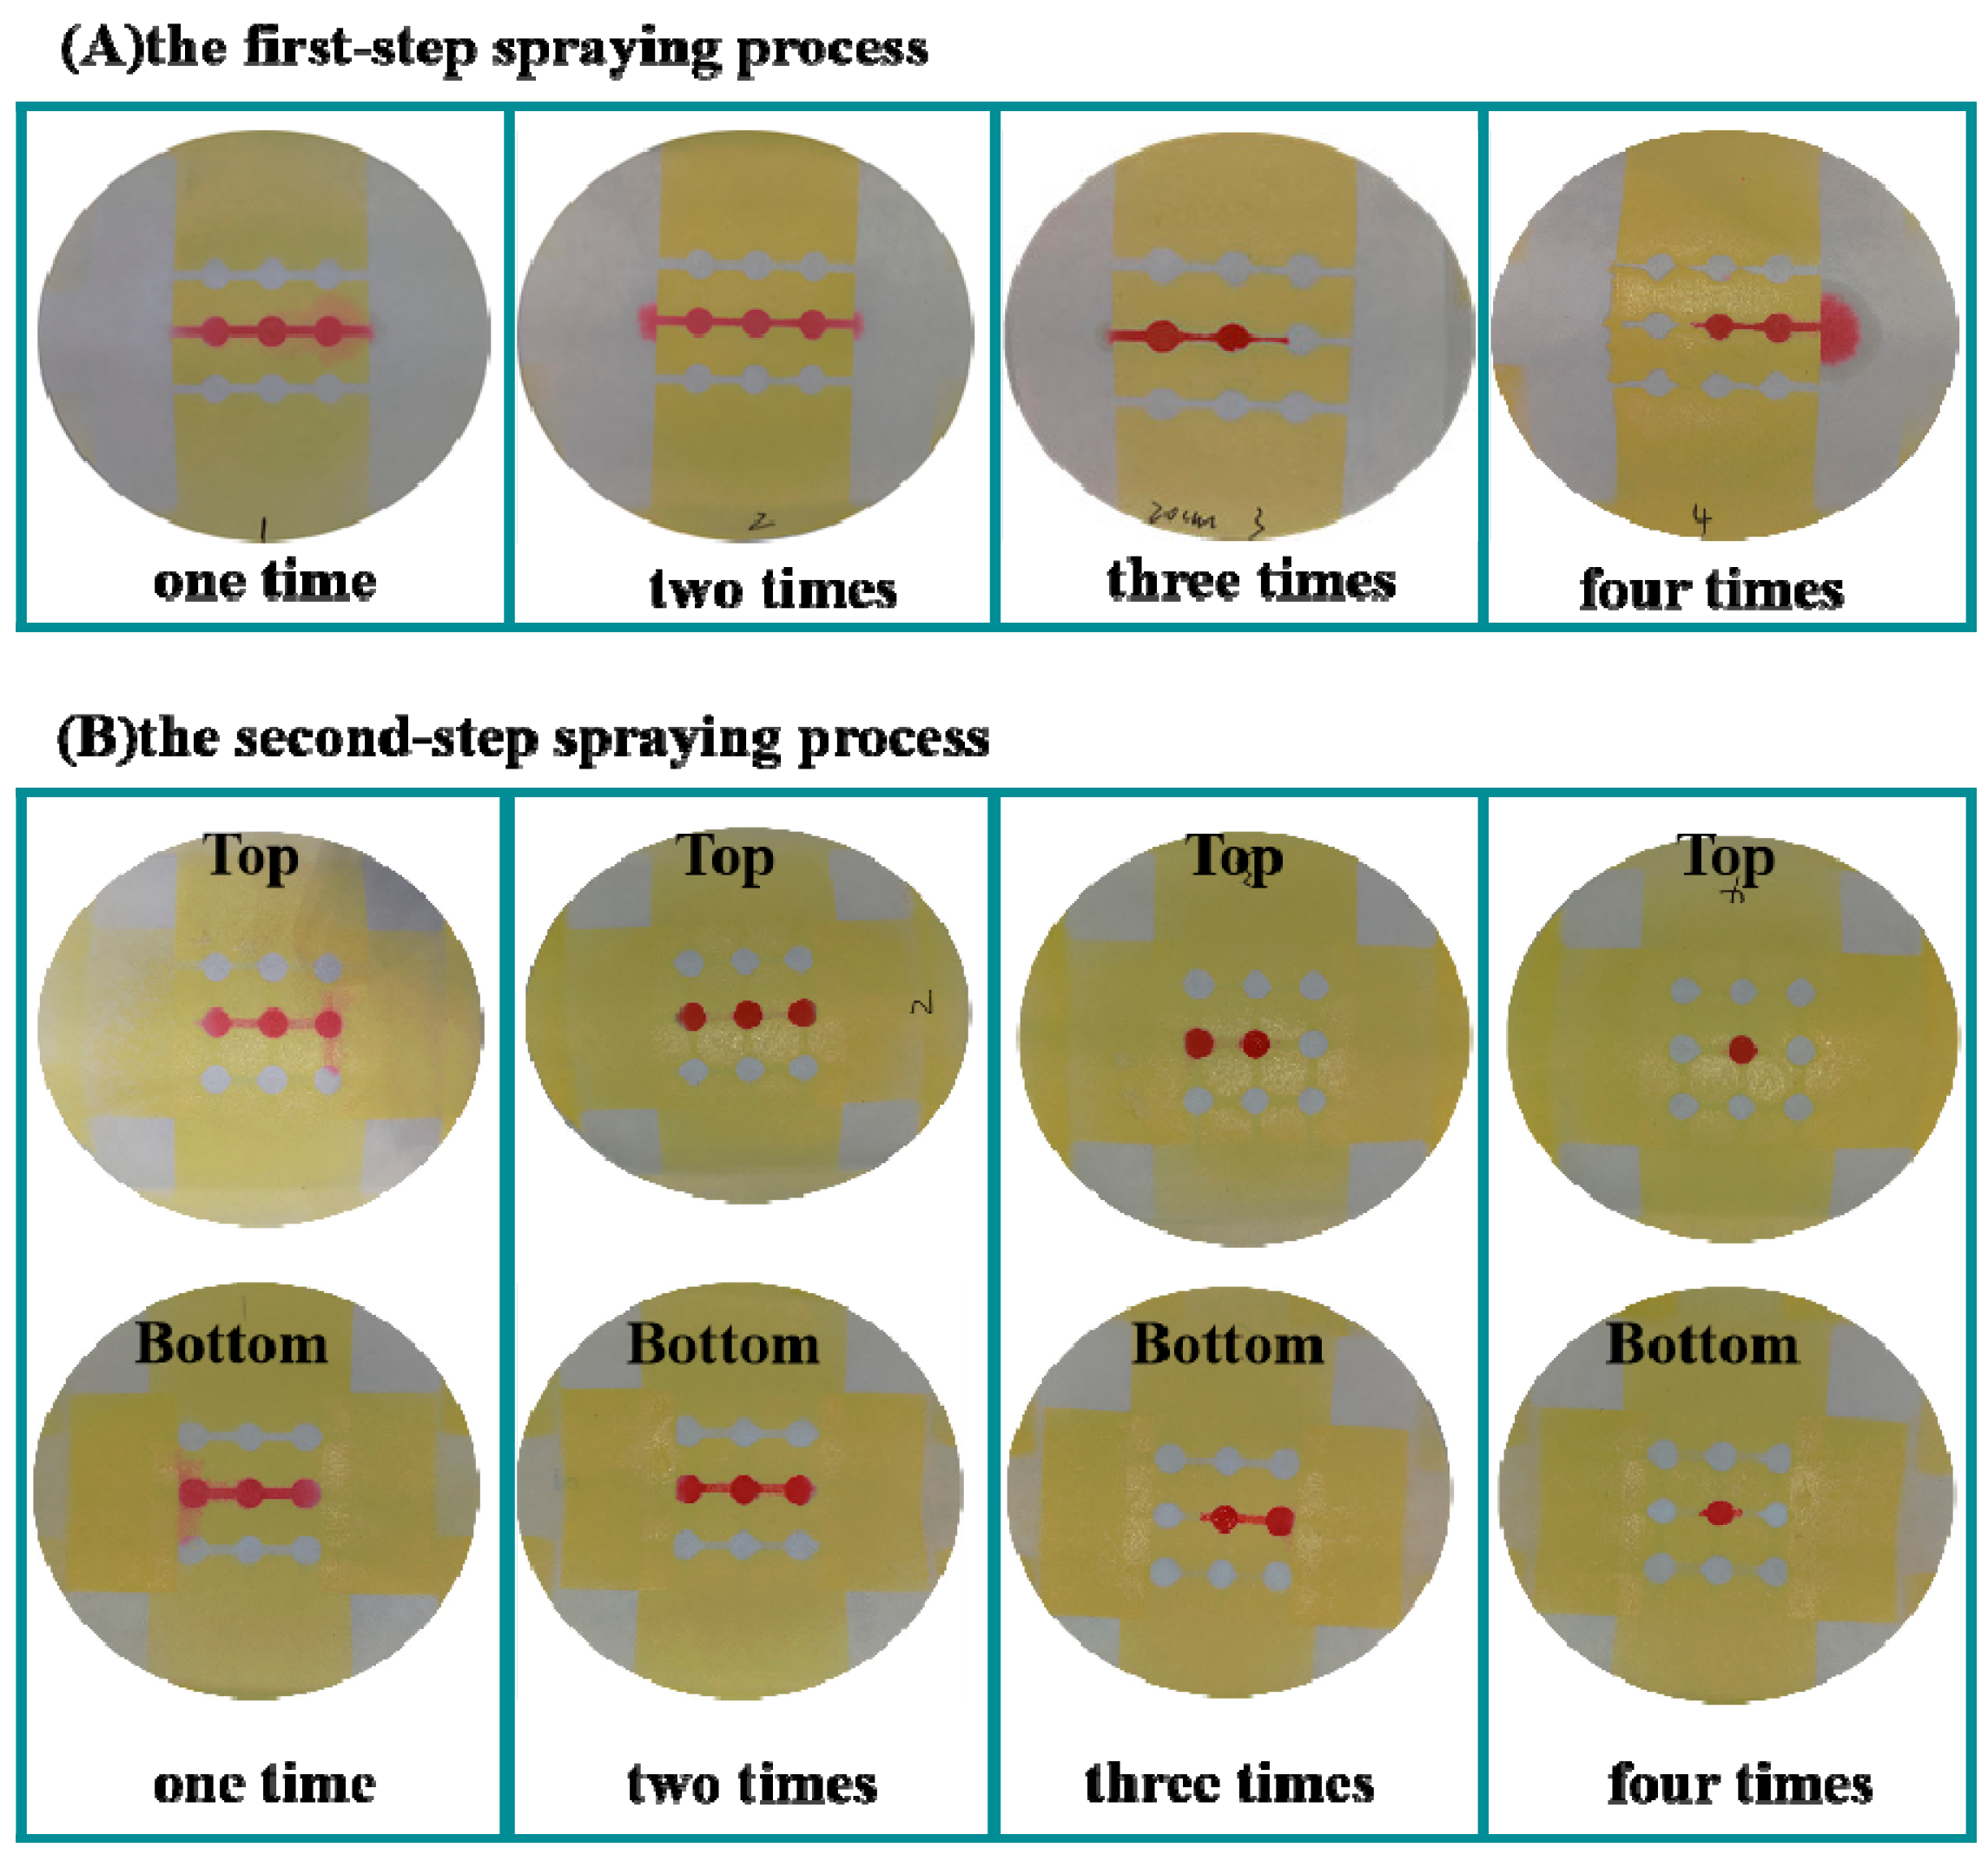
Spraying technique is effective at penetrating the lacquer vertically through the cellulose pore spaces and thereby forming a hydrophobic barrier [33]. Limited and controlled lacquer deposition is extremely important for the fabrication of the 3D sl-μPADs by the spraying prototyping process. To fabricate different patterns on each side of the filter paper, it is necessary to optimize the times for pressing the spray nozzle of the lacquer. For the optimization of pressing times, the developed devices were left at RT for 24 h and the food dye with red color (18 µL) was then added to the central reservoir of the devices. In the first step spraying lacquer, the spray nozzle was pressed different numbers of times. It is noted from Figure 2A that the hydrophobic barrier was not successfully formed after pressing the spray nozzle once. Pressing three and four times results in the excess deposition of lacquer in the filter paper, resulting in narrowing or blocking the hydrophilic channels. Therefore, two times was chosen as the optimized number of times to press the nozzle to ensure the lacquer fully penetrates into the whole depth of the filter paper. In the second step of the spraying process, when the nozzle was pressed two times, the hydrophobic barriers were successfully formed on both the top and bottom sides of the device as shown in Figure 2B. Therefore, two times was chosen for the optimized number of times for the second spraying process. Under the optimized times for pressing the nozzle, the drying temperature and time were also optimized. Several temperatures (RT, 30, 60, 80, and 100 °C) and drying times (1 h, 2 h) were chosen for performing the experiment. The results are shown in Figure 3. It is noted that the lacquer could not be fully dried at low temperature or without enough drying time, resulting in the failure of the desired hydrophobic barrier formation. The optimized drying condition is 100 °C for 2 h, under which the clear hydrophobic boundary was obtained.

3.2. Characterization of the 3D sl-μPADs

In this work, the 3D sl-μPADs were generated by the spraying prototyping process. To investigate the penetration degree of the lacquer at different regions, the solution containing red food dye (18 µL) was added to the central well of the developed device. Then the solution filtered through the paper, traveled through the filter paper along the channel route, and reached the side wells. Then the fabricated 3D sl-µPADs were cut along the black dotted line after they were fully dried as shown in Figure 4 and the intersection was observed by an optical microscope. It is clearly seen that the paper in spot ‘A’ was un-patterned and the whole depth in spot ‘A’ was hydrophilic. In spot ‘B’, the depth of the yellow lacquer occupied about two-thirds of the whole depth of the device. Therefore, the top side in spot ‘B’ was hydrophobic while the bottom side in spot ‘B’ was hydrophilic. In spot ‘C’, the totally hydrophilic channel and the totally hydrophobic channel were converged together. In addition, the boundary between hydrophobic area and hydrophilic area was very clear. Therefore, it is practicable to control lacquer deposition by optimizing the spraying times and drying conditions.
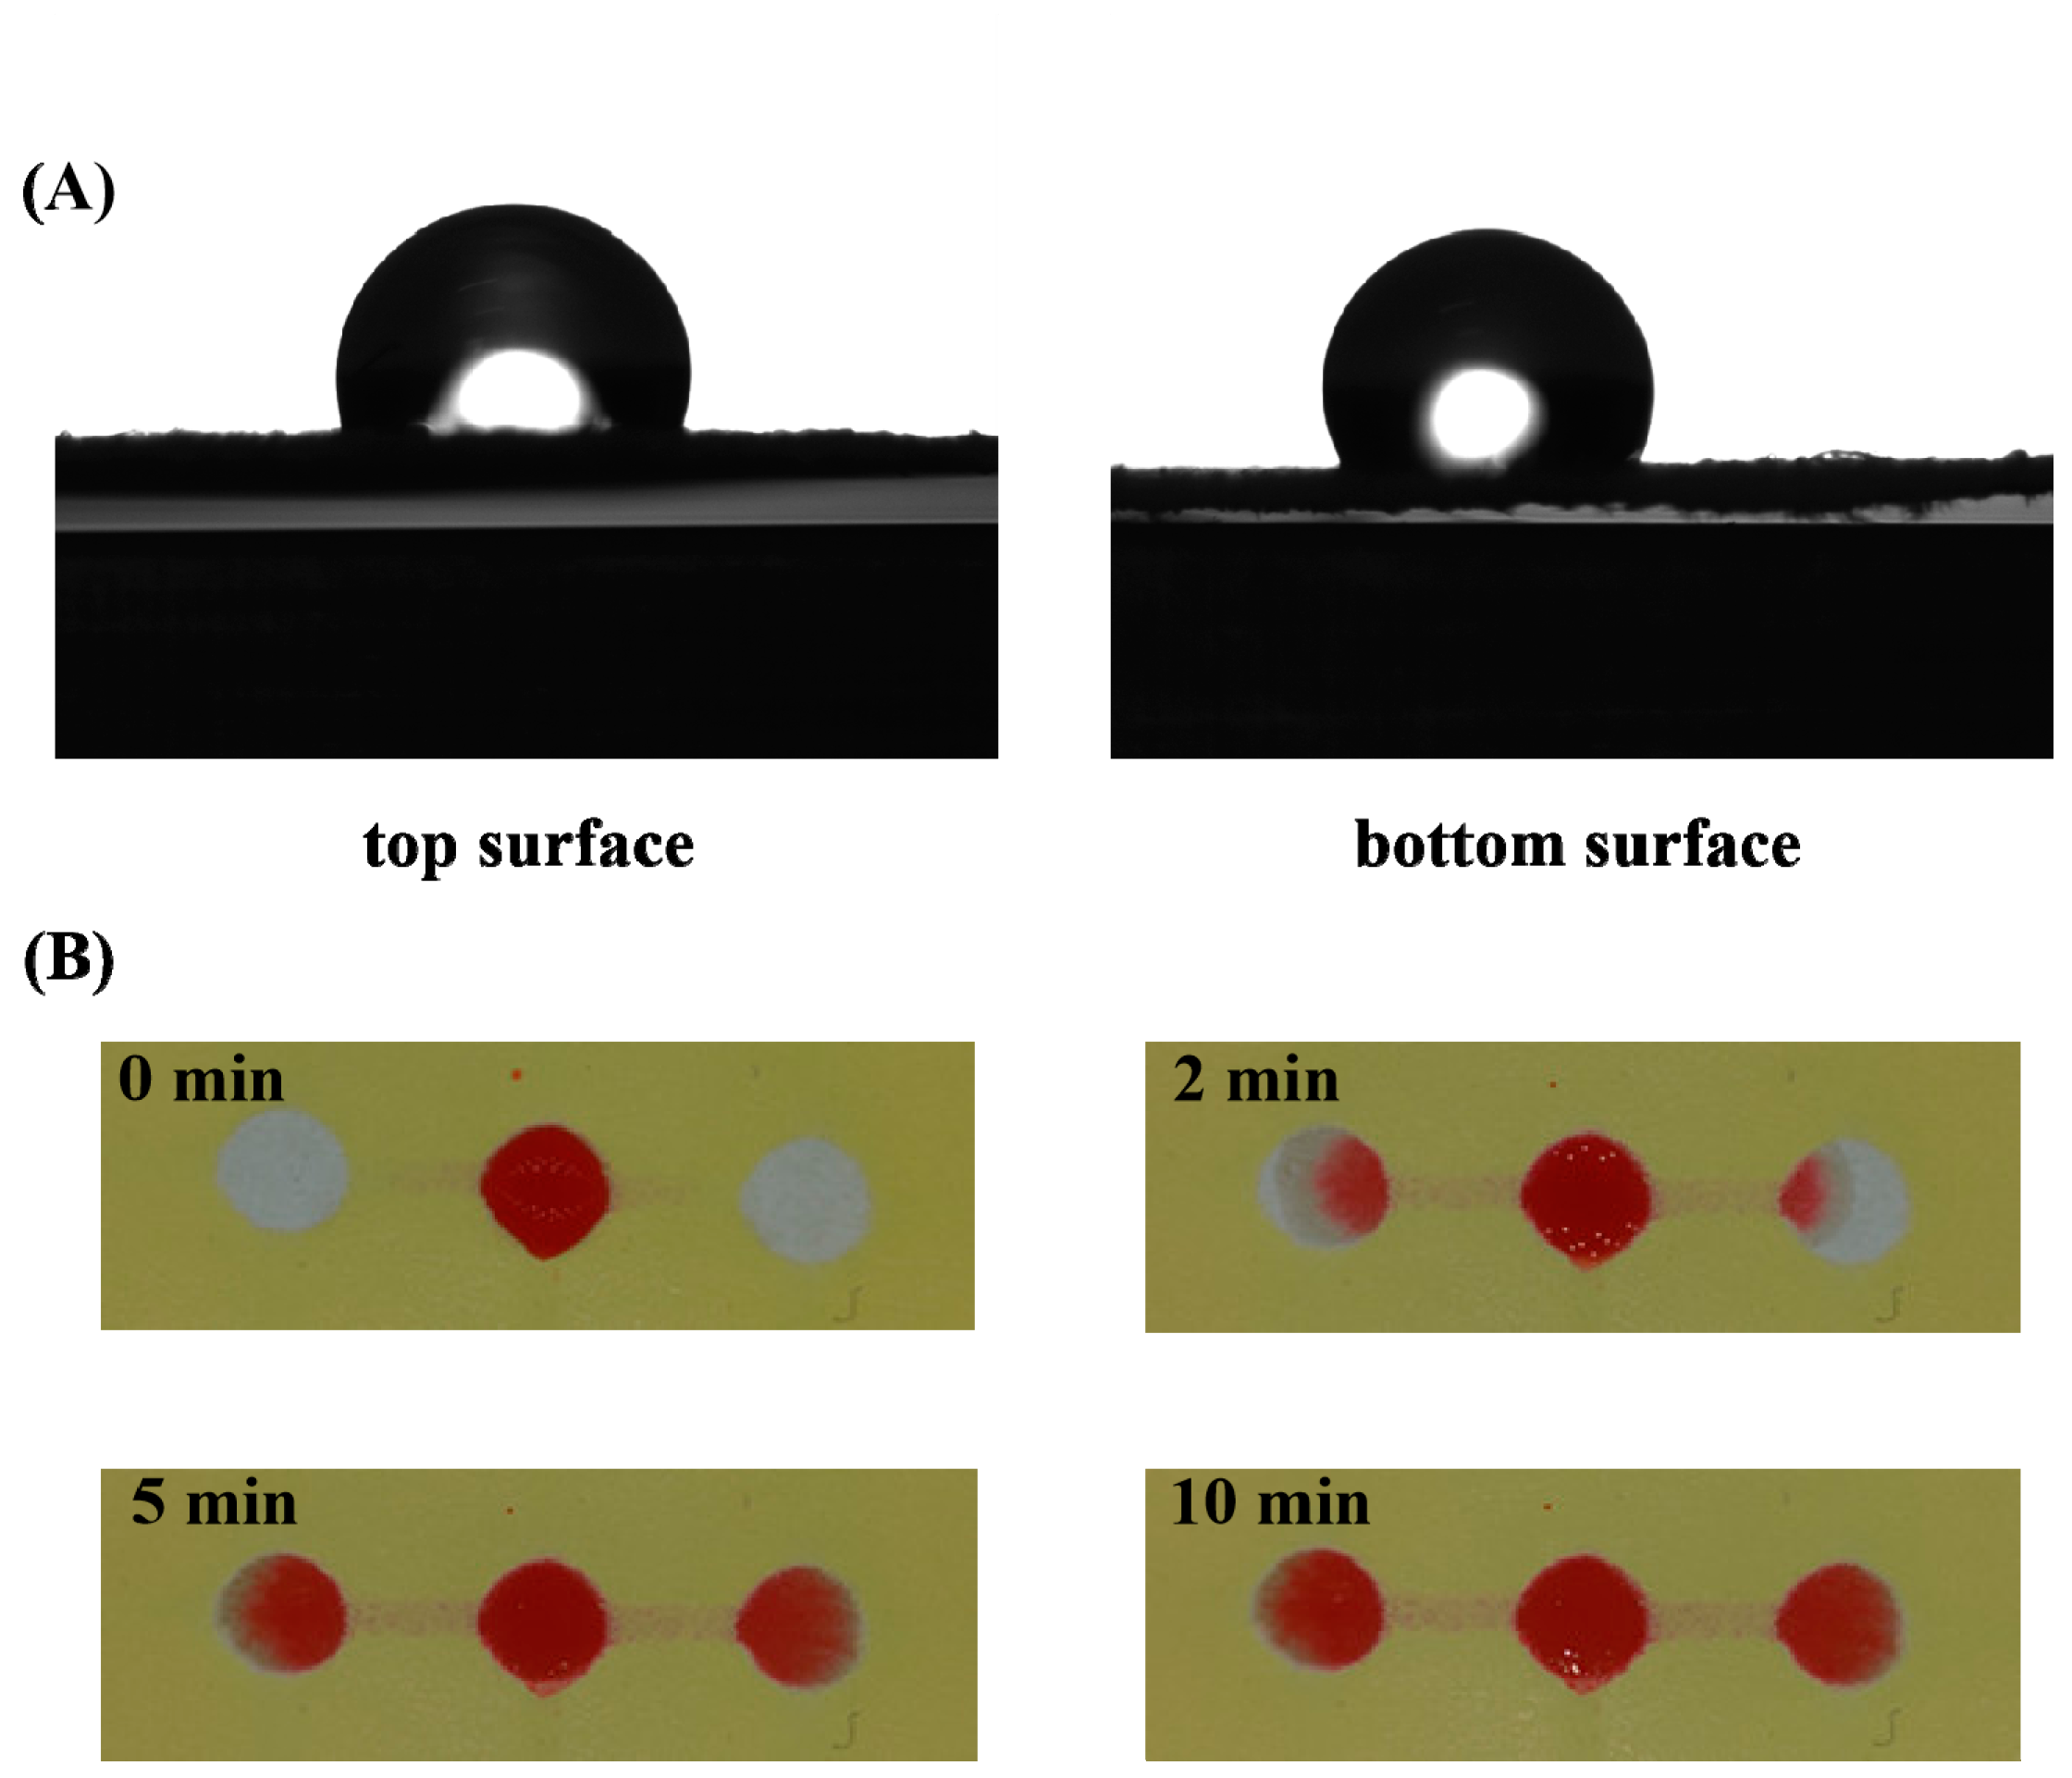
Furthermore, the wettability behavior of the 3D sl-µPADs was studied. The photographs of water droplet (4 µL) on both sides of the 3D sl-µPADs are shown in Figure 5A. The contact angles with water were 112.77 ± 3.66° for the top surface and 116.21 ± 0.55° for the bottom surface, respectively. The result indicates that the hydrophobic barriers were successfully constructed on both sides of the device by the spraying prototyping process. To demonstrate how the fluid flows in the channel, the food dye with red color (18 µL) was added to the central reservoir on the top surface of the 3D sl-µPADs. The pictures of the 3D sl-µPADs were selected at different time as shown in Figure 5B. The food dye flew through the channel on the bottom surface and then was seen in the left and right detection zones, indicating the successful construction of different patterns on different sides of a single filter paper. The time needed for the fluid flowing from sample introduction zone to both detection zones was 5 min. In addition, the materials cost US $0.0728 per 3D sl-µPAD. It is much lower than the costs of the 3D uPADs fabricated by other groups [42,43,44]. All these results indicate that the spraying method for fabricating 3D sl-μPADs could be an alternative to traditional techniques such as wax printing.
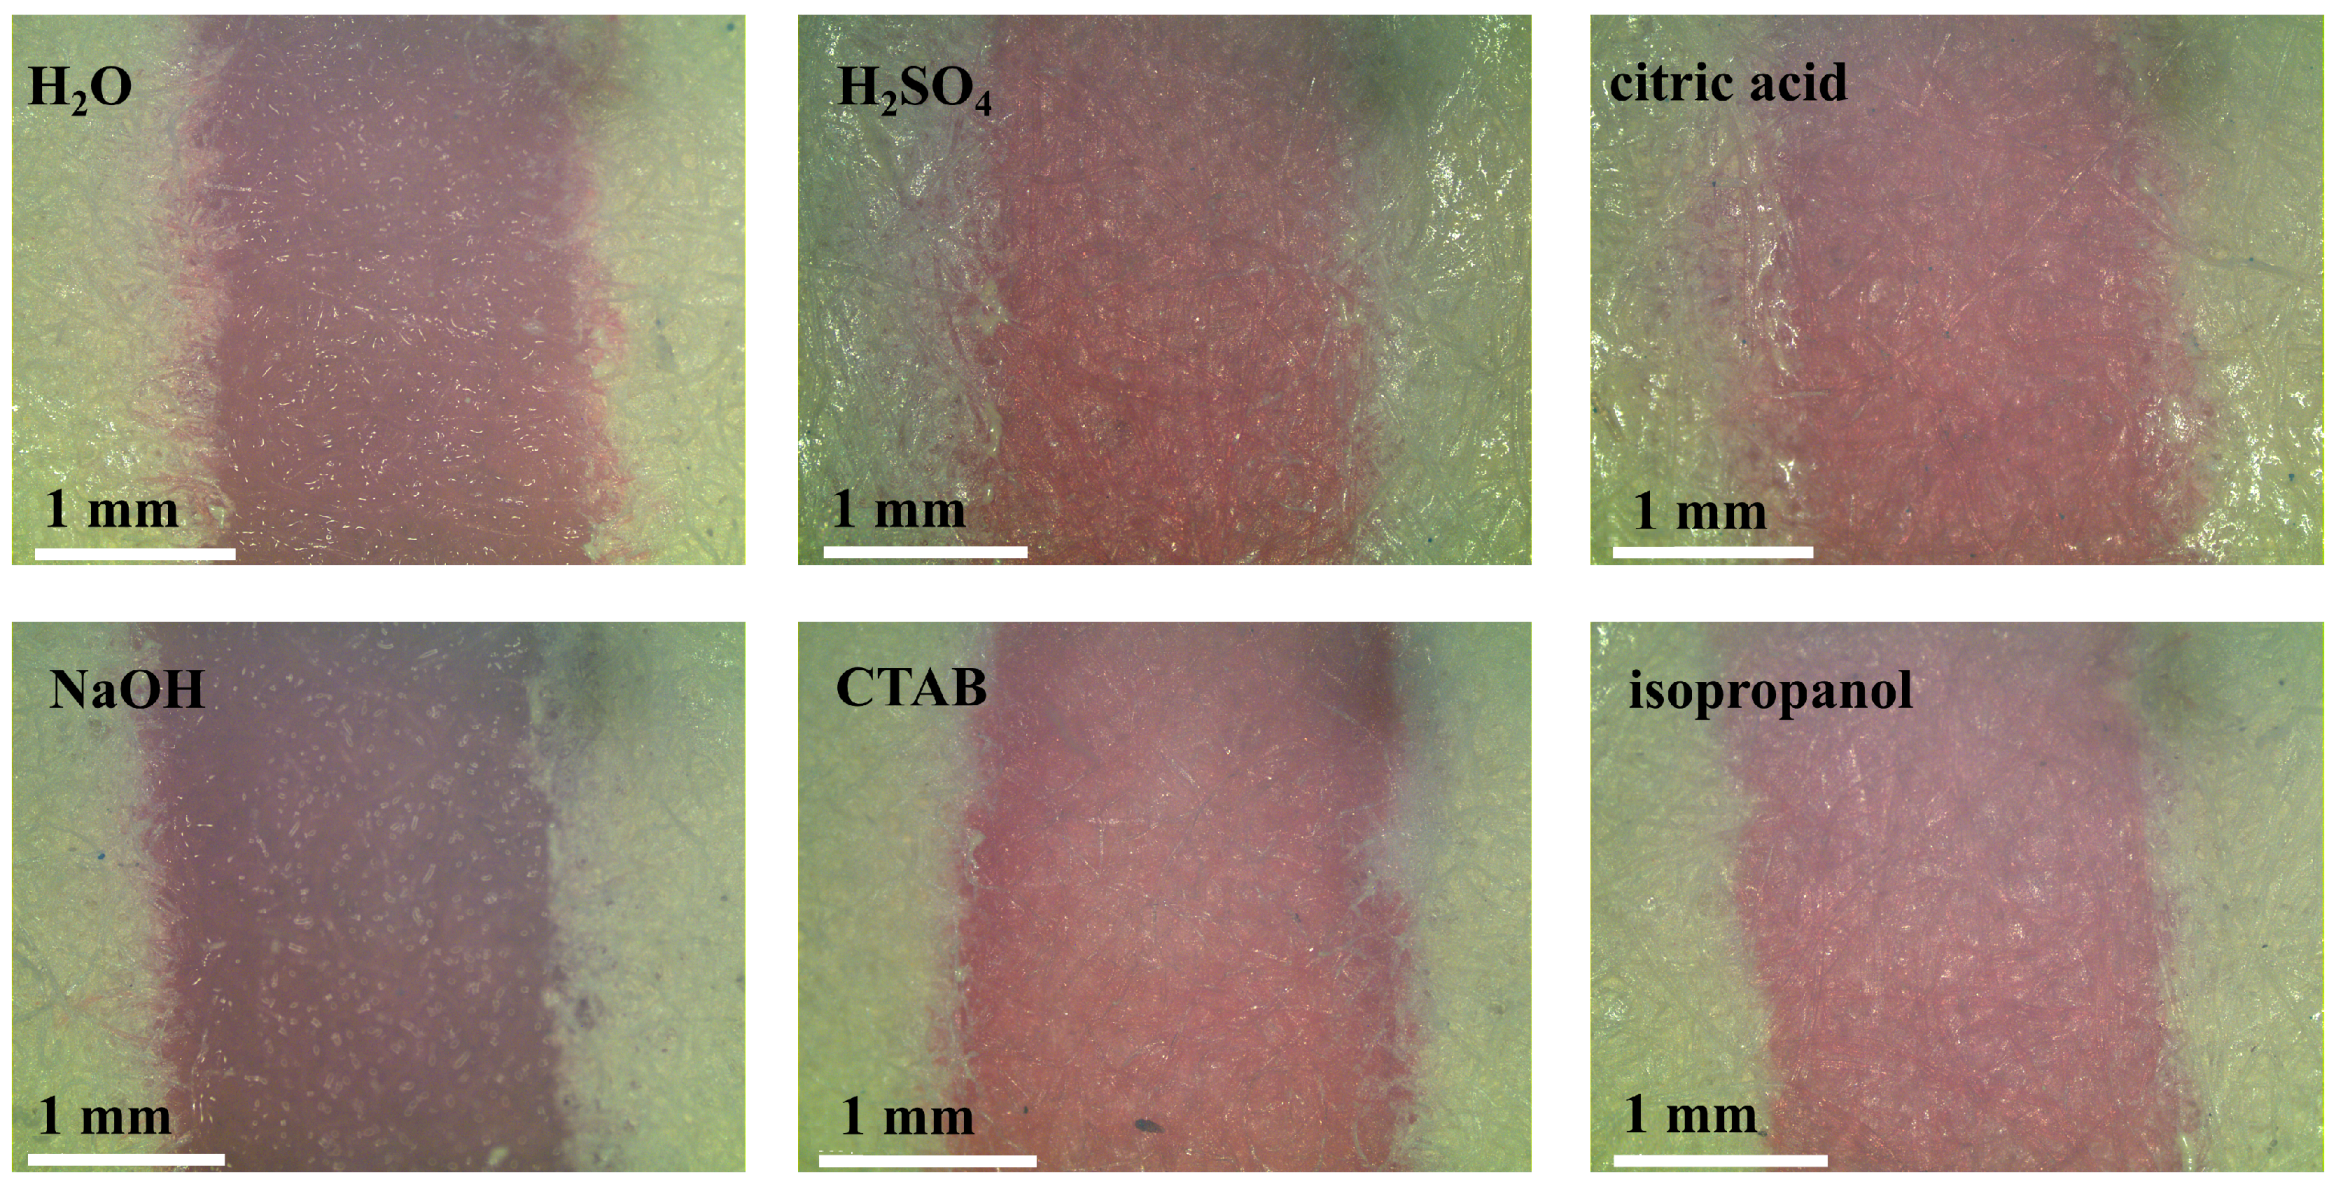
The barrier resistance is one of the important evaluation criteria for μPADs. The chemicals including acid and alkaline solutions, organic solvents, surfactants, etc., were often used in the analytical experiments. Therefore, the resistance of the lacquer barrier towards these chemicals was examined in this work. The solutions used for resistance examination are listed as follows: ultrapure water, acidic solutions (150 mM sulphuric acid, 150 mM citric acid), alkaline solution (150 mM sodium hydroxide), surfactants (5% (w/v) cetyltrimethylammonium bromide (CTAB)) and organic solvents (50% (v/v) isopropanol). In order to visually demonstrate the barrier effectiveness, the distance-based μPADs were used with a circular sample introduction zone (8 mm in diameter) and a straight channel (2 mm in width × 25 mm in length) for the resistance experiment. The solution containing a red food dye was pipetted into the sample introduction zone. After drying for 20 min, the optical micrographs of the channels were recorded. The results are shown in Figure 6. There was no solution leakage observed in all the micrographs recorded. The results indicate that the lacquer barrier could support these solutions and exhibited a great compatibility with these solutions. Moreover, the results also indicate that the barrier made by lacquer spraying is better than the wax barrier, because the wax barrier is poorly resistant to the solution such as surfactants and organic solvents [32].

3.3. The Feasibility Demonstration

The color values in the different color channels were measured for demonstrating the feasibility of the 3D sl-µPADs for NO2 and SCN assays. The results for the individual assay and the multiplex assay are shown in Figure 7. For nitrite assay, it is seen that the color values for the R, G, and B channels were 114, 103, and 92 for the blank, 110, 67, and 69 for the individual assay of 1 mM nitrite, and 108, 69, and 70 for 1 mM nitrite in multiplex assay, respectively. The absolute values of the color difference between the blank and the standard for R, G, and B channels were 4, 36, and 23 for the individual assay of nitrite, and 6, 34, and 22 for nitrite in multiplex assay, respectively. Therefore, the color values in the G channel is most sensitive for nitrite assay and chosen as the response signal. For thiocyanate assay, it is seen that the color values for the R, G, and B channels were 114, 110, and 75 for the blank, 118, 96, and 51 for the individual assay of 2 mM thiocyanate, and 111, 96, and 52 for 2 mM thiocyanate in multiplex assay, respectively. The absolute values of the color difference between the blank and the standard for R, G, and B channels were 4, 14, and 24 for the individual assay of thiocyanate, and 3, 14, and 23 for thiocyanate in multiplex assay, respectively. Therefore, the color values in the B channel are most sensitive for thiocyanate assay and chosen as the response signal. Moreover, the color intensities for both nitrite and thiocyanate in individual assay and multiplex assay were almost same. The results indicate that nitrite and thiocyanate could be detected simultaneously and each of them did not interfere with the other’s detection.

3.4. Simultaneous Detection of Nitrite and Thiocyanate

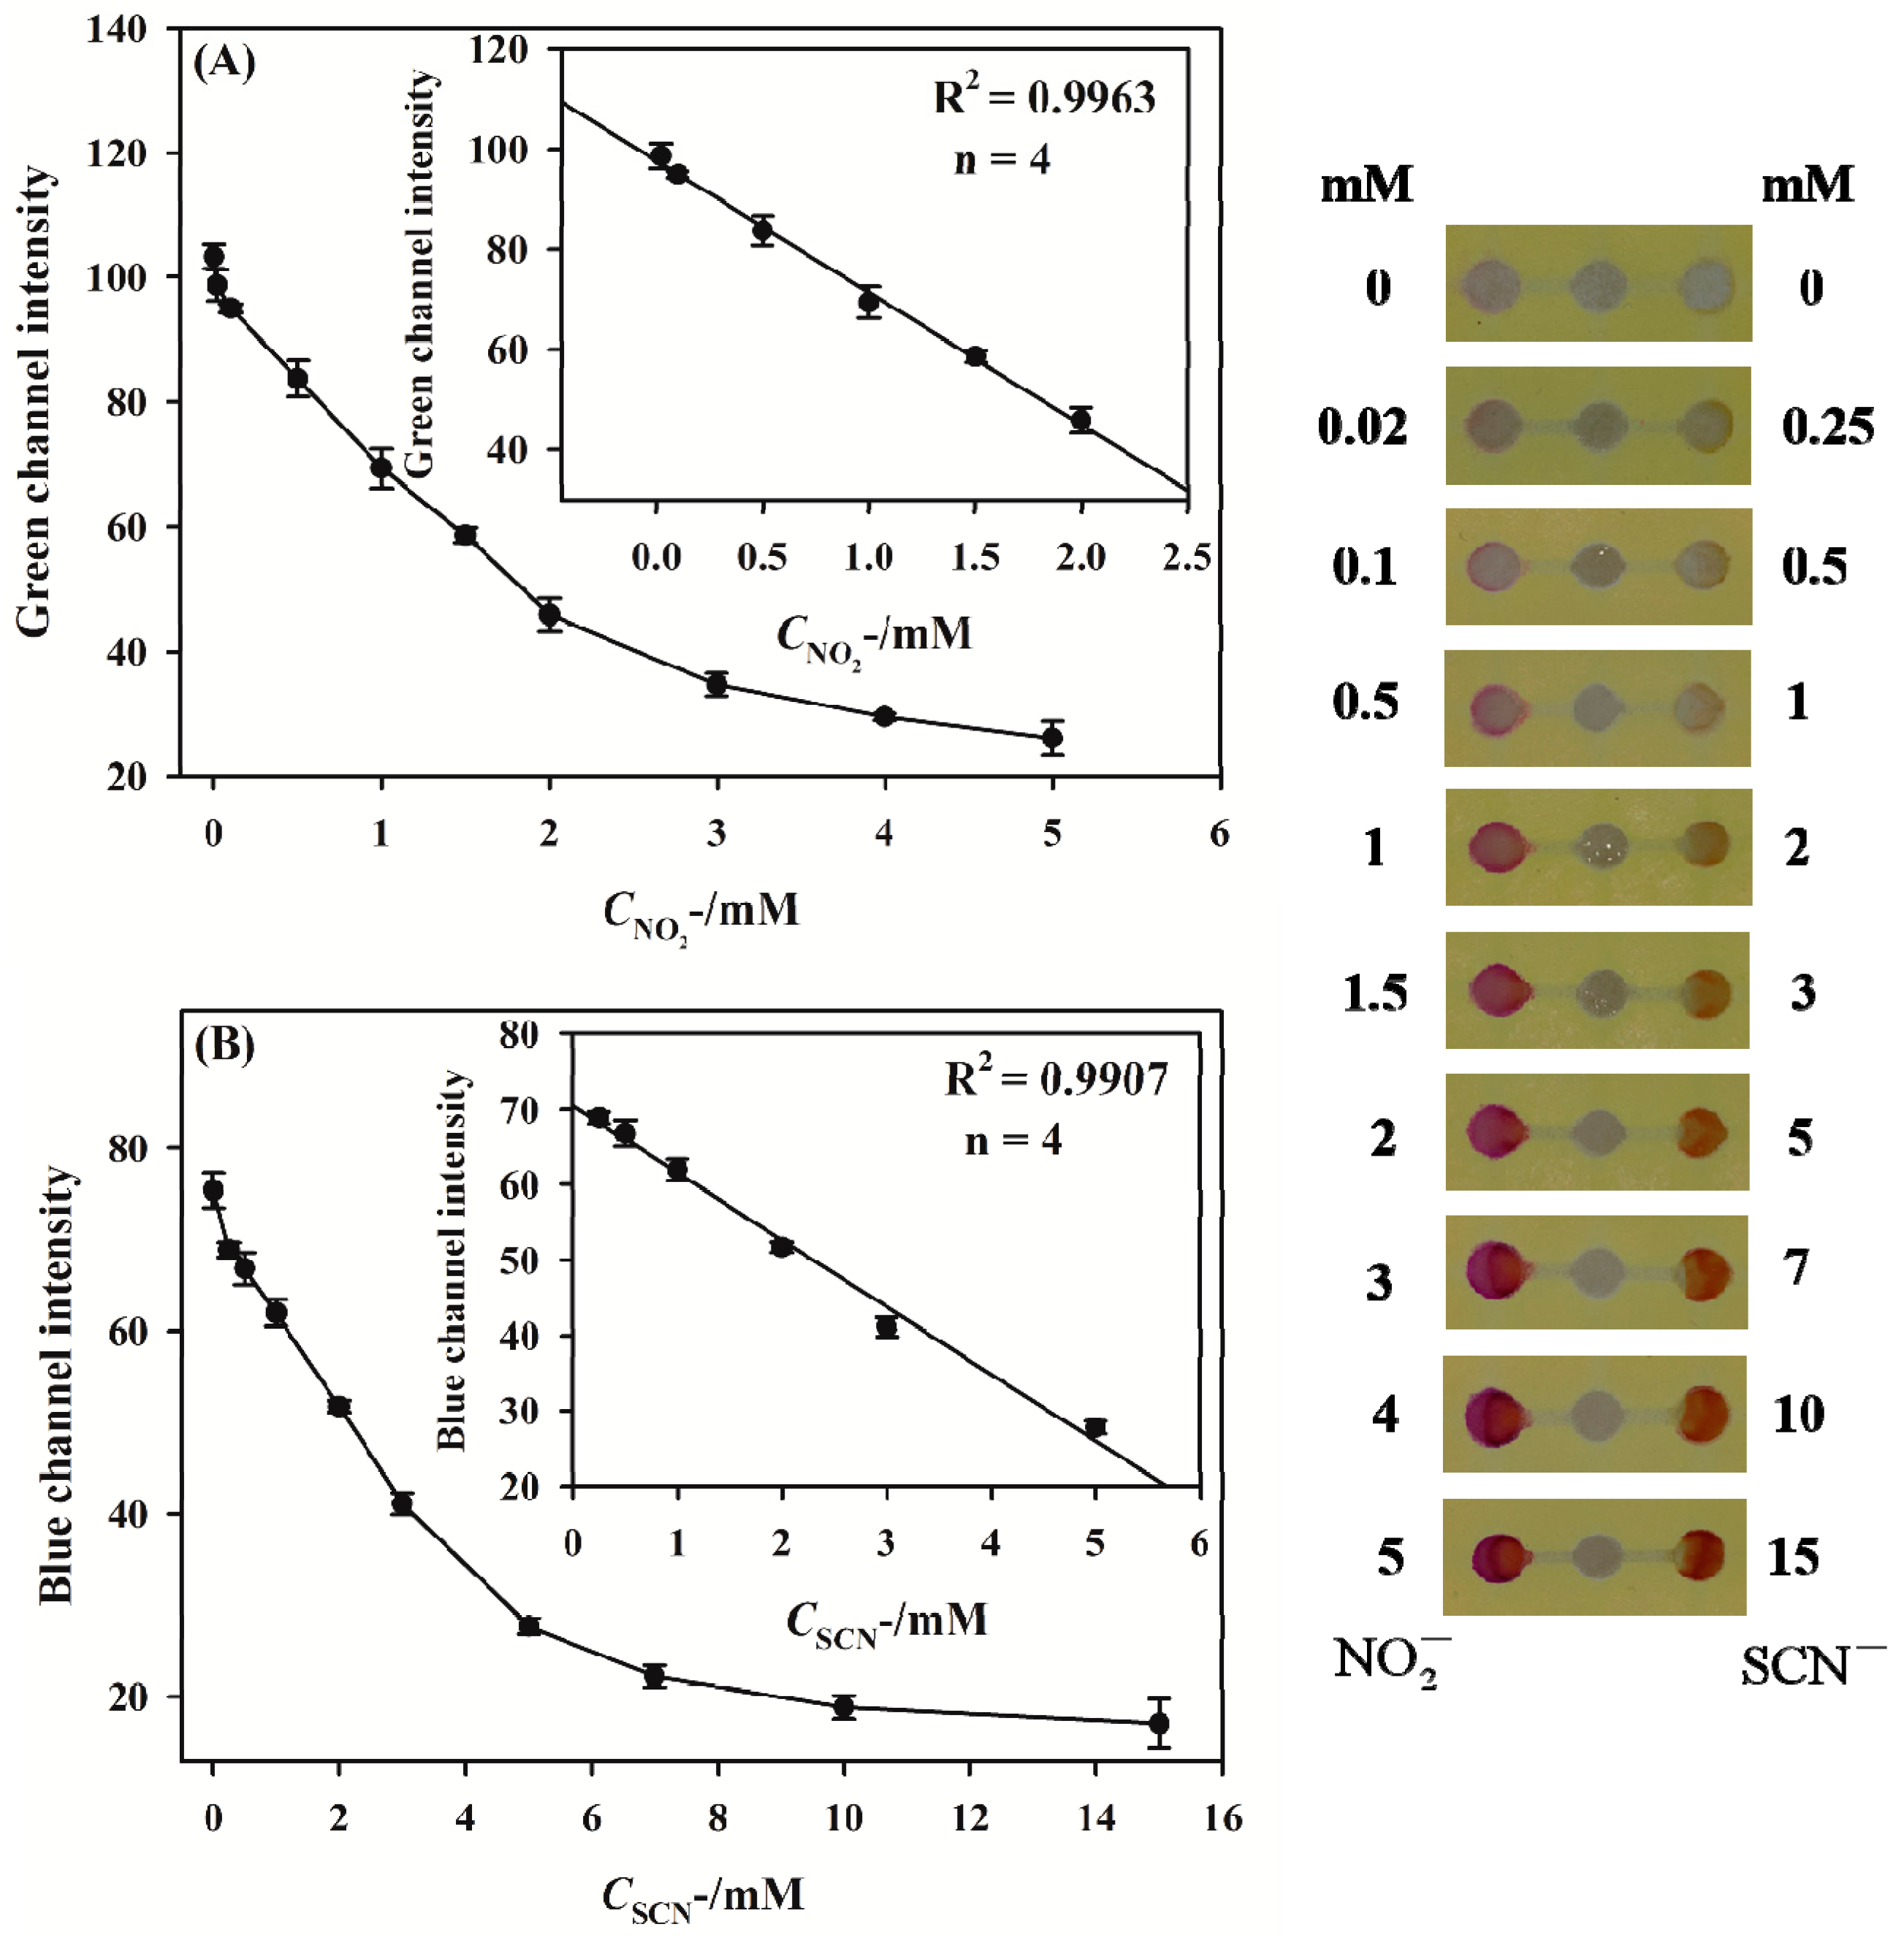
The simultaneous detection of nitrite and thiocyanate by the 3D sl-µPADs was investigated. The images of the detection zones after the addition of a series of standards are shown in Figure 8. It is noted that the color in the detection zones becomes deeper with increasing nitrite and thiocyanate concentrations from 0 to 5 mM and from 0 to 15 mM, respectively. The changes in color resulted in the notable decreases in the Green channel intensity for nitrite assay (Figure 8A) and the Blue channel intensity for thiocyanate assay (Figure 8B), respectively. Figure 8 shows that the linear ranges are from 0.02 to 2 mM and from 0.25 to 5 mM for nitrite and thiocyanate, respectively. The corresponding linear functions are Green channel intensity = − 26.3098Cnitrite + 97.6078 (R2 = 0.9963) and Blue channel intensity = − 8.9016Cthiocyanate + 70.4588 (R2 = 0.9907) for nitrite and thiocyanate, respectively. The limits of detection (LOD) calculated as the threefold noise level of the blank signal were 0.0096 and 0.074 mM for NO2 detection and SCN detection, respectively. The performance of the developed 3D sl-µPADs was compared with other sensors reported in literature for nitrite and thiocyanate assays as shown in Table 1. Most of the sensors for nitrite or thiocyanate assays mentioned in Table 1 are based on the same reactions and the same analytical method used in this work. Although our 3D sl-µPADs needed the longer time for reaction (15 min) and the bigger volume for sample introduction (18 µL) than some work shown in Table 1, the linear ranges and the LODs obtained in this work were comparable with those given by other sensors. Therefore, the fabricated 3D sl-µPADs provided an analytical platform to quantitatively detect nitrite and thiocyanate at the levels normally found in saliva [45,46,47]. Moreover, a heating step was added to study the possibility of the shorter testing time. The standard containing the two analytes including nitrite (1.5 mM) and thiocyanate (3 mM) was applied for this investigation. After adding the standard in the central well, the device was left in the oven at 50 °C for 3 min. For control, the device without heating treatment was used to detect the same standard with a 15 min assay time. The color intensities were almost the same as those of the control device (data not shown). This indicates that the heating treatment can speed the test duration up to 3 min without losing sensitivity.

3.5. Specificity and Precision

The specificity of the developed 3D sl-μPADs was investigated by performing the control experiments using other commonly ions as interferents (NH4+, CH3COO, I, H2PO4, Cl, SO42−, Mg2+, Br, NO3). Figure 9 shows the color intensity of the detection zones for the specificity experiments. Compared to the blank, the standards containing nitrite and thiocyanate gave the obvious decreases in the Green channel intensity and the Blue channel intensity, respectively. The response signals caused by the mixture of the standards and the interferents are almost the same as those of the standards, indicating the excellent specificity of the developed 3D sl-μPADs toward nitrite and thiocyanate assay. To investigate the precision of this method, the intra-batch and the inter-batch precisions were assessed by the relative standard deviations (RSD) at one concentration level for the multiplex assay: 1 mM nitrite and 2 mM thiocyanate. The intra-batch precision was performed by carrying out eight measurements and the RSD values were 4.5% and 3.9% for nitrite and thiocyanate, respectively. The inter-batch precision was assessed by detecting the same concentration using eight pieces of 3D sl-μPADs from eight different batches. The RSD values for the concentration level were 5.6% and 5.2% for nitrite and thiocyanate, respectively. All these results indicated that the developed 3D sl-μPADs provided a precise assay method for nitrite and thiocyanate detection.

3.6. Recovery Test

The practicability of the fabricated 3D sl-μPADs was evaluated by carrying out the recovery test using the artificial saliva as the real sample. The artificial saliva was spiked with the solutions with known concentrations of nitrite and thiocyanate, and was then pipetted into the central reservoir. The photos were acquired after 15 min of sample addition to allow full reaction between the analytes and the reagents. The results of the recovery test in artificial saliva are listed in Table 2. The recoveries for samples with 0.1, 0.5, and 1.5 mM nitrite added and 0.5, 2, and 3 mM thiocyanate added are 110%, 100%, and 95%, and 108%, 92%, and 104%, respectively. Furthermore, the RSD for recovery test was found to be below 6%. Actually, the viscosity of the sample has a great influence on the fluidity of the solution in the channel. SCMC in the artificial saliva was used to mimic the viscosity of the real saliva sample. Different concentrations of SCMC solutions containing a red food dye were used to investigate the solution fluidity in the channel. A total of 18 μL of the SCMC solution was added into the central sample introduction well. After 5 min, the picture of the top surface of the 3D device was taken using a smart phone. As shown in Figure 10, the results demonstrated that the solutions containing 0.1 g/L of SCMC showed the good solution fluidity in the channel. Higher concentrations (larger than 0.25 g/L) of SCMC solutions were too viscous to move in the channel. The viscosity of the artificial saliva used for recovery test is lower than 1.54 mPa·s while the viscosity of the real saliva sample ranges from 1 to 30 mPa·s [41,56]. Therefore, the fluidity of the actual saliva sample in the channel may be a limitation in testing. The pretreatment such as dilution and freezing treatment may be needed before testing since the saliva viscosity was found to decrease significantly after being frozen [57].

4. Conclusions

In conclusion, the spraying technique was, for the first time, applied for manufacturing single-layered 3D μPADs. Under the optimized fabrication conditions, 3D channels were successfully constructed in a single piece of filter paper and the hydrophobic boundary was very clear. Furthermore, the developed 3D sl-μPADs were demonstrated for the determination of nitrite and thiocyanate at the same time. The linear ranges are 0.02–2 mM and 0.25–5 mM and the LODs are 0.0096 and 0.074 mM for nitrite and thiocyanate, respectively. Moreover, the 3D sl-μPADs exhibit good specificity, good repeatability, and satisfactory recoveries in the artificial saliva. The analytical performance of the 3D sl-μPADs is sufficient to detect nitrite and thiocyanate at the levels normally found in saliva, indicating their potential applications in POCT. More importantly, through changing the designs of PMMA boards, the 3D sl-μPADs could accommodate more complex channels and enable high-throughput detection.

Author Contributions

P.Y. designed the 3D µPADs, consulted the literature, interpreted the data, and wrote the manuscript. M.D. carried out the experiments. Y.Y. provided the instruments and contributed to the data interpretation. B.N. and S.Z. contributed to the data analysis. All authors have read and agreed to the published version of the manuscript.

Funding

This work is financially supported by the Natural Science Foundation of Hunan Province (grant number 2018JJ3500), the National Natural Science Foundation of China (grant number 21804114), and College Students Platform for Innovation and Entrepreneurship Training Program of Hunan province (grant number S201910530018).

Acknowledgments

The authors are grateful to the anonymous referees for giving the valuable suggestions and comments, which greatly improved the quality of this work.

Conflicts of Interest

The authors declare no conflict of interest.

References

  1. Huang, K.J.; Xie, W.Z.; Zhang, H.S.; Wang, H. Ultra-trace level determination of nitrite in human saliva by spectrofluorimetry using 1, 3, 5, 7-tetramethyl-8-(3, 4-diaminophenyl)-difluoroboradiaza-s-indacene. Microchim. Acta 2008, 161, 201–207. [Google Scholar] [CrossRef]
  2. Kuralay, F.; Dumangöz, M.; Tunç, S. Polymer/carbon nanotubes coated graphite surfaces for highly sensitive nitrite detection. Talanta 2015, 144, 1133–1138. [Google Scholar] [CrossRef] [PubMed]
  3. Heinecke, J.L.; Khin, C.; Pereira, J.C.M.; Suárez, S.A.; Iretskii, A.V.; Doctorovich, F.; Ford, P.C. Nitrite reduction mediated by heme models. Routes to NO and HNO? J. Am. Chem. Soc. 2013, 135, 4007–4017. [Google Scholar] [CrossRef] [PubMed]
  4. Kodamatani, H.; Yamazaki, S.; Saito, K.; Tomiyasu, T.; Komatsu, Y. Selective determination method for measurement of nitrite and nitrate in water samples using high-performance liquid chromatography with post-column photochemical reaction and chemiluminescence detection. J. Chromatogr. A 2009, 1216, 3163–3316. [Google Scholar] [CrossRef]
  5. Afkhami, A.; Soltani-Felehgari, F.; Madrakian, T.; Ghaedi, H. Surface decoration of multi-walled carbon nanotubes modified carbon paste electrode with gold nanoparticles for electro-oxidation and sensitive determination of nitrite. Biosens. Bioelectron. 2014, 51, 379–385. [Google Scholar] [CrossRef]
  6. Tannenbaum, S.R.; Sinskey, A.J.; Weissman, M.; Bishop, W. Nitrite in human saliva: Its possible relationship to nitrosamine formation. J. Natl. Cancer Inst. 1974, 53, 75–784. [Google Scholar] [CrossRef]
  7. Hou, T.; Liu, Y.; Xu, L.; Wu, Y.; Ying, Y.; Wen, Y.; Guo, X.Y.; Yang, H. Au dotted magnetic graphene sheets for sensitive detection of thiocyanate. Sens. Actuators B Chem. 2017, 241, 376–382. [Google Scholar] [CrossRef]
  8. Song, J.; Wu, F.Y.; Wan, Y.Q.; Ma, L.H. Ultrasensitive turn-on fluorescent detection of trace thiocyanate based on fluorescence resonance energy transfer. Talanta 2015, 132, 619–624. [Google Scholar] [CrossRef]
  9. Glatz, Z.; Nováková, S.; Štěrbová, H. Analysis of thiocyanate in biological fluids by capillary zone electrophoresis. J. Chromatogr. A 2001, 916, 273–277. [Google Scholar] [CrossRef]
  10. Wu, L.; Wang, Z.; Zong, S.; Cui, Y. Rapid and reproducible analysis of thiocyanate in real human serum and saliva using a droplet SERS-microfluidic chip. Biosens. Bioelectron. 2014, 62, 13–18. [Google Scholar] [CrossRef]
  11. Bhakta, S.A.; Borba, R.; Taba, J.M.; Garcia, C.D.; Carrilho, E. Determination of nitrite in saliva using microfluidic paper-based analytical devices. Anal. Chim. Acta 2014, 809, 117–122. [Google Scholar] [CrossRef] [PubMed] [Green Version]
  12. Valdés, M.; Díaz-García, M. Determination of thiocyanate within physiological fluids and environmental samples: Current practice and future trends. Crit. Rev. Anal. Chem. 2004, 34, 9–23. [Google Scholar] [CrossRef]
  13. Ryder, M.I.; Fujitaki, R.; Johnson, G.; Hyun, W. Alterations of neutrophil oxidative burst by in vitro smoke exposure: Implications for oral and systemic diseases. Ann. Periodontol. 1998, 3, 76–87. [Google Scholar] [CrossRef] [PubMed]
  14. Guo, L.; Wang, Y.; Zheng, Y.; Huang, Z.; Cheng, Y.; Ye, J.; Chu, Q.; Huang, D. Study on the potential application of salivary inorganic anions in clinical diagnosis by capillary electrophoresis coupled with contactless conductivity detection. J. Chromatogr. B 2016, 1014, 70–74. [Google Scholar] [CrossRef] [PubMed]
  15. da Silva, M.; Sako, A.V.F.; Micke, G.A.; Vitali, L. A rapid method for simultaneous determination of nitrate, nitrite and thiocyanate in milk by CZE-UV using quaternary ammonium chitosan as electroosmotic flow inverter. J. Food Compos. Anal 2020, 88, 103455. [Google Scholar] [CrossRef]
  16. Tanaka, Y.; Naruishi, N.; Fukuya, H.; Sakata, J.; Saito, K.; Wakida, S.I. Simultaneous determination of nitrite, nitrate, thiocyanate and uric acid in human saliva by capillary zone electrophoresis and its application to the study of daily variations. J. Chromatogr. A 2004, 1051, 193–197. [Google Scholar] [CrossRef]
  17. Connolly, D.; Barron, L.; Paull, B. Determination of urinary thiocyanate and nitrate using fast ion-interaction chromatography. J. Chromatogr. B 2002, 767, 175–180. [Google Scholar] [CrossRef]
  18. Hu, W.; Haraguchi, H. Determination of Monovalent Inorganic Anions in Human Saliva by Ion Chromatography Using Microcolumn Coated with Micellar Zwitterionic Bile Acid Derivative. Bull. Chem. Soc. Jpn. 1993, 66, 1420–1423. [Google Scholar] [CrossRef]
  19. Prest, J.E.; Baldock, S.J.; Beardah, M.S.; Doyle, S.P.; Fielden, P.R.; Goddard, N.J.; Brown, B.J.T. Thiocyanate and nitrite analysis using miniaturised isotachophoresis on a planar polymer chip. Analyst 2011, 136, 3170–3176. [Google Scholar] [CrossRef]
  20. Bjergegaard, C.; Møller, P.; Sørensen, H. Determination of thiocyanate, iodide, nitrate and nitrite in biological samples by micellar electrokinetic capillary chromatography. J. Chromatogr. A 1995, 717, 409–414. [Google Scholar] [CrossRef]
  21. Chen, S.H.; Wu, H.L.; Tanaka, M.; Shono, T.; Funazo, K. Simultaneous gas chromatographic determination of iodide, nitrite, sulphide and thiocyanate anions by derivatization with pentafluorobenzyl bromide. J. Chromatogr. A 1987, 396, 129–137. [Google Scholar] [CrossRef]
  22. Chen, S.H.; Wu, H.L.; Tanaka, M.; Shono, T.; Funazo, K. Simultaneous gas chromatographic determination of cyanide, iodide, nitrite, sulphide and thiocyanate anions by derivatization with pentafluorobenzyl bromide and using a kryptand as phase-transfer catalyst. J. Chromatogr. A 1990, 502, 257–264. [Google Scholar] [CrossRef]
  23. Tanabe, S.; Kitahara, M.; Nawata, M.; Kawanabe, K. Determination of oxidizable inorganic anions by high-performance liquid chromatography with fluorescence detection and application to the determination of salivary nitrite and thiocyanate and serum thiocyanate. J. Chromatogr. B 1988, 424, 29–37. [Google Scholar] [CrossRef]
  24. Hu, J.; Wang, S.; Wang, L.; Li, F.; Pingguan-Murphy, B.; Lu, T.J.; Xu, F. Advances in paper-based point-of-care diagnostics. Biosens. Bioelectron. 2014, 54, 585–597. [Google Scholar] [CrossRef] [PubMed]
  25. Cate, D.M.; Adkins, J.A.; Mettakoonpitak, J.; Henry, C.S. Recent developments in paper-based microfluidic devices. Anal. Chem. 2015, 87, 19–41. [Google Scholar] [CrossRef] [PubMed]
  26. Wei, X.; Tian, T.; Jia, S.; Zhu, Z.; Ma, Y.; Sun, J.; Lin, Z.; Yang, C.J. Target-responsive DNA hydrogel mediated “stop-flow” microfluidic paper-based analytic device for rapid, portable and visual detection of multiple targets. Anal. Chem. 2015, 87, 4275–4282. [Google Scholar] [CrossRef]
  27. Pena-Pereira, F.; Lavilla, I.; Bendicho, C. Paper-based analytical device for instrumental-free detection of thiocyanate in saliva as a biomarker of tobacco smoke exposure. Talanta 2016, 147, 390–396. [Google Scholar] [CrossRef]
  28. Li, X.; Liu, X. Fabrication of three-dimensional microfluidic channels in a single layer of cellulose paper. Microfluid. Nanofluid 2014, 16, 819–827. [Google Scholar] [CrossRef]
  29. Martinez, A.W.; Phillips, S.T.; Whitesides, G.M. Three-dimensional microfluidic devices fabricated in layered paper and tape. P. Natl. A. Sci. 2008, 105, 19606–19611. [Google Scholar] [CrossRef] [Green Version]
  30. Lu, J.; Ge, S.; Ge, L.; Yan, M.; Yu, J. Electrochemical DNA sensor based on three-dimensional folding paper device for specific and sensitive point-of-care testing. Electrochim. Acta 2012, 80, 334–341. [Google Scholar] [CrossRef]
  31. Jeong, S.G.; Lee, S.H.; Choi, C.H.; Kim, J.; Lee, C.S. Toward instrument-free digital measurements: A three-dimensional microfluidic device fabricated in a single sheet of paper by double-sided printing and lamination. Lab Chip 2015, 15, 1188–1194. [Google Scholar] [CrossRef] [PubMed]
  32. Cardoso, T.M.; de Souza, F.R.; Garcia, P.T.; Rabelo, D.; Henry, C.S.; Coltro, W.K. Versatile fabrication of paper-based microfluidic devices with high chemical resistance using scholar glue and magnetic masks. Anal. Chim. Acta 2017, 974, 63–68. [Google Scholar] [CrossRef] [PubMed]
  33. Nurak, T.; Praphairaksit, N.; Chailapakul, O. Fabrication of paper-based devices by lacquer spraying method for the determination of nickel (II) ion in waste water. Talanta 2013, 114, 291–296. [Google Scholar] [CrossRef] [PubMed]
  34. Yu, P.; Deng, M.H.; Yang, Y. New Single-Layered Paper-Based Microfluidic Devices for the Analysis of Nitrite and Glucose Built via Deposition of Adhesive Tape. Sensors 2019, 19, 4082. [Google Scholar] [CrossRef] [Green Version]
  35. Lewis, G.G.; DiTucci, M.J.; Baker, M.S.; Phillips, S.T. High throughput method for prototyping three-dimensional, paper-based microfluidic devices. Lab Chip 2012, 12, 2630–2633. [Google Scholar] [CrossRef]
  36. Yıldırmaz, G.; Akgöl, S.; Arıca, M.Y.; Sönmez, H.; Denizli, A. Polyhydroxyethylmethacrylate/polyhydroxybutyrate composite membranes for fluoride release. J. Appl. Polym. Sci. 2003, 87, 976–981. [Google Scholar] [CrossRef]
  37. Klasner, S.A.; Price, A.K.; Hoeman, K.W.; Wilson, R.S.; Bell, K.J.; Culbertson, C.T. Paper-based microfluidic devices for analysis of clinically relevant analytes present in urine and saliva. Anal. Bioanal. Chem. 2010, 397, 1821–1829. [Google Scholar] [CrossRef]
  38. Bryan, N.S.; Grisham, M.B. Methods to detect nitric oxide and its metabolites in biological samples. Free Radic. Biol. Med. 2008, 43, 645–657. [Google Scholar] [CrossRef] [Green Version]
  39. Jones, E.A.; Hemmings, M.J. Spectrophotometric Determination by Flow Injection Analysis of Thiocyanate in Metallurgical Process Solutions Containing Free Cyanide and Metal Cyanide Complexes. S. Afr. J. Chem. 1989, 42, 6–8. [Google Scholar]
  40. Van Staden, J.F.; Botha, A. Spectrophotometric determination of thiocyanate by sequential injection analysis. Anal. Chim. Acta 2000, 403, 279–286. [Google Scholar] [CrossRef]
  41. Noiphung, J.; Nguyen, M.P.; Punyadeera, C.; Wan, Y.; Laiwattanapaisal, W.; Henry, C.S. Development of paper-based analytical devices for minimizing the viscosity effect in human saliva. Theranostics 2018, 8, 3797. [Google Scholar] [CrossRef] [PubMed]
  42. Shallan, A.I.; Smejkal, P.; Corban, M.; Guijt, R.M.; Breadmore, M.C. Cost-effective three-dimensional printing of visibly transparent microchips within minutes. Anal. Chem. 2014, 86, 3124–3130. [Google Scholar] [CrossRef] [PubMed]
  43. Wang, H.; Li, Y.; Wei, J.; Xu, J.; Wang, Y.; Zheng, G. Paper-based three-dimensional microfluidic device for monitoring of heavy metals with a camera cell phone. Anal. Bioanal. Chem. 2014, 406, 2799–2807. [Google Scholar] [CrossRef] [PubMed]
  44. Su, W.; Cook, B.S.; Fang, Y.; Tentzeris, M.M. Fully inkjet-printed microfluidics: A solution to low-cost rapid three-dimensional microfluidics fabrication with numerous electrical and sensing applications. Sci. Rep. 2016, 6, 35111. [Google Scholar] [CrossRef] [Green Version]
  45. Shende, V.; Biviji, A.T.; Akarte, N. Estimation and correlative study of salivary nitrate and nitrite in tobacco related oral squamous carcinoma and submucous fbrosis. J. Oral Maxillofac. Pathol. 2013, 17, 381–385. [Google Scholar] [CrossRef] [Green Version]
  46. Phonchai, A.; Srisukpan, T.; Riengrojpitak, S.; Wilairat, P.; Chantiwas, R. Simple and Rapid screening of the thiocyanate level in saliva for the identifcation of smokers and non- smokers by capillary electrophoresis with contactless conductivity detection. Anal. Methods. 2016, 8, 4983–4990. [Google Scholar] [CrossRef]
  47. Júnior, J.J.S.; Farias, M.A.; Silva, V.L.; Montenegro, M.C.; Araújo, A.N.; Lavorante, A.F.; Paim, A.P.S. Spectrophotometric determination of thiocyanate in human saliva employing micropumping multicommutation flow system. Spectrosc. Lett. 2013, 43, 213–219. [Google Scholar] [CrossRef]
  48. Daniel, W.L.; Han, M.S.; Lee, J.S.; Mirkin, C.A. Colorimetric nitrite and nitrate detection with gold nanoparticle probes and kinetic end points. J. Am. Chem. Soc. 2009, 131, 6362–6363. [Google Scholar] [CrossRef]
  49. Nilghaz, A.; Bagherbaigi, S.; Lam, C.L.; Mousavi, S.M.; Cόrcoles, E.P.; Wicaksono, D.H. Multiple semi-quantitative colorimetric assays in compact embeddable microfluidic cloth-based analytical device (μCAD) for effective point-of-care diagnostic. Microfluid. Nanofluid 2015, 19, 317–333. [Google Scholar] [CrossRef]
  50. Wang, B.; Lin, Z.; Wang, M. Fabrication of a paper-based microfluidic device to readily determine nitrite ion concentration by simple colorimetric assay. J. Chem. Educ. 2015, 92, 733–736. [Google Scholar] [CrossRef]
  51. Chiang, C.K.; Kurniawan, A.; Kao, C.Y.; Wang, M.J. Single step and mask-free 3D wax printing of microfluidic paper-based analytical devices for glucose and nitrite assays. Talanta 2019, 194, 837–845. [Google Scholar] [CrossRef] [PubMed]
  52. Sitanurak, J.; Fukana, N.; Wongpakdee, T.; Thepchuay, Y.; Ratanawimarnwong, N.; Amornsakchai, T.; Nacapricha, D. T-shirt ink for one-step screen-printing of hydrophobic barriers for 2D-and 3D-microfluidic paper-based analytical devices. Talanta 2019, 205, 120113. [Google Scholar] [CrossRef] [PubMed]
  53. Gavrilenko, N.A.; Volgina, T.N.; Urazov, E.V.; Gavrilenko, M.A. Transparent polymer sensor for visual and photometrical detection of thiocyanate in oilfield water. J. Petrol. Sci. Eng. 2019, 172, 960–963. [Google Scholar] [CrossRef]
  54. Mohammad, A.; Chahar, J.P.S. Thin-layer chromatographic separation, colorimetric determination and recovery of thiocyanate from photogenic waste, river and sea waters. J. Chromatogr. A 1997, 774, 373–377. [Google Scholar] [CrossRef]
  55. Acebal, C.C.; Sklenářová, H.; Škrlíková, J.; Šrámková, I.; Andruch, V.; Balogh, I.S.; Solich, P. Application of DV-SIA manifold for determination of thiocyanate ions in human saliva samples. Talanta 2012, 96, 107–112. [Google Scholar] [CrossRef]
  56. Davis, S.S. The rheological properties of saliva. Rheol. Acta 1971, 10, 28–35. [Google Scholar] [CrossRef]
  57. Stokes, J.R.; Davies, G.A. Viscoelasticity of human whole saliva collected after acid and mechanical stimulation. Biorheology 2007, 44, 141–160. [Google Scholar]
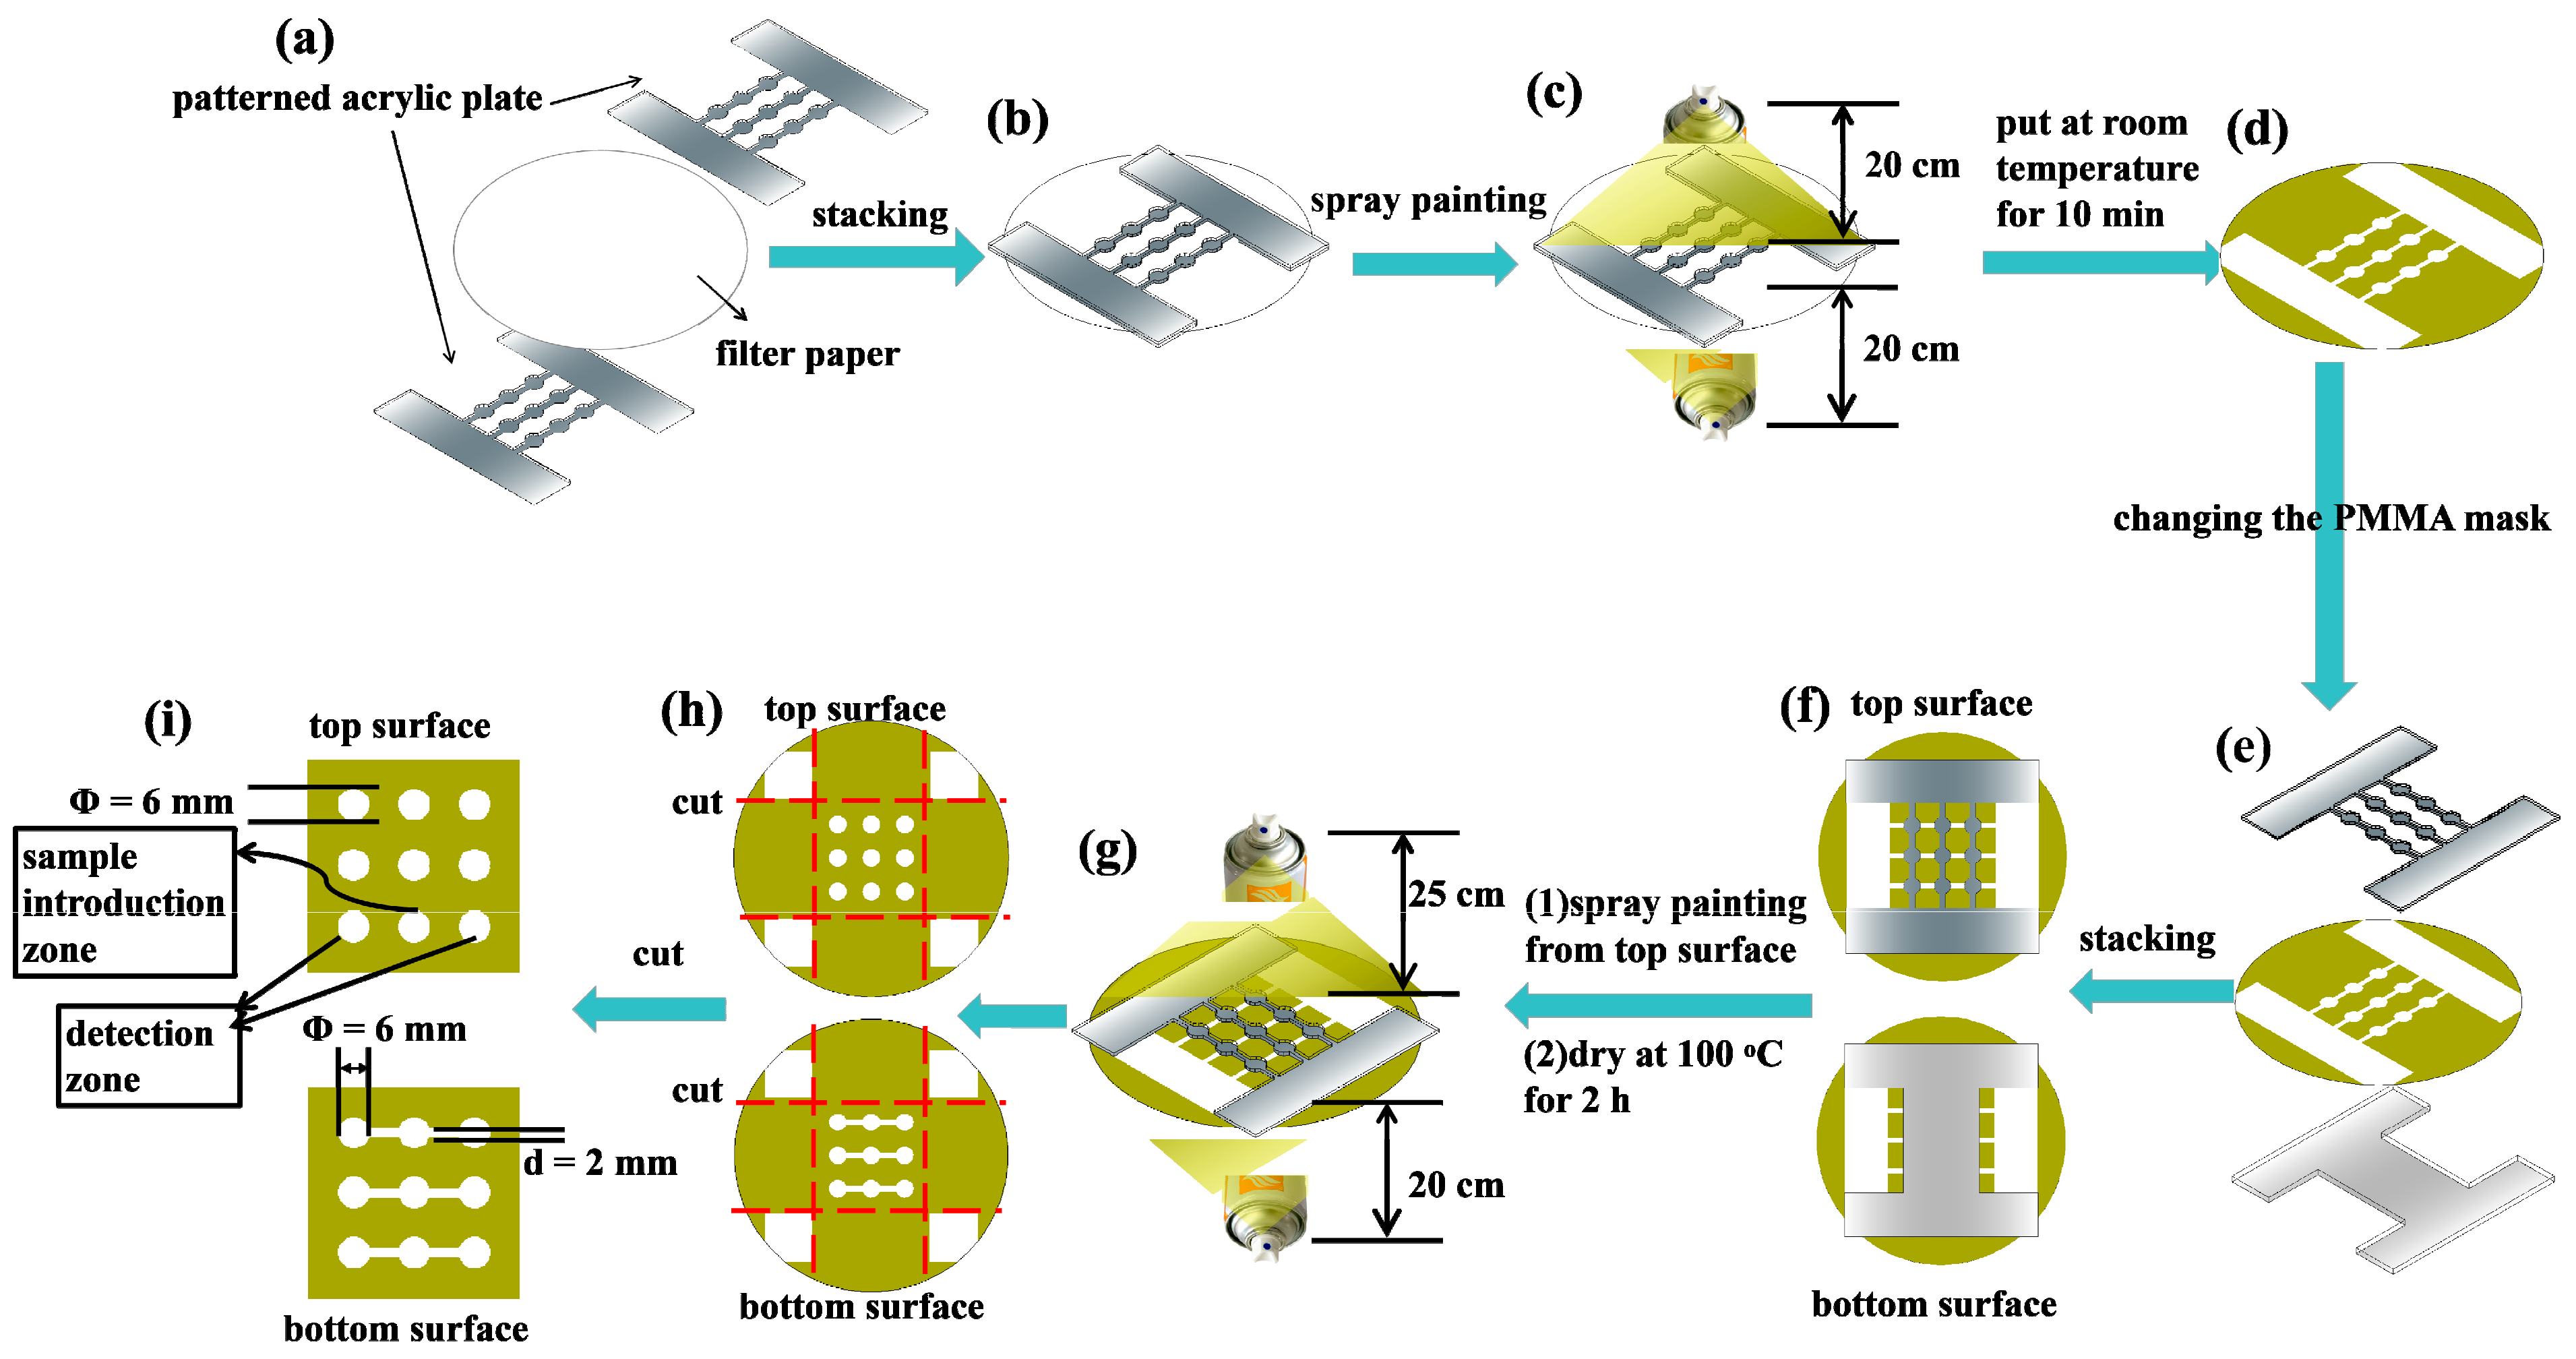
Figure 1. The diagram of the spraying prototyping technique for fabricating the three-dimensional single-layered paper-based microfluidic analytical devices (3D sl-μPADs). (a) a sheet of filter paper and two PMMA boards with the same design. (b) the paper and two PMMA boards were stacked together. (c) the first spraying process. (d) the device was dried at room temperature for 10 min. (e) the filter paper and two PMMA boards with different designs. (f) the paper and two PMMA boards were stacked together. (g) the second spraying process. (h) the excess materials were trimmed. (i) the finished layout of the 3D sl-μPADs.
Sensors 20 04118 g001
Figure 2. Optimization of the times for pressing the spray nozzle for the spraying process.
Sensors 20 04118 g002
Figure 3. Optimization of the drying conditions for the fabrication of 3D sl-μPADs.
Sensors 20 04118 g003
Figure 4. The intersection of the 3D sl-µPADs captured under an optical microscope.
Sensors 20 04118 g004
Figure 5. (A) The photograph of the water droplet on both sides of the 3D sl-µPADs. (B) The pictures are taken at different times after adding food dye (18 µL) to the central reservoir from the top surface of the 3D sl-µPADs.
Sensors 20 04118 g005
Figure 6. The optical micrographs of the lacquer barrier in the presence of different solutions.
Sensors 20 04118 g006
Figure 7. The RGB measurements for the individual assay and the multiplex assay: (A) 1 mM nitrite, (B) 2 mM thiocyanate.
Sensors 20 04118 g007
Figure 8. Assay results for nitrite (A) and thiocyanate (B) based on the developed 3D sl-µPADs.
Sensors 20 04118 g008
Figure 9. The specificity of the fabricated 3D sl-μPADs. The concentrations of nitrite and thiocyanate are 0.5 and 5 mM, respectively. The concentrations of the interferents are all 50 mM. Error bars represent the standard deviation of four parallel experiments.
Sensors 20 04118 g009
Figure 10. The pictures of the top surface of the 3D sl-μPADs after adding different concentrations of sodium carboxymethylcellulose (SCMC) solutions in the central well.
Sensors 20 04118 g010
Table 1. A contrast of the assay performance between our 3D sl-µPADs and other sensors reported by other groups in the determination of nitrite and thiocyanate.
Nitrite Assay
Sensing ReagentsMethodResponse Time (min)Volume (μL)Linear Range (mM)LOD (mM)Refs.
Griess reagentColorimetric215 0.16[48]
Griess reagentColorimetric 0.087[49]
Griess reagentColorimetric21.400.156–1.25 [50]
Griess reagentColorimetric1050.0156–10.0148[51]
Griess reagentColorimetric10120.02–0.90.015[36]
Griess reagentColorimetric15180.02–20.0096This work
Thiocyanate Assay
Sensing ReagentsMethodResponse Time (min)Volume (μL)Linear Range (mM)LOD (mM)Refs.
Fe3+Colorimetric4151–81.19[52]
Fe3+Colorimetric1020.025–200.06[27]
Fe3+Colorimetric 0.10–0.340.10[53]
Fe3+Colorimetric 1002.55–25.480.20[54]
Astra phloxineSpectrophotometic 500.05–0.500.02[55]
Fe3+Colorimetric15180.25–50.074This work
Table 2. Recovery test of nitrite and thiocyanate in artificial saliva.
NitriteSample No.Added (mM)Found (mM)RSD (%)Recovery (%)
10.10.115.63110
20.50.501.98100
31.51.431.8895
ThiocyanateSample No.Added (mM)Found (mM)RSD (%)Recovery (%)
10.50.542.71108
221.832.3092
333.132.84104