WCTECGdb: A 12-Lead Electrocardiography Dataset Recorded Simultaneously with Raw Exploring Electrodes’ Potential Directly Referred to the Right Leg

 ,
,  ,
,
Abstract
1. Introduction
2. Dataset Characterization
3. Lead’s Reconstruction
4. Results and Discussion
5. Conclusions
6. Appendix Further Notes on the WCT and Hardware

Author Contributions
Funding
Acknowledgments
Conflicts of Interest
Glossary
- Electrocardiography: bioelectrical recording from the heart. Abbreviated ECG and EKG. It contains three limb leads, three augmented leads, and six precordial leads.
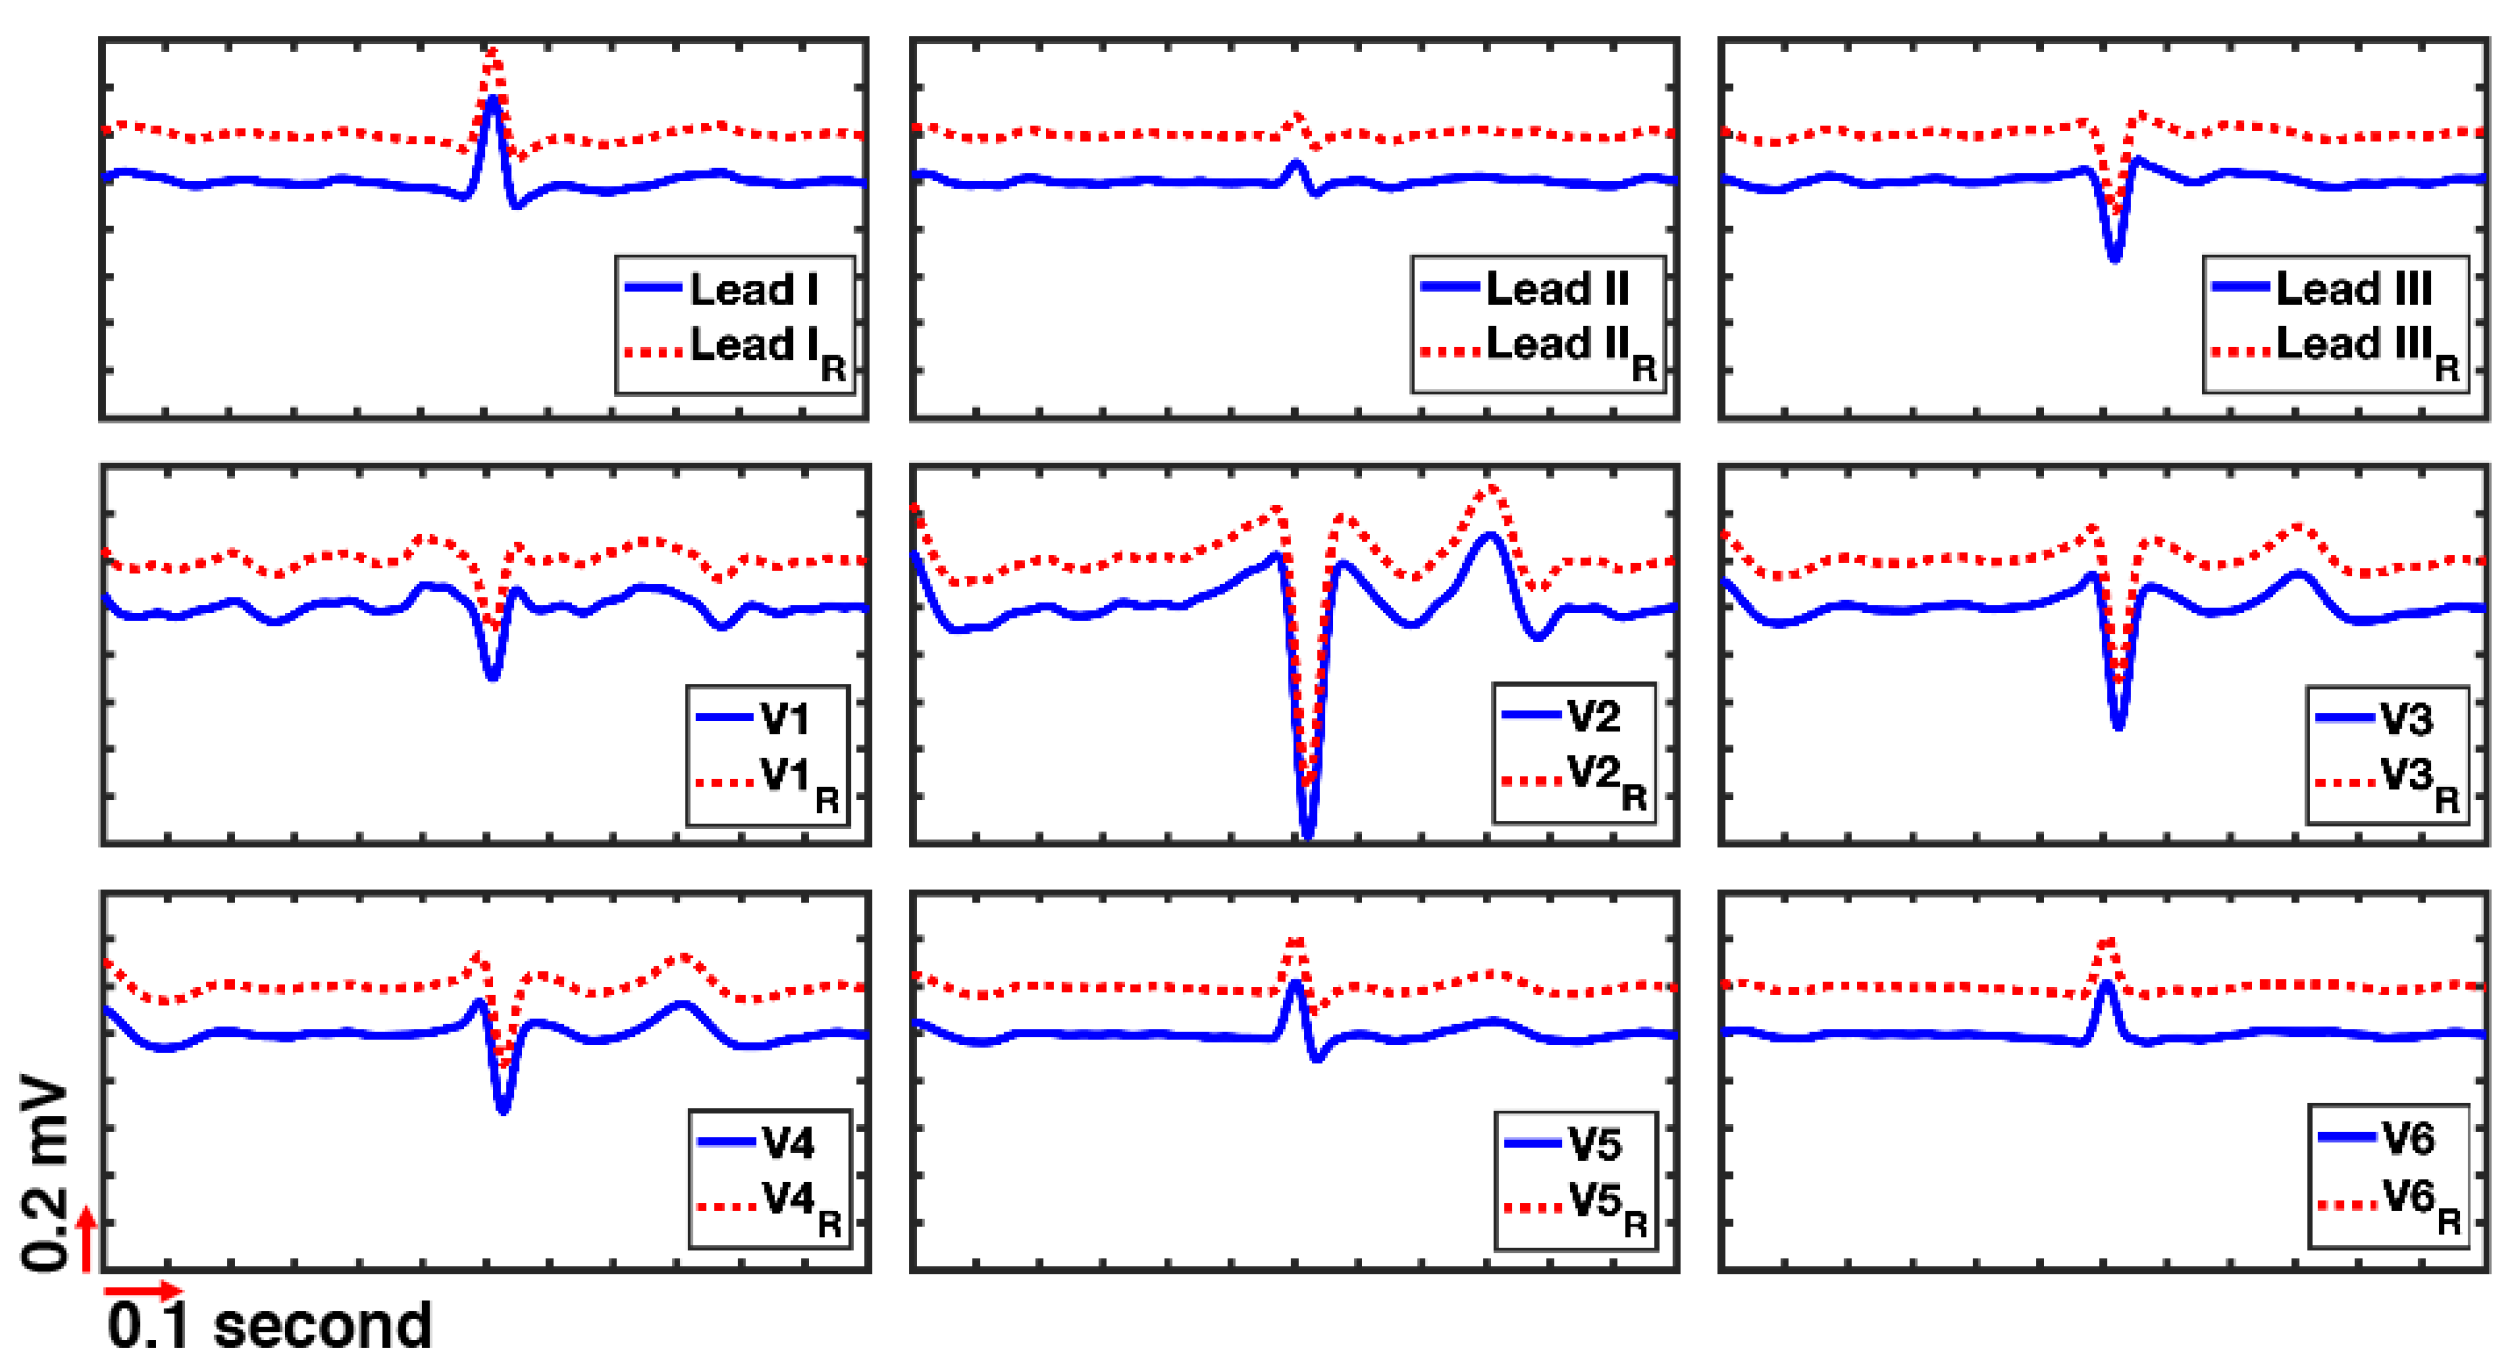
- Reconstructed precordials: the difference between the potential of chest electrodes (UV1:UV6) and measured WCT potential using our new ECG device . In this manuscript is referred to the chest leads, which are synthesized due to having difficulty in recording.
- Unipolar lead: voltage or potential of an electrode referred to the zero-reference point.
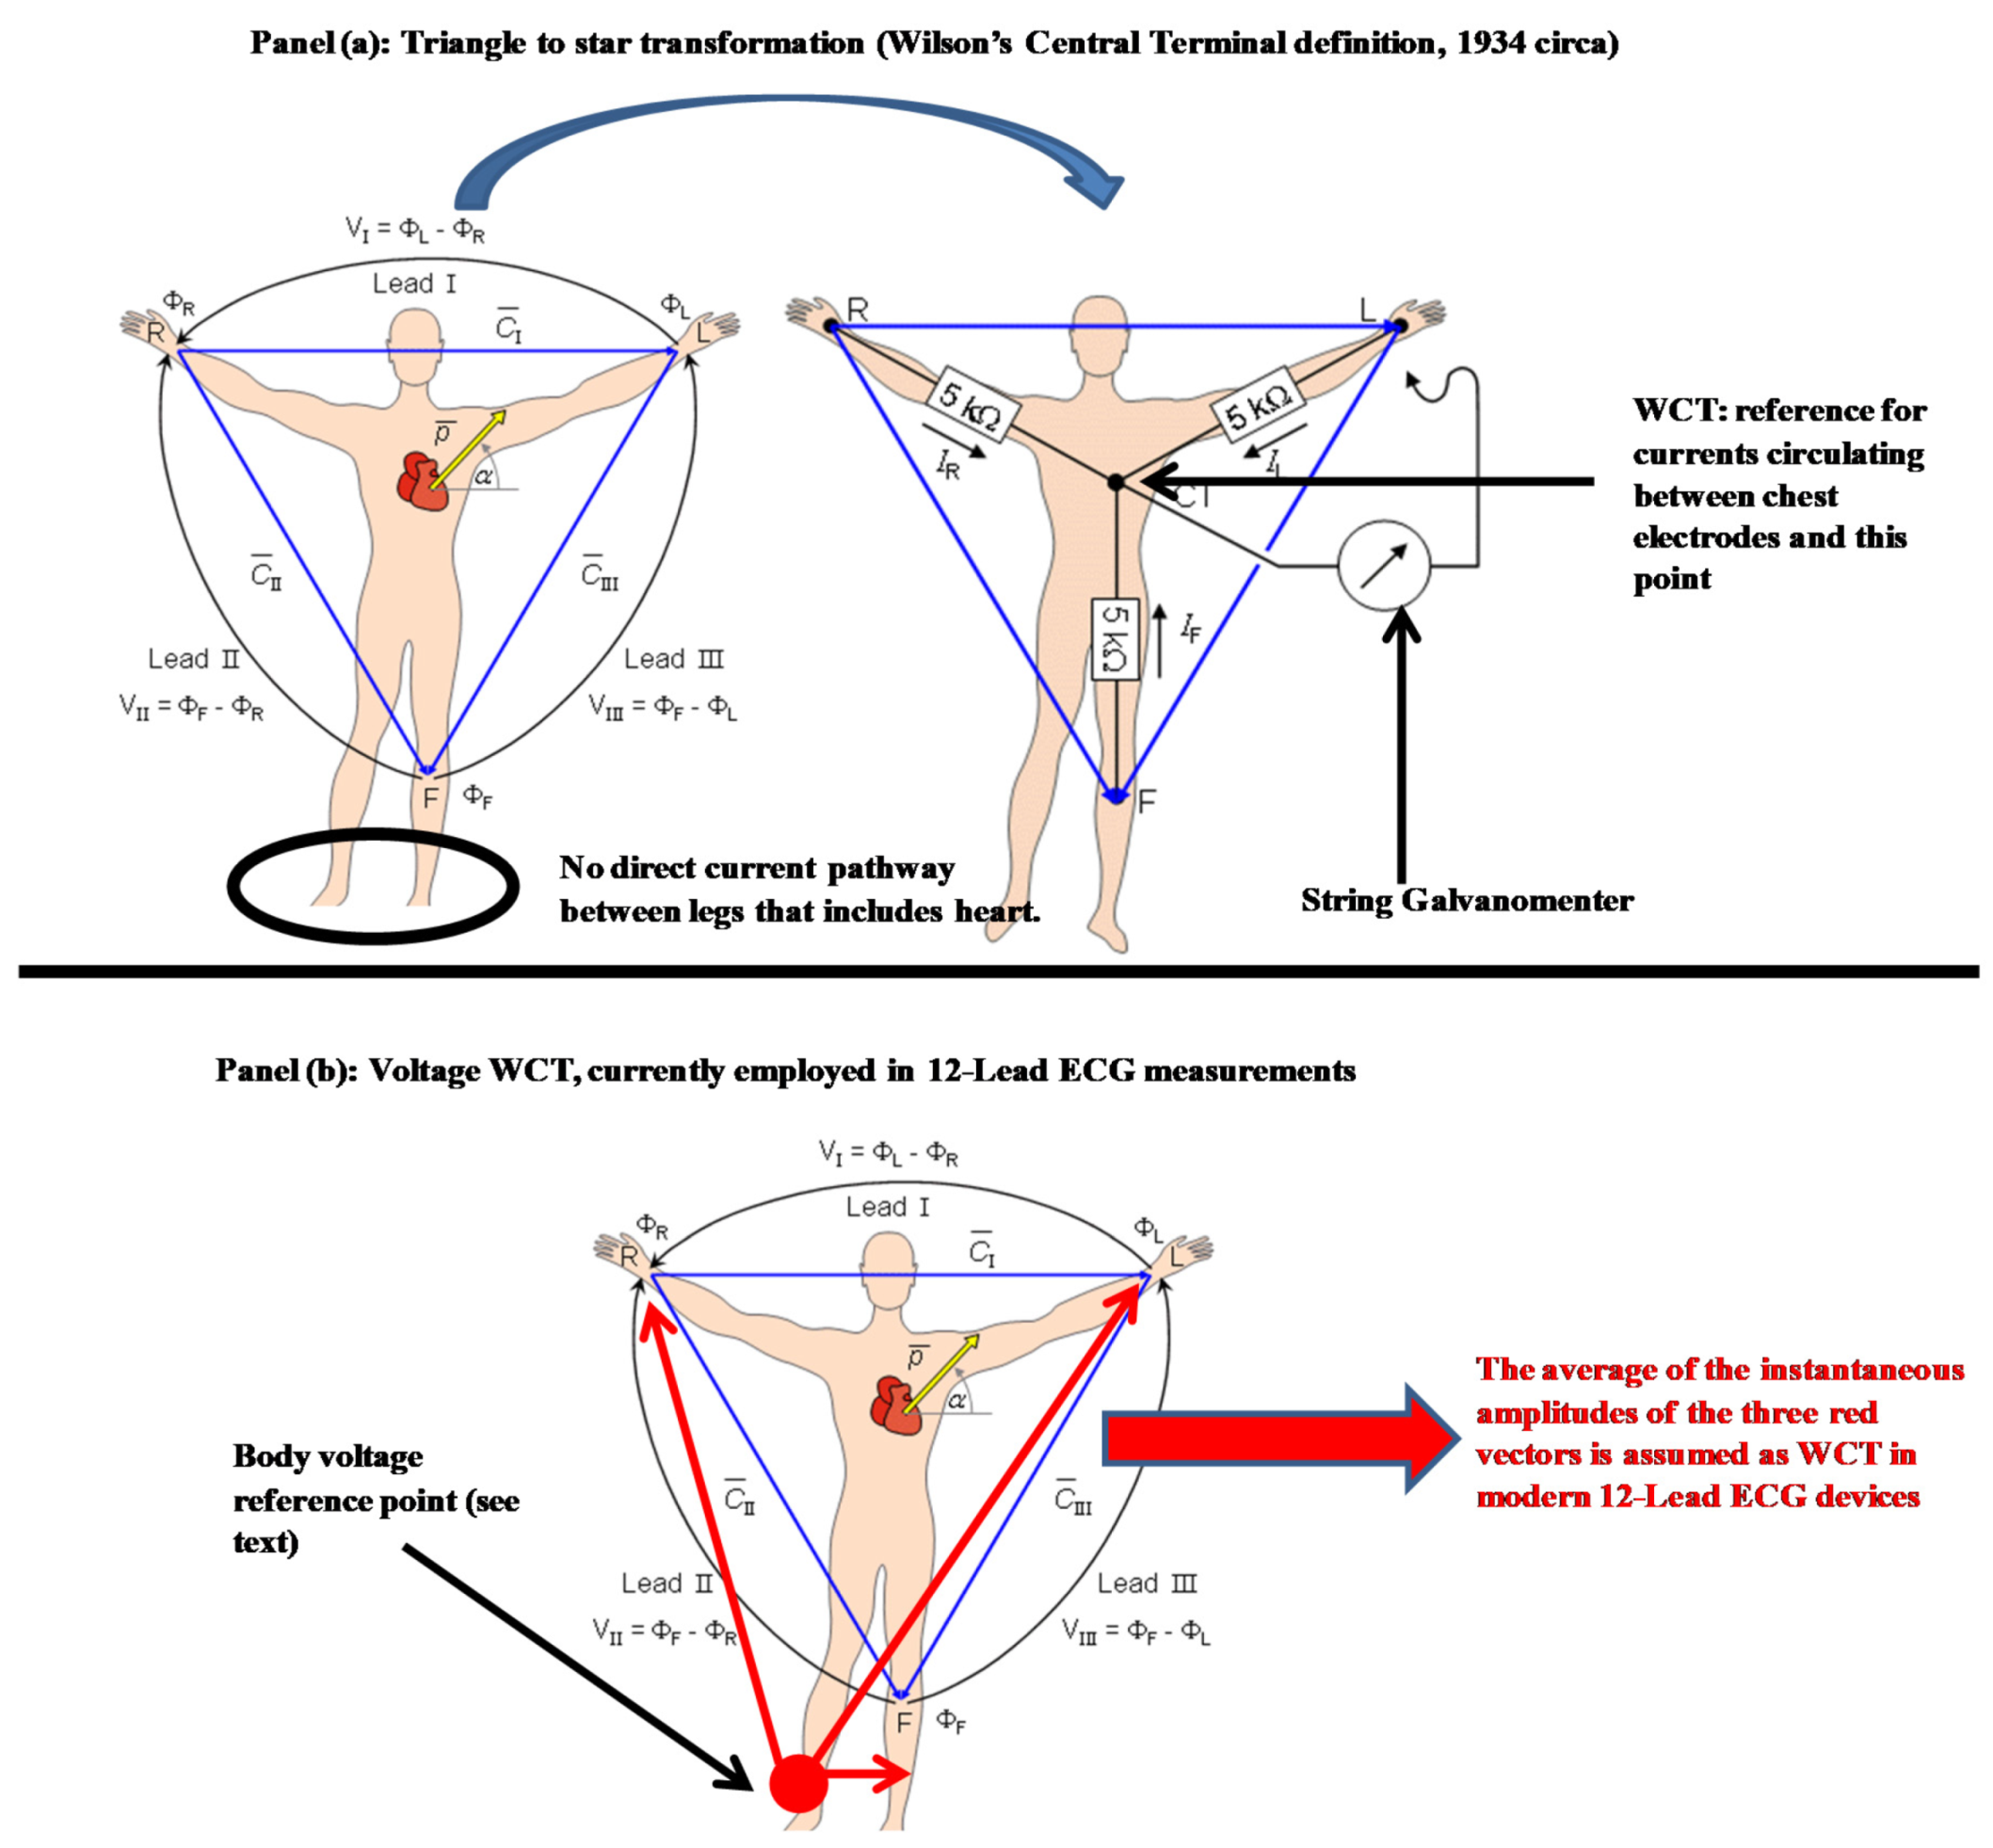
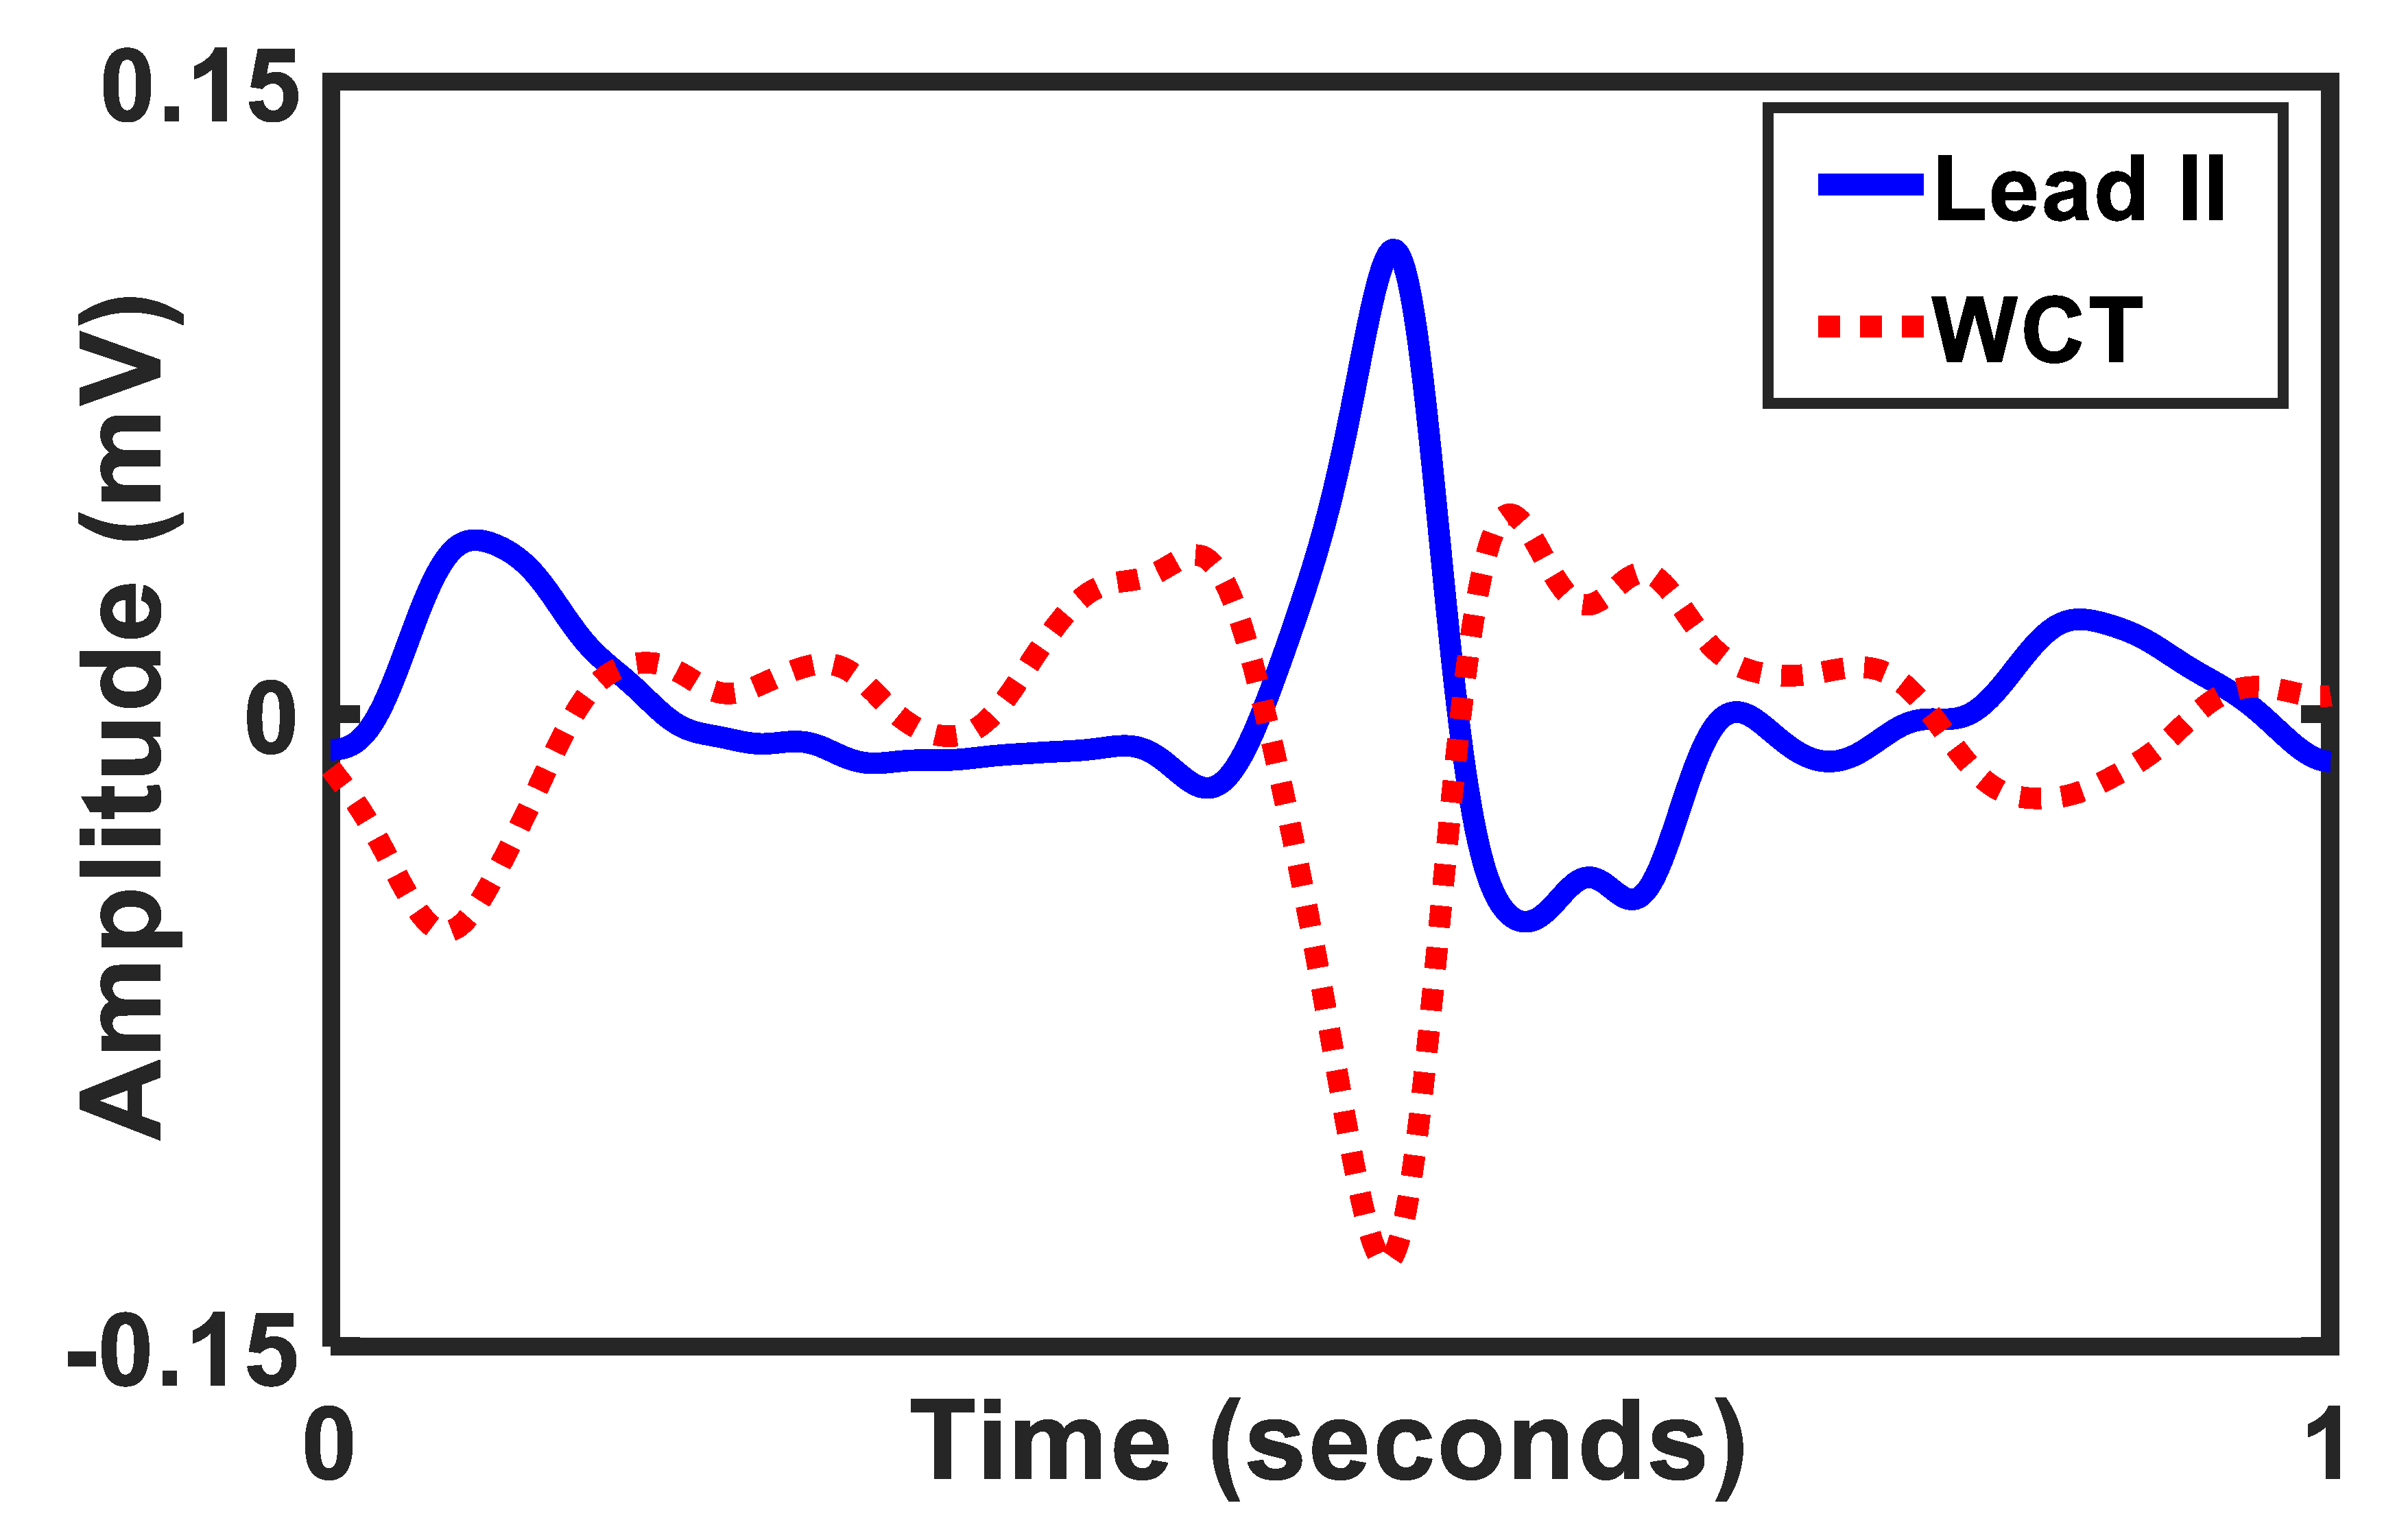
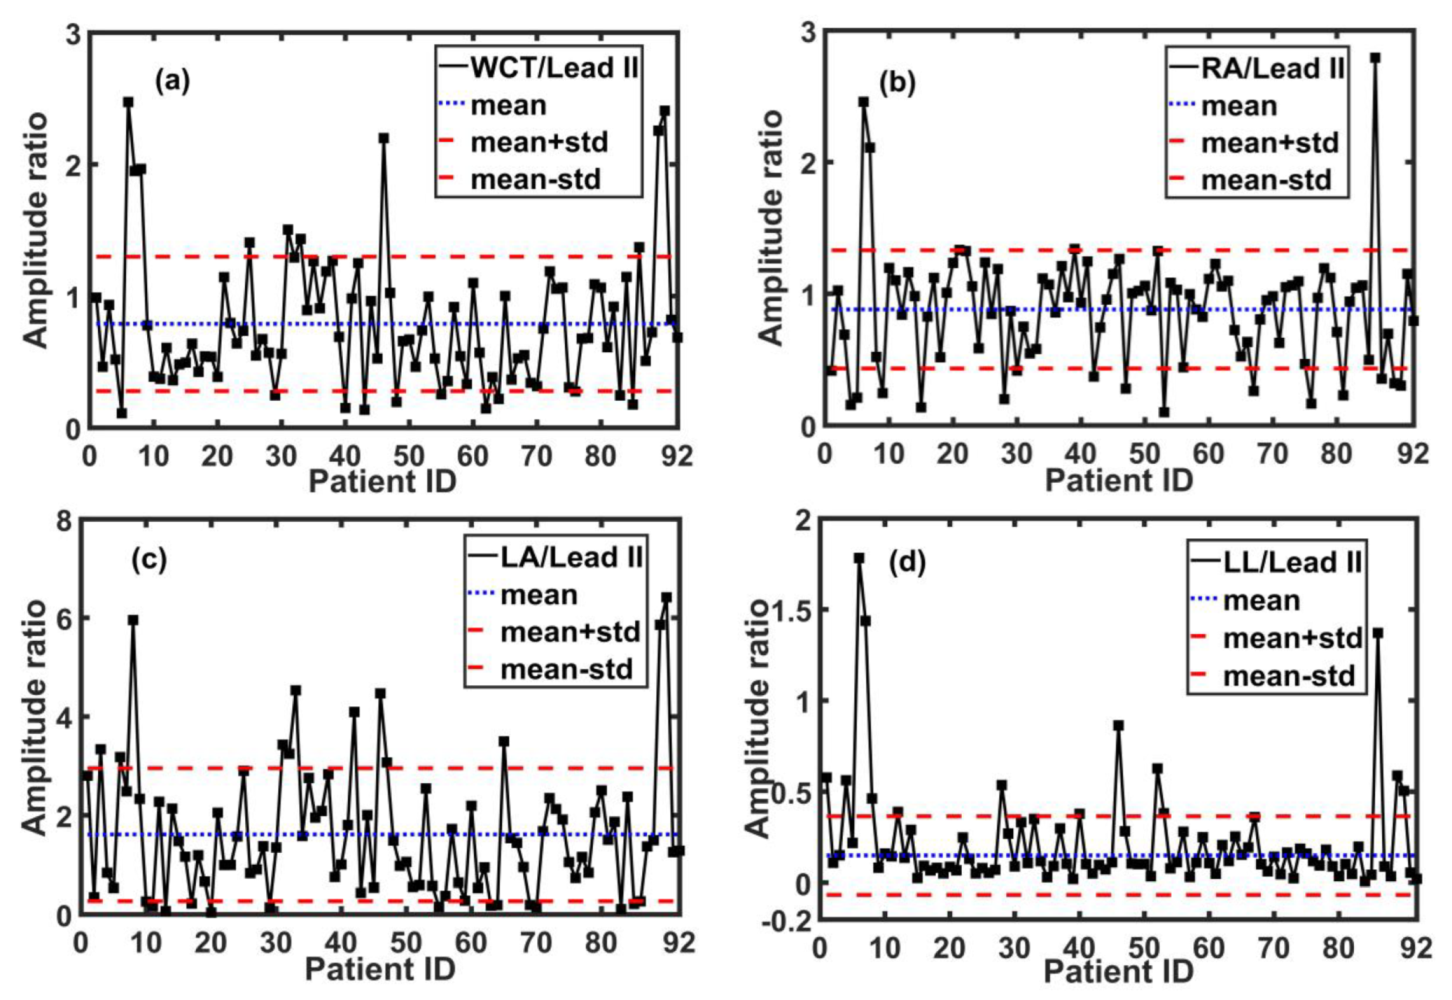
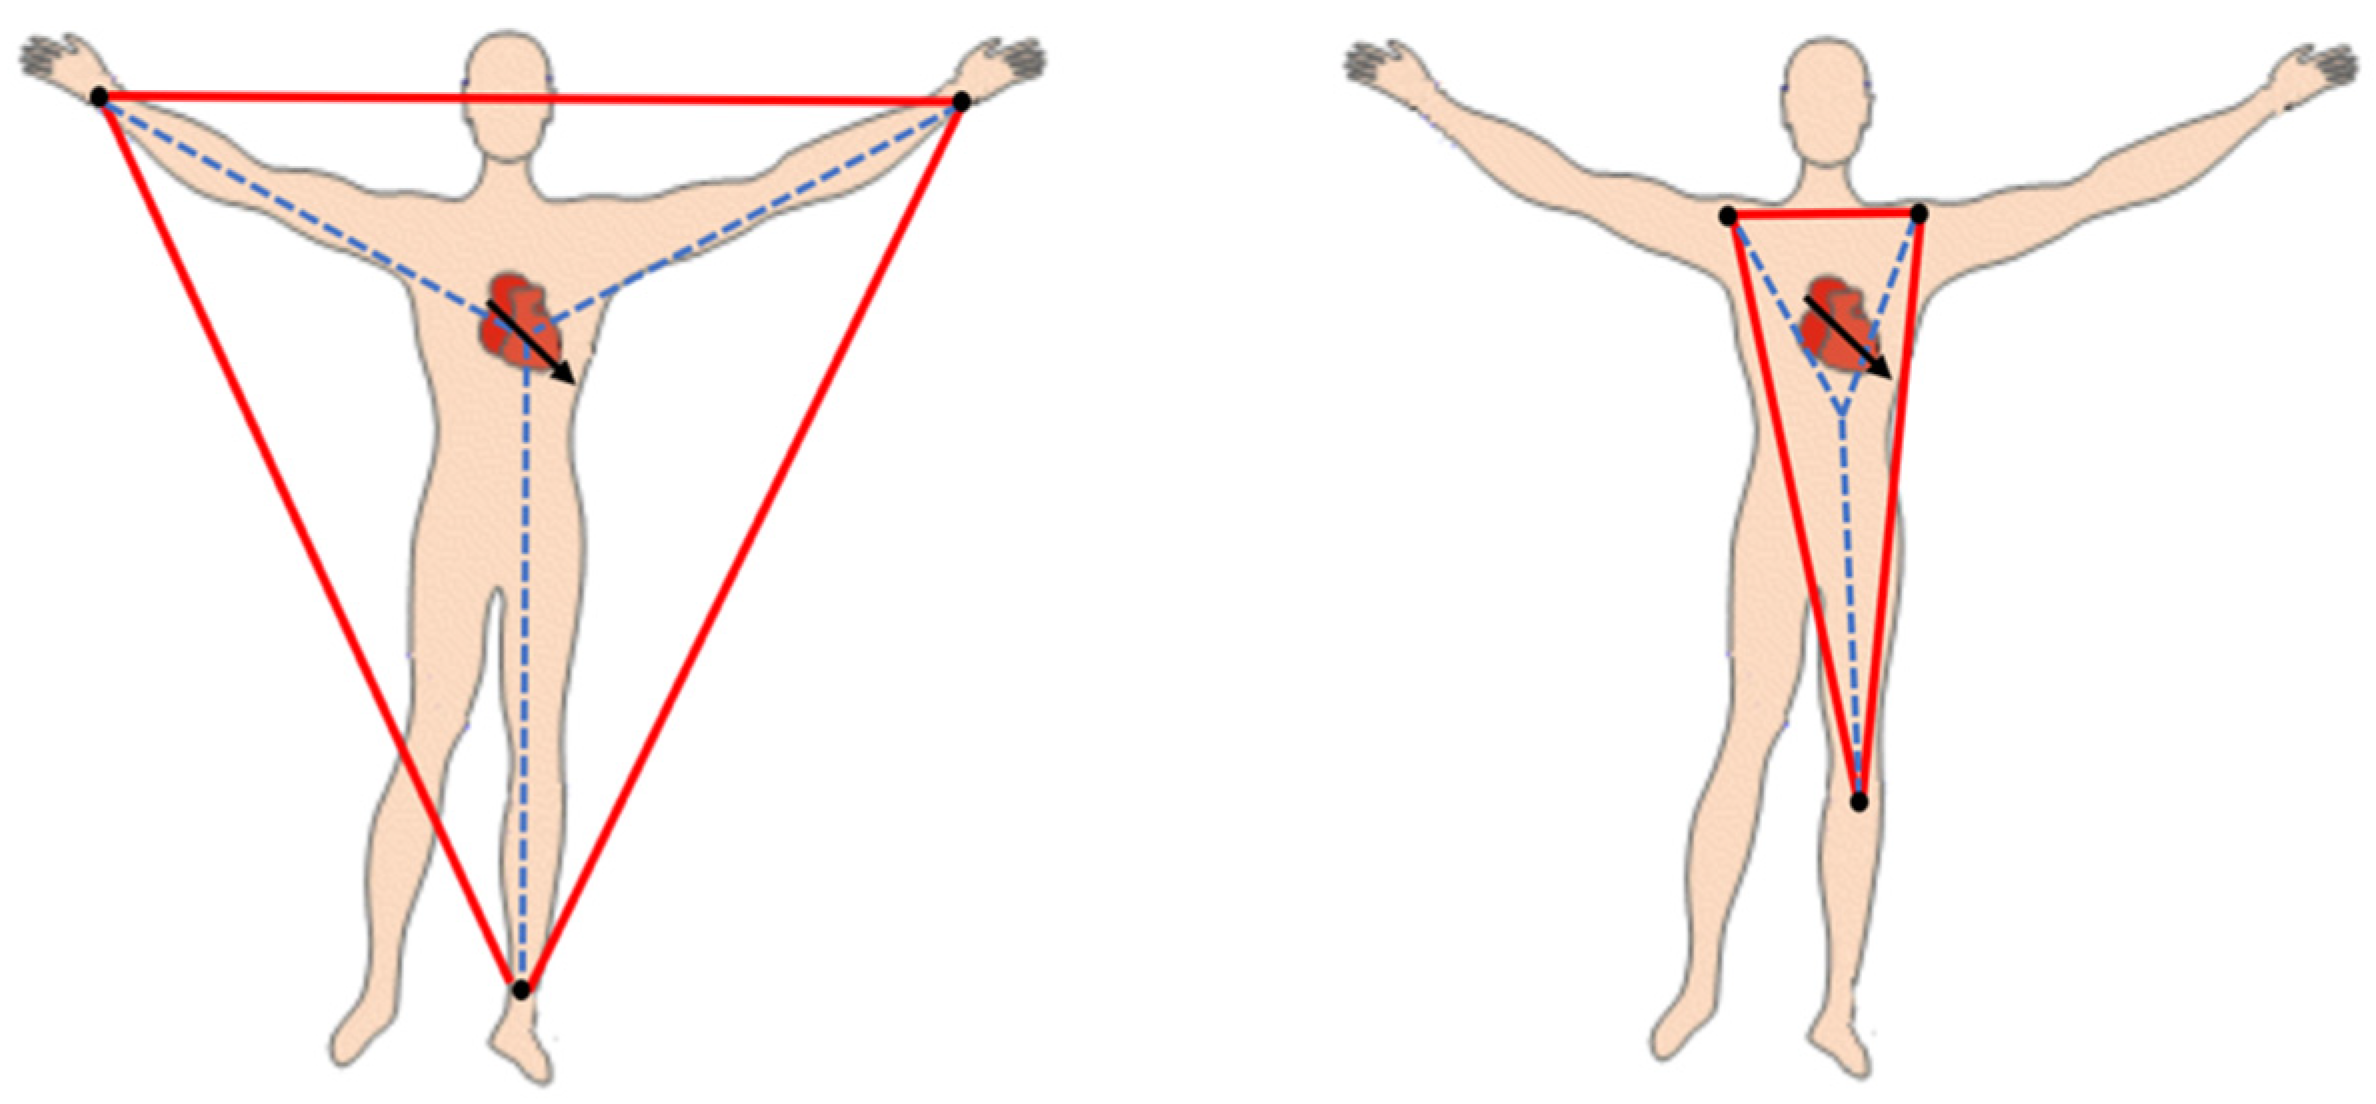
- Wilson’s Central Terminal: the imaginary reference point of the human body used to measure the precordial leads. Abbreviated as WCT. It is calculated by averaging the potential of right arm, left arm, and left leg, and has been assumed to have a zero amplitude.
References
- Gargiulo, G.D. True Unipolar ECG Machine for Wilson Central Terminal Measurements. Biomed Res. Int. 2015, 2015, 586397. [Google Scholar] [CrossRef]
- Malmivuo, J.; Plonsey, R. Bioelectromagnetism Principles and Applications of Bioelectric and Biomagnetic Fields; Oxford University Press: Oxford, UK, 1995; ISBN 9780195058239. [Google Scholar]
- Goldberger, E. A simple, indifferent, electrocardiographic electrode of zero potential and a technique of obtaining augmented, unipolar, extremity leads. Am. Heart J. 1942, 23, 483–492. [Google Scholar] [CrossRef]
- Wilson, F.N.; Johnston, F.D.; Macleod, A.G.; Barker, P.S. Electrocardiograms that represent the potential variations of a single electrode. Am. Heart J. 1934, 9, 447–458. [Google Scholar] [CrossRef]
- Gargiulo, G.D.G.; Bifulco, P.; Cesarelli, M.; McEwan, A.L.A.; Moeinzadeh, H.; O’Loughlin, A.; Shugman, I.I.M.; Tapson, J.C.J.; Thiagalingam, A. On the Einthoven Triangle: A Critical Analysis of the Single Rotating Dipole Hypothesis. Sensors 2018, 18, 2353. [Google Scholar] [CrossRef]
- Bacharova, L.; Selvester, R.H.; Engblom, H.; Wagner, G.S. Where is the central terminal located? In search of understanding the use of the Wilson central terminal for production of 9 of the standard 12 electrocardiogram leads. J. Electrocardiol. 2005, 38, 119–127. [Google Scholar] [CrossRef] [PubMed]
- Frank, E. General Theory of Heart-Vector Projection. Circ. Res. 1954, 2, 258–270. [Google Scholar] [CrossRef] [PubMed]
- Moeinzadeh, H.; Gargiulo, G. Wilson Central Terminal ECG Database (version 1.0.1). PhysioNet 2019. [Google Scholar] [CrossRef]
- Moeinzadeh, H.; Assad, J.; Bifulco, P.; Cesarelli, M.; McEwan, A.L.; O’Loughlin, A.; Shugman, I.M.; Tapson, J.C.; Thiagalingam, A.; Gargiulo, G.D. Unipolar Cardiac Leads between History and Science. In Biomedical Signal Processing; Springer: Singapore, Singapore, 2020; pp. 203–224. [Google Scholar]
- Goldberger, A.L.; Amaral, L.A.N.; Glass, L.; Hausdorff, J.M.; Ivanov, P.C.; Mark, R.G.; Mietus, J.E.; Moody, G.B.; Peng, C.-K.K.; Stanley, H.E. PhysioBank, PhysioToolkit, and PhysioNet: Components of a new research resource for complex physiologic signals. Circulation 2000, 101, e215–e220. [Google Scholar] [CrossRef]
- Moeinzadeh, H.; Gargiulo, G.; Bifulco, P.; Cesarelli, M.; O’Loughlin, A.; Shugman, M.I.; Thiagalingam, A. A Modern Wilson’s Central Terminal Electrocardiography Database. Hear. Lung Circ. 2018, 27, S293–S294. [Google Scholar] [CrossRef]
- Liu, F.; Liu, C.; Zhao, L.; Zhang, X.; Wu, X.; Xu, X.; Liu, Y.; Ma, C.; Wei, S.; He, Z.; et al. An Open Access Database for Evaluating the Algorithms of Electrocardiogram Rhythm and Morphology Abnormality Detection. J. Med. Imaging Heal. Informatics 2018, 8, 1368–1373. [Google Scholar] [CrossRef]
- Moody, G.B.; Mark, R.G. The impact of the MIT-BIH Arrhythmia Database. IEEE Eng. Med. Biol. Mag. 2001, 20, 45–50. [Google Scholar] [CrossRef]
- Bousseljot, R.; Kreiseler, D.; Schnabel, A. Nutzung der EKG-Signaldatenbank CARDIODAT der PTB über das Internet. Biomed. Tech. Eng. 2009, 317–318. [Google Scholar] [CrossRef]
- Sprague, M.A.; Geers, T.L. A spectral-element/finite-element analysis of a ship-like structure subjected to an underwater explosion. Comput. Methods Appl. Mech. Eng. 2006, 195, 2149–2167. [Google Scholar] [CrossRef]
- Geers, T.L. An objective error measure for the comparison of calculated and measured transient response histories. Shock Vib. Bull. 1984, 54, 99–107. [Google Scholar]
- Gargiulo, G.D.G.; Bifulco, P.; Cesarelli, M.; McEwan, A.L.A.; Moeinzadeh, H.; O’Loughlin, A.; Shugman, I.M.I.I.M.; Tapson, J.C.J.; Thiagalingam, A. On the “Zero of Potential of the Electric Field Produced by the Heart Beat”. A Machine Capable of Estimating this Underlying Persistent Error in Electrocardiography. Machines 2016, 4, 18. [Google Scholar] [CrossRef]
- Moeinzadeh, H.; Gargiulo, G.D.; Bifulco, P.; Cesarelli, M.; McEwan, A.L.; O’Loughlin, A.; Shugman, I.M.; Tapson, J.C.; Thiagalingam, A. Computing a new central terminal for ECG recording using combined genetic algorithm and linear regression from real patient data. In Proceedings of the Genetic and Evolutionary Computation Conference Companion, Berlin, Germany, 15–19 July 2017; ACM: New York, NY, USA, 2017; pp. 293–294. [Google Scholar]
- Bayley, R.H.; Reynolds, E.W.; Kinard, C.L.; Head, J.F. The zero of potential of the electric field produced by the heart beat; the problem with reference to homogenous volume conductors. Circ. Res. 1954, 2, 4–13. [Google Scholar] [CrossRef]
- Bayley, R.H.; Schmidt, A.E. The Problem of Adjusting the Wilson Central Terminal to a Zero of Potential in the Living Human Subject. Circ. Res. 1955, 3, 94–102. [Google Scholar] [CrossRef]
- Bayley, R.H.; Kinard, C.L. The zero of potential of the electrical field produced by the heart beat; the problem with reference to the living human subject. Circ. Res. 1954, 2, 104–111. [Google Scholar] [CrossRef]
- Gargiulo, G.D.; McEwan, A.L.; Bifulco, P.; Cesarelli, M.; Jin, C.; Tapson, J.; Thiagalingam, A.; van Schaik, A. Towards true unipolar ECG recording without the Wilson central terminal (preliminary results). Physiol. Meas. 2013, 34, 991–1012. [Google Scholar] [CrossRef]
- Burger, H.C. The zero of potential: A persistent error. Am. Heart J. 1955, 49, 581–586. [Google Scholar] [CrossRef]
- Wolferth, C.C.; Livezey, M.M. A study of methods of making so-called unipolar electrocardiograms. Am. Heart J. 1944, 27, 764–782. [Google Scholar] [CrossRef]
- Burger, R.; Wuhrmann, F. Ueber das elektrische Feld des Herzens. Cardiology 1939, 3, 56–138. [Google Scholar] [CrossRef]
- Wilson, F.N.; Johnston, F.D.; Rosenbaum, F.F.; Barker, P.S. On Einthoven’s triangle, the theory of unipolar electrocardiographic leads, and the interpretation of the precordial electrocardiogram. Am. Heart J. 1946, 32, 277–310. [Google Scholar] [CrossRef]
- Dolgin, M.; Grau, S.; Katz, L.N. Experimental studies on the validity of the central terminal of Wilson as an indifferent reference point. Am. Heart J. 1949, 37, 868–880. [Google Scholar] [CrossRef]
- Okamoto, Y.; Mashima, S. The zero potential and Wilson’s central terminal in electrocardiography. Bioelectrochemistry Bioenerg. 1998, 47, 291–295. [Google Scholar] [CrossRef]
- Farrell, R.M.; Syed, A.; Syed, A.; Gutterman, D.D. Effects of limb electrode placement on the 12- and 16-lead electrocardiogram. J. Electrocardiol. 2008, 41, 536–545. [Google Scholar] [CrossRef]
- Krasteva, V.; Jekova, I.; Schmid, R. Simulating arbitrary electrode reversals in standard 12-lead ECG. Sensors 2019, 19, 2920. [Google Scholar] [CrossRef]


| Signals | I-raw | I | limb lead I |
| II-raw | II | limb lead II | |
| III-raw | III | limb lead III | |
| V1-raw:V6-raw | V1:V6 | precordial leads | |
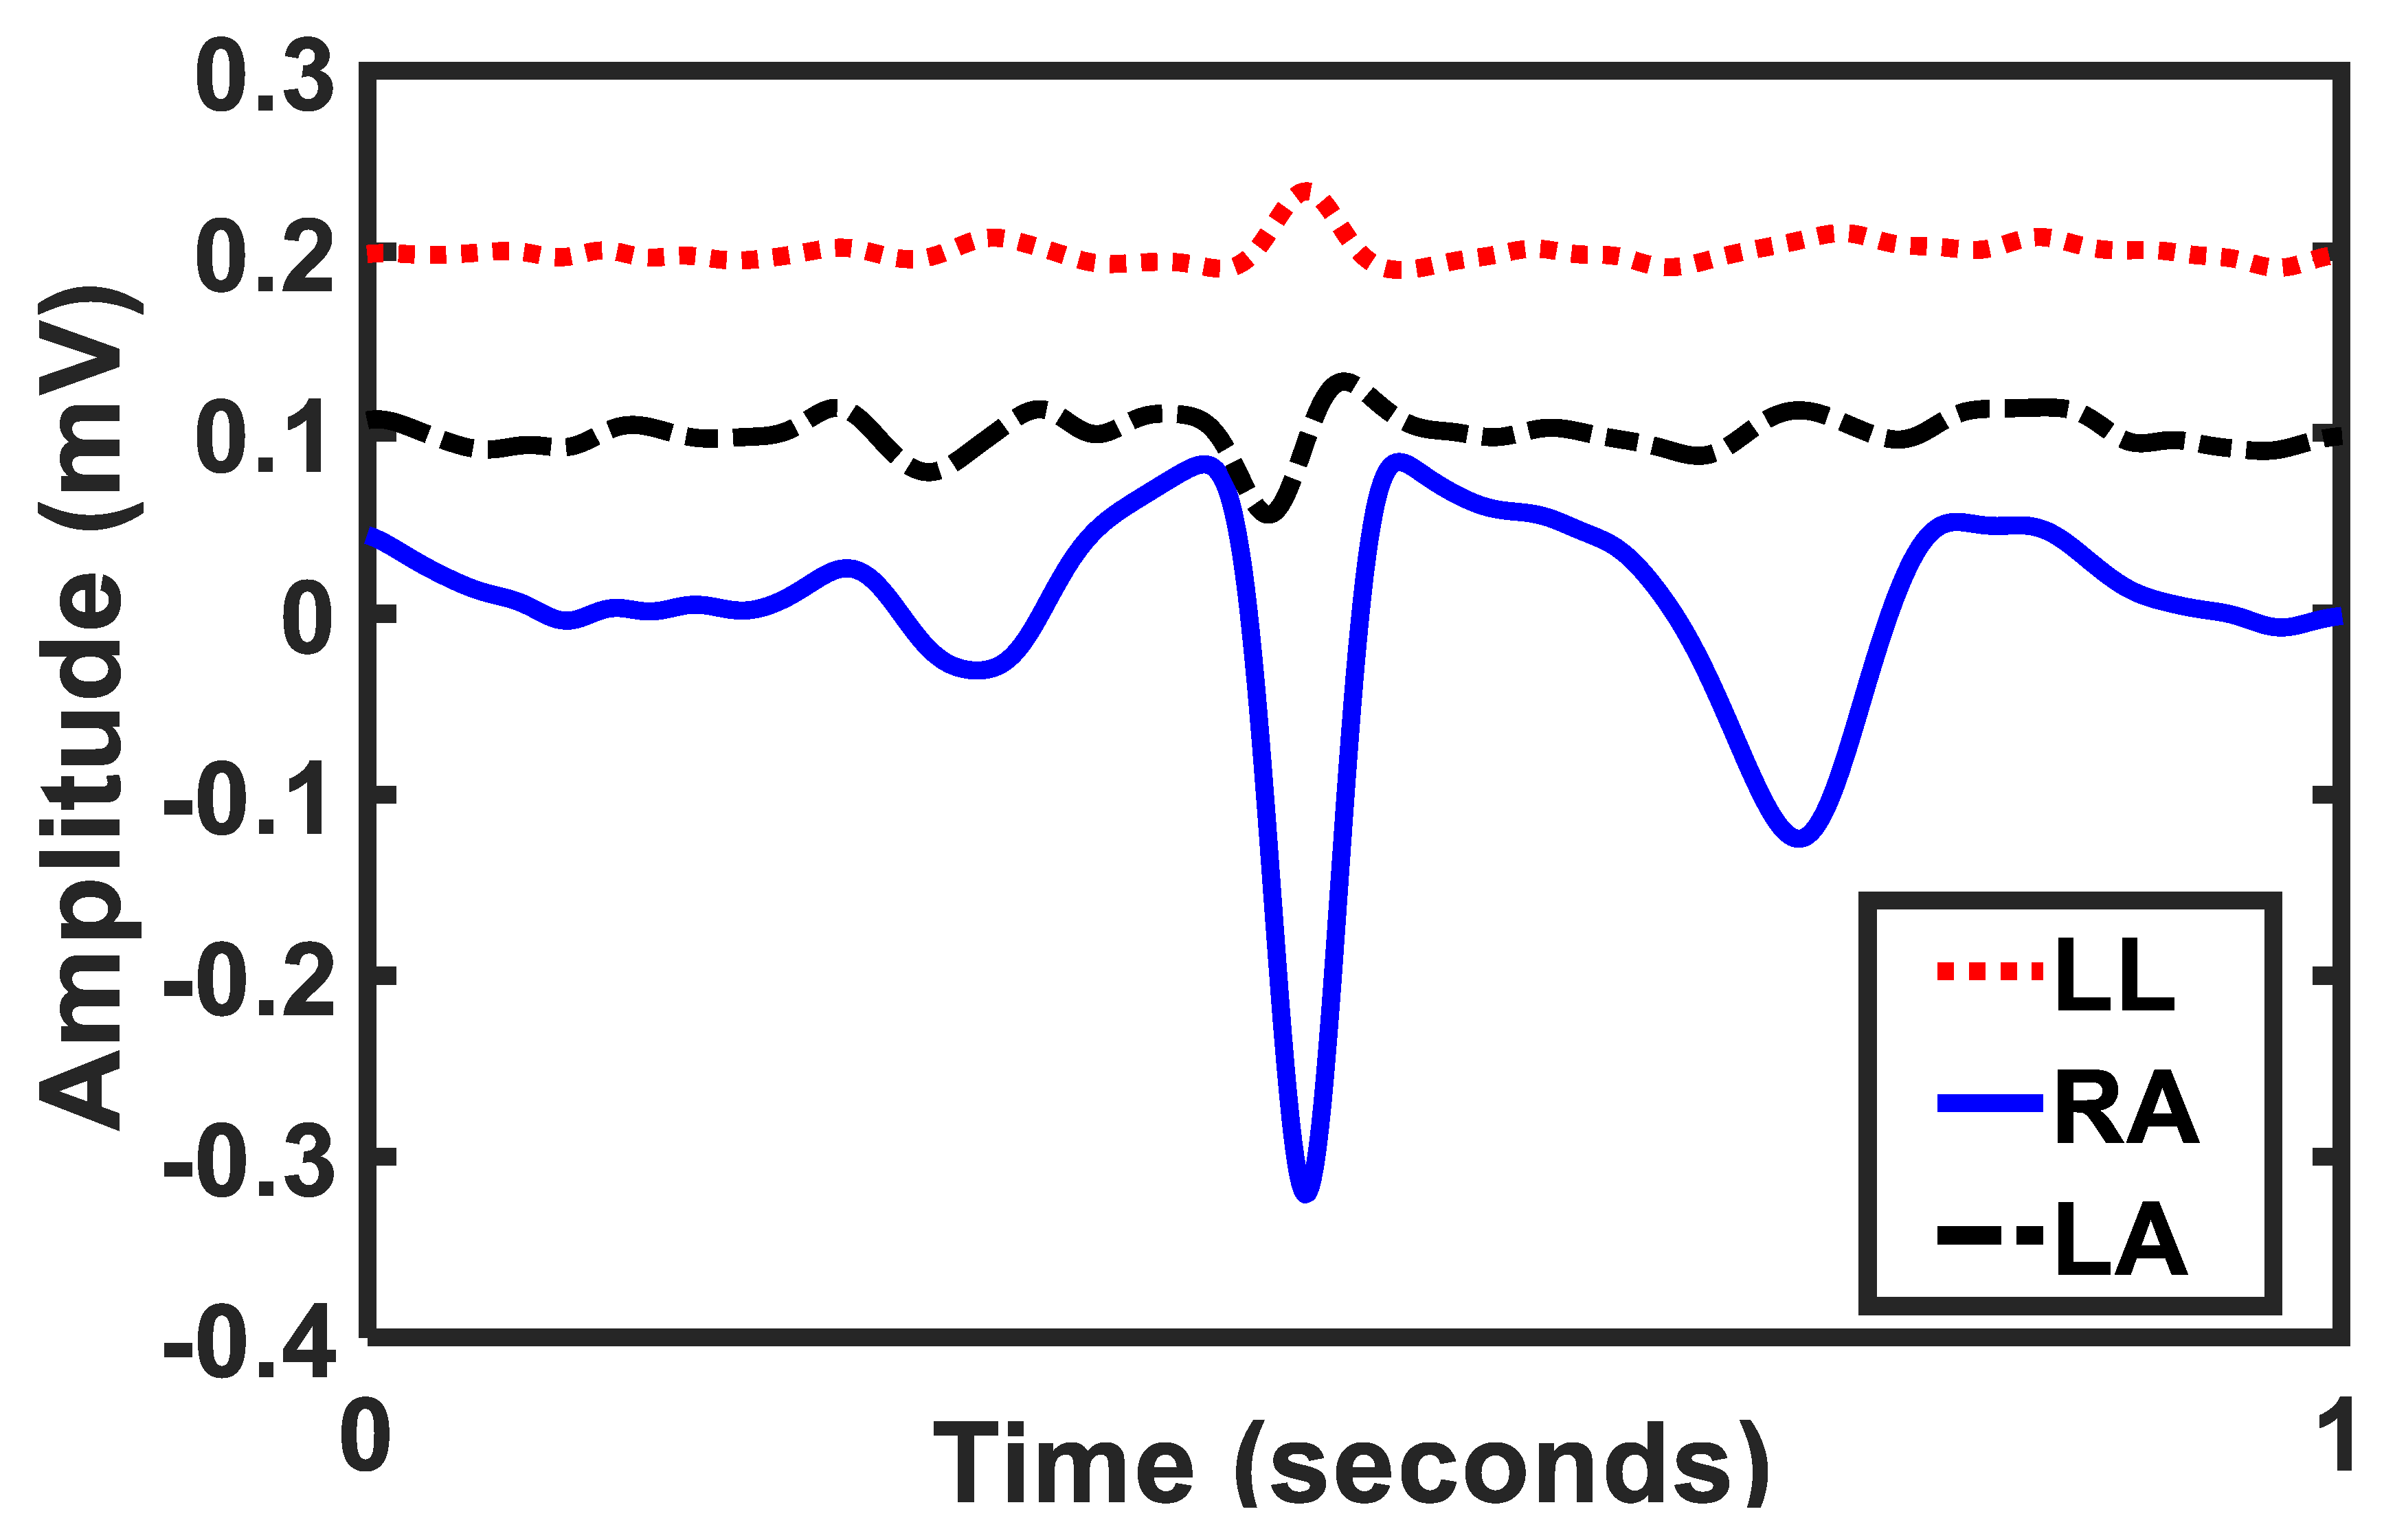
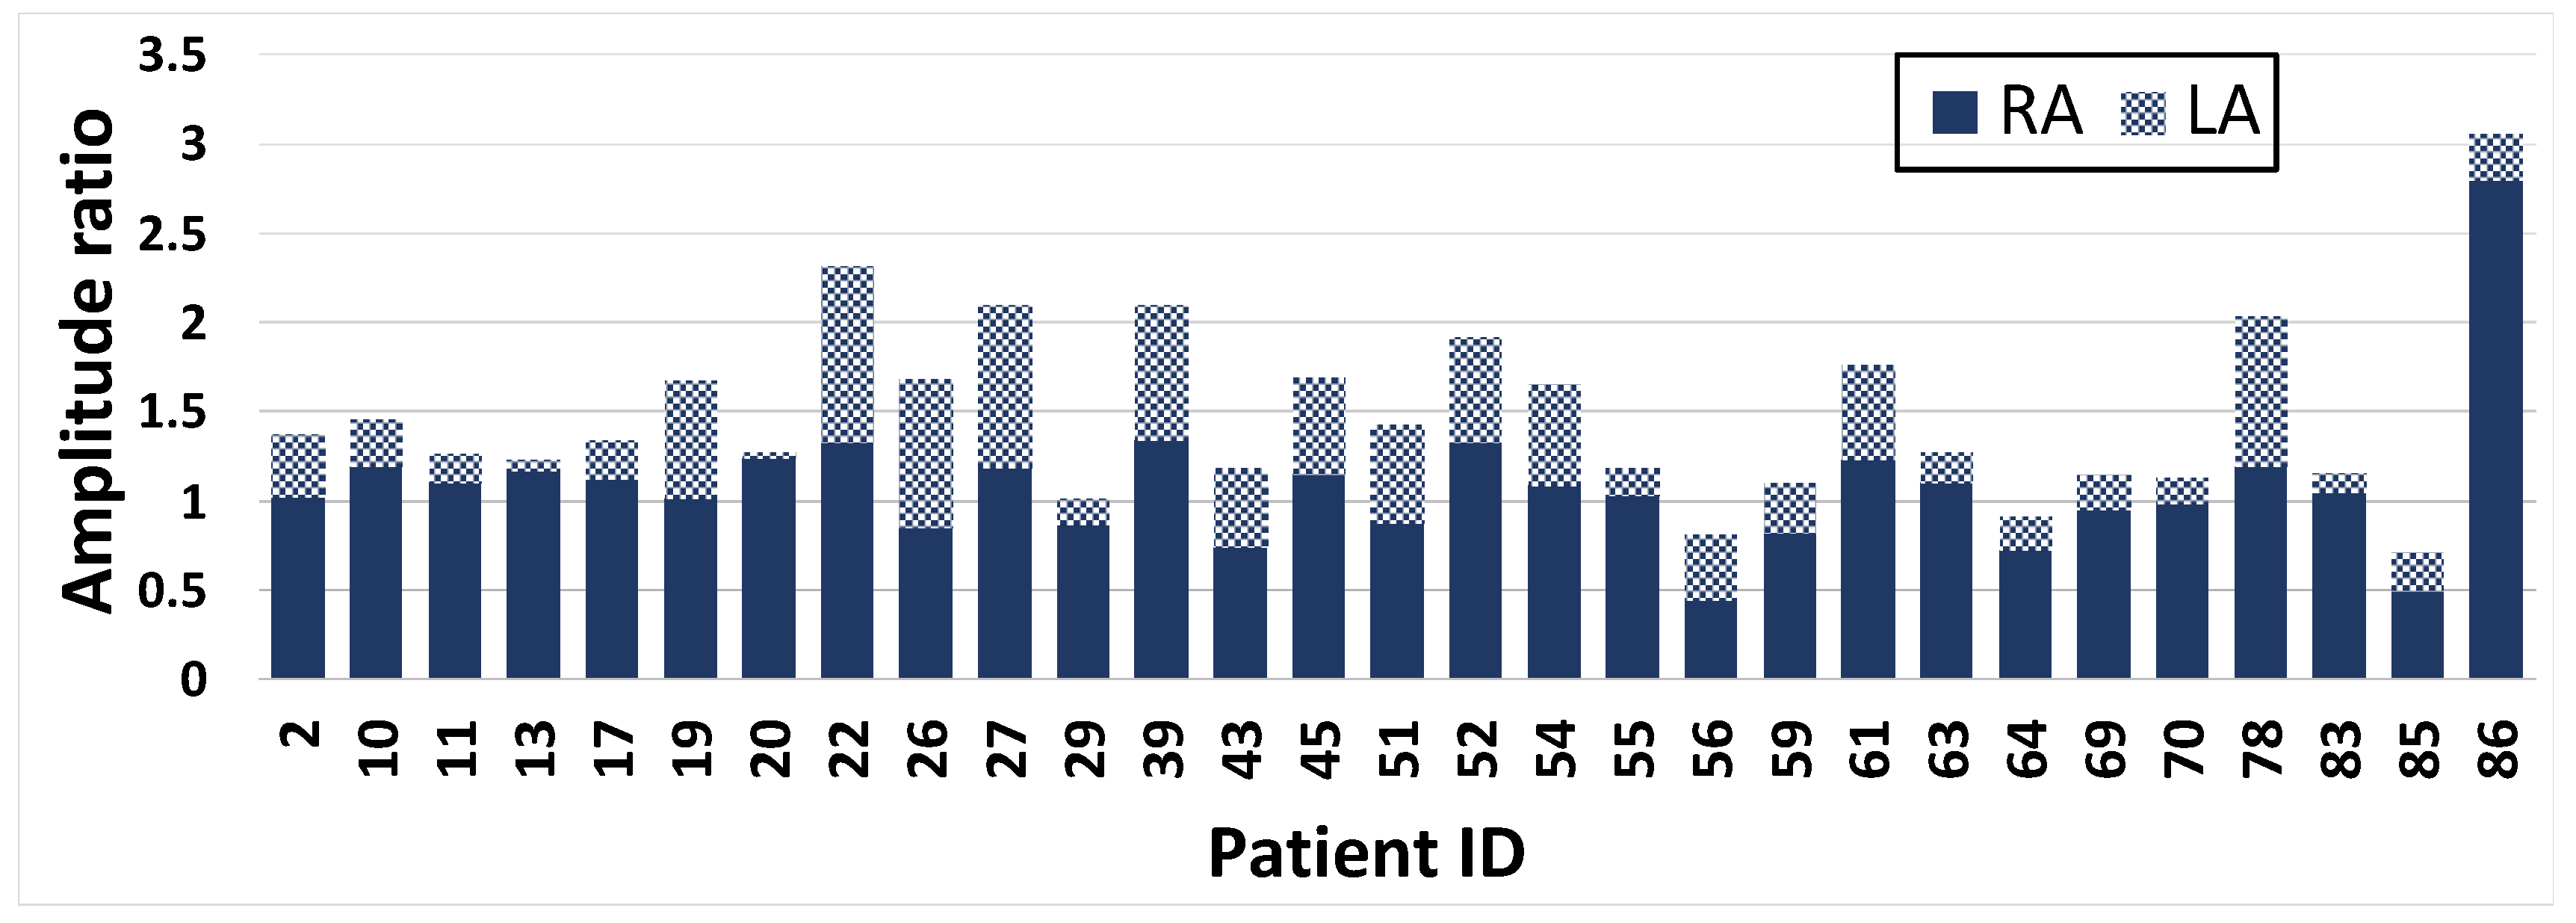
| LA-raw, RA-raw, LL-raw | LA, RA, LL | three WCT components | |
| UV1-raw:UV6-raw | UV1:UV6 | unipolar chest leads | |
| WCT | the WCT signal | ||
| Detail | Age Gender Patient diagnosis Reconstructed precordials * | ||
| Patient Diagnosis | Count | Patient Diagnosis | Count |
|---|---|---|---|
| Angina | 1 | Non-ST segment elevation myocardial infarction (NSTEMI) | 23 |
| Atrial fibrillation | 9 | Pulmonary embolism-Atrial fibrillation | 1 |
| Atrial flutter | 1 | Pulmonary embolism | 1 |
| Atypical chest pain | 5 | Rapid atrial fibrillation with new cardiomyopathy | 1 |
| Cardiomyopathy | 1 | Rapid atrial fibrillation-pericarditis | 1 |
| Chest pain | 1 | Severe Mitral Stenosis | 1 |
| Complete Heart block | 1 | Sinus bradycardia | 2 |
| Congestive cardiac failure (CHF) exacerbation | 1 | Slow atrial fibrillation | 1 |
| Congestive cardiac failure (CCF) | 1 | ST segment elevation myocardial infarction (STEMI) | 4 |
| Coronary artery disease | 3 | Stable angina | 7 |
| Epigastric pain | 1 | Supraventricular tachycardia (SVT) | 2 |
| Fall secondary to alcohol intoxication | 1 | Syncope | 3 |
| Gastritis (non-cardiac chest pain) | 1 | Unstable angina | 1 |
| Hypertrophic obstructive cardiomyopathy | 1 | Urosepsis | 1 |
| Inferior ST segment elevation myocardial infarction (STEMI) | 1 | Ventricular tachycardia (VT) | 3 |
| Myocardial infarction-Type 2 | 1 | Not reported | 10 |
| Patient ID | Segment ID | Reconstructed Precordial Leads |
|---|---|---|
| Patient7 | Seg1 | V2, V2-raw |
| Seg2 | V2, V2-raw | |
| Seg3 | V1, V1-raw | |
| Patient8 | Seg1 | V1, V2, V1-raw, V2-raw |
| Seg2 | V1, V2, V1-raw, V2-raw | |
| Patient10 | Seg1 | V2, V2-raw |
| Patient14 | Seg1 | V2, V2-raw |
| Patient31 | Seg1 | V2, V2-raw |
| Lead I | Lead II | Lead III | V1 | V2 | V3 | V4 | V5 | V6 | |
|---|---|---|---|---|---|---|---|---|---|
| MS&G | 0.012 | 0.013 | 0.023 | 0.017 | 0.026 | 0.020 | 0.019 | 0.018 | 0.023 |
| PS&G | 0 | 0 | 0 | 0 | 0 | 0 | 0 | 0 | 0 |
| CS&G | 0.012 | 0.013 | 0.023 | 0.017 | 0.026 | 0.020 | 0.019 | 0.018 | 0.023 |
| Correlation | 0.998 | 0.997 | 0.995 | 0.992 | 0.995 | 0.998 | 0.998 | 0.997 | 0.996 |
© 2020 by the authors. Licensee MDPI, Basel, Switzerland. This article is an open access article distributed under the terms and conditions of the Creative Commons Attribution (CC BY) license (http://creativecommons.org/licenses/by/4.0/).
Share and Cite
Moeinzadeh, H.; Assad, J.; Bifulco, P.; Cesarelli, M.; O’Loughlin, A.; Tapson, J.C.; Shugman, I.M.; Thiagalingam, A.; Gargiulo, G.D. WCTECGdb: A 12-Lead Electrocardiography Dataset Recorded Simultaneously with Raw Exploring Electrodes’ Potential Directly Referred to the Right Leg. Sensors 2020, 20, 3275. https://doi.org/10.3390/s20113275
Moeinzadeh H, Assad J, Bifulco P, Cesarelli M, O’Loughlin A, Tapson JC, Shugman IM, Thiagalingam A, Gargiulo GD. WCTECGdb: A 12-Lead Electrocardiography Dataset Recorded Simultaneously with Raw Exploring Electrodes’ Potential Directly Referred to the Right Leg. Sensors. 2020; 20(11):3275. https://doi.org/10.3390/s20113275
Chicago/Turabian StyleMoeinzadeh, Hossein, Joseph Assad, Paolo Bifulco, Mario Cesarelli, Aiden O’Loughlin, Jonathan C. Tapson, Ibrahim M. Shugman, Aravinda Thiagalingam, and Gaetano D. Gargiulo. 2020. "WCTECGdb: A 12-Lead Electrocardiography Dataset Recorded Simultaneously with Raw Exploring Electrodes’ Potential Directly Referred to the Right Leg" Sensors 20, no. 11: 3275. https://doi.org/10.3390/s20113275
APA StyleMoeinzadeh, H., Assad, J., Bifulco, P., Cesarelli, M., O’Loughlin, A., Tapson, J. C., Shugman, I. M., Thiagalingam, A., & Gargiulo, G. D. (2020). WCTECGdb: A 12-Lead Electrocardiography Dataset Recorded Simultaneously with Raw Exploring Electrodes’ Potential Directly Referred to the Right Leg. Sensors, 20(11), 3275. https://doi.org/10.3390/s20113275