Effects of Thermal Cycles on Interfacial Pressure in MV Cable Joints †


Abstract
1. Introduction
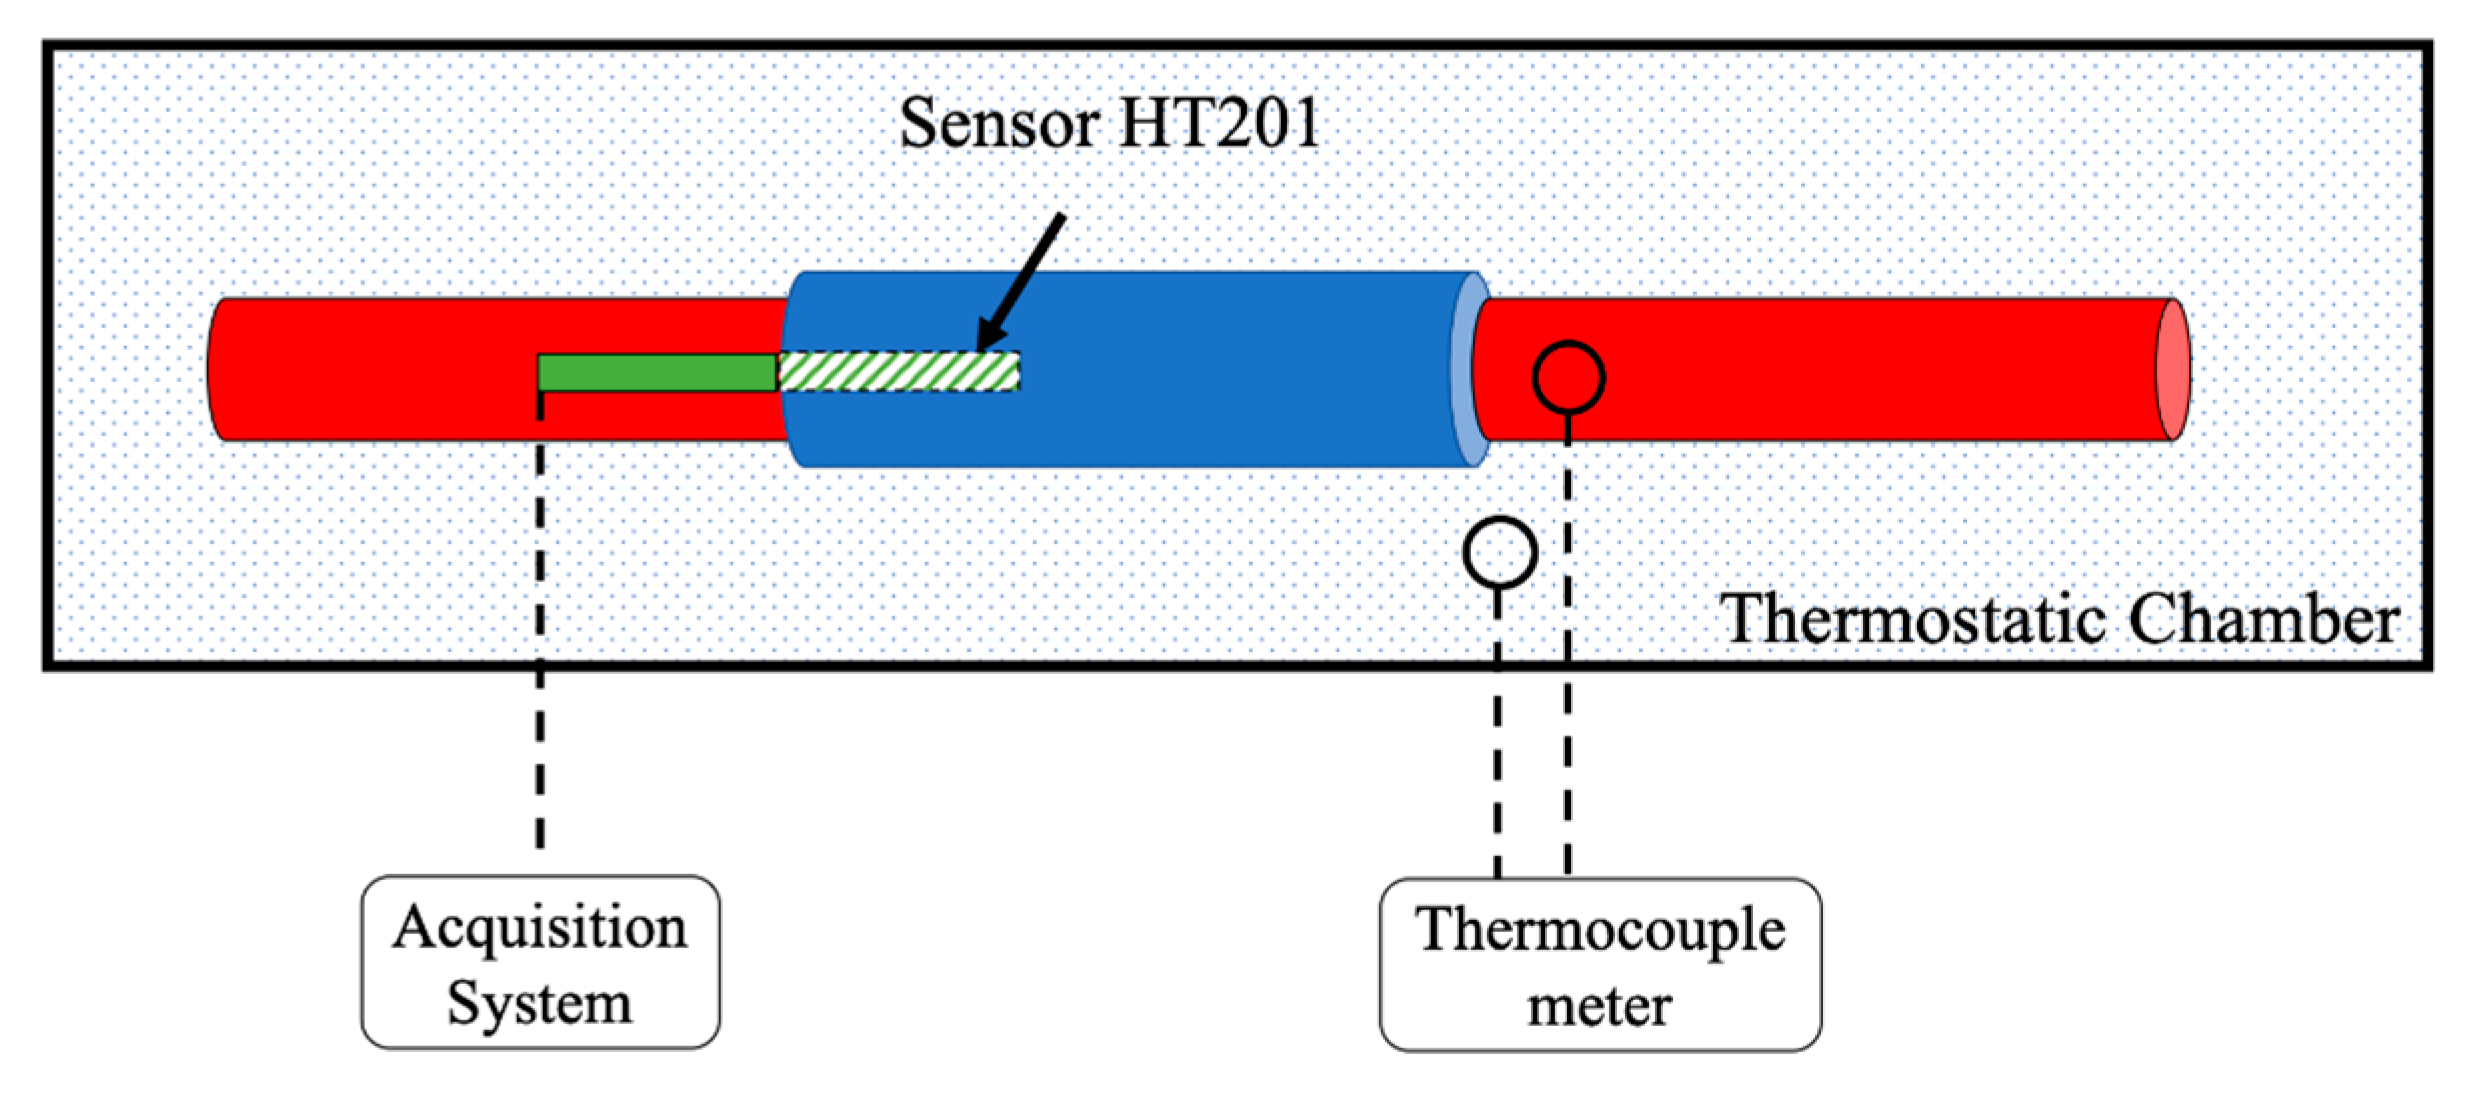
2. Measurement Setup
2.1. Overview
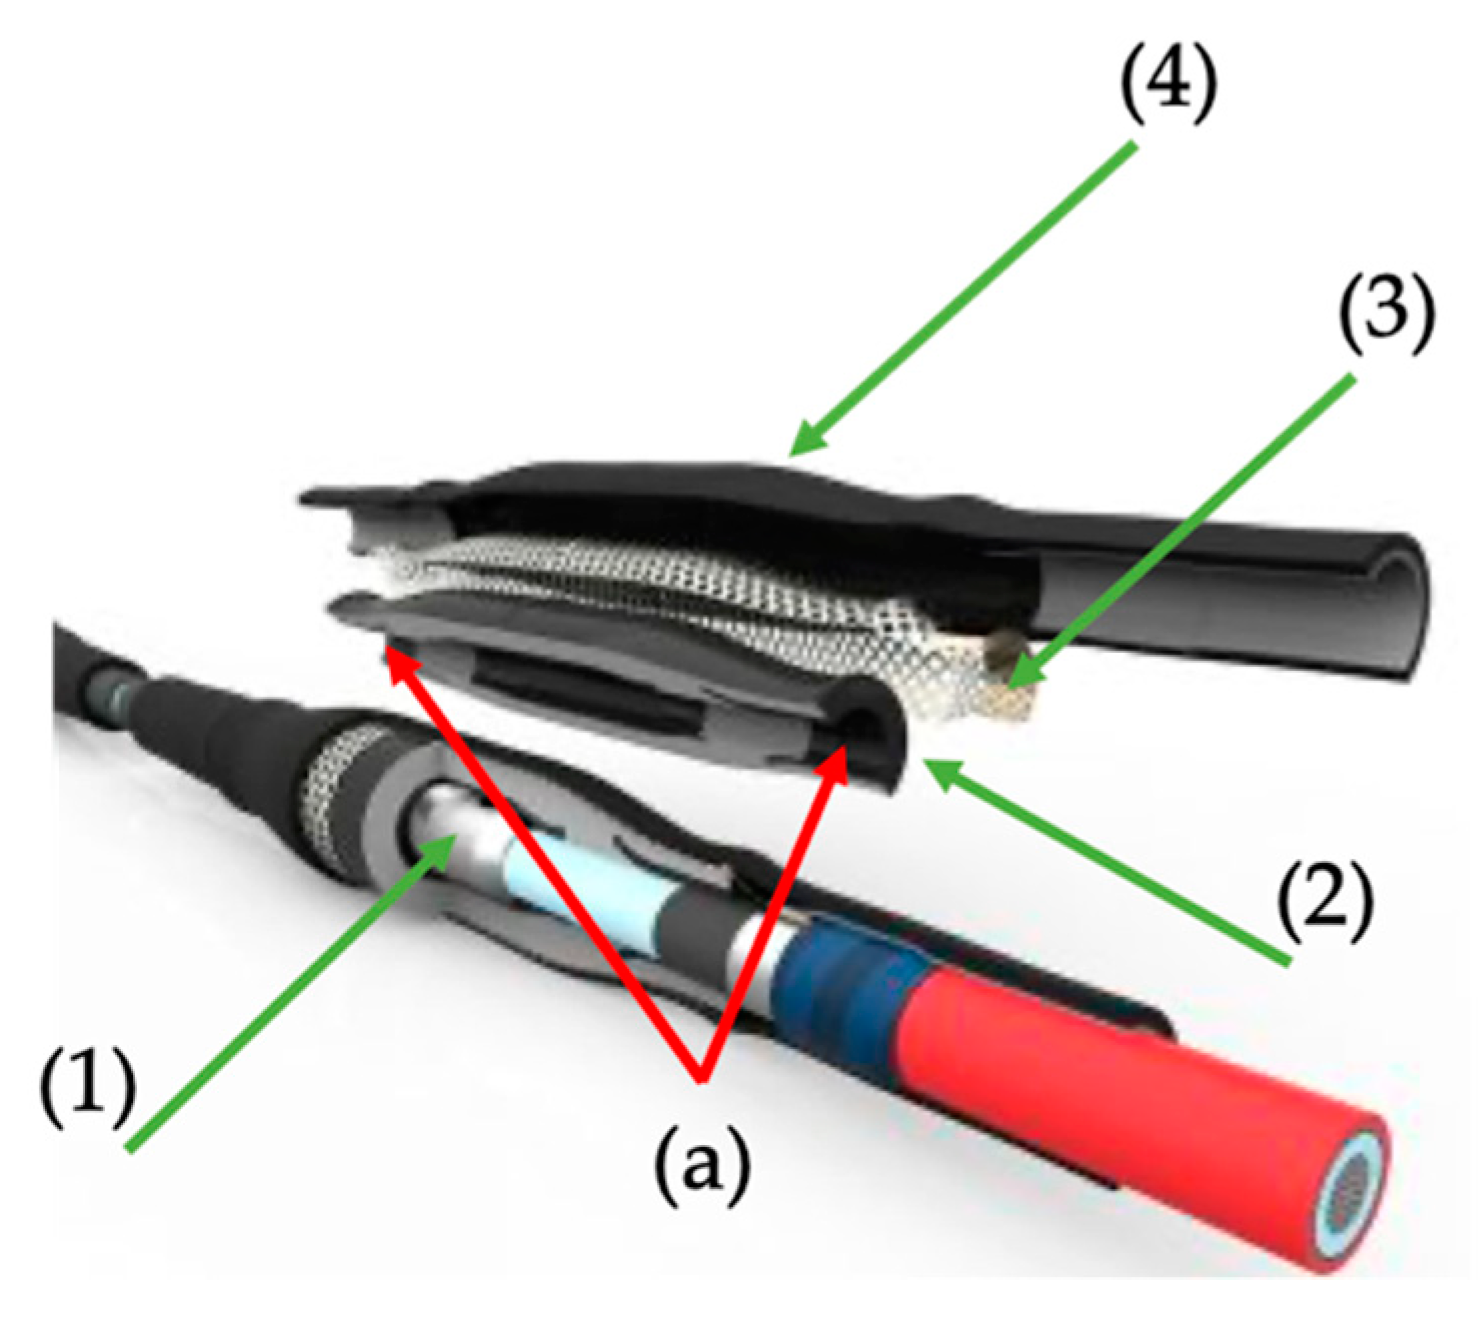
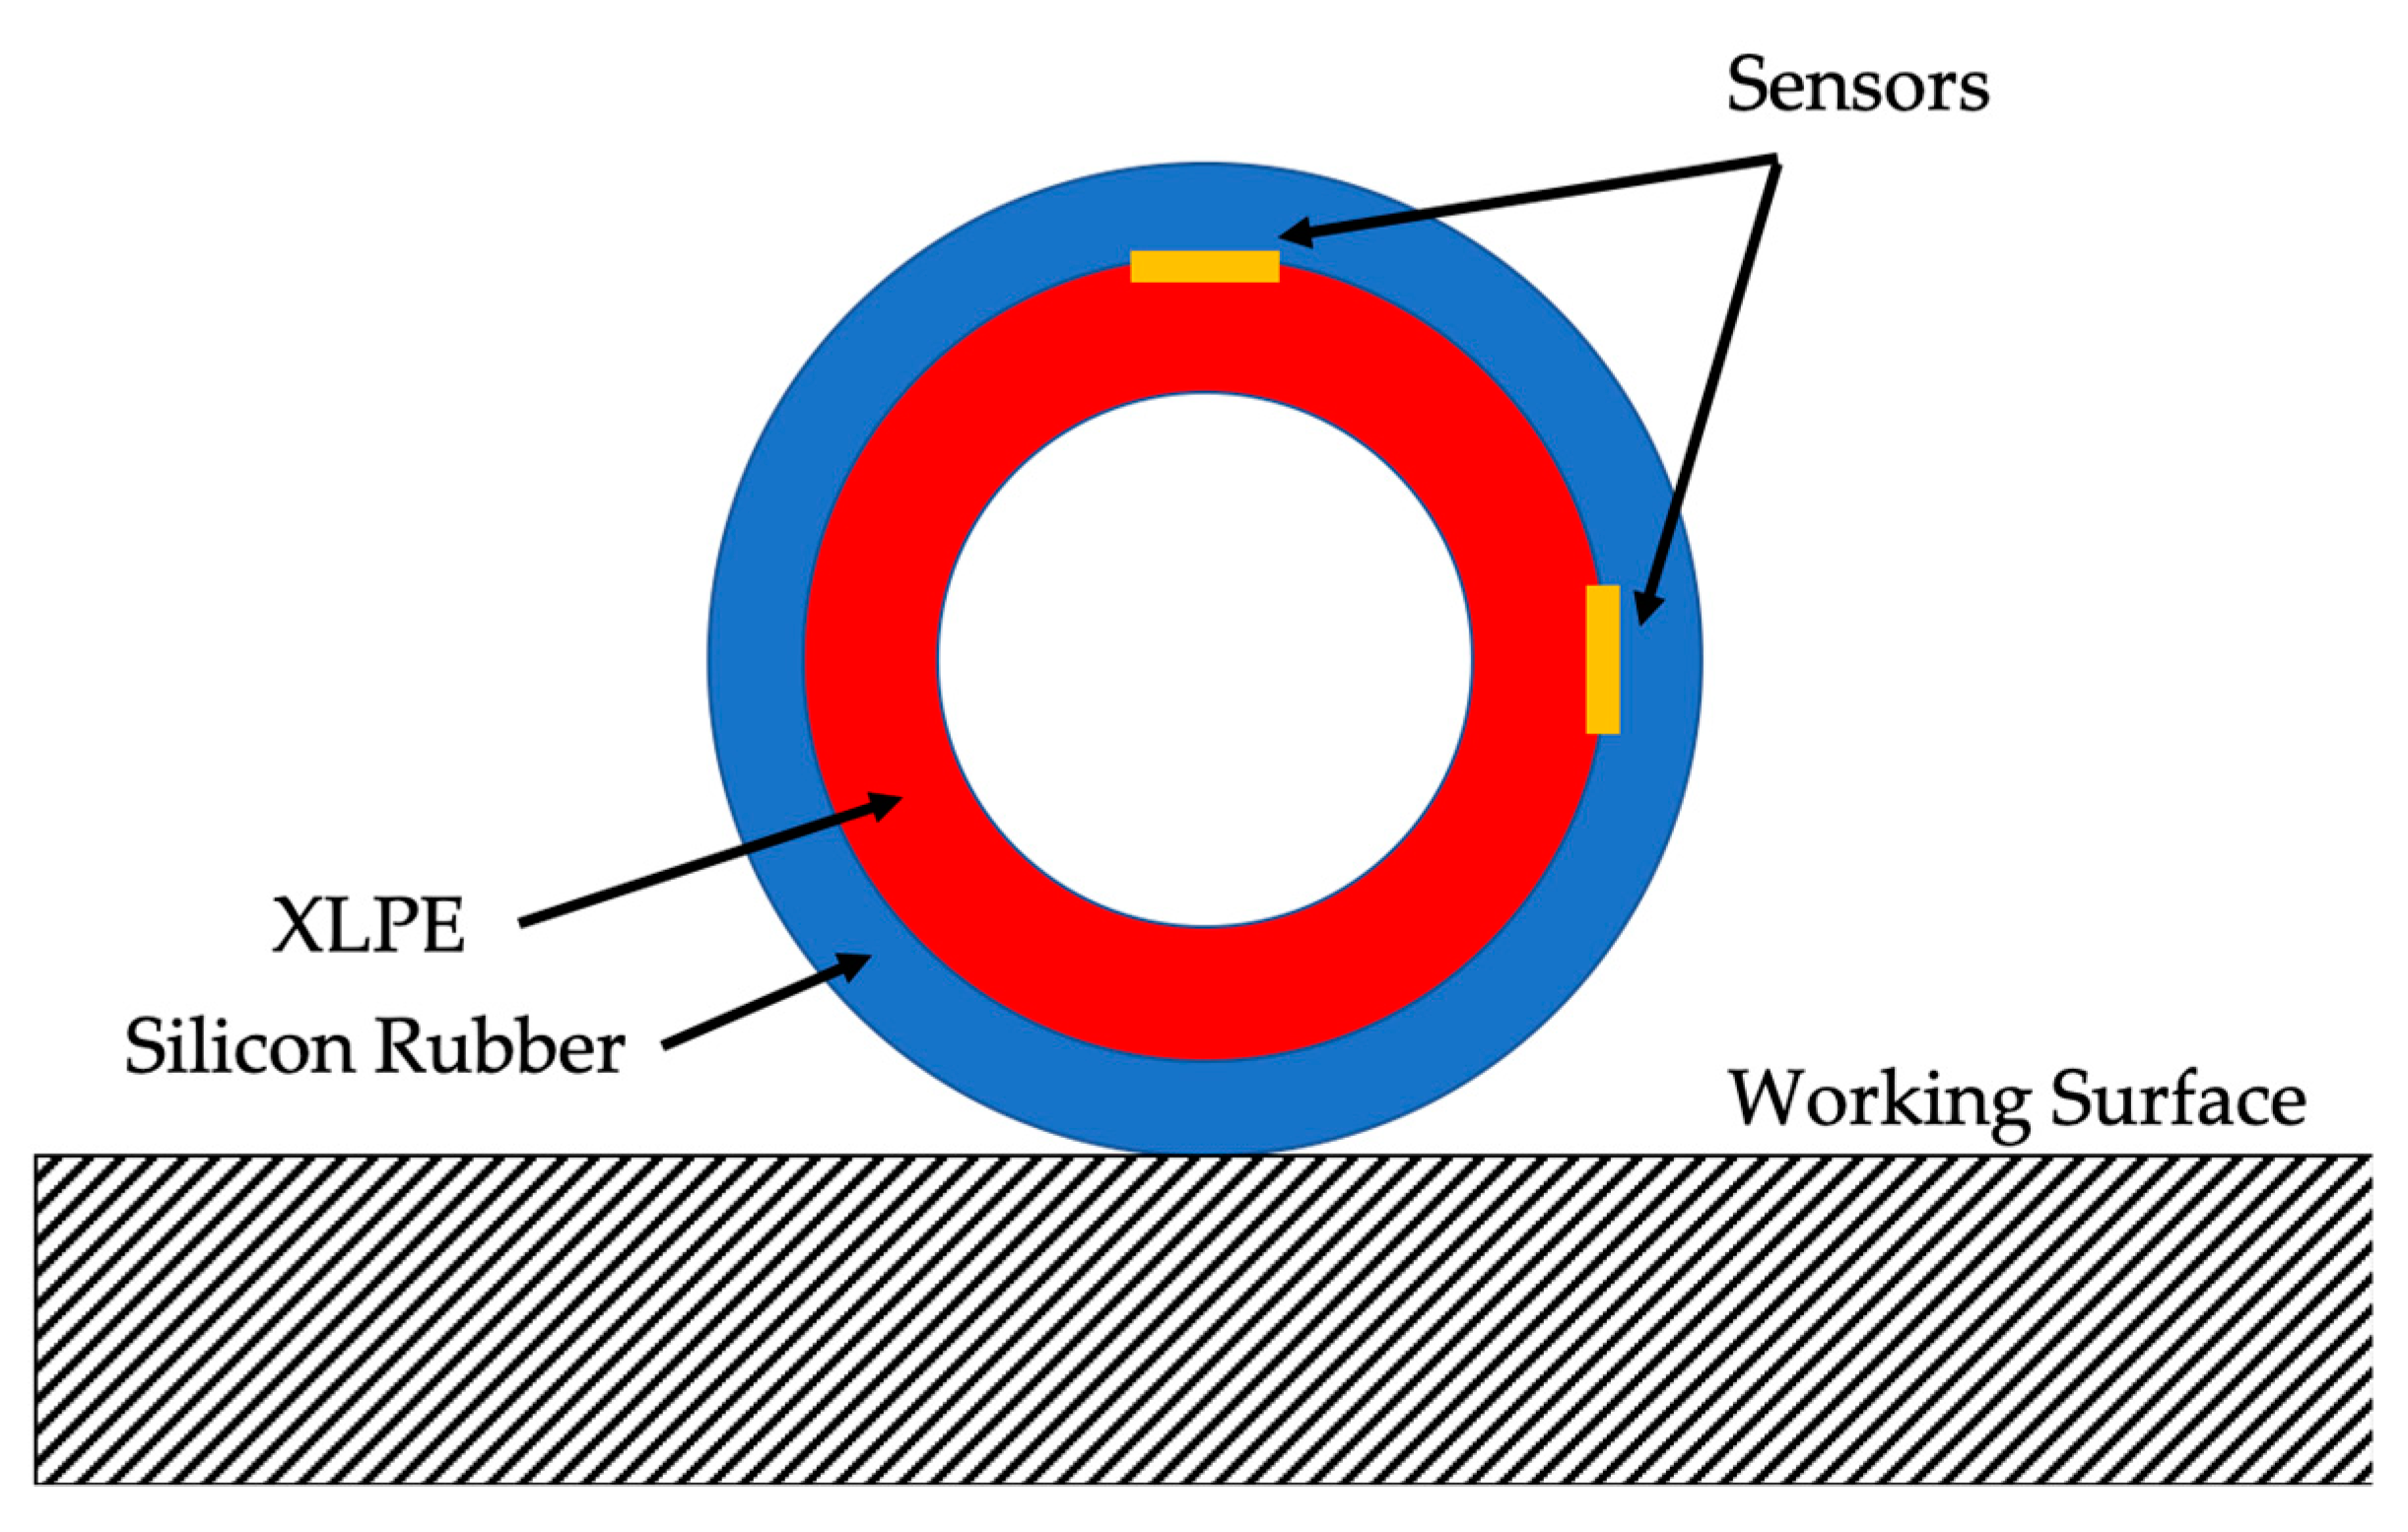
2.2. Cable Joints
- Metallic connector holding the two cable conductors.
- Silicon Rubber (SR) as main insulating material covering the metallic connector and the XLPE insulating part of the cable. This silicon layer is covered by semi-conductive material.
- A metallic meshed shielding covering the silicon rubber, which is used to maintain the ground electrical connection between the two portions of jointed cables.
- The external cold-shrinkable layer.
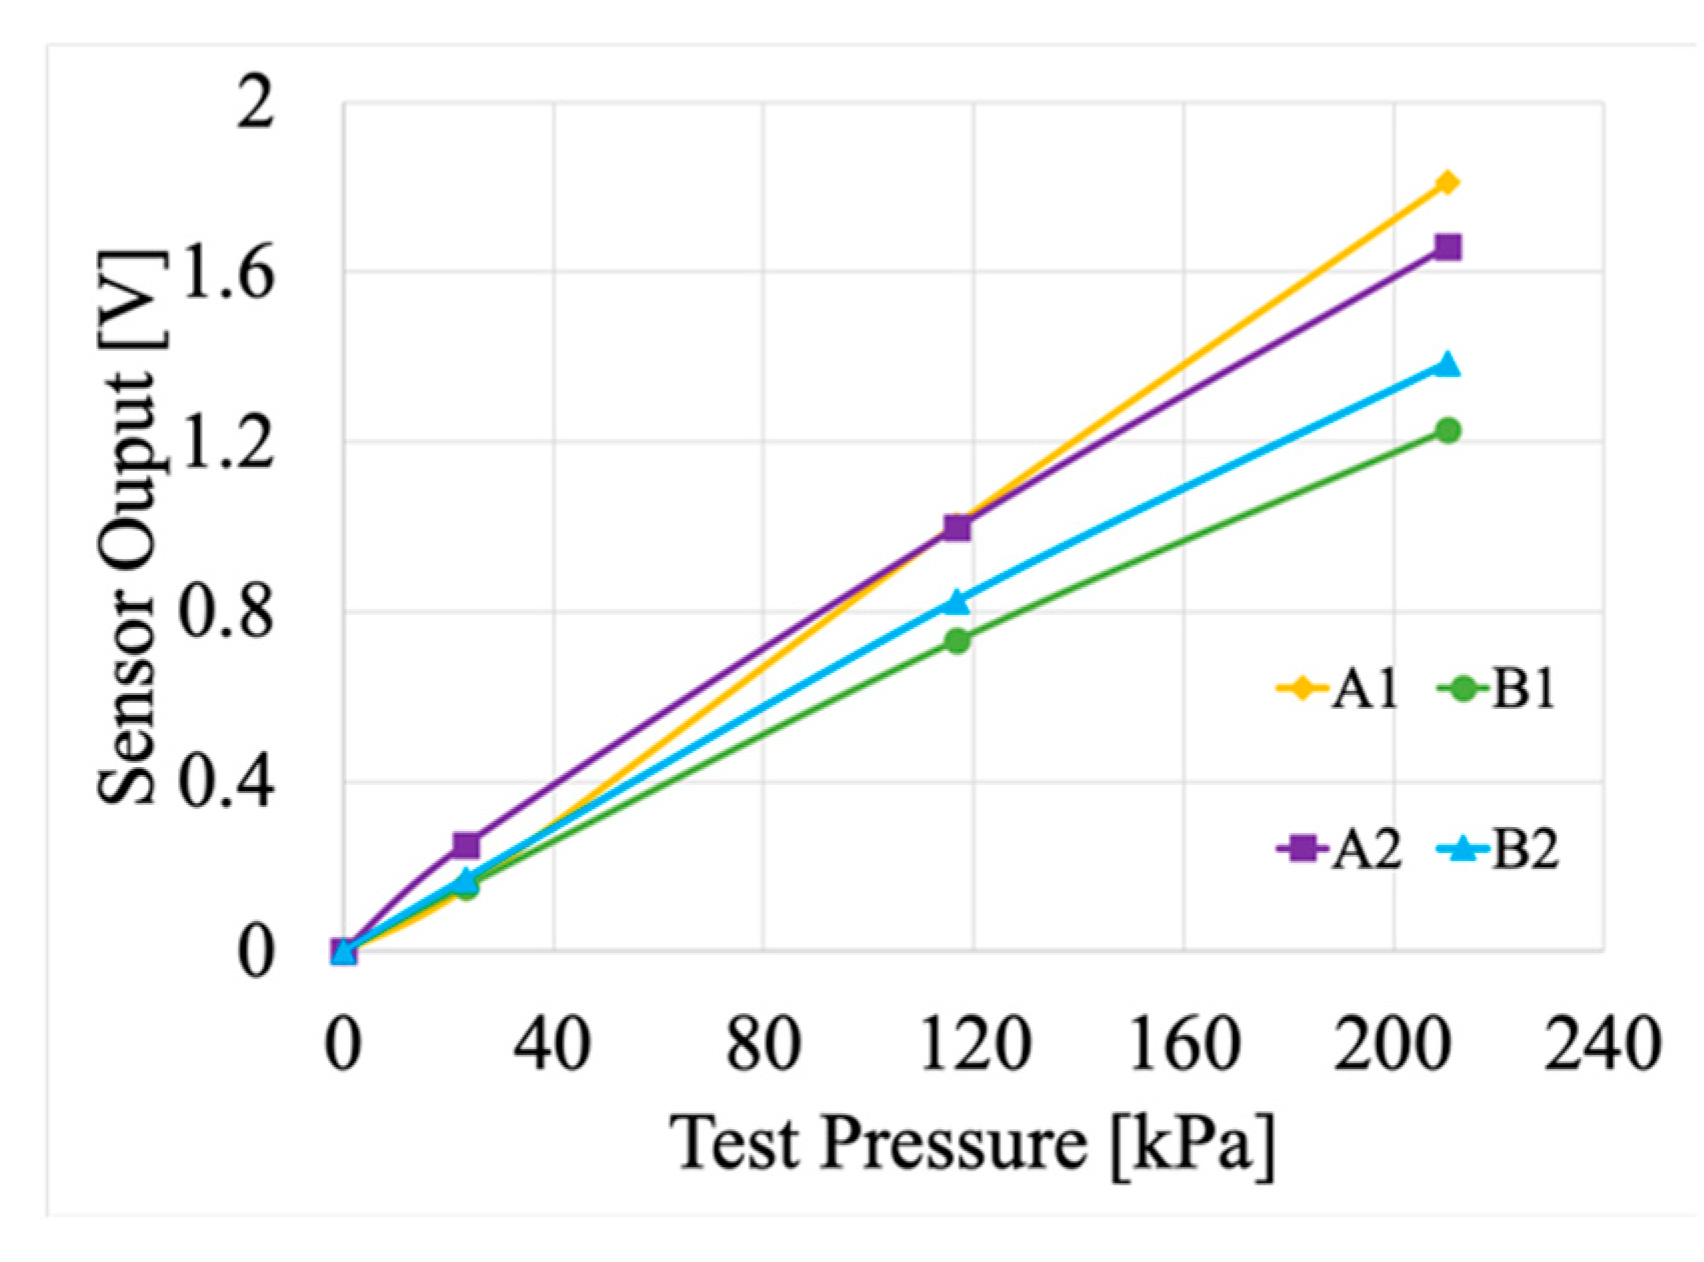
2.3. Pressure Sensors
- Absolute measurement. This means that the reference point is the vacuum, and therefore, one side of the sensor itself is dedicated to it, while the other side is faced to the mean to be measured.
- Gauge measurement. This type of sensor shares the structure with the previous one, but it uses as reference point the atmosphere. Hence, when using this kind of sensor, the operator should always check that the air can flow inside the side of the sensor dedicated to the atmosphere.
- Differential measurement. According to their name, these sensors measure the pressure between two arbitrary points.
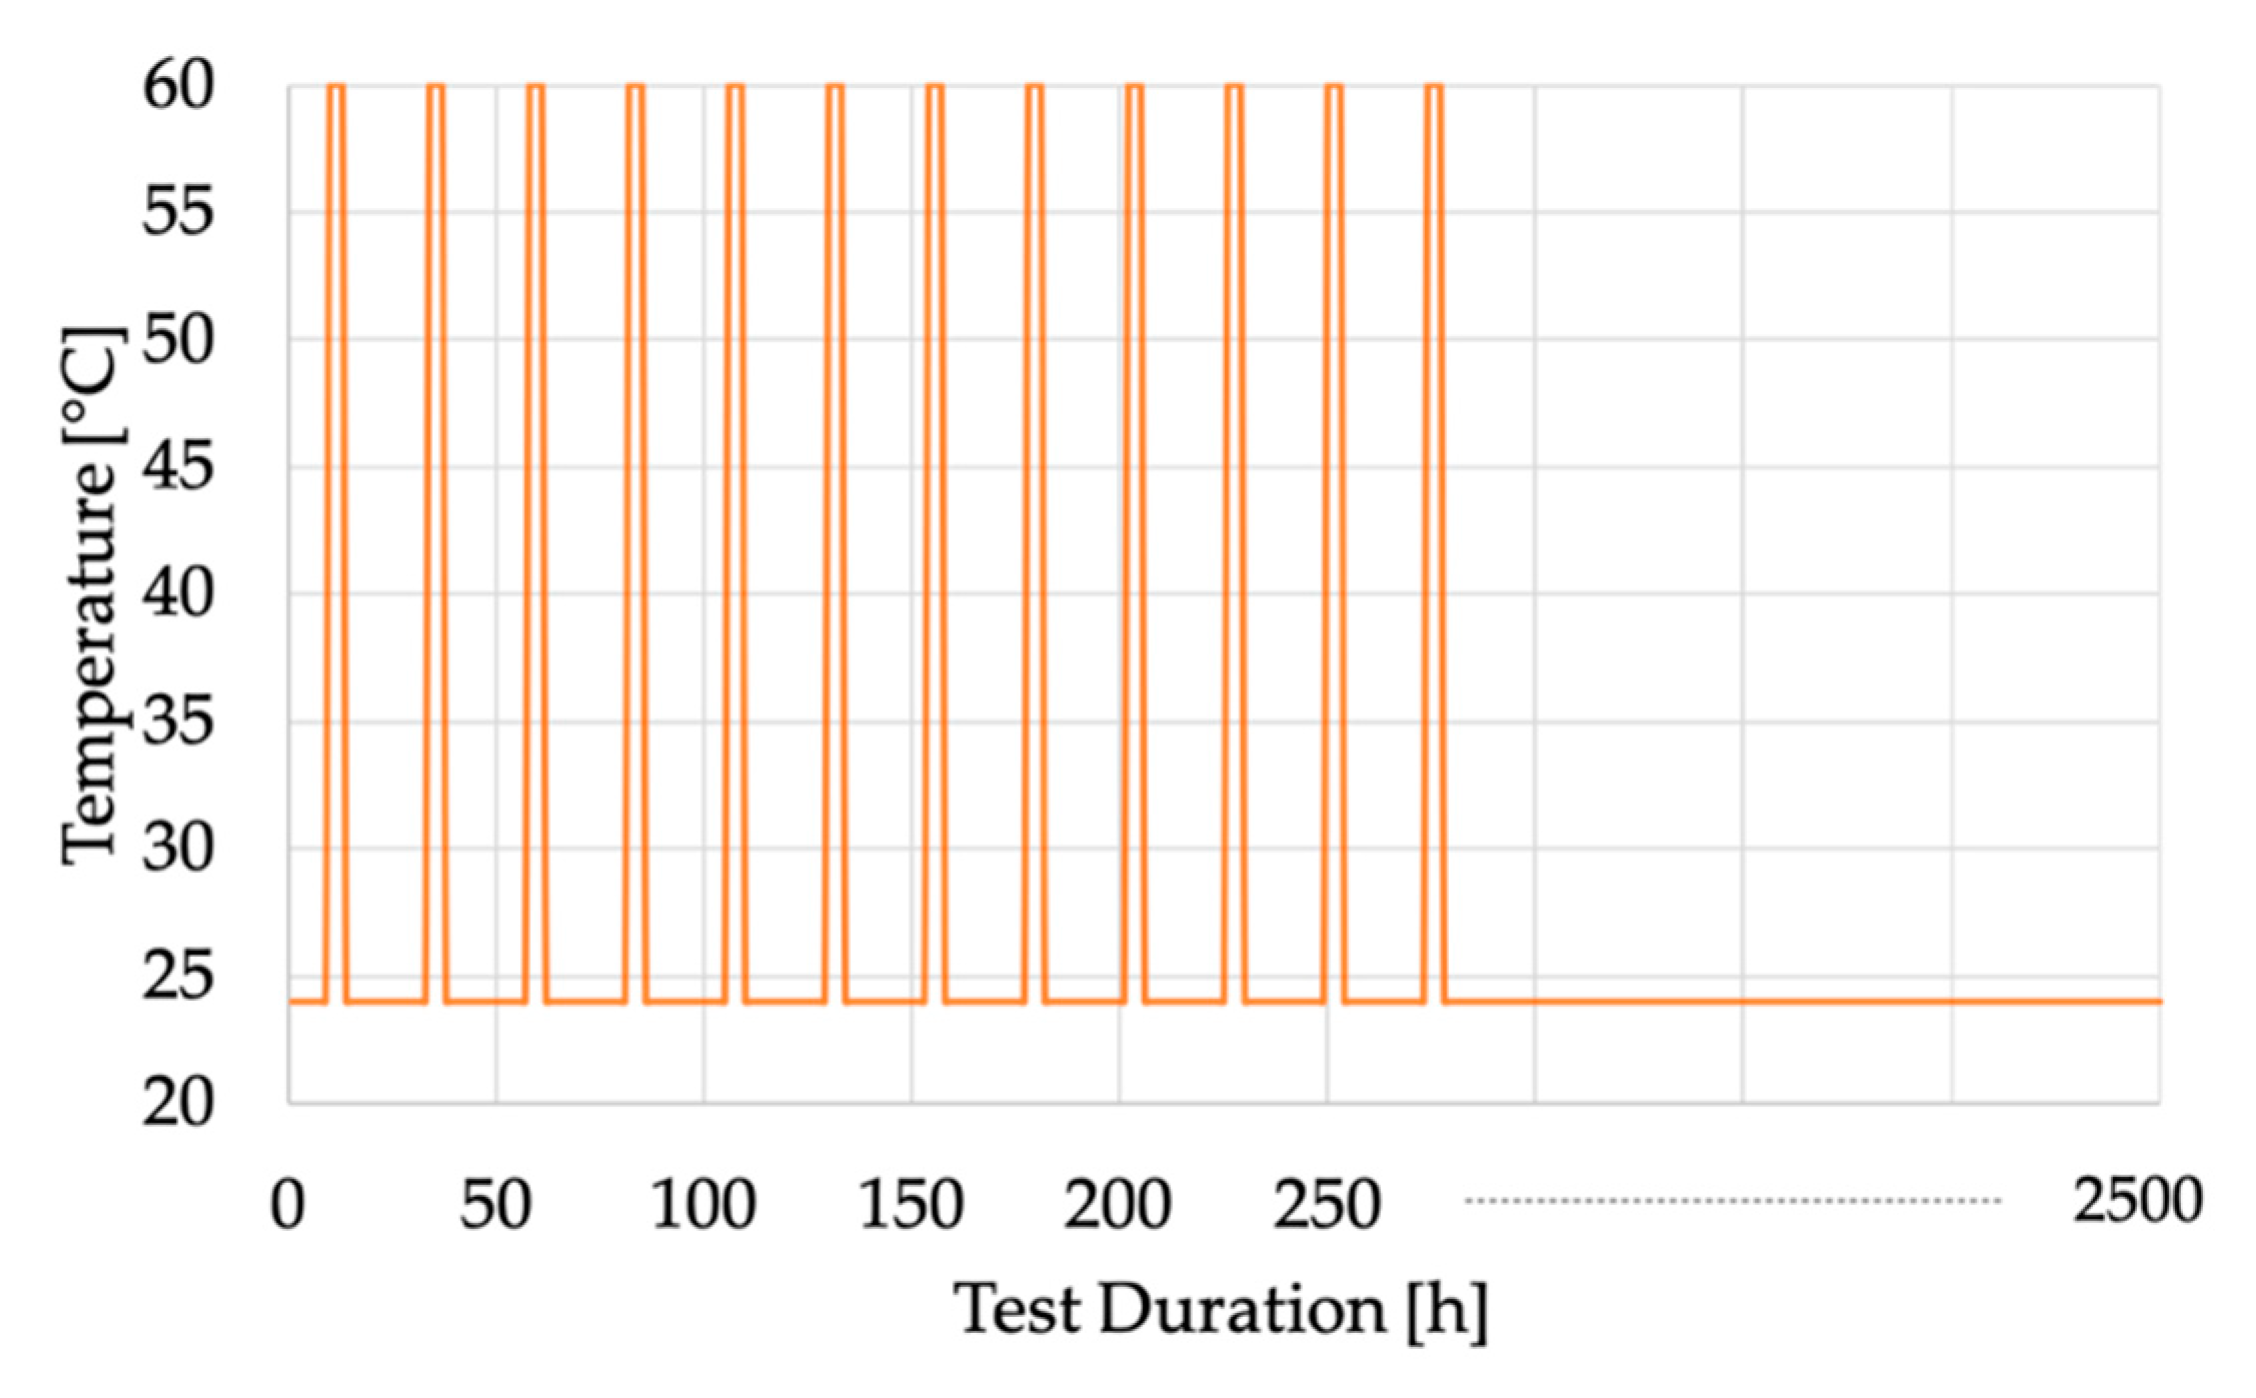
3. Description of the Experimental Tests
4. Results & Discussion
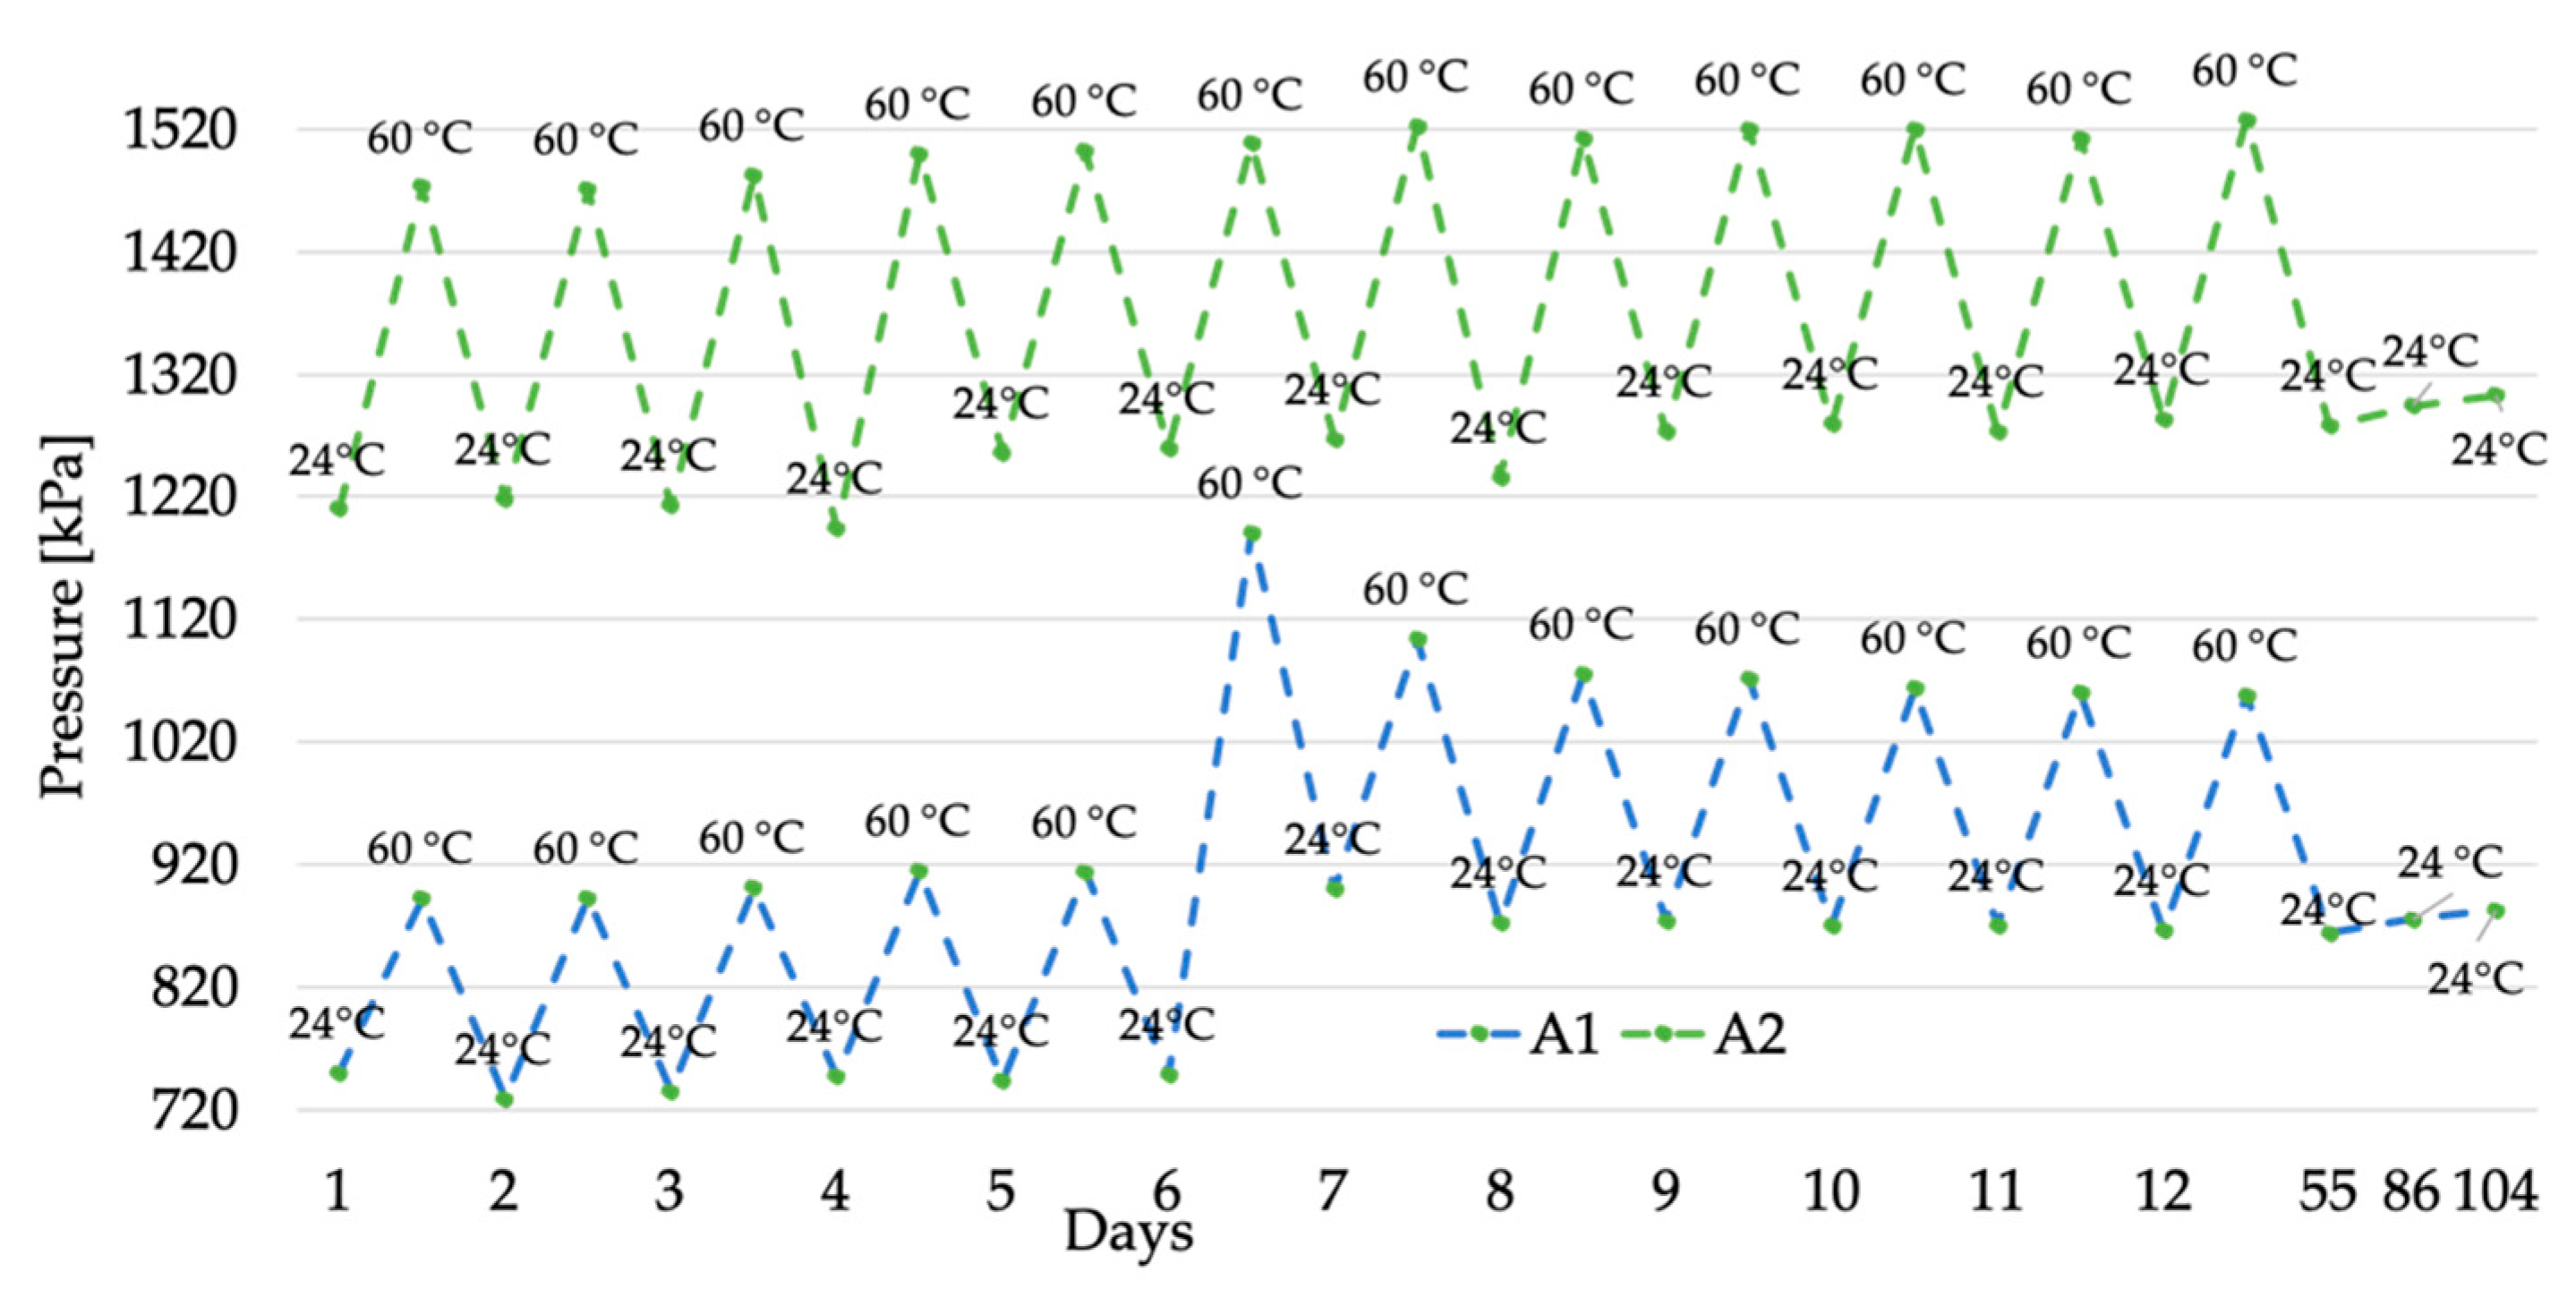
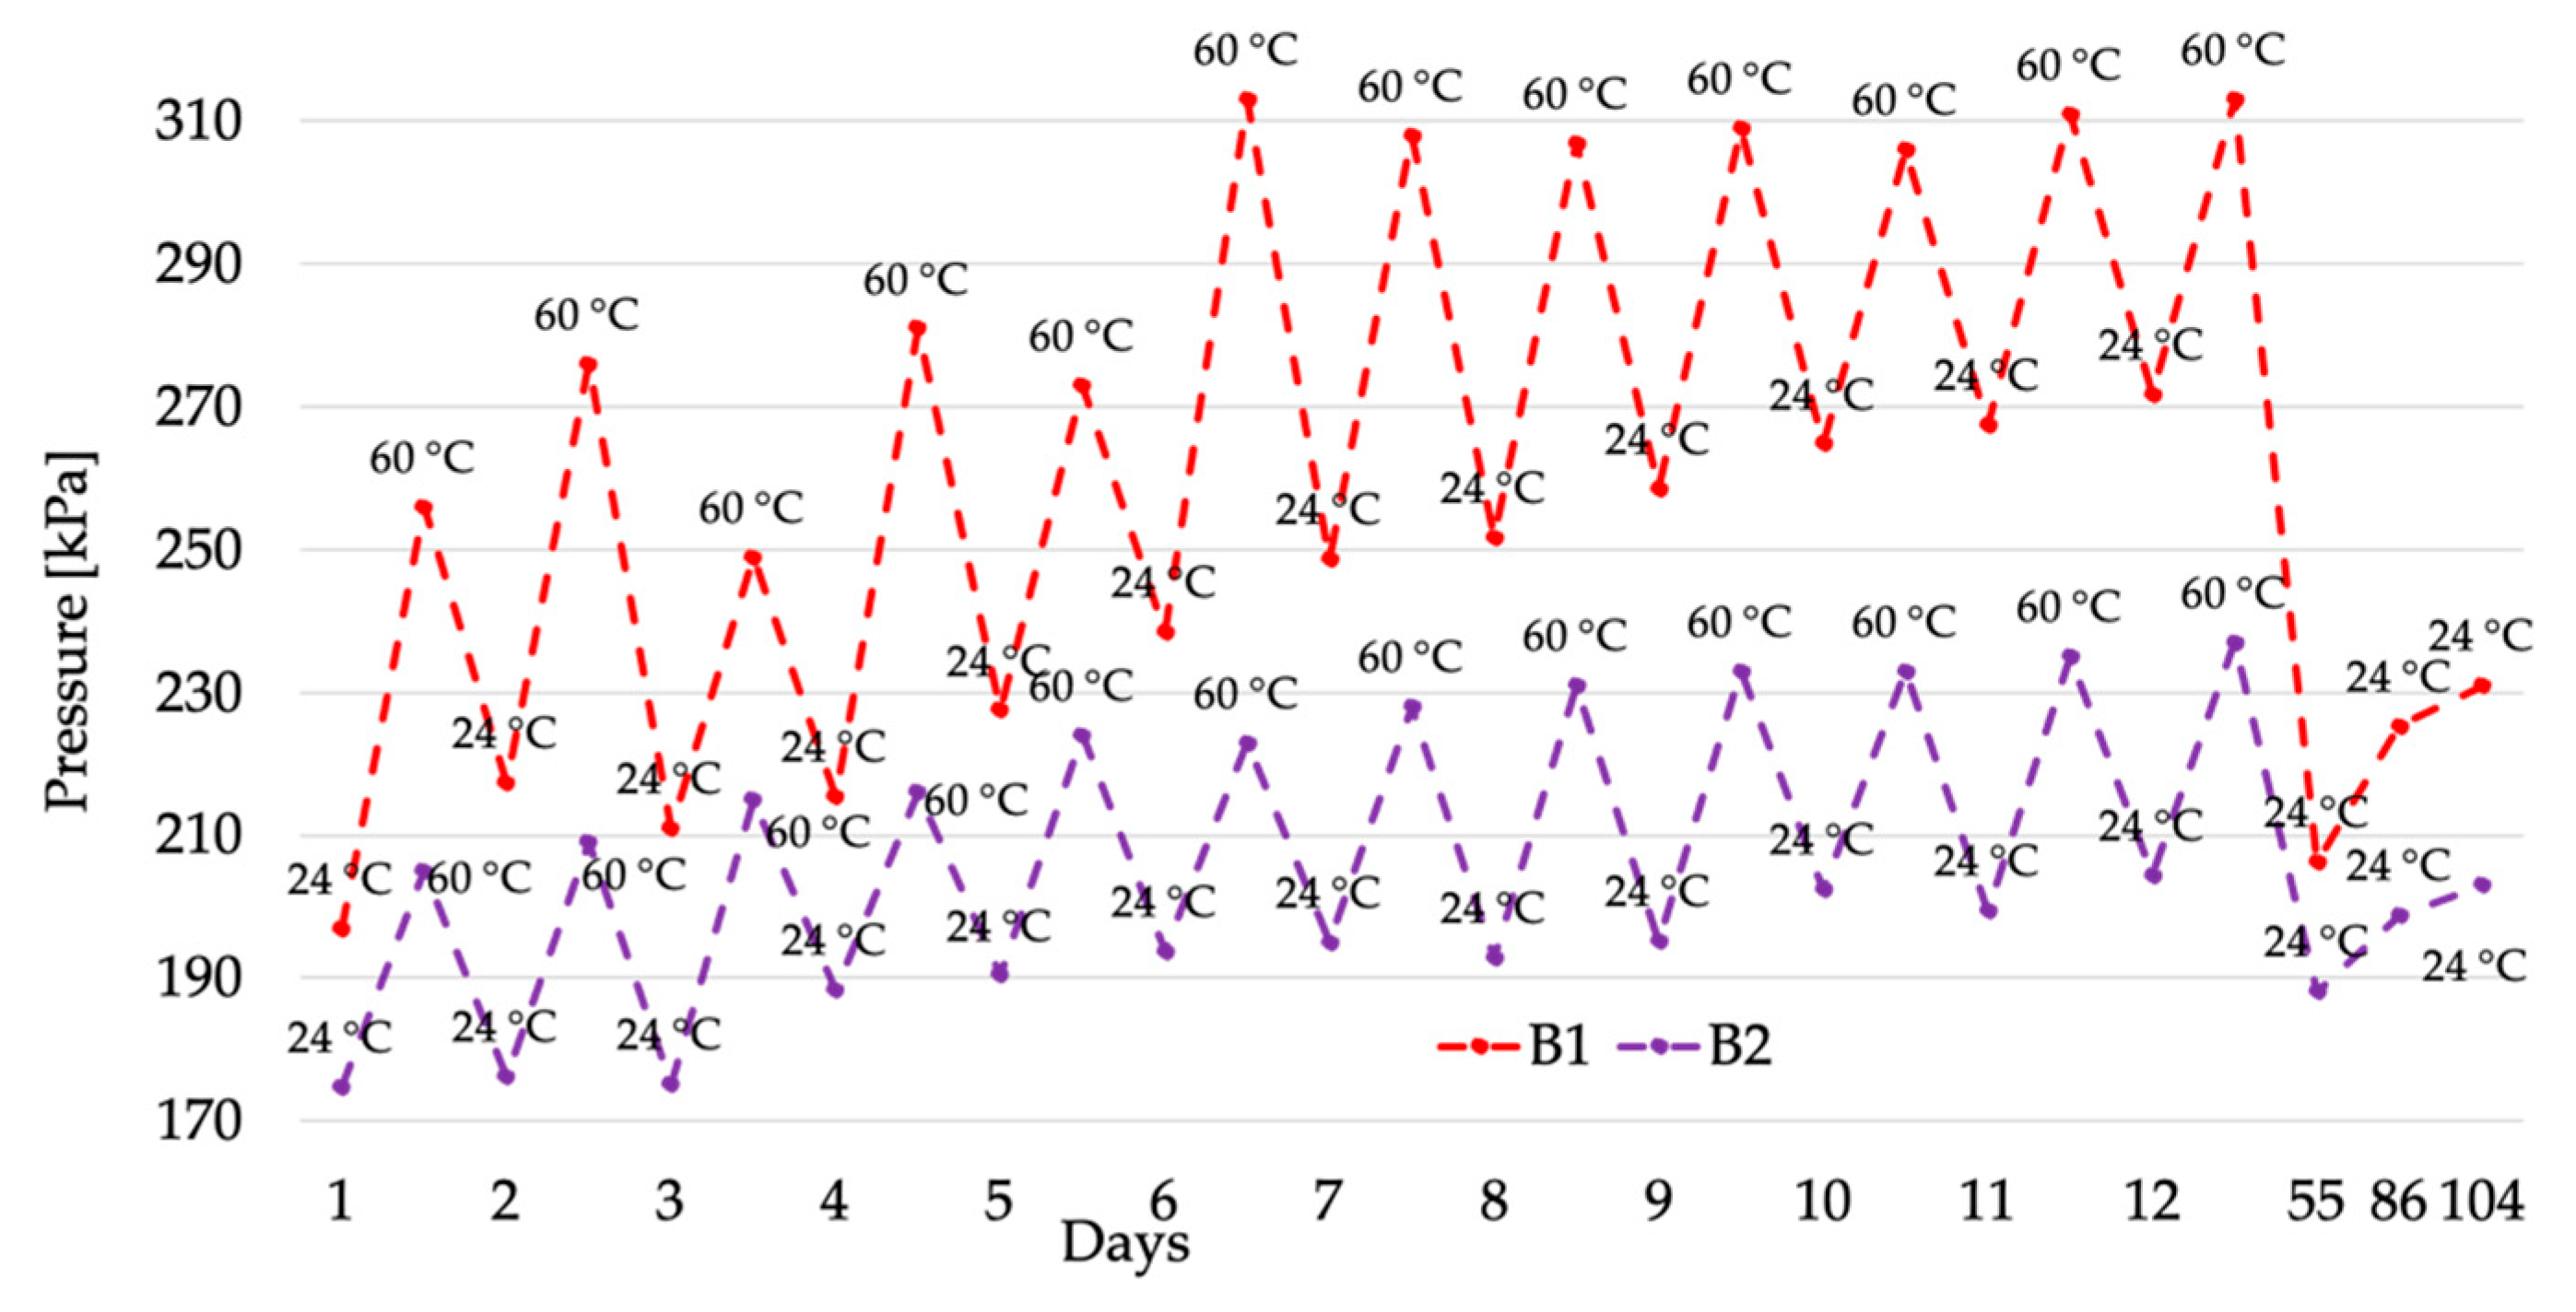
4.1. Measurement Results
4.2. Discussion & Comparison
4.2.1. Analysis of the Results
4.2.2. Comparison with Literature
5. Conclusions
Author Contributions
Funding
Conflicts of Interest
References
- Kim, W.J.; Kim, H.J.; Cho, J.W.; Choi, Y.S.; Kim, S.H. Electrical and mechanical characteristics of insulating materials for HTS DC cable and cable joint. IEEE Trans. Appl. Supercond. 2015, 25, 1–4. [Google Scholar] [CrossRef]
- Maier, T.; Lick, D.; Leibfried, T. A high-frequency simulation model of a MV cable joint. In Proceedings of the 2018 International Conference on Diagnostics in Electrical engineering, Pilsen, Czech Republic, 4–7 September 2018. [Google Scholar]
- Di, J.; Mei, W.; Qian, Z.; Tang, G. Technical trends of intermediate joints for HV XLPE cable in China. In Proceedings of the 2017 4th IEEE International Conference on Engineering Technologies and Applied Sciences, Salmabad, Bahrain, 29 November–1 December 2017. [Google Scholar]
- Gulski, E.; Wester, F.J.; Boone, W. Knowledge Rules Support for CBM of Power Cable Circuits. Cigre Paris. 2002. Available online: https://scholar.google.com/scholar?hl=zh-CN&as_sdt=0%2C5&q=Knowledge+rules+support+for+CBM+of+power+cable+circuits&btnG= (accessed on 24 December 2019).
- Mingotti, A.; Peretto, L.; Tinarelli, R.; Mauri, F.; Gentilini, I. Assessment of Metrological Characteristics of Calibration Systems for Accuracy vs. Temperature Verification of Voltage Transformer. In Proceedings of the 2017 IEEE International Workshop on Applied Measurements for Power Systems, Liverpool, UK, 20–22 September 2017. [Google Scholar]
- Mingotti, A.; Pasini, G.; Peretto, L.; Tinarelli, R. Effect of temperature on the accuracy of inductive current transformers. In Proceedings of the 2018 IEEE International Instrumentation and Measurement Technology Conference, Houston, TX, USA, 14–17 May 2018. [Google Scholar]
- Zhang, F.Z.; Liu, K.; Chen, X.S.; Huang, J.P.; Luo, R.X.; Li, Y.S.; Zhou, K. Error analysis of capacitor voltage transformer in the operation environment. In Proceedings of the 2016 IEEE International Conference on High Voltage Engineering and Application, Chengdu, China, 19–22 September 2016. [Google Scholar]
- Liu, H.; Wang, K.; Yang, Q.; Yin, L.; Huang, J. On-Line Detection of Voltage Transformer Insulation Defects Using the Low-Frequency Oscillation Amplitude and Duration of a Zero Sequence Voltage. Energies 2019, 12, 619. [Google Scholar] [CrossRef]
- Jiankun, O.; Churui, Z. Overhead line monitoring model based on the long-distance transmission network. In Proceedings of the 2013 8th International Conference on Computer Science & Education, Colombo, Sri Lanka, 26–28 April 2013. [Google Scholar]
- Shilin, A.A.; Kuznetsova, N.S.; Avdeyuk, D.N. Avdeyuk, Intelligent Reflectometer for Monitoring Overhead Power Lines. In Proceedings of the International Conference on Industrial Engineering Applications and Manufacturing, Moscow, Russia, 15–18 May 2018. [Google Scholar]
- Banik, A.; Dalai, S.; Chatterjee, B. Condition monitoring of overhead line insulator by measuring surface leakage current. In Proceedings of the IEEE India Conference, Pune, India, 11–13 December 2014. [Google Scholar]
- Deb, S.; Ghosh, R.; Dutta, S.; Dalai, S.; Chatterjee, B. Condition monitoring of 11kV porcelain pin insulator extracting surface current from total leakage current. In Proceedings of the 2017 3rd International Conference on Condition Assessment Techniques in Electrical Systems, Rupnagar, India, 16–18 November 2017. [Google Scholar]
- Jiang, Y.; McMeekin, S.G.; Reid, A.J.; Nekahi, A.; Judd, M.D.; Wilson, A. High voltage insulator contamination level online monitoring with conventional and novel methods. In Proceedings of the 2016 IEEE Electrical Insulation Conference, Montreal, QC, Canada, 19–22 June 2016. [Google Scholar]
- Albertini, A.; Masi, M.G.; Mazzanti, G.; Peretto, L.; Tinarelli, R. Toward a BITE for Real-Time Life Estimation of Capacitors Subjected to Thermal Stress. IEEE Trans. Instrum. Meas. 2011, 60, 1671–1684. [Google Scholar] [CrossRef]
- Dang, C.; Chaaban, M. Thermal performance modeling of powercable joints. In Proceedings of the IEEE International Conference on Power Cables and Accessories, London, UK, 23–25 November 1993. [Google Scholar]
- Bragatto, T.; Cerretti, A.; D’Orazio, L.; Gatta, F.M.; Geri, A.; Maccioni, M. Thermal Effects of Ground Faults on MV Joints and Cables. Energies 2019, 12, 3496. [Google Scholar] [CrossRef]
- Ruan, J.; Zhan, Q.; Tang, L.; Tang, K. Real-Time Temperature Estimation of Three-Core Medium-Voltage Cable Joint Based on Support Vector Regression. Energies 2018, 11, 1405. [Google Scholar] [CrossRef]
- Fournier, D.; Amyot, N. Diagnostic of overheating underground distribution cable joints. In Proceedings of the 16th International Conference and Exhibition on Electricity Distribution, 2001. Part 1: Contributions. CIRED, Amsterdam, The Netherlands, 18–21 June 2001. [Google Scholar]
- Meng, X.B.; Hu, X.G. Design of on-line temperature monitoring system for power cable joints based on supercapacitor. In Proceedings of the IEEE International Conference on Industrial Informatics, Beijing, China, 25–27 July 2012. [Google Scholar]
- Xiang, X.; Tu, P.; Zhao, J. Application of Fiber Bragg Grating Sensor in Temperature Monitoring of Power Cable Joints. In Proceedings of the 2011 International Conference on Electronics, Communications and Control, Ningbo, China, 9–11 September 2011. [Google Scholar]
- Mingotti, A.; Ghaderi, A.; Mazzanti, G.; Peretto, L.; Tinarelli, R.; Valtorta, G.; Amoroso, G.; Danesi, S. Low-cost monitoring unit for MV cable joints diagnostics. In Proceedings of the IEEE International Workshop on Applied Measurements for Power Systems, Bologna, Italy, 26–28 September 2018. [Google Scholar]
- Jongen, R.A.; Morshuis, P.H.F.; Smit, J.J.; Janssen, A.L.J. Influence of ambient temperature on the failure behavior of cable joints. In Proceedings of the 2007 Annual Report - Conference on Electrical Insulation and Dielectric Phenomena, Vancouver, BC, Canada, 14–17 October 2007. [Google Scholar]
- Taklaja, P.; Kiitam, I.; Hyvönen, P.; Klüss, J. Test setup for measuring medium voltage power cable and joint temperature in high current tests using thermocouples. In Proceedings of the 2016 IEEE Electrical Insulation Conference, Montreal, QC, Canada, 19–22 June 2016. [Google Scholar]
- Mingotti, A.; Ghaderi, A.; Peretto, L.; Tinarelli, R.; Lama, F. Test Setup Design, and Calibration for Tan Delta Measurements on MV Cable Joints. In Proceedings of the 2018 IEEE 9th International Workshop on Applied Measurements for Power Systems, Bologna, Italy, 26–28 September 2018. [Google Scholar]
- Ghaderi, A.; Mingotti, A.; Lama, F.; Peretto, L.; Tinarelli, R. Effects of Temperature on MV Cable Joints Tan Delta Measurements. IEEE Trans. Instrum. Meas. 2019, 68, 3892–3898. [Google Scholar] [CrossRef]
- Permal, N.; Chakrabarty, C.K.; Avinash, A.R.; Marie, T.; Halim, H.S.A. Tangent delta extraction of cable joints for aged 11kV underground cable system. In Proceedings of the 2016 International Conference on Advances in Electrical, Electronic and Systems Engineering, Putrajaya, Malaysia, 14–16 November 2016. [Google Scholar]
- Shafi, H.; Anthony, T.M.; Basri, A.; Raj, A.; Chakrabarty, C. Extraction of cable joints tangent delta from bulk tangent delta measurement using HFAC method. In Proceedings of the 2016 IEEE International Conference on Power and Energy, Melaka, Malaysia, 28–29 November 2016. [Google Scholar]
- Cardinaels, J.; Heuillet, P.; Meyer, P. Study of the Viscoelastic Behavior of Cold-shrinkable Joints for MV. In Proceedings of the IEEE Transmission and Distribution Conference, New Orleans, LA, USA, 11–16 April 1999. [Google Scholar]
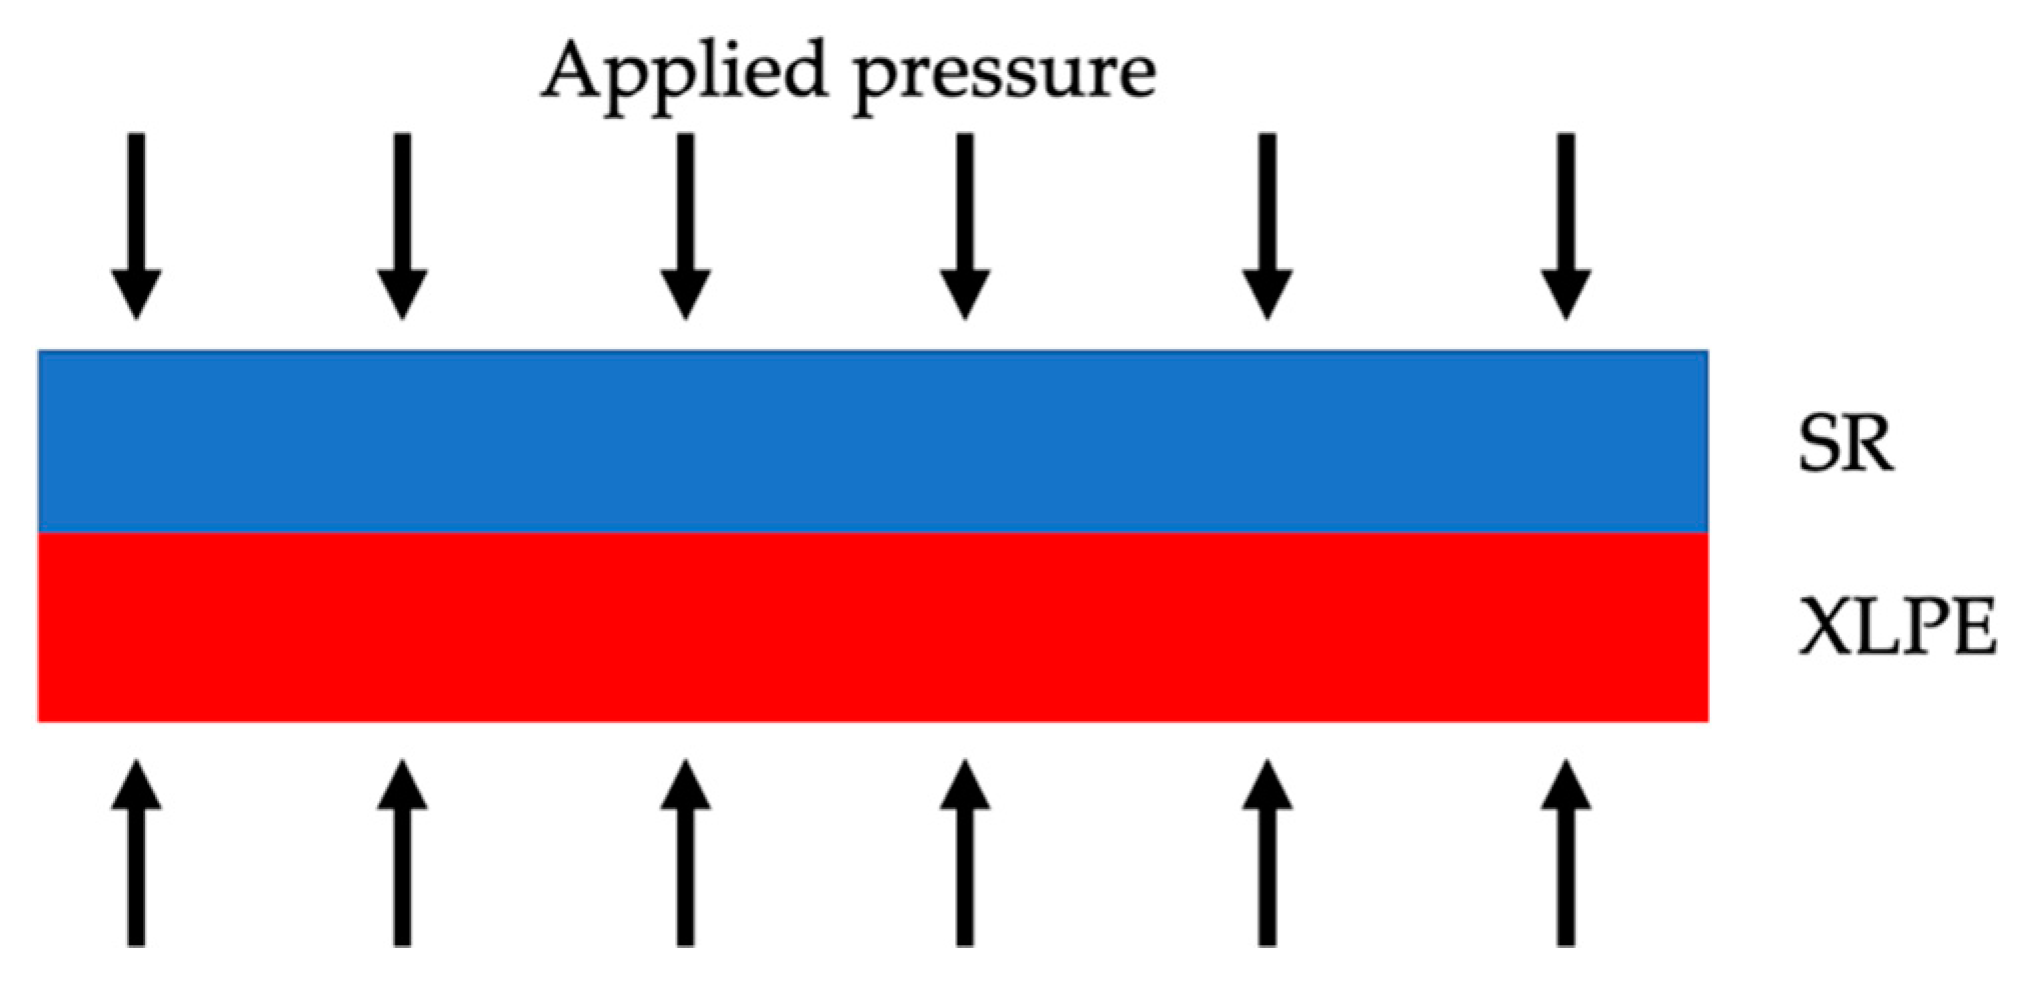
- Song, M.; Jia, Z. Calculation and simulation of mechanical pressure of XLPE-SR surface in cable joints. In Proceedings of the 2018 12th International Conference on the Properties and Applications of Dielectric Materials, Xi’an, China, 20–24 May 2018. [Google Scholar]
- Ghaderi, A.; Mingotti, A.; Peretto, L.; Tinarelli, R. Effects of Mechanical Pressure on the Tangent Delta of MV Cable Joints. IEEE Trans. Instrum. Meas. 2019, 68, 2656–2658. [Google Scholar] [CrossRef]
- Di Sante, R.; Ghaderi, A.; Mingotti, A.; Peretto, L.; Tinarelli, R. Test bed characterization for the interfacial pressure vs. temperature measurements in MV cable joints. In Proceedings of the 2019 II Workshop on Metrology for Industry 4.0 and IoT, Naples, Italy, 4–6 June 2019. [Google Scholar]
- Chen, J.; Dou, Y.; Wang, Z.; Li, G. A Novel Method for PD Feature Extraction of Power Cable with Renyi Entropy. Entropy 2015, 17, 7698–7712. [Google Scholar] [CrossRef]
- Rajalakshmi, B.; Kalaivani, L. Analysis of partial discharge in underground cable joints. In Proceedings of the 2015 International Conference on Innovations in Information, Embedded and Communication Systems, Coimbatore, India, 19–20 March 2015. [Google Scholar]
- Sheng, B.; Zhou, W.; Yu, J.; Meng, S.; Zhou, C.; Hepburn, D.M. On-line PD detection and localization in cross-bonded HV cable systems. IEEE Trans. Dielectr. Electr. Insul. 2014, 21, 2217–2224. [Google Scholar] [CrossRef]
- Katz, C.; Seman, G.W.; Bernstein, B.S. Low temperature aging of XLPE and EP insulated cables with voltage transients. IEEE Trans. Power Delivery 1995, 10, 34–42. [Google Scholar] [CrossRef]
- Amyot, N.; David, E. A Study of Interfacial Pressure Behavior for Two Types of Thermally Cycled Coldshrinkable Joints. In Proceedings of the Conference Record of the 2002 IEEE International Symposium on Electrical Insulation, Boston, MA, USA, 7–10 April 2002. [Google Scholar]
- Cheremisinoff, N.P. Condensed Encyclopedia of Polymer Engineering Terms; Butterworth-Heinemann: Woburn, MA, USA, 2001. [Google Scholar]
- Li, L.; Zhong, L.; Zhang, K.; Gao, J.; Xu, M. Temperature Dependence of Mechanical, Electrical Properties and Crystal Structure of Polyethylene Blends for Cable Insulation. Materials 2018, 11, 1922. [Google Scholar] [CrossRef] [PubMed]
- Du, B.X.; Gu, L.; Zhang, X.; Zhu, X. Fundamental Research on Dielectric Breakdown between XLPE and Silicon Rubber Interface in HV Cable Joint. In Proceedings of the 2009 IEEE 9th International Conference on the Properties and Applications of Dielectric Materials, Harbin, China, 19–23 July 2009. [Google Scholar]
- Jia, Z.D.; Zhang, Y.J.; Fan, W.N.; Zhu, B.; You, J.; Lu, G.J. Analysis of the Interface Pressure of Cold Shrinkable Joint of 10 kV XLPE Cable. High Voltage Eng. 2017, 43, 661–665. [Google Scholar]


| Days | Pressure (kPa) | |||||||
|---|---|---|---|---|---|---|---|---|
| 24 °C | 60 °C | |||||||
| 1 | 750 | 1210 | 196 | 174 | 892 | 1473 | 256 | 205 |
| 2 | 729 | 1218 | 217 | 176 | 893 | 1471 | 276 | 209 |
| 3 | 735 | 1213 | 210 | 175 | 901 | 1482 | 249 | 215 |
| 4 | 747 | 1194 | 215 | 188 | 915 | 1500 | 281 | 216 |
| 5 | 743 | 1256 | 227 | 190 | 914 | 1502 | 273 | 224 |
| 6 | 748 | 1260 | 238 | 193 | 1191 | 1508 | 313 | 223 |
| 7 | 900 | 1267 | 248 | 195 | 1104 | 1523 | 308 | 228 |
| 8 | 872 | 1236 | 251 | 192 | 1075 | 1512 | 307 | 231 |
| 9 | 874 | 1273 | 258 | 195 | 1072 | 1520 | 309 | 233 |
| 10 | 870 | 1279 | 264 | 202 | 1064 | 1520 | 306 | 233 |
| 11 | 870 | 1273 | 267 | 199 | 1060 | 1513 | 311 | 235 |
| 12 | 866 | 1283 | 271 | 204 | 1058 | 1528 | 313 | 237 |
| 55 | 864 | 1278 | 206 | 188 | - | - | - | - |
| 86 | 875 | 1294 | 225 | 198 | - | - | - | - |
| 104 | 883 | 1303 | 231 | 203 | - | - | - | - |
© 2019 by the authors. Licensee MDPI, Basel, Switzerland. This article is an open access article distributed under the terms and conditions of the Creative Commons Attribution (CC BY) license (http://creativecommons.org/licenses/by/4.0/).
Share and Cite
Di Sante, R.; Ghaderi, A.; Mingotti, A.; Peretto, L.; Tinarelli, R. Effects of Thermal Cycles on Interfacial Pressure in MV Cable Joints. Sensors 2020, 20, 169. https://doi.org/10.3390/s20010169
Di Sante R, Ghaderi A, Mingotti A, Peretto L, Tinarelli R. Effects of Thermal Cycles on Interfacial Pressure in MV Cable Joints. Sensors. 2020; 20(1):169. https://doi.org/10.3390/s20010169
Chicago/Turabian StyleDi Sante, Raffaella, Abbas Ghaderi, Alessandro Mingotti, Lorenzo Peretto, and Roberto Tinarelli. 2020. "Effects of Thermal Cycles on Interfacial Pressure in MV Cable Joints" Sensors 20, no. 1: 169. https://doi.org/10.3390/s20010169
APA StyleDi Sante, R., Ghaderi, A., Mingotti, A., Peretto, L., & Tinarelli, R. (2020). Effects of Thermal Cycles on Interfacial Pressure in MV Cable Joints. Sensors, 20(1), 169. https://doi.org/10.3390/s20010169