Towards Digital Twin Implementation for Assessing Production Line Performance and Balancing †

 ,
,  ,
,  ,
,  ,
, 

Abstract
1. Introduction
1.1. Previous Researches
1.2. Purpose and Article Outline
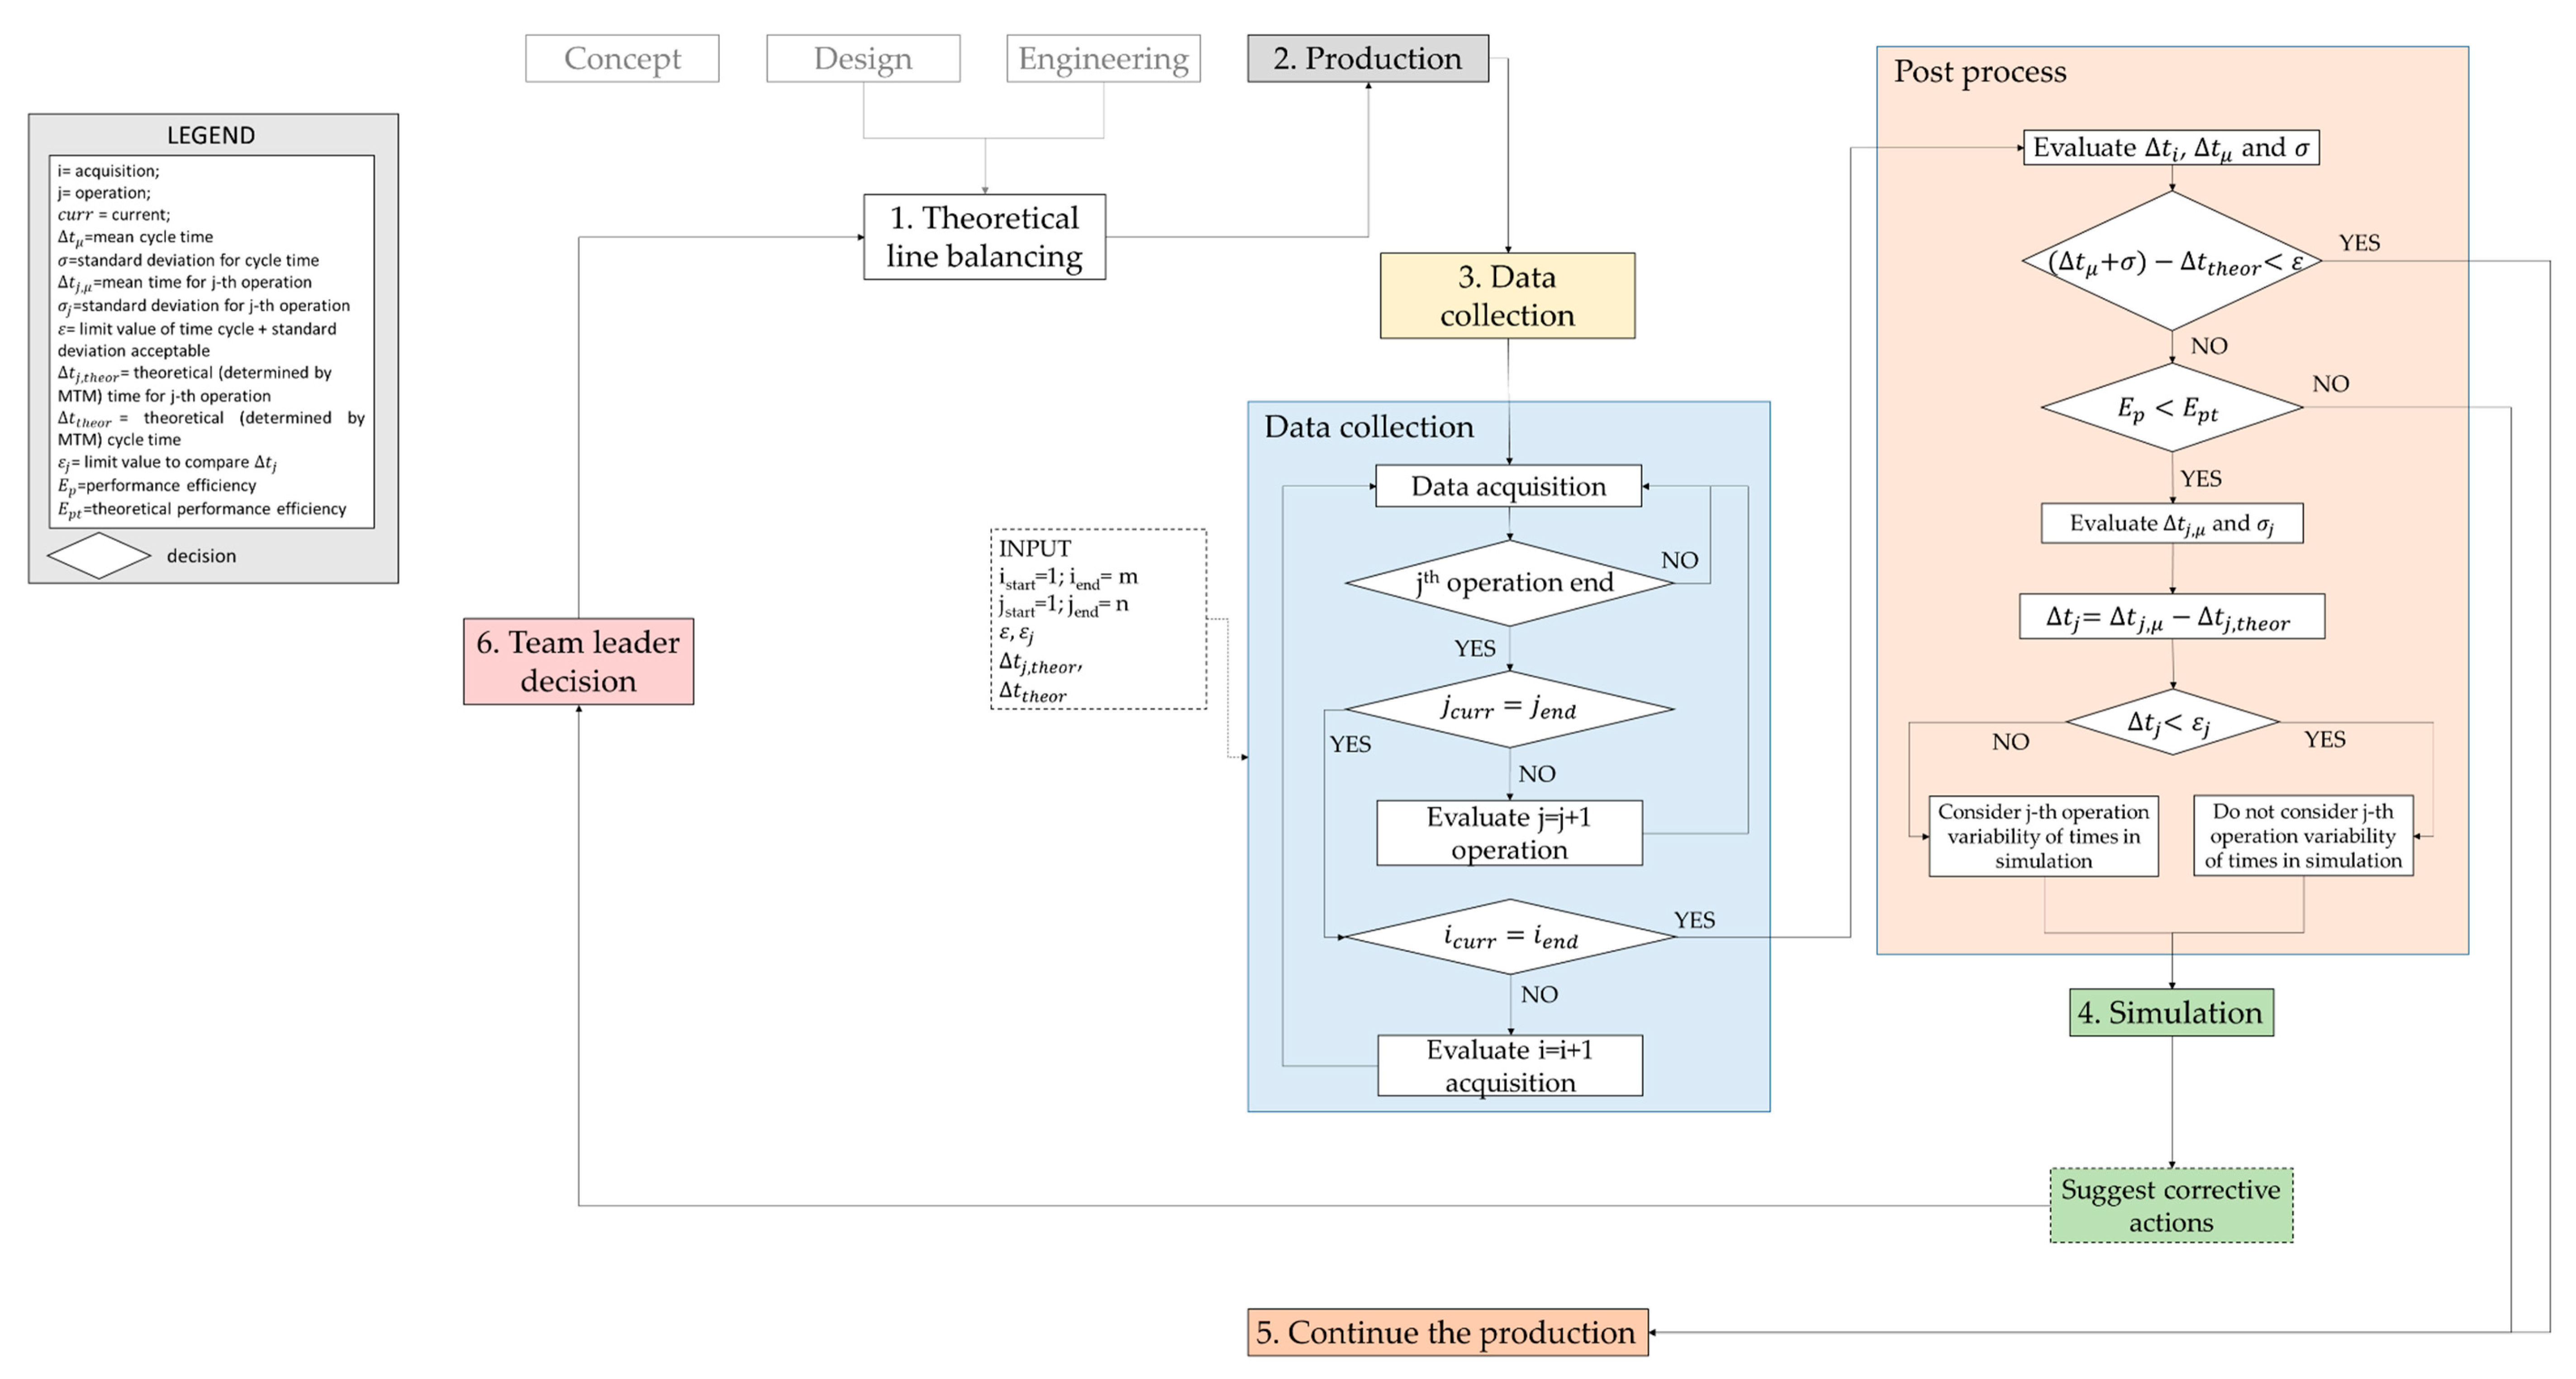
2. Methodological Framework
- transferring experimental data collected during the real production to a simulation environment;
- evaluating specific parameters such as cycle time, workers’ saturation, etc., and measuring the Performance Efficiency—E of the production line by implementing the experimental data in the simulation environment;
- comparing the results with the nominal values, defined during the design phase, when experimental data were not available;
- transferring the results of the simulation to production line manager who will have the possibility to modify and re-balance the line.
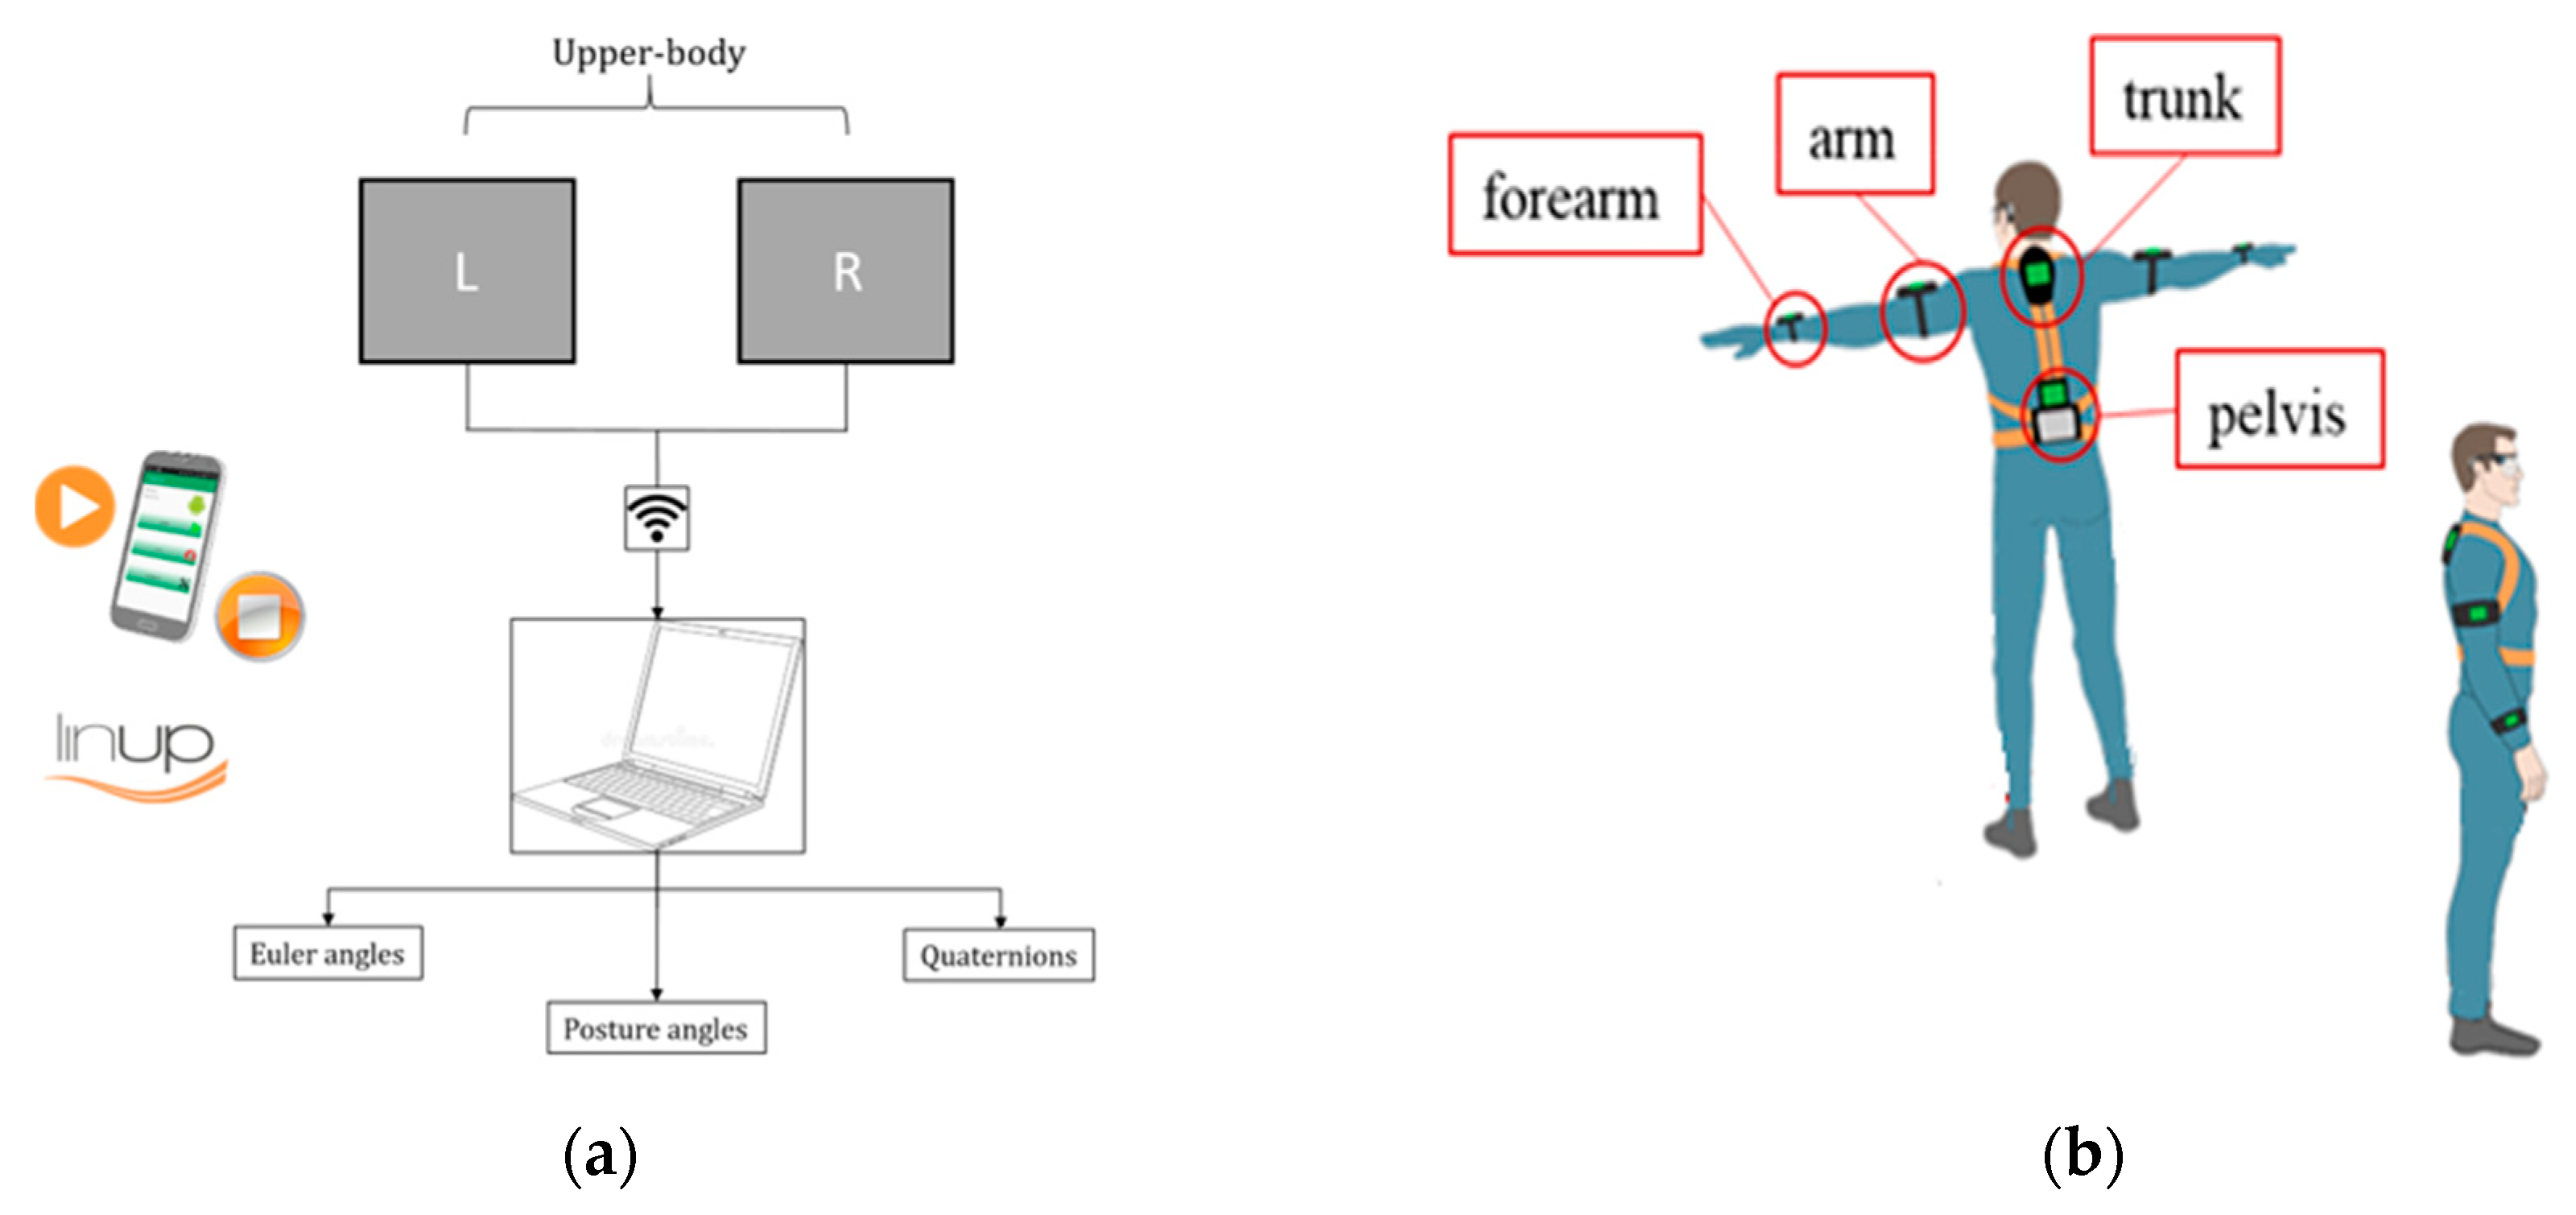
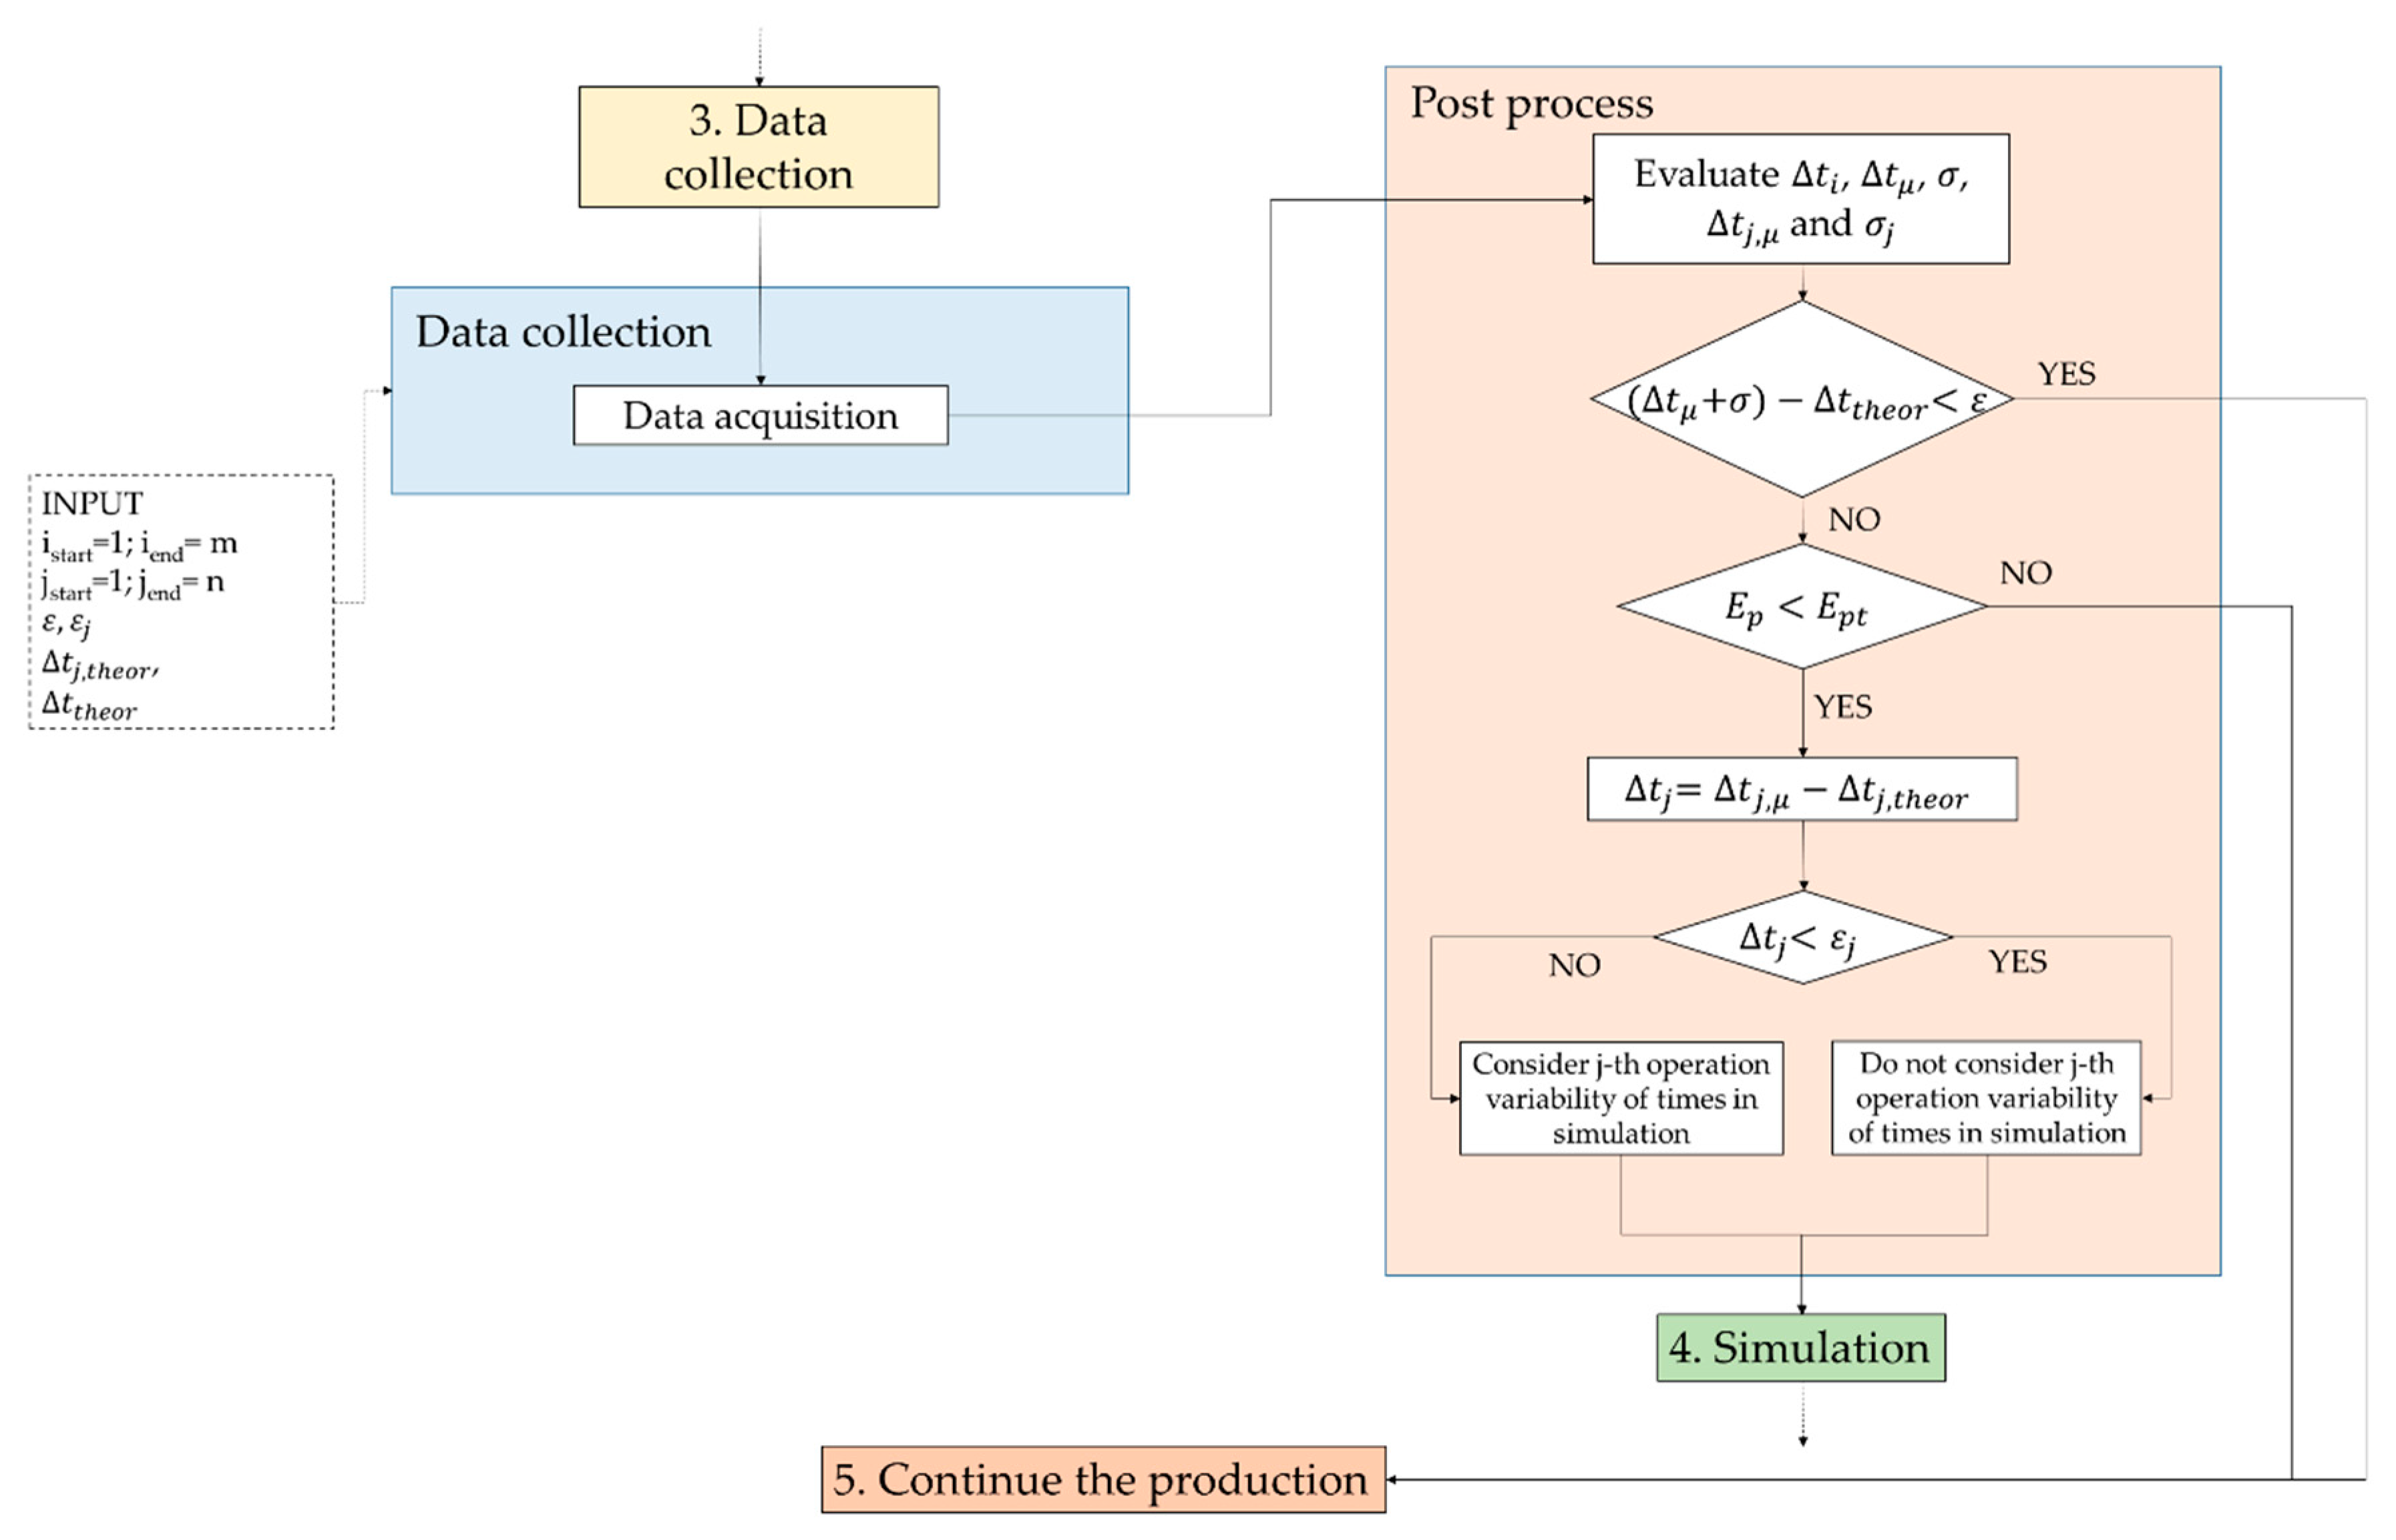
2.1. Data Collection
- Optical systems: they consist of cameras installed within the test environment that capture the position of on-body sensors (in most cases they are simply markers) and allow to reproduce movements. They are mainly used in the field of biomechanics to record human motion because of their high accuracy and their capacity of real time preview of the motion, even if they are very expensive and bulky to be used in production lines.
- Non-Optical systems: all the other systems that do not use cameras may be classified in this category. Depending on the type of used sensors, there are several devices useful to acquire human body postures, such as:
- (i.)
- Electromechanical system, mainly consisting in wearable suites with wires and joints. This device is cheaper than the optical one, but it is less accurate and it obstructs the user’s movements.
- (ii.)
- Magnetic system, which uses magnetic sensors to evaluate the position and the directions of human body segments with respect to a magnetic field generator. The problem of this device is that the magnetic field generator cannot work in many real production environments because of magnetic interferences. So, magnetic systems can be used only in a laboratory environment, keeping the sensors near to the magnetic field generator.
- (iii.)
- Inertial Movements Unit (IMU) sensors, which integrate magnetometer, accelerometer, and gyroscope to capture the orientation of each segment of human body. Inertial sensors are worn by the user and, usually, they do not obstruct the working activities; moreover, as opposed to magnetic sensors, IMU sensors can be used in a real working environment, even if they require an accurate initial calibration. Finally, inertial motion tracking systems are cheaper than the optical systems, but the accuracy is limited and the measurements may also be affected by electromagnetic noise due to the presence of metals in a real factory environment.
2.1.1. Number of Acquired Cycles
2.1.2. Data Acquisition Session
2.1.3. Post Process
- t0i = timeframe corresponding to the start of the ith production cycle;
- t1i = timeframe corresponding to the end of the ith production cycle.
- ∆tij = time needed for the jth operation in the ith acquisition;
- t0ij = timeframe corresponding to the start of the jth operation in the ith acquisition;
- t1ij = timeframe corresponding to the end of the jth operation in the ith acquisition;
- it will be:
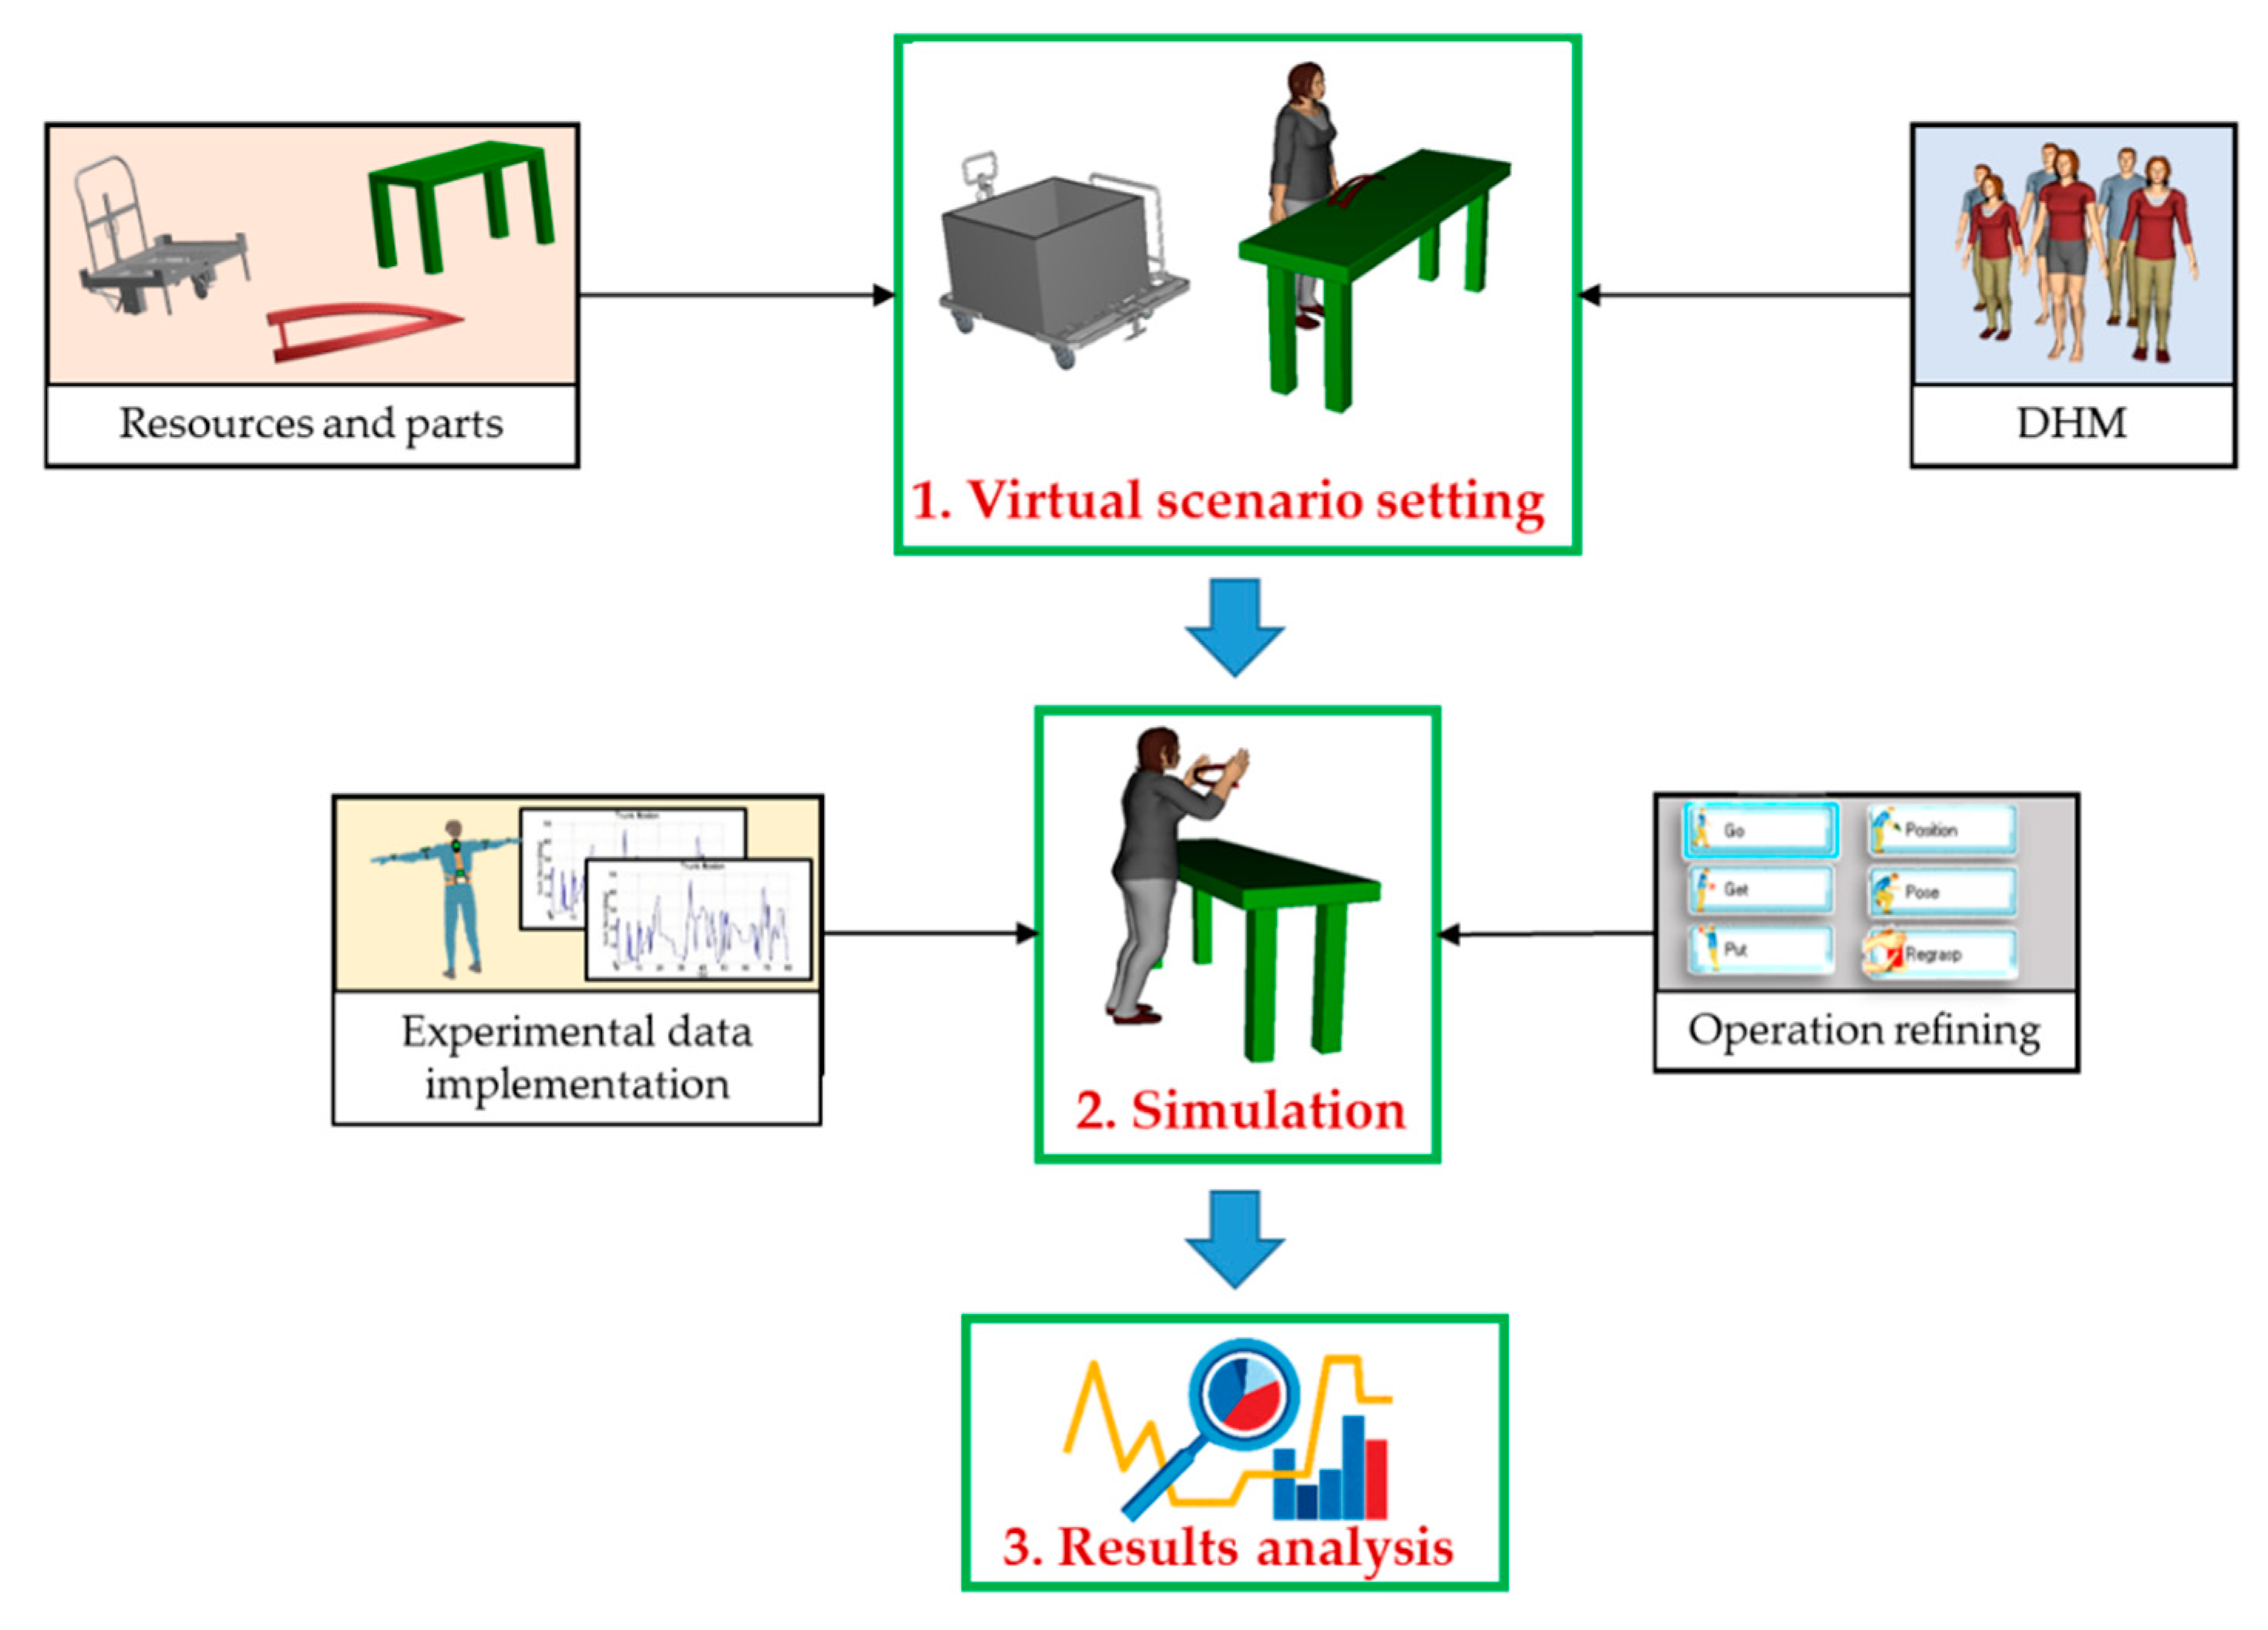
2.2. Simulation
- Virtual scenario setting: the first step regards the virtual representation of the investigated workstation. Having 3D models of resources and parts, it is possible to set up the virtual scenario according to the design specifications. Once the objects are positioned, the male/female DHM is created and customized according to the desired anthropometric characteristics.
- Simulation: the software for human simulation, such as Tecnomatix by Siemens® [42] or Delmia by Dassault Sistèmes® [43], allows creating operations (walking, reaching, gripping, positioning, assuming a posture, applying force…) in a very intuitive way. These environments allow integrating motion capture systems (such as Kinect®, Vicon®, or XSens®), with already implemented communication interfaces, to connect the DHM with the user, replicating the motion. In addition, they give the possibility to build an own interface in order to connect any motion capture system. Since, by using these devices, it is possible to replicate the only motion, it may be necessary to refine other operations, such as grasping, picking/placing, or handling of objects. Simulating an entire work shift, by means of event-based simulation, allows evaluating the performance parameters of the line (working times, number of produced items…), ergonomics and so on.
- Results analysis: numerical data, related to the line performance parameters, need to be analyzed and evaluated in order to deal with the decision-making process, suggesting corrective measures to the team leader.
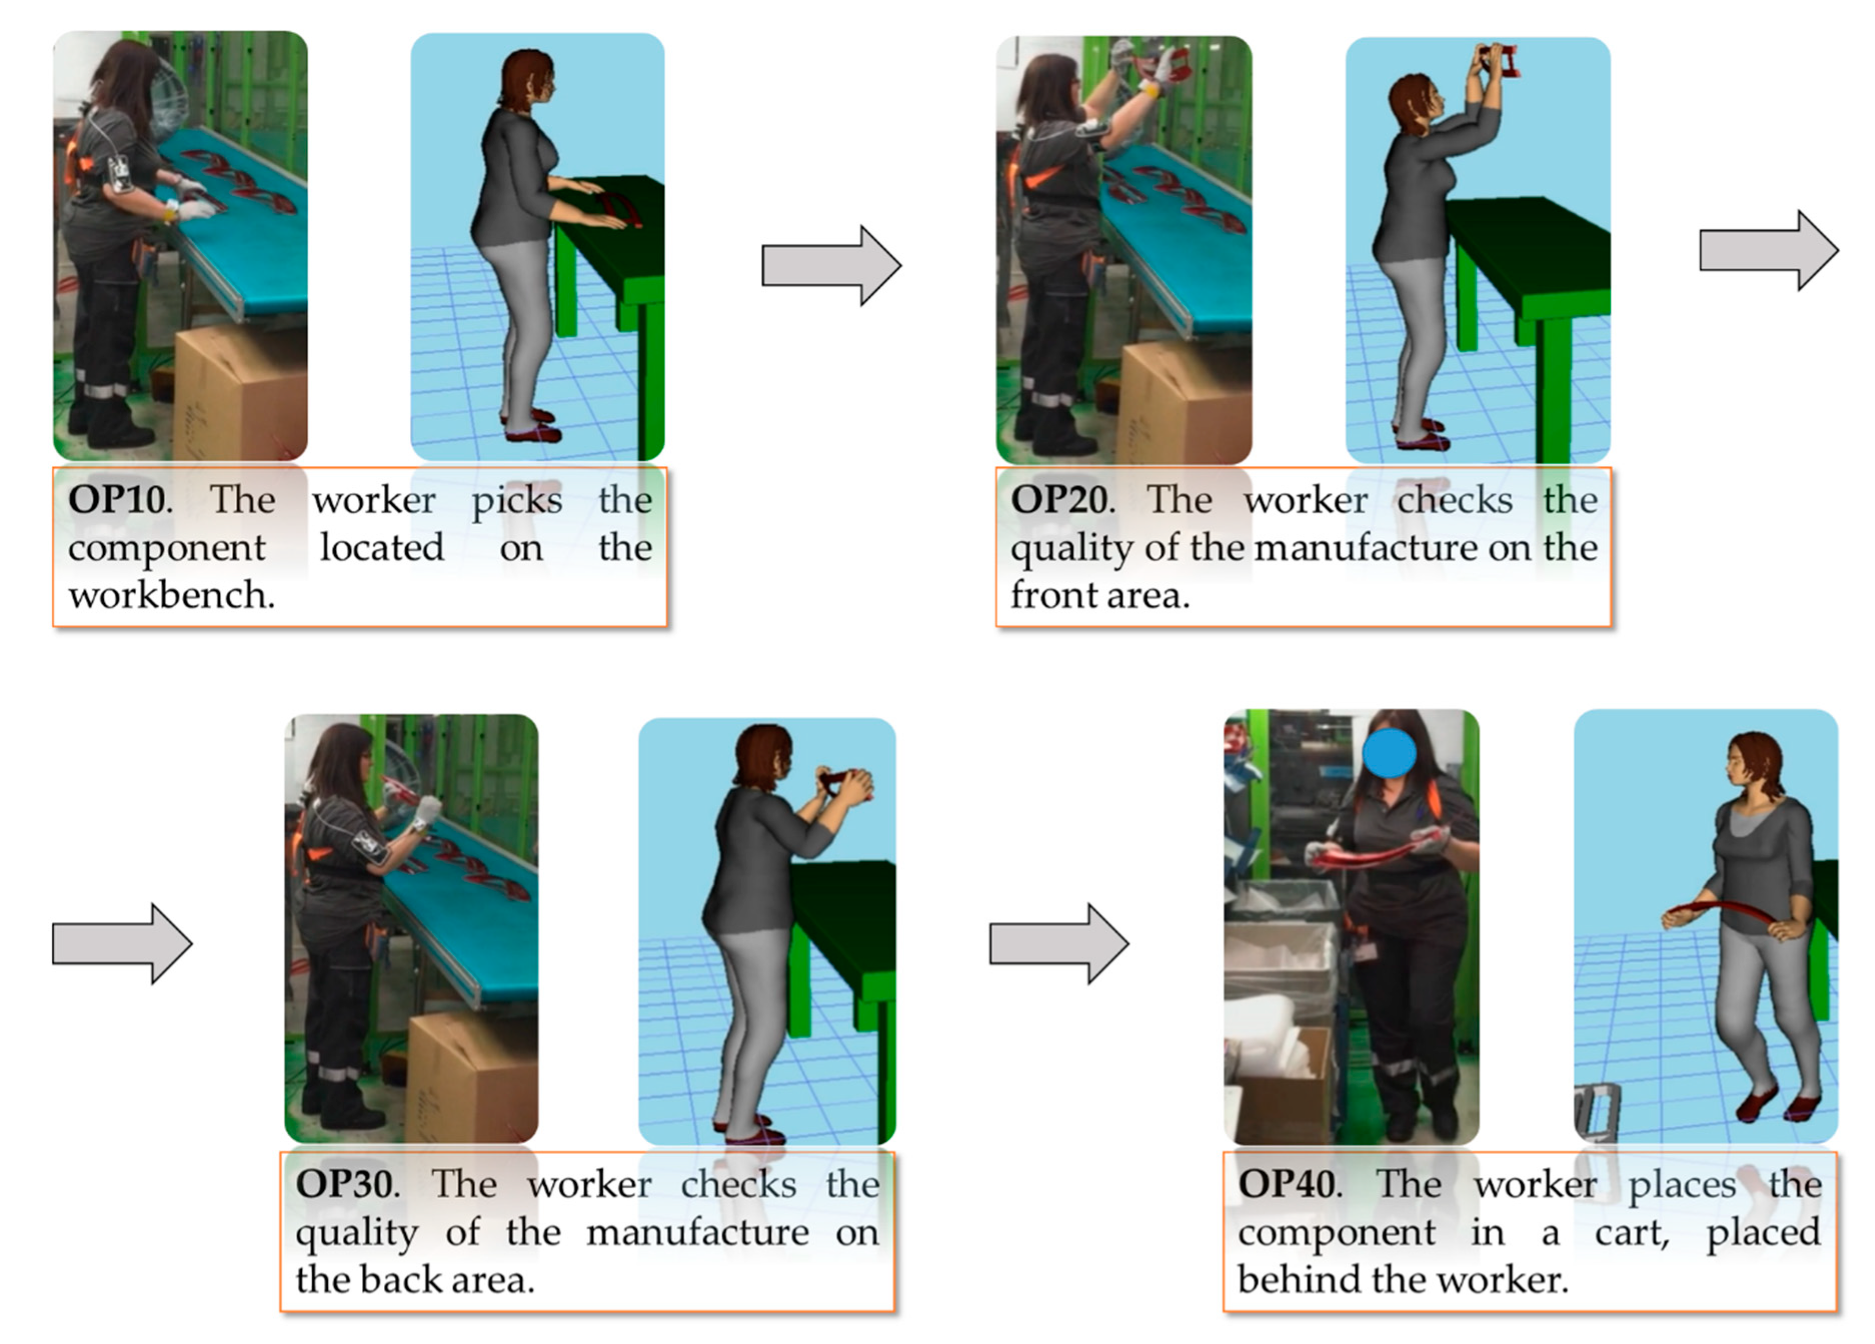
3. Case Study
3.1. Data Collection
3.2. Simulation
| Algorithm 1 Pseudocode to link virtual environment with sensors data |
| Load data from CSV file cocd=new TxCompoundOperationCreationData(“Root Folder”,1,”root”) rootcompound=TxApplication.ActiveDocument.OperationRoot.CreateCompoundOperation(cocd) For each line in CSV
|
4. Results Analysis and Discussions
5. Conclusions
Author Contributions
Funding
Conflicts of Interest
References
- Fera, M.; Greco, A.; Caterino, M.; Gerbino, S.; Caputo, F. Line Balancing Assessment Enhanced by IoT and Simulation Tools. In Proceedings of the 2019 IEEE International Workshop on Metrology for Industry 4.0 and IoT, Naples, Italy, 4–6 June 2019; pp. 84–88. [Google Scholar]
- Lu, Y. Industry 4.0: A survey on technologies, applications and open research issues. J. Ind. Inf. Integr. 2017, 6, 1–10. [Google Scholar] [CrossRef]
- Caputo, F.; Caterino, M.; De Luca, A.; Fera, M.; Greco, A.; Lamanna, G.; Macchiaroli, R.; Manco, P.; Manzo, M.; Perfetto, D. Product and process integrated design to enhance smart manufacturing systems. In Proceedings of the 33rd International ECMS Conference on Modelling and Simulation (ECMS), Napoli, Italy, 11–14 June 2019; Volume 33, pp. 213–220. [Google Scholar]
- Cao, X.; Cheng, P.; Chen, J.; Sun, Y. An Online Optimization Approach for Control. IEEE Trans. Ind. Inform. 2013, 9, 439–450. [Google Scholar] [CrossRef]
- Fera, M.; Macchiaroli, R.; Fruggiero, F.; Lambiase, A. A new perspective for production process analysis using additive manufacturing—Complexity vs. production volume. Int. J. Adv. Manuf. Tech. 2018, 95, 673–685. [Google Scholar] [CrossRef]
- Atzori, L.; Iera, A.; Morabito, G. The Internet of Things: A survey. Comput. Netw. 2010, 54, 2787–2805. [Google Scholar] [CrossRef]
- Chan, M.; Estève, D.; Fourniols, J.Y.; Escriba, C.; Campo, E. Smart wearable systems: Current status and future challenges. Artif. Intell. Med. 2012, 56, 137–156. [Google Scholar] [CrossRef]
- Yuce, B.; Fruggiero, F.; Packianather, M.S.; Pham, D.T.; Mastrocinque, E.; Lambiase, A.; Fera, M. Hybrid Genetic Bees Algorithm applied to single machine scheduling with earliness and tardiness penalties. Comput. Ind. Eng. 2017, 113, 842–858. [Google Scholar] [CrossRef]
- Fera, M.; Fruggiero, F.; Lambiase, A.; Macchiaroli, R.; Todisco, V. A modified genetic algorithm for time and cost optimization of an additive manufacturing single-machine scheduling. Int. J. Ind. Eng. Comput. 2018, 9, 423–438. [Google Scholar] [CrossRef]
- Alessio, L.; Franco, G.; Tomei, F. Trattato di Medicina del Lavoro; Piccin–Nuova Libraria: Padova, Italy, 2015. [Google Scholar]
- Caputo, F.; Greco, A.; D’Amato, E.; Notaro, I.; Spada, S. Human Posture Tracking System for Industrial Process Design and Assessment. Adv. Intell. Syst. 2018, 722, 450–455. [Google Scholar]
- Caputo, F.; Greco, A.; D’Amato, E.; Notaro, I.; Lo Sardo, M.; Spada, S.; Ghibaudo, L. A Human Posture Inertial Tracking System for Ergonomic Assessments. Adv. Intell. Syst. 2019, 825, 173–184. [Google Scholar]
- Monaco, M.G.L.; Fiori, L.; Marchesi, A.; Greco, A.; Ghibaudo, L.; Spada, S.; Caputo, F.; Miraglia, N.; Silvetti, A.; Draicchio, F. Biomechanical overload evaluation in manufacturing: A novel approach with sEMG and inertial motion capture integration. Adv. Intell. Syst. 2019, 818, 719–726. [Google Scholar]
- Monaco, M.G.L.; Marchesi, A.; Greco, A.; Fiori, L.; Silvetti, A.; Caputo, F.; Miraglia, N.; Draicchio, F. Biomechanical load evaluation by means of wearable devices in industrial environments: An inertial motion capture system and sEMG based protocol. Adv. Intell. Syst. 2019, 795, 233–242. [Google Scholar]
- Merino, G.; da Silva, L.; Mattos, D.; Guimaraes, B.; Merino, E. Ergonomic evaluation of the musculoskeletal risks in a banana harvesting activity through qualitative and quantitative measures, with emphasis on motion capture (Xsens) and EMG. Int. J. Ind. Ergon. 2019, 69, 80–89. [Google Scholar] [CrossRef]
- Banks, J.; Carson, J.S., II; Nelson, B.L.; Nicol, D.M. Discrete-Event System Simulation, 5th ed.; Essex: Harlow, UK, 2019. [Google Scholar]
- Fischer, M.L.; Ittner, C.D. The Impact of Product Variety on Automobile Assembly Operations: Empirical Evidence and Simulation Analysis. Manag. Sci. 1999, 45, 771–786. [Google Scholar] [CrossRef]
- Savsar, M. Simulation analysis of a pull-push system for an electronic assembly line. Int. J. Prod Econ. 1997, 51, 205–214. [Google Scholar] [CrossRef]
- Gujarathi, N.S.; Ogale, R.M.; Gupta, T. Production capacity analysis of a shock absorber assembly line using simulation. In Proceedings of the 36th Conference on Winter Simulation (WSC), Washington, DC, USA, 5–8 December 2004; Volume 2, pp. 158–162. [Google Scholar]
- Di Gironimo, G.; Lanzotti, A.; Peluso, F.; Renno, F. Virtual production planning of a high-speed train using a discrete event simulation based approach. Int. J. Interact. Des. Manuf. 2013, 9, 65–75. [Google Scholar] [CrossRef]
- Sandanayake, Y.G.; Oduoza, C.F.; Proverbs, D.G. A systematic modelling and simulation approach for JIT performance optimisation. Robot. Comput. Integr. Manuf. 2008, 24, 735–743. [Google Scholar] [CrossRef]
- Nagarur, N.; Azeem, A. Impact of commonality and flexibility on manufacturing performance: A simulation study. Int. J. Prod. Econ. 1999, 60, 125–134. [Google Scholar] [CrossRef]
- Liu, Q.; Zhang, H.; Leng, J.; Chen, X. Digital twin-driven rapid individualized designing of automated flo-shop manufacturing system. Int. J. Prod. Res. 2019, 57, 3903–3919. [Google Scholar] [CrossRef]
- Zhang, H.; Liu, Q.; Zhang, D.; Leng, J. A digital twin-based approach for designing and multi-objective optimization of hollow glass production line. IEEE Access 2017, 5, 26901–26911. [Google Scholar] [CrossRef]
- Leng, J.; Zhang, H.; Yan, D.; Liu, Q.; Chen, X.; Zhang, D. Digital twin-driven manufacturing cyber-physical system for parallel controlling of smart workshop. J. Ambient Intell. Humaniz. Comput. 2019, 10, 1155–1166. [Google Scholar] [CrossRef]
- Alkan, B.; Vera, D.; Ahmad, M.; Ahmad, B.; Harrison, R. A model for complexity assessment in manual assembly operations through predetermined motion time systems. Proc. CIRP 2016, 44, 429–434. [Google Scholar] [CrossRef]
- Caputo, F.; Greco, A.; Fera, M.; Macchiaroli, R. Digital twin to enhance the integration of ergonomics in the workplace design. Int. J. Ind. Ergon. 2019, 71, 20–31. [Google Scholar] [CrossRef]
- Caputo, F.; Greco, A.; Fera, M.; Macchiaroli, R. Workplace design ergonomic validation based on multiple human factors assessment methods and simulation. Prod. Manuf. Res. 2019, 7, 195–222. [Google Scholar] [CrossRef]
- De Magistris, G.; Micaelli, A.; Savin, J.; Gaudez, C.; Marsot, J. Dynamic Control of DHM for Ergonomic Assessment. Int. J. Ind. Ergon. 2013, 43, 170–180. [Google Scholar] [CrossRef]
- Alexopoulos, K.; Mavrikios, D.; Chryssolouris, G. ErgoToolkit: An ergonomic Analysis Tool in a Virtual Manufacturing Environment. Int. J. Comput. Integr. M 2012, 26, 440–452. [Google Scholar] [CrossRef]
- Björkenstam, S.; Johan, S.C.; Niclas, D.; Robert, B.; Bengt, L. Enhancing Digital Human motion Planning of Assembly Tasks Through Dynamics and Optimal Control. Proc. CIRP 2016, 44, 20–25. [Google Scholar] [CrossRef]
- Case, K.; Hussain, A.; Marshall, R.; Summerskill, S.; Gyi, D. Digital human modelling and the ageing workforce. Procedia Manuf. 2015, 10, 3694–3701. [Google Scholar] [CrossRef]
- Mukhopadhyay, S.C. Wearable sensors for human activity monitoring: A review. IEEE Sens. J. 2015, 15, 1321–1330. [Google Scholar] [CrossRef]
- Knight, J.F.; Bristow, H.W.; Anastopoulou, S.; Baber, C.; Schwirtz, A.; Arvanitis, T.N. Uses of accelerometer data collected from a wearable system. Pers. Ubiquitous Comput. 2007, 11, 117–132. [Google Scholar] [CrossRef]
- Catarci, T.; Firmani, D.; Leotta, F.; Mandreoli, F.; Mercella, M.; Sapio, F. A conceptual architecture and model for smart manufacturing relying on service-based digital twin. In Proceedings of the 2019 IEEE International Conference on Web Services (ICWS), Milan, Italy, 8–13 July 2019. [Google Scholar]
- Malik, A.A.; Bilberg, A. Digital twins of human robot collaboration in a production setting. Procedia Manuf. 2018, 17, 278–285. [Google Scholar] [CrossRef]
- Belli, L.; Davoli, L.; Medioli, A.; Marchini, P.L.; Ferrari, G. Toward Industry 4.0 with IoT: Optimizing business processes in an evolving manufacturing factory. Front. ICT 2019, 6. [Google Scholar] [CrossRef]
- Short, M.; Twiddle, J. An industrial digitalization platform for condition monitoring and predictive maintenance of pumping equipment. Sensors 2019, 19, 3781. [Google Scholar] [CrossRef] [PubMed]
- Li, C.; Fahmy, A.; Sienz, J. An augmented reality based human-robot interaction interface using Kalman filter sensor fusion. Sensors 2019, 19, 4586. [Google Scholar] [CrossRef] [PubMed]
- Nikolakis, N.; Alexopoulos, K.; Xanthakis, E.; Chryssolouris, G. The digital twin implementation for linking the virtual representation of human-based production tasks to their physical counterpart in the factory floor. Int. J. Comput. Integr. Manuf. 2019, 31, 1–12. [Google Scholar] [CrossRef]
- Giacomazzi, F.; Conti, C. Manuale di gestione della produzione, 3rd ed.; ISEDI: Milano, Italy, 1975. [Google Scholar]
- Tecnomatix. Available online: https://www.plm.automation.siemens.com/global/en/products/tecnomatix/ (accessed on 10 December 2019).
- Delmia. Available online: https://www.3ds.com/products-services/delmia/ (accessed on 10 December 2019).


| ∆tj,μ [s] | σj [s] | ∆tj,theor [s] | |
|---|---|---|---|
| OP 10 (j = 1) | 2.30 | 0.10 | 2.30 |
| OP 20 (j = 2) | 10.40 | 2.78 | 9.20 |
| OP 30 (j = 3) | 5.10 | 1.30 | 4.60 |
| OP 40 (j = 4) | 3.80 | 0.32 | 3.90 |
| TOTAL | 21.60 (∆tμ) | 3.08 (σ) | 20.00 (∆ttheor) |
| ∆tj | εj | ||
|---|---|---|---|
| OP10 (j = 1) | 0 | < | 0.23 |
| OP20 (j = 2) | 1.20 | > | 0.92 |
| OP30 (j = 3) | 0.5 | > | 0.46 |
| OP40 (j = 4) | 0.1 | < | 0.39 |
| Values | |
|---|---|
| Total number of completed cycles (controlled components) | 1205 |
| Working cycles requiring more than 20 s | 1005 |
| Working cycles requiring less than (or equal to) 20 s | 200 |
| Value [s] | |
|---|---|
| Theoretical cycle time—∆ttheor | 20 |
| Experimental mean cycle time—∆tμ | 21.6 |
| Numerical mean cycle time—∆tμ,s | 22.4 |
© 2019 by the authors. Licensee MDPI, Basel, Switzerland. This article is an open access article distributed under the terms and conditions of the Creative Commons Attribution (CC BY) license (http://creativecommons.org/licenses/by/4.0/).
Share and Cite
Fera, M.; Greco, A.; Caterino, M.; Gerbino, S.; Caputo, F.; Macchiaroli, R.; D’Amato, E. Towards Digital Twin Implementation for Assessing Production Line Performance and Balancing. Sensors 2020, 20, 97. https://doi.org/10.3390/s20010097
Fera M, Greco A, Caterino M, Gerbino S, Caputo F, Macchiaroli R, D’Amato E. Towards Digital Twin Implementation for Assessing Production Line Performance and Balancing. Sensors. 2020; 20(1):97. https://doi.org/10.3390/s20010097
Chicago/Turabian StyleFera, Marcello, Alessandro Greco, Mario Caterino, Salvatore Gerbino, Francesco Caputo, Roberto Macchiaroli, and Egidio D’Amato. 2020. "Towards Digital Twin Implementation for Assessing Production Line Performance and Balancing" Sensors 20, no. 1: 97. https://doi.org/10.3390/s20010097
APA StyleFera, M., Greco, A., Caterino, M., Gerbino, S., Caputo, F., Macchiaroli, R., & D’Amato, E. (2020). Towards Digital Twin Implementation for Assessing Production Line Performance and Balancing. Sensors, 20(1), 97. https://doi.org/10.3390/s20010097