Abstract
This paper presents a novel feature selection method to design a non-invasive driver drowsiness detection system based on steering wheel data. The proposed feature selector can select the most related features to the drowsiness level to improve the classification accuracy. This method is based on the combination of the filter and wrapper feature selection algorithms using adaptive neuro-fuzzy inference system (ANFIS). In this method firstly, four different filter indexes are applied on extracted features from steering wheel data. After that, output values of each filter index are imported as inputs to a fuzzy inference system to determine the importance degree of each feature and select the most important features. Then, the selected features are imported to a support vector machine (SVM) for binary classification to classify the driving conditions in two classes of drowsy and awake. Finally, the classifier accuracy is exploited to adjust parameters of an adaptive fuzzy system using a particle swarm optimization (PSO) algorithm. The experimental data were collected from about 20.5 h of driving in the simulator. The results show that the drowsiness detection system is working with a high accuracy and also confirm that this method is more accurate than the recent available algorithms.
1. Introduction
1.1. Driver Drowsiness Detection
Drowsiness detection is an important factor for road safety, in manual driving as well as in future semi-automated driving. In manual driving, about 20 to 30% of fatal road accidents are reported to be attributable to driver drowsiness [1,2]. In SAE level 3 automated driving, drivers will be allowed to do a secondary task, but the automation system has to hand-over vehicle guidance whenever it cannot manage the situation. A hand-over to a drowsy driver will eventually not be manageable, so a restriction of vehicle automation to alert drivers detected by a reliable drowsiness detection system could be an option for oncoming SAE level 3 systems.
Two general strategies could be considered to detect driver drowsiness: intrusive and non-intrusive. In intrusive methods, the drowsiness state is analyzed using processing of physiological outputs such as electroencephalographic (EEG) and electrooculographic (EOG) information [3]. High performance for drowsiness detection could be obtained using intrusive methods but driver movements can negatively affect the reliability of the designed system. Non-intrusive methods provide an estimation for drowsiness using facial features of drivers [4,5] or vehicle-based measures [6]. On one hand, these methods have some shortcomings. As an example, different lighting conditions can have disrupting effects on the detection performance. On the other hand, vehicle-based measures reflect the driving behavior, and therefore, can provide an acceptable estimation for drowsiness detection in an unobtrusive way [7]. Gas and brake pedal inputs, changes in vehicle speed, steering wheel angle and velocity signals and lateral distance of the vehicle from center of the line are typically used as vehicle-based measurement to detect the drowsiness [8].
Steering wheel data have been employed in several previous studies in this application. For example, Li et al. in [9] presented a method for online drowsiness detection in drivers based on extracted approximate entropy from Steering Wheel Angle (SWA) signals. Extracted approximate entropy feature was linearized using adaptive piecewise linear fitting and the wrapping distance between linear feature series was used in binary classifier to determine the drowsiness state. Frequency and time-frequency features of SWA were extracted by applying Short Time Fourier Transform (STFT), and Wavelet Transform (WT) in [10] for drowsiness detection. Meng et al. in [8] used a driving simulator to collect eleven features related to steering wheel and applied multivariate analysis of variance to find parameters that had significant correlation with the level of drowsiness. Using this method, the numbers of parameters were reduced to five features. This paper employs steering angle and velocity data for driver drowsiness detection as an application in order to testify the performance of the proposed feature selection method.
1.2. Feature Selection
Feature selection is a method to select a subset of features from the multidimensional data space in order to improve the accuracy of classifiers, reduce the computational burden in classification process and better understanding of the data in machine learning applications [11]. Real-world data set mostly contains redundant and dependent variables that cannot provide extra information about the class labels. Moreover, some of the features usually do not have correlation to the class labels and can produce bias noise for the classifiers and reduce its classification performance [12].
Feature selection is an active research field and has been used in different applications such as bioinformatics data mining [13], image processing [14], text classification [15] and fault diagnosis in mechanical systems [16,17]. Different feature selection techniques have been proposed by researchers that can be generally classified in three categories: the filter approach, the wrapper approach and the embedded approach [18]. The filter method is based on association between the feature and the class label and it is independent of learning models [19]. In contrast, in the structure of wrapper approach, a learning model is employed and features are selected with the aim of performance improving of the learning model [11]. Embedded methods have been proposed to reduce the computation time in wrapper methods and feature selection is a part of training process in these methods. In other words, embedded methods specify which features provide the best accuracy while the model is being created [20].
Fuzzy inference systems have been used in the structure of feature selection methods [21]. Fuzzy logic can be useful for solving the multi-objective optimization problem of feature selection process to maximize the model accuracy and minimize the number of used features and avoid weighting of different goals in this kind of optimization problems [22]. Cateni et al. in [23] designed a method for feature selection by combining four different filter methods using fuzzy logic to specify the importance degree of each feature. Features that have an importance degree more than a predefined threshold value could be exploited as inputs to classifiers. In order to adjust the parameters of fuzzy system, Particle Swarm Optimization (PSO) has been wieldy used by researchers for example in applications of freight volume forecasting [24] and heating system planning problem [25].
In the previous fuzzy feature selection methods, predefined parameters of fuzzy inference systems are constant and independent to the dynamical behaviors of data. In this paper a new method based on neuro-fuzzy logic has been proposed which is a combination of filter methods and neuro-fuzzy-wrapper method. Adaptive training of the parameters in the fuzzy rule-base considers different dynamical changes in the dataset. In the first step, four different filter methods (Fisher, T-test, Correlation and Mutual information) have been exploited used to determine the importance index of each feature, then a fuzzy inference system has been designed and four filter indexes have been used as inputs of the fuzzy system to determine the final importance degree of each feature. Features which have importance degrees more than a predefined threshold value have been employed in the Support Vector Machine (SVM) binary classifier. Classifier accuracy has been used as a feedback for the adjustment of parameters in the fuzzy membership functions. PSO as an evolutionary optimization algorithm, has been exploited to train Adaptive Neuro-Fuzzy Inference System (ANFIS). In order to evaluate the proposed method, a real-world data set related to drowsiness detection in drivers has been used. Experimental results show that proposed method has a better accuracy than non-adaptive fuzzy feature selection methods.
2. Materials and Methods
The proposed approach for feature selection is based on combination of filter and wrapper methods using ANFIS. Using parameter adjustment algorithms, ANFIS can help to select the best features based on dynamical behaviors of raw data. Figure 1 shows the structure of the proposed method. In the following sections, different parts of the proposed method have been explained.
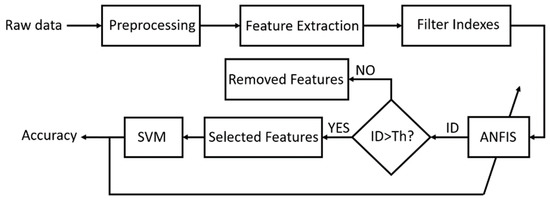
Figure 1.
Scheme of the proposed approach procedure; ID and Th mean Importance Degree and its Threshold, respectively.
2.1. Preprocessing
Steering wheel angle signal is dependent to the road geometry and curvature. In the straight sections of the road, steering wheel signals only consist of lane-keeping adjustments of steering by drivers. In contrast, steering signals in curved sections consist of road geometry effects. As the test scenario includes both straight and curved sections, the effect of road curvature on steering signal should be removed in sliding windows to detect the drowsy states in drivers [26]. This was performed by applying the following equations:
where, is the length of sliding window, is the first point (left side) of the window and is the average of steering angle, , in the sliding window which has been subtracted from raw signal to obtain the which is the preprocessed signal.
Since there is no specific window size mentioned in literatures and in order to select the optimal length of the window for our data, different window lengths have been tested and the best performance of the system has been obtained by three-second window. We also considered 50 percent of overlap (1.5 s) for each two successive windows to retain the dynamics behavior of input data. The same window length and overlap percentage have been also used to extract the features from signals in Section 2.2. Figure 2 shows the result of road curve effect removal on steering angle data. According to this figure, the driver is trying to follow the two left turns (the steering angles are positive) based on the raw signal (dashed line) and the effect of the curvy part of the road has been cancelled in the preprocessed signal (solid line).
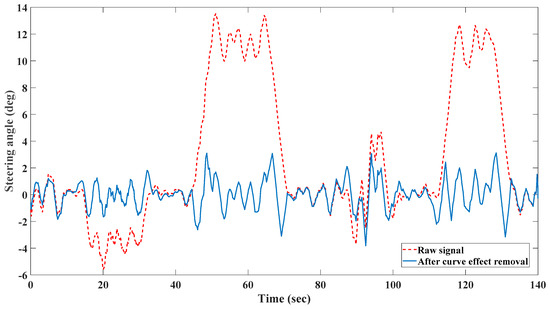
Figure 2.
Road curve effect removal.
2.2. Feature Extraction
Steering signal contains different information of driving behavior in time and frequency domains. Before feature selection, a sliding window with the length of three seconds (180 samples) and 1.5 s (90 samples) of overlap has been applied on the signal. Thirty-six features have been extracted form steering wheel angle and velocity signals in time and frequency domains. These features have been selected based on some previous works on drowsiness detection of drivers using steering wheel signals [10,27,28].
Time domain features used in the model were range, standard deviation, energy, Zero Crossing Rate (ZCR), first to third quartiles, Katz Fractal Dimension (KFD), skewness, kurtosis, Sample Entropy (SamEn), and Shannon Entropy (ShEn). Frequency domain features were frequency variability, Spectral Entropy (SpEn), spectral flux, Center of Gravity of Frequency (CGF), dominant frequency and average value of power spectral density. Extracted features have been presented in Table 1 and Table 2, where superscript refers to features from steering angle signal and superscript demonstrates features extracted from steering velocity signal. Extracted features have been normalized between 0 and 1 using their minimum and maximum values.

Table 1.
Extracted time domain features from steering angle and velocity signals.
Table 2.
Extracted frequency domain features from steering angle and velocity signals.
2.3. Filter Method Indexes
Consider the feature matrix and classes output as given in Equations (3) and (4), respectively:
where, is a feature vector, is a binary class label, , is the number of extracted features from input signals and is the number of samples for each feature. The aim of the proposed method is selecting the best features to have the highest classifier accuracy for predicting the class label. In the proposed method, four different filter indexes have been derived for each feature. These indexes include Fisher, Correlation, T-test and Mutual Information and have been briefly explained as follows:
2.3.1. Fisher Index
Fisher index has been widely used by researchers for feature selection and it could be calculated for each feature independently of other features [29]. This index could be calculated by Equation (5):
where and are the mean value and standard deviation in the samples belonging to the two classes, respectively.
2.3.2. Correlation Index
Pearson correlation coefficient is a simple filter index for feature selection [30]. It is calculated by (6):
where, is the covariance between the i-th feature and class label , is standard deviation of the i-th feature and is standard deviation of the class label.
2.3.3. T-test Index
T-test index is used to determine specific statistical difference between two variables [31]. This index is calculated using Equation (7):
where and are the number of observations belonged to two different classes.
2.3.4. Mutual Information Index
Mutual information is a method of measuring the amount of information that could be obtained for one random variable through the other random variable [32]. This index intends to calculate the relevancy between each feature and class label using mutual information and is calculated using Equation (8):
where , and are Probability Density Function (PDF) for the i-th feature, PDF for class label outputs and joint PDF between and , respectively.
2.4. Fuzzy Inference System
In order to combine advantages of four used filter feature selection methods, fuzzy logic and adaptive adjustment of its parameters have been exploited. Every fuzzy system consists of four main parts: fuzzifier, fuzzy rule-base, inference engine and defuzzifier. Gaussian membership functions as given in (9) have been selected for fuzzification process:
where is the input to the fuzzy system. In this type of membership functions, mean, and standard deviation, are nonlinear parameters that should be adjusted by optimization algorithms. Three Membership Functions (MFs), Low (L), Medium (M) and High (H), have been considered for each input. These membership functions have been shown in Figure 3. Takagi-Sugeno inference type by singleton consequences in fuzzy rules has been used in the fuzzy rule-base part. By using this inference type, deffuzification process has been avoided [33]. This fuzzy rule-base has 81 rules and three singleton consequences have been considered for Importance Degree (ID) in each fuzzy rule. The -th rule of the rule base has been described in Equation (10):
where, , , and are Fisher, correlation, T-test and mutual information indexes, respectively, and to are MFs for inputs and could gain each of three different states of L, M and H. is the determined importance degree obtained from the fuzzy rule, and which has three different possible values of 0, 0.5 and 1, is fuzzy singleton consequence. Threshold of 0.5 for ID has been used to select the final features to be inputted to the SVM classifier.
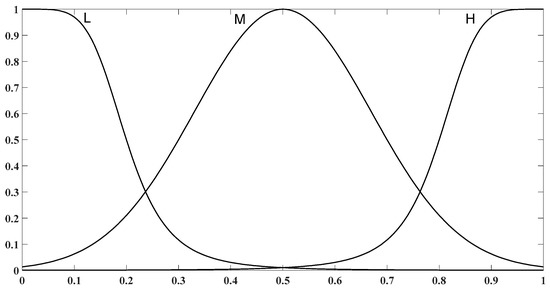
Figure 3.
Initial membership functions for all of fuzzy system inputs.
2.5. ANFIS Training by PSO Algorithm
PSO is an evolutionary optimization method that solve the optimization problems by improving the candidate solutions. In this optimization method, candidate solutions may fly in parameter search space to find the best solutions using best performances of their neighbor particles [24,34]. In other words, each individual particle flies in the search space with a dynamically adjusted velocity. This adjustment is based on flying experience of each particle and its neighbors.
PSO has three different main parts. The first part is the momentum for each solution to continue its current direction in the search space. The second part is the personal best for each particle in its memory. Finally, the third part is the global best for the whole of population. In this part, the position of the neighbor particles has been considered to obtain the global best solution for the optimization problem. In this paper, the half of square error, as given in Equation (11), is considered as objective function for optimization problem and adjusting the parameters of ANFIS:
where, is the estimated binary value for KSS. Details of PSO algorithm have been explained in the Appendix A and the parameters of PSO are listed in Table 3.
Table 3.
Parameters of PSO.
2.6. Support Vector Machine Classifier
In order to classify the driver states in two classes of drowsy and alert, binary SVM classifier has been applied. Using this classifier, the performance of proposed method for real world data set can be evaluated and compared with other feature selection methods. SVM is a training algorithm for leaning classification and regression rules from data set.
This method is based on obtaining optimal boundary of two sets for classifying the data set. This classification method is a robust algorithm; therefore, it is suitable for noisy and real world data set. This classification method can use different kernel functions to be applicable in nonlinear data space without explicitly requiring a nonlinear algorithm. The details and formulation of the SVM have been described in [35].
3. Dataset and Experimental Setup
Experiments were performed using a bus driving simulator (BI301Semi) at the K. N. Toosi University of Technology. In this simulator, three high-resolution 3D video projectors have been employed to produce a field of view of 180°. In order to simulate road conditions, several pneumatic actuators have been exploited and an electric force feedback has also been used to provide steering wheel torque [36]. Figure 4a,b show the external and internal views of the used driving simulator, respectively.
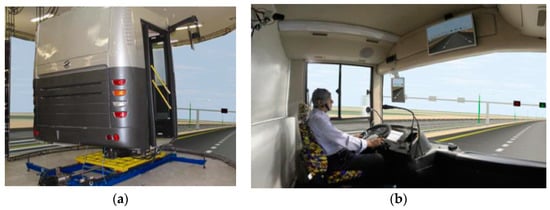
Figure 4.
Driving simulator: (a) External view; (b) Internal view.
A total of 39 bus drivers from a variety of driving professions completed the study. The experimental tests were conducted around 2:00 PM until the driver was too drowsy to continue and the overall time of driving tests was about 53 h. After checking the collected data, only driving test that had the whole KSS range from 1 to 9 have been considered to assess the drowsiness level. Selected data set has about 20 h and 36 min of collected variables. Steering wheel angle signal with the sampling rate set to 60 Hz has been gathered to assess the drowsiness. The test track was a closed circular with several sinusoidal smooth curves all through the path. The test track has been presented in the Figure 5. In order to assess the drowsiness level of drivers, binary version of Karolinska Sleepiness Scale (KSS) [7,37] has been employed. Driving periods that were corresponded to KSS values from one to six have been used to define the alert class and KSS values of eight and nine defined the drowsy class. In order to obtain a better separation between two binary classes, samples with KSS value of seven have been ignored in the proposed method.
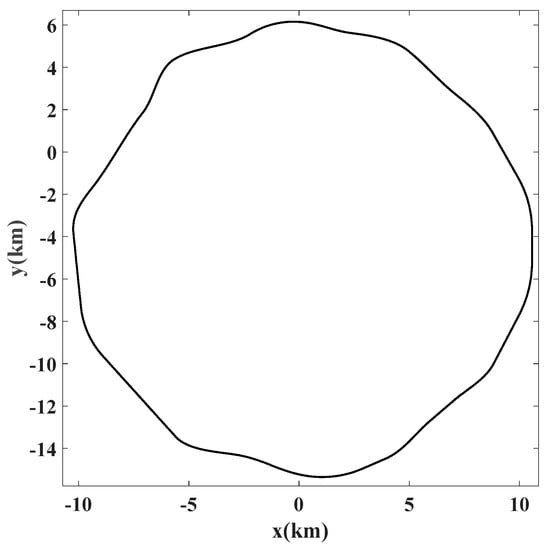
Figure 5.
Test track for driving tests.
4. Results and Discussion
This section presents the experimental results obtained from applying proposed method on driving tests. Proposed neuro-fuzzy feature selection method as well as each single filter methods that have been explained in pervious sections have been applied on driving simulator dataset to detect the drowsiness in bus drivers. Performance of the proposed method has been evaluated using following indexes:
- (1)
- True Positive (TP): number of drowsy states that correctly classified as drowsy;
- (2)
- True Negative (TN): number of awake states that correctly identified as awake;
- (3)
- False Negative (FN): number of drowsy states that incorrectly identified as awake;
- (4)
- False Positive (FP): number of awake states that incorrectly identified as drowsy;
Using the above indexes, accuracy percentage of each method is calculated with Equation (12):
The mentioned indexes can be used in a confusion matrix as shown in Table 4 to evaluate the performance of the proposed method.
Table 4.
Confusion matrix for proposed method.
The FP is defined as the number of awake states that are incorrectly identified as drowsy, hence it only describes the situation of false alarming and does not put the driver in dangerous conditions, while FN is the number of drowsy states that are incorrectly identified as awake and can cause risky situations. As in can be seen, the probability percentage of these situations is less than 1.5%, which is acceptable.
In order to evaluate the proposed method, its accuracy has been compared with other features selection methods in Table 5. Our dataset has been used to implement on proposed method in [23], where the parameters of fuzzy membership functions were constant. Table 5 demonstrates that our method outperforms the suggested method in [23]. Receiver Operating Characteristic (ROC) has been also applied to compare the results of the proposed method with other feature selection algorithms (Figure 6). The Area Under this Curve (AUC) is between 0 and 1 and AUC with the maximum value corresponds to a perfect classifier. Figure 6 shows that the proposed feature selection algorithm can improve the classifier performance. When all of the features have been used as classifier inputs, redundancy between extracted features can increase the false positive rate and AUC is the lowest value in comparison with other methods. Accuracy and AUC of the different methods have been compared in Table 5.
Table 5.
Obtained classification accuracy and selected features for each feature selection method.
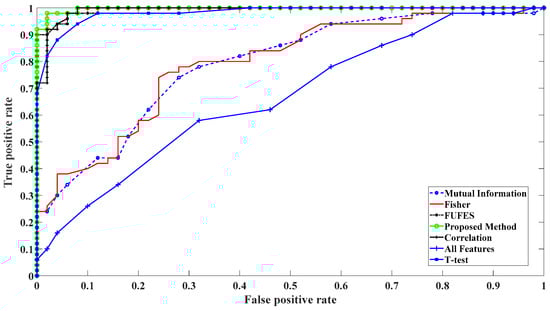
Figure 6.
Receiver Operating Characteristic (ROC) curve for evaluation of classifier performance with different feature selection methods.
Results show that adjustment of the parameters of fuzzy system can outperform FUzzy FEature Selection (FUFES) method when lower number of features have been applied as classifier inputs. Moreover, our method needs lower number of selected features to have a better accuracy for SVM classifier. According to Table 5, T-test index and the proposed method selected the same number of features and three of them are similar but other two different features make about 8 percent of accuracy difference. Although Correlation index provides an acceptable accuracy for classification, it needs 25 features which increases the computation time.
Performance of the proposed system has been compared with previously reported non-invasive drowsiness detection systems in Table 6. This comparison shows that adaptive selection of input features outperforms the classification accuracy. According to the Table 6, it is might be more significant to use nonredundant features for classification than employing different vehicle variables for drowsiness detection in drivers. For example, in [38] Steering wheel angle, lateral displacement, speed, eye blinking and pupil diameter have been exploited in Multilevel Ordered Logit (MOL) to detect the drowsiness, while our method only used steering angle and steering velocity and outperforms the results of [38] about 29%.
Table 6.
Comparison the accuracy of the proposed method with the reported results of non-invasive drowsiness detection system in previous studies.
PSO training of ANFIS made parameter adjustment of fuzzy membership function and their final shapes to be different from their initial. Figure 7 demonstrates the final obtained membership functions for each filter index. Comparison between final and initial membership functions shows that PSO changes both of the parameters of average and standard deviation to decrease the cost function value.
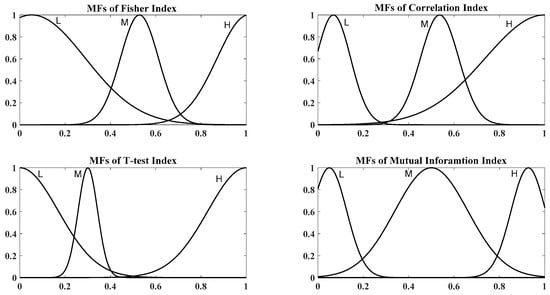
Figure 7.
Final membership functions; upper left: Fisher index, upper right: Correlation index, lower left: T-test index, and lower right: Mutual information index.
5. Conclusions
This study presented a novel method for feature selection using neuro-fuzzy systems and its application in driver drowsiness detection. This method was based on the idea of combining filter and wrapper feature selection methods to improve the performance in comparison with the results when each of the filter and wrapper methods has been employed individually. This combination was performed in the structure of the designed ANFIS. Four different filter indexes were calculated for each feature and used as inputs to ANFIS to produce importance degree of each feature. In order to train ANFIS parameters, PSO as an evolutionary optimization method was exploited. Finally, most important features based on ANFIS output were selected to be inputted to the binary SVM classifier in order to classify the driving state into two classes of alert and drowsy. Steering wheel angle and velocity signals of performed experimental tests in driving simulator were used as vehicle-based measurements to detect the drowsiness and 36 features in time and frequency domains were extracted. Final results showed that the proposed method can produce higher accuracy by using less features than other feature selection methods.
The advantages and innovations of the proposed drowsiness detection system include (1) adaptive selection drowsiness-related features based on the dynamic behavior of steering wheel, (2) applying ANFIS to improve fuzzy feature selection by fuzzy parameter adjustment and (3) exploiting the advantages of four different filter feature selection methods to improve the reliability of the classification results. In order to improve the suggested method following tasks are proposed which are the goals of the future studies: (1) using of more vehicle-based data such as lateral velocity and lane deviation from the center line, (2) exploiting of electroencephalogram (EEG) signals to extract a more reliable ground truth for drowsiness levels, (3) applying new machine learning algorithms such as deep neural networks to personalize the designed system based on individual driving behavior of each driver, and (4) prediction of the critical level of drowsiness to aware the driver before driving malfunctions.
Author Contributions
Conceptualization, A.E., S.A. and S.S.; methodology, S.A. and S.S.; software, S.A.; validation, A.N. and A.E.; formal analysis, S.S.; investigation, A.E.; resources, A.N.; data curation, A.N.; writing—original draft preparation, S.A.; writing—review and editing, S.S. and A.E.; visualization, A.N.; supervision, A.E.; project administration, A.E.; funding acquisition, A.E.
Funding
This research received no external funding.
Conflicts of Interest
The authors declare no conflict of interest.
Appendix A
The steps of PSO algorithm are the following:
- Initialization. For each of the particles:
- (a)
- Initialize the position,
- (b)
- Initialize the particles best position to its initial position,
- (c)
- Calculate the performance of each particle and if initialize the global best as g = xj(0)
- Optimization loop:
- (a)
- Update the particle velocity according to (A1)
- (b)
- Update the particle position according to (A2)
- (c)
- Evaluate the performance of the particle:
- (d)
- If , update personal best:
- (e)
- If , update global best:
- At the end of the iterative process, the best solution is the final .
References
- Australian Transport Council: National Road Safety Strategy 2011–2020. Available online: https://roadsafety.gov.au/nrss/files/NRSS_2011_2020.pdf (accessed on 13 January 2019).
- Awais, M.; Badruddin, N.; Drieberg, M. A hybrid approach to detect driver drowsiness utilizing physiological signals to improve system performance and wearability. Sensors 2017, 17, 1991. [Google Scholar] [CrossRef] [PubMed]
- Li, G.; Chung, W.Y. A context-aware EEG headset system for early detection of driver drowsiness. Sensors 2015, 15, 20873–20893. [Google Scholar] [CrossRef] [PubMed]
- Manu, B.N. Facial features monitoring for real time drowsiness detection. In Proceedings of the International Conference of Innovations in Information Technology (IIT), Al-Ain, UAE, 28–30 November 2016. [Google Scholar] [CrossRef]
- Selvakumar, K.; Jerome, J.; Rajamani, K.; Shankar, N. Real-time vision based driver drowsiness detection using partial least squares analysis. J. Signal Process. Syst. 2016, 85, 263–274. [Google Scholar] [CrossRef]
- Naurois, C.J.D.; Bourdin, C.; Stratulat, A.; Diaz, E.; Vercher, J. Detection and prediction of driver drowsiness using artificial neural network models. Accid. Anal. Prev. 2017. [Google Scholar] [CrossRef]
- Daza, I.G.; Bergasa, L.M.; Bronte, S.; Yebes, J.J.; Almazan, J.; Arroyo, R. Fusion of optimized indicators from advanced driver assistance systems (ADAS) for driver drowsiness detection. Sensors 2014, 14, 1106–1113. [Google Scholar] [CrossRef] [PubMed]
- Meng, C.; Shi-wu, L.; Wen-cai, S.; Meng-zhu, G.; Meng-yuan, H. Drowsiness monitoring based on steering wheel status. Transp. Res. Part D Transp. Environ. 2018. [Google Scholar] [CrossRef]
- Li, Z.; Li, S.E.; Li, R.; Cheng, B.; Shi, J. Online detection of driver fatigue using steering wheel angles for real driving conditions. Sensors 2017, 17, 495. [Google Scholar] [CrossRef] [PubMed]
- Haupt, D.; Honzik, P.; Raso, P.; Hyncica, O. Steering wheel motion analysis for detection of the driver’s drowsiness. In Proceedings of the International Conference on Mathematical models and Methods in Modern Science, Puerto De La Cruz, Spain, 10–12 December 2011. [Google Scholar]
- Panthong, R.; Srivihok, A. Wrapper feature subset selection for dimension reduction based on ensemble learning algorithm. Procedia Comput. Sci. 2015, 15, 162–169. [Google Scholar] [CrossRef]
- Chandrashekar, G.; Sahin, F. A survey on feature selection method. Comput. Electr. Eng. 2014, 40, 16–28. [Google Scholar] [CrossRef]
- Wang, L.; Wang, Y.; Chang, Q. Feature selection methods for big data bioinformatics: A survey from the search perspective. Methods 2016, 111, 21–31. [Google Scholar] [CrossRef] [PubMed]
- Li, B.; Lai, Y.; Rosin, P.L. Example-based image colorization via automatic feature selection and fusion. Neurocomputing 2017, 266, 687–698. [Google Scholar] [CrossRef]
- Labani, M.; Moradi, P.; Ahmadizar, F.; Jalili, M. A novel multivariate filter method for feature selection in text classification problems. Eng. Appl. Artif. Intell. 2018, 70, 25–37. [Google Scholar] [CrossRef]
- Wei, Z.; Wang, Y.; He, S.; Bao, J. A novel intelligent method for bearing fault diagnosis based on affinity propagation clustering and adaptive feature selection. Knowl. Based Syst. 2017, 116, 1–12. [Google Scholar] [CrossRef]
- Pacheco, F.; De Oliveira, J.V.; Sanchez, R.; Cerrada, M.; Caberra, D.; Li, C.; Zurita, G.; Artes, M. A statistical comparison of neuro-classifiers and feature selection methods for gearbox fault diagnosis under realistic conditions. Neurocomputing 2016, 194, 192–206. [Google Scholar] [CrossRef]
- Kumar, V.; Minz, S. Feature selection: A literature review. Smart Comput. Rev. 2014, 4, 211–229. [Google Scholar] [CrossRef]
- Sánchez-Maroño, N.; Alonso-Betanzos, A.; Tombilla-Sanromán, M. Filter Methods for Feature Selection—A Comparative Study. In Intelligent Data Engineering and Automated Learning; Yin, H., Tino, P., Corchado, E., Byrne, W., Yao, X., Eds.; Lecture Notes in Computer Science; Springer: Berlin/Heidelberg, Germany, 2007; Volume 4881, pp. 178–187. [Google Scholar] [CrossRef]
- Maldonado, S.; Lopez, J. Dealing with high-dimensional class-imbalanced datasets: Embedded feature selection for SVM classification. Appl. Soft Comput. 2018, 67, 94–105. [Google Scholar] [CrossRef]
- Mansoori, E.G.; Shafiee, K.S. On fuzzy feature selection in designing fuzzy classifiers for high-dimensional data. Evol. Syst. 2016, 7, 255–265. [Google Scholar] [CrossRef]
- Vieira, S.M.; Sousa, J.M.C.; Kaymak, U. Fuzzy criteria for feature selection. Fuzzy Sets Syst. 2012, 189, 1–18. [Google Scholar] [CrossRef]
- Cateni, S.; Colla, V.; Vannucci, M. A fuzzy system for combining filter features selection methods. Int. J. Fuzzy Syst. 2017, 19, 1168–1180. [Google Scholar] [CrossRef]
- Yin, S.; Jiang, Y.; Tian, Y.; Kaynak, O. A data-driven fuzzy information granulation approach for freight volume forecasting. IEEE Trans. Ind. Electron. 2017, 64, 1447–1456. [Google Scholar] [CrossRef]
- Ma, R.; Yu, N.; Hu, J. Application of particle swarm optimization algorithm in the heating system planning problem. Sci. World J. 2013, 2013, 1–11. [Google Scholar] [CrossRef] [PubMed]
- Mortazavi, A.; Eskandarian, A.; Sayed, R.A. Effect of drowsiness on driving performance variables of commercial vehicle drivers. Int. J. Automot. Technol. 2009, 10, 391–404. [Google Scholar] [CrossRef]
- Samiee, S.; Azadi, S.; Kazemi, R.; Nahvi, A.; Eichberger, A. Data fusion to develop a driver drowsiness detection system with robustness to signal loss. Sensors 2014, 14, 17832–17847. [Google Scholar] [CrossRef] [PubMed]
- Friedrichs, F.; Yang, B. Drowsiness monitoring by steering and lane data based features under real driving conditions. In Proceedings of the European Signal Processing Conference, Aalborg, Denmark, 23–27 August 2010. [Google Scholar]
- Sheikhpour, R.; Sarram, M.A.; Gharaghani, S.; Chahooki, M.A.Z. A Survey on semi-supervised feature selection methods. Pattern Recognit. 2017, 64, 141–158. [Google Scholar] [CrossRef]
- Chormunge, S.; Jena, S. Correlation based feature selection with clustering for high dimensional data. J. Electr. Syst. Inf. Technol. 2018, 5, 542–549. [Google Scholar] [CrossRef]
- Hoffman, J.I.E. t-Test Variants: Crossover Tests, Equivalence Tests. In Biostatistics for Medical and Biomedical Practitioners; Academic Press: Cambridge, MA, USA, 2015; pp. 363–371. [Google Scholar] [CrossRef]
- Vergara, J.R.; Estevez, P.A. A review of feature selection methods based on mutual information. Neural Comput. Appl. 2014, 24, 175–186. [Google Scholar] [CrossRef]
- Ghomsheh, V.S.; Shoorehdeli, M.A.; Teshnehlab, M. Training ANFIS structure with modified PSO algorithm. In Proceedings of the Mediterranean Conference of Control and Automation, Athens, Greece, 27–29 June 2007. [Google Scholar] [CrossRef]
- Marini, F.; Walczak, B. Particle swarm optimization (PSO), a tutorial. Chemom. Intell. Lab. Syst. 2015, 149, 153–165. [Google Scholar] [CrossRef]
- Burbridge, R.; Buxton, B. An Introduction to Support Vector Machines for Data Mining. In Proceedings of the YOR12 Conference, Nottingham, UK, 27–29 March 2001. [Google Scholar]
- Naseri, H.; Nahvi, A.; Karan, F.S.N. A real-time lane changing and line changing algorithm for driving simulators based on virtual driver behavior. J. Simul. 2017, 11, 357–368. [Google Scholar] [CrossRef]
- Wang, M.S.; Jeong, N.T.; Kim, K.S.; Choi, S.B.; Yang, S.M.; You, S.H.; Lee, J.H.; Suh, M.W. Drowsy behavior detection based on driving information. Int. J. Automot. Technol. 2016, 17, 165–173. [Google Scholar] [CrossRef]
- Wang, X.; Xu, C. Driver drowsiness detection based on non-intrusive metrics considering individual specifics. Accid. Anal. Prev. 2016, 95, 350–357. [Google Scholar] [CrossRef] [PubMed]
- Krajewski, J.; Sommer, D.; Trutschel, U.; Edwards, D.; Golz, M. Steering wheel behavior based estimation of fatigue. In Proceedings of the Fifth International Driving Symposium on Human Factors in Driver Assessment, Training and Vehicle Design, Big Sky, MT, USA, 22–25 June 2009. [Google Scholar] [CrossRef]
- McDonald, A.D.; Schwarz, C.; Lee, J.D.; Brown, T.L. Real-time detection of drowsiness related lane departures using steering wheel angle. Proc. Hum. Factors Ergon. Soc. Annu. Meet. 2012, 56, 2201–2205. [Google Scholar] [CrossRef]
© 2019 by the authors. Licensee MDPI, Basel, Switzerland. This article is an open access article distributed under the terms and conditions of the Creative Commons Attribution (CC BY) license (http://creativecommons.org/licenses/by/4.0/).