Development of a VNIR/SWIR Multispectral Imaging System for Vegetation Monitoring with Unmanned Aerial Vehicles

 ,
,
Abstract
1. Introduction
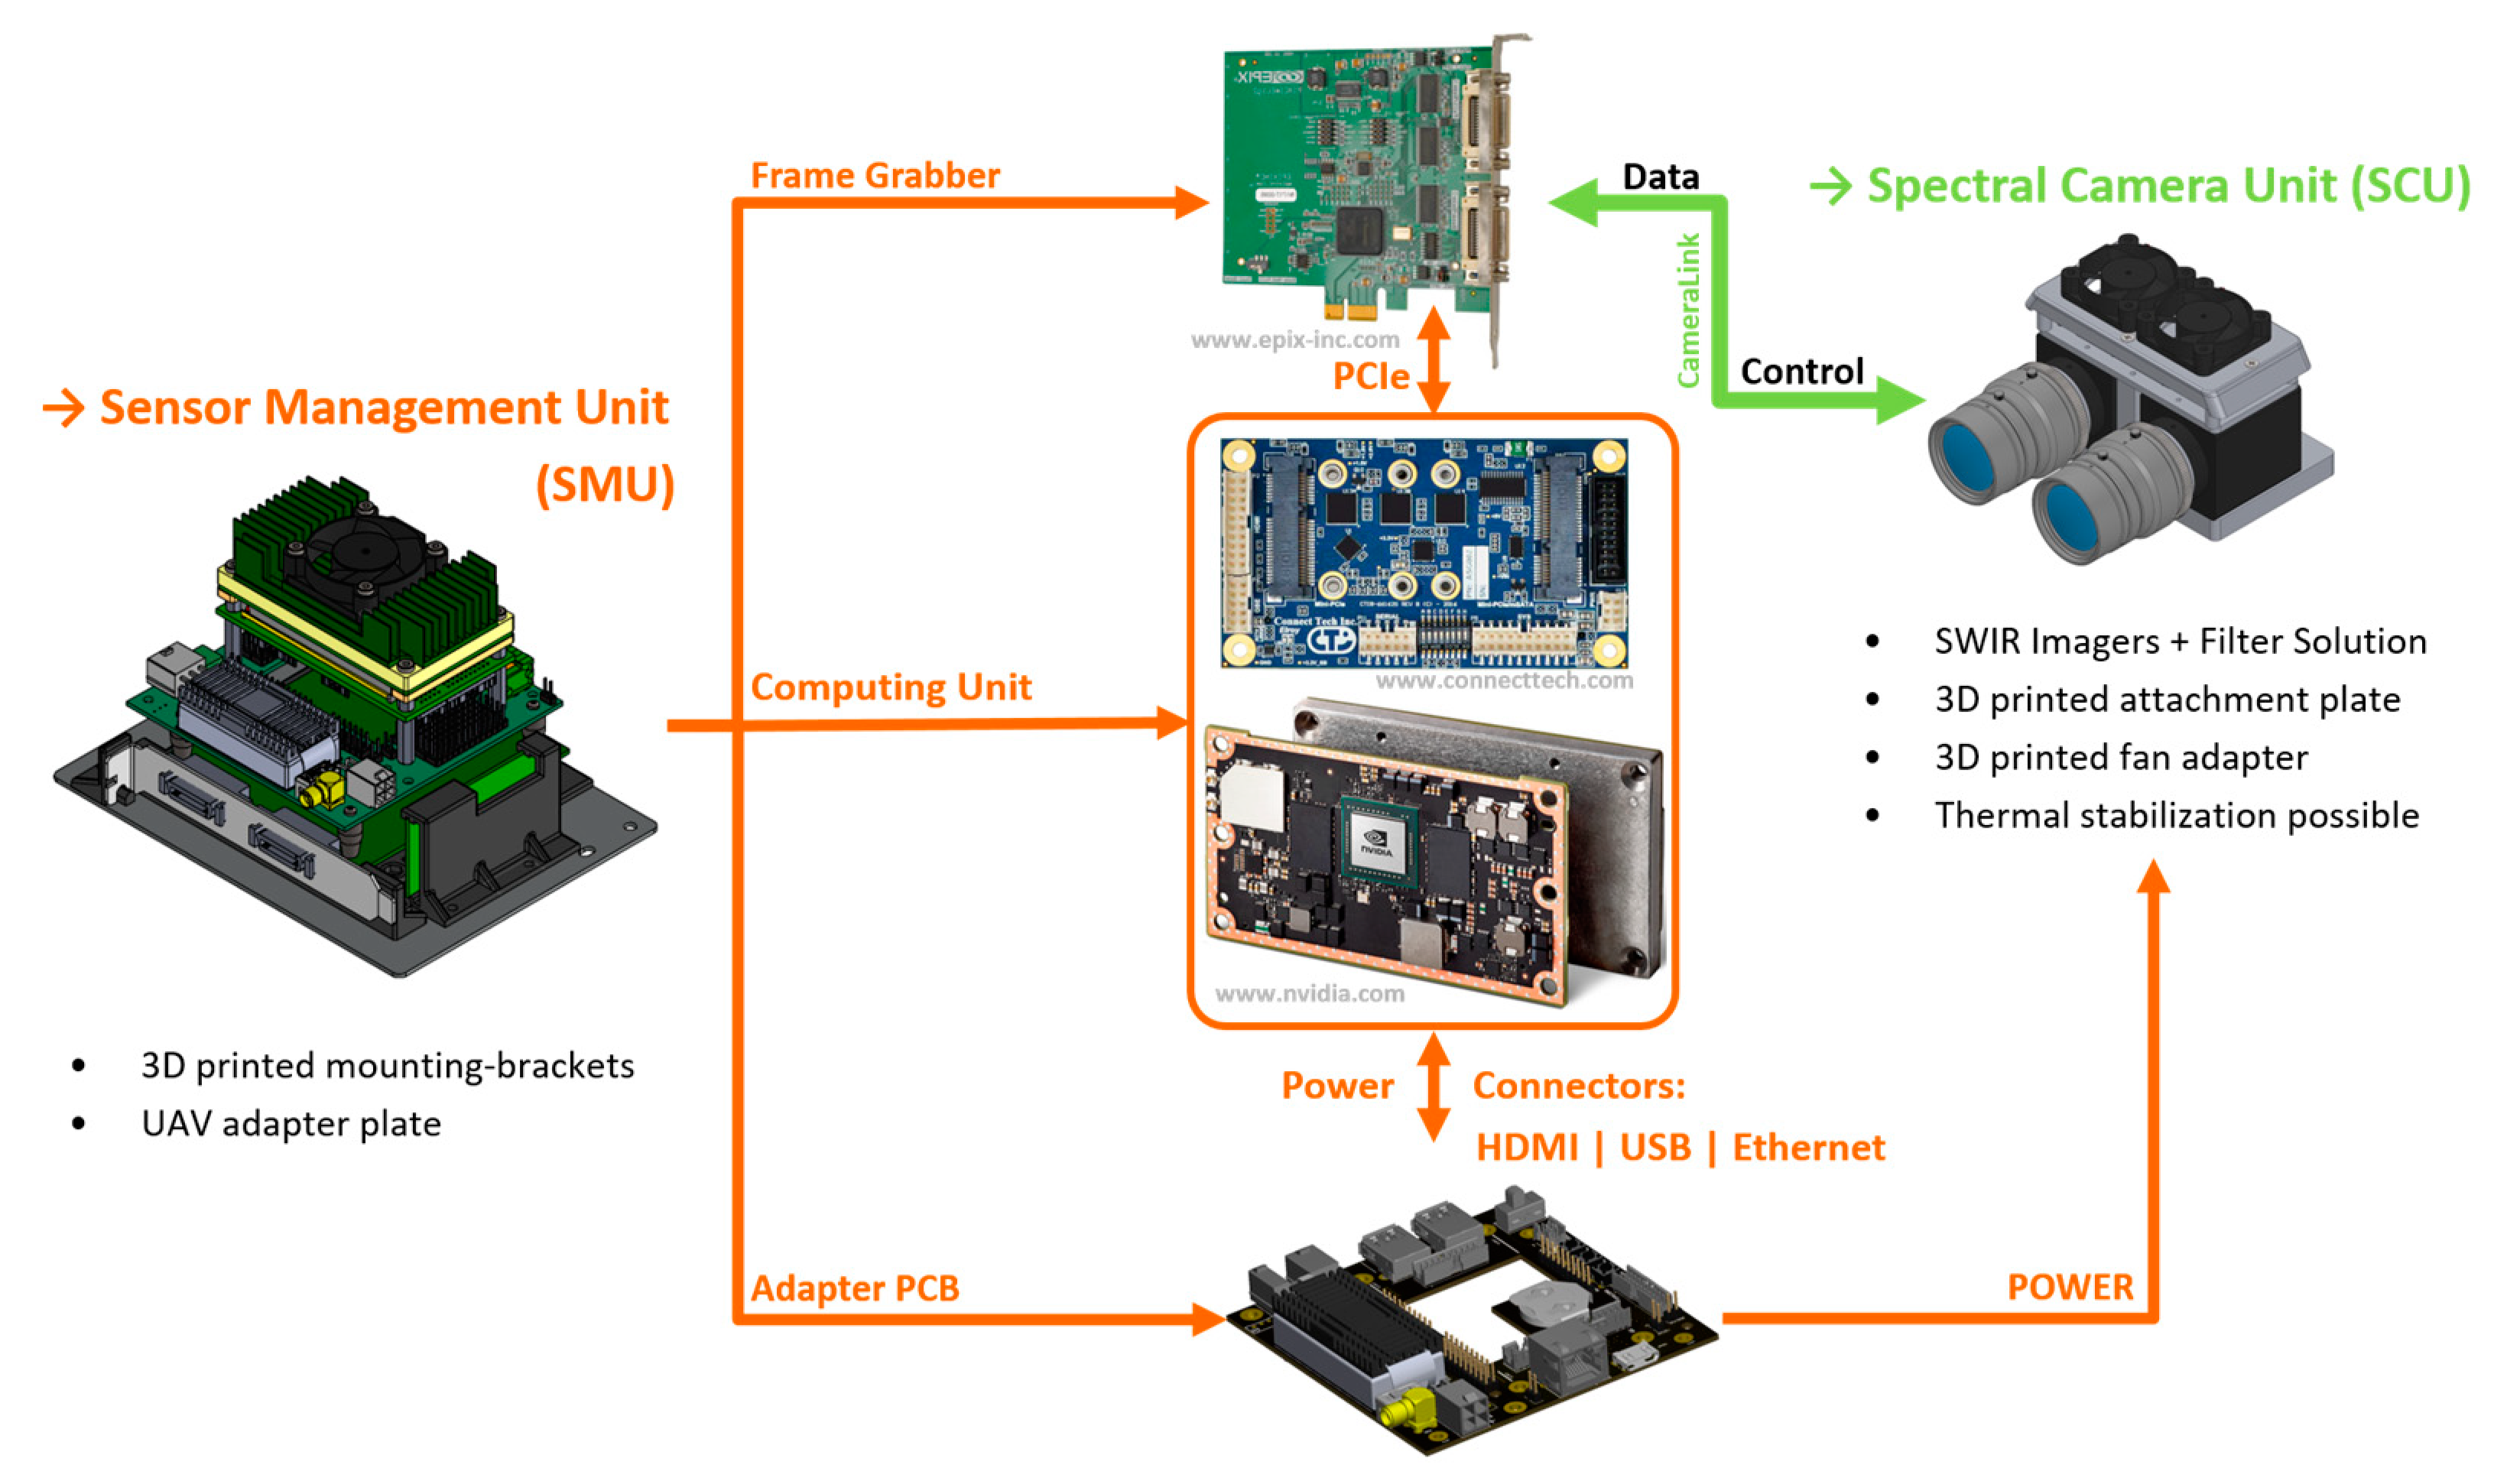
2. Hardware Design
2.1. Spectral Camera Unit (SCU)
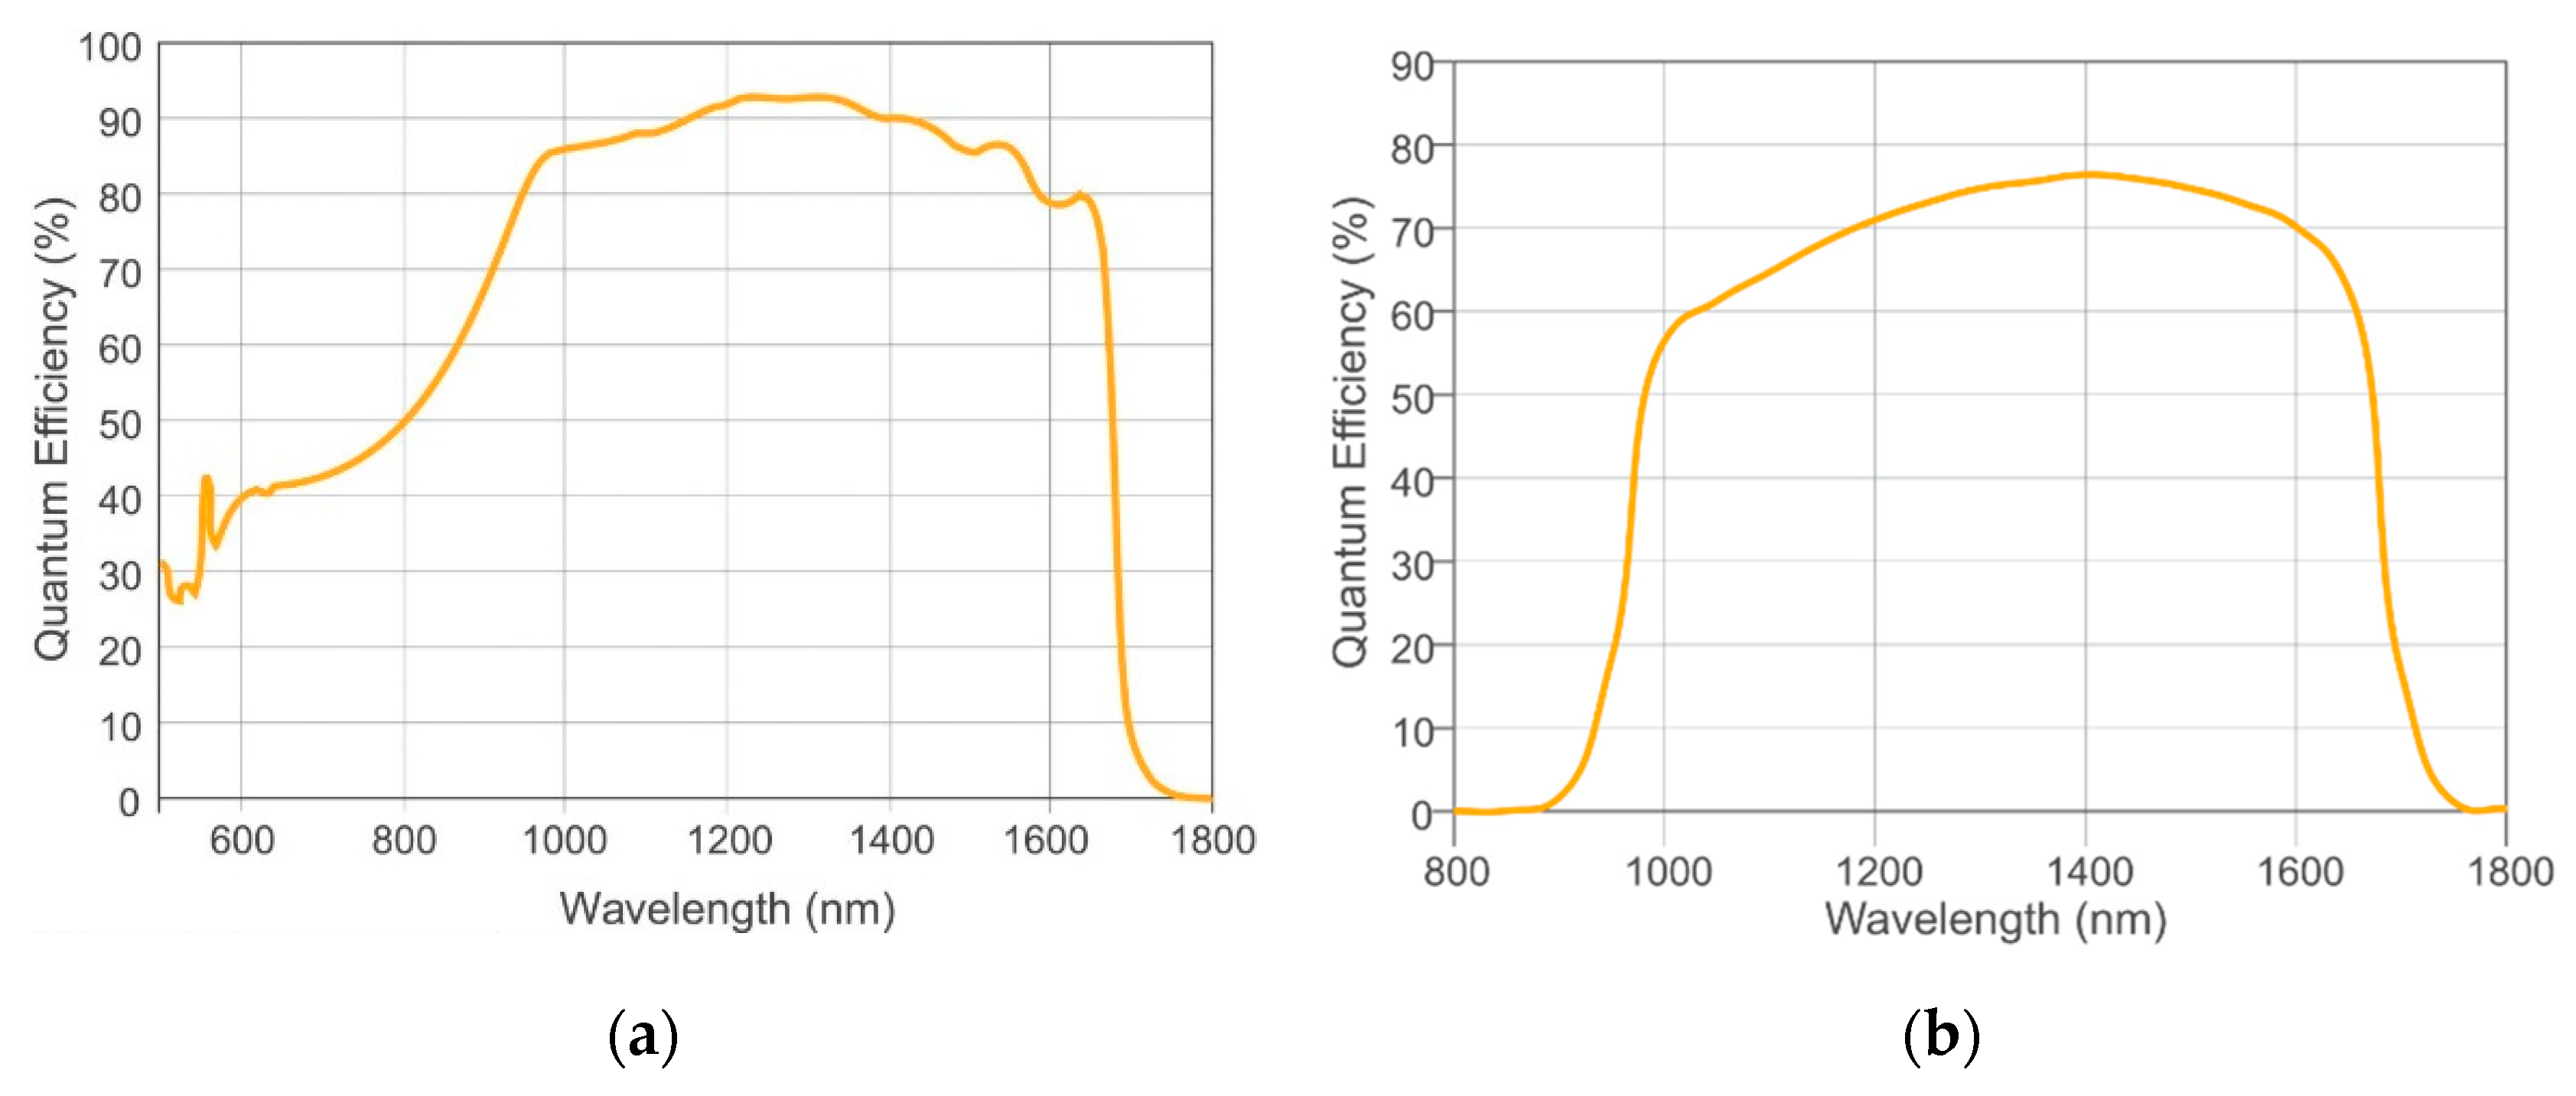
2.1.1. VNIR/SWIR Image Sensor
2.1.2. VNIR/SWIR Camera Lens
2.1.3. Filter Assembly Layout for Spectral Band Selection
2.1.4. Mechanical and Thermal Design
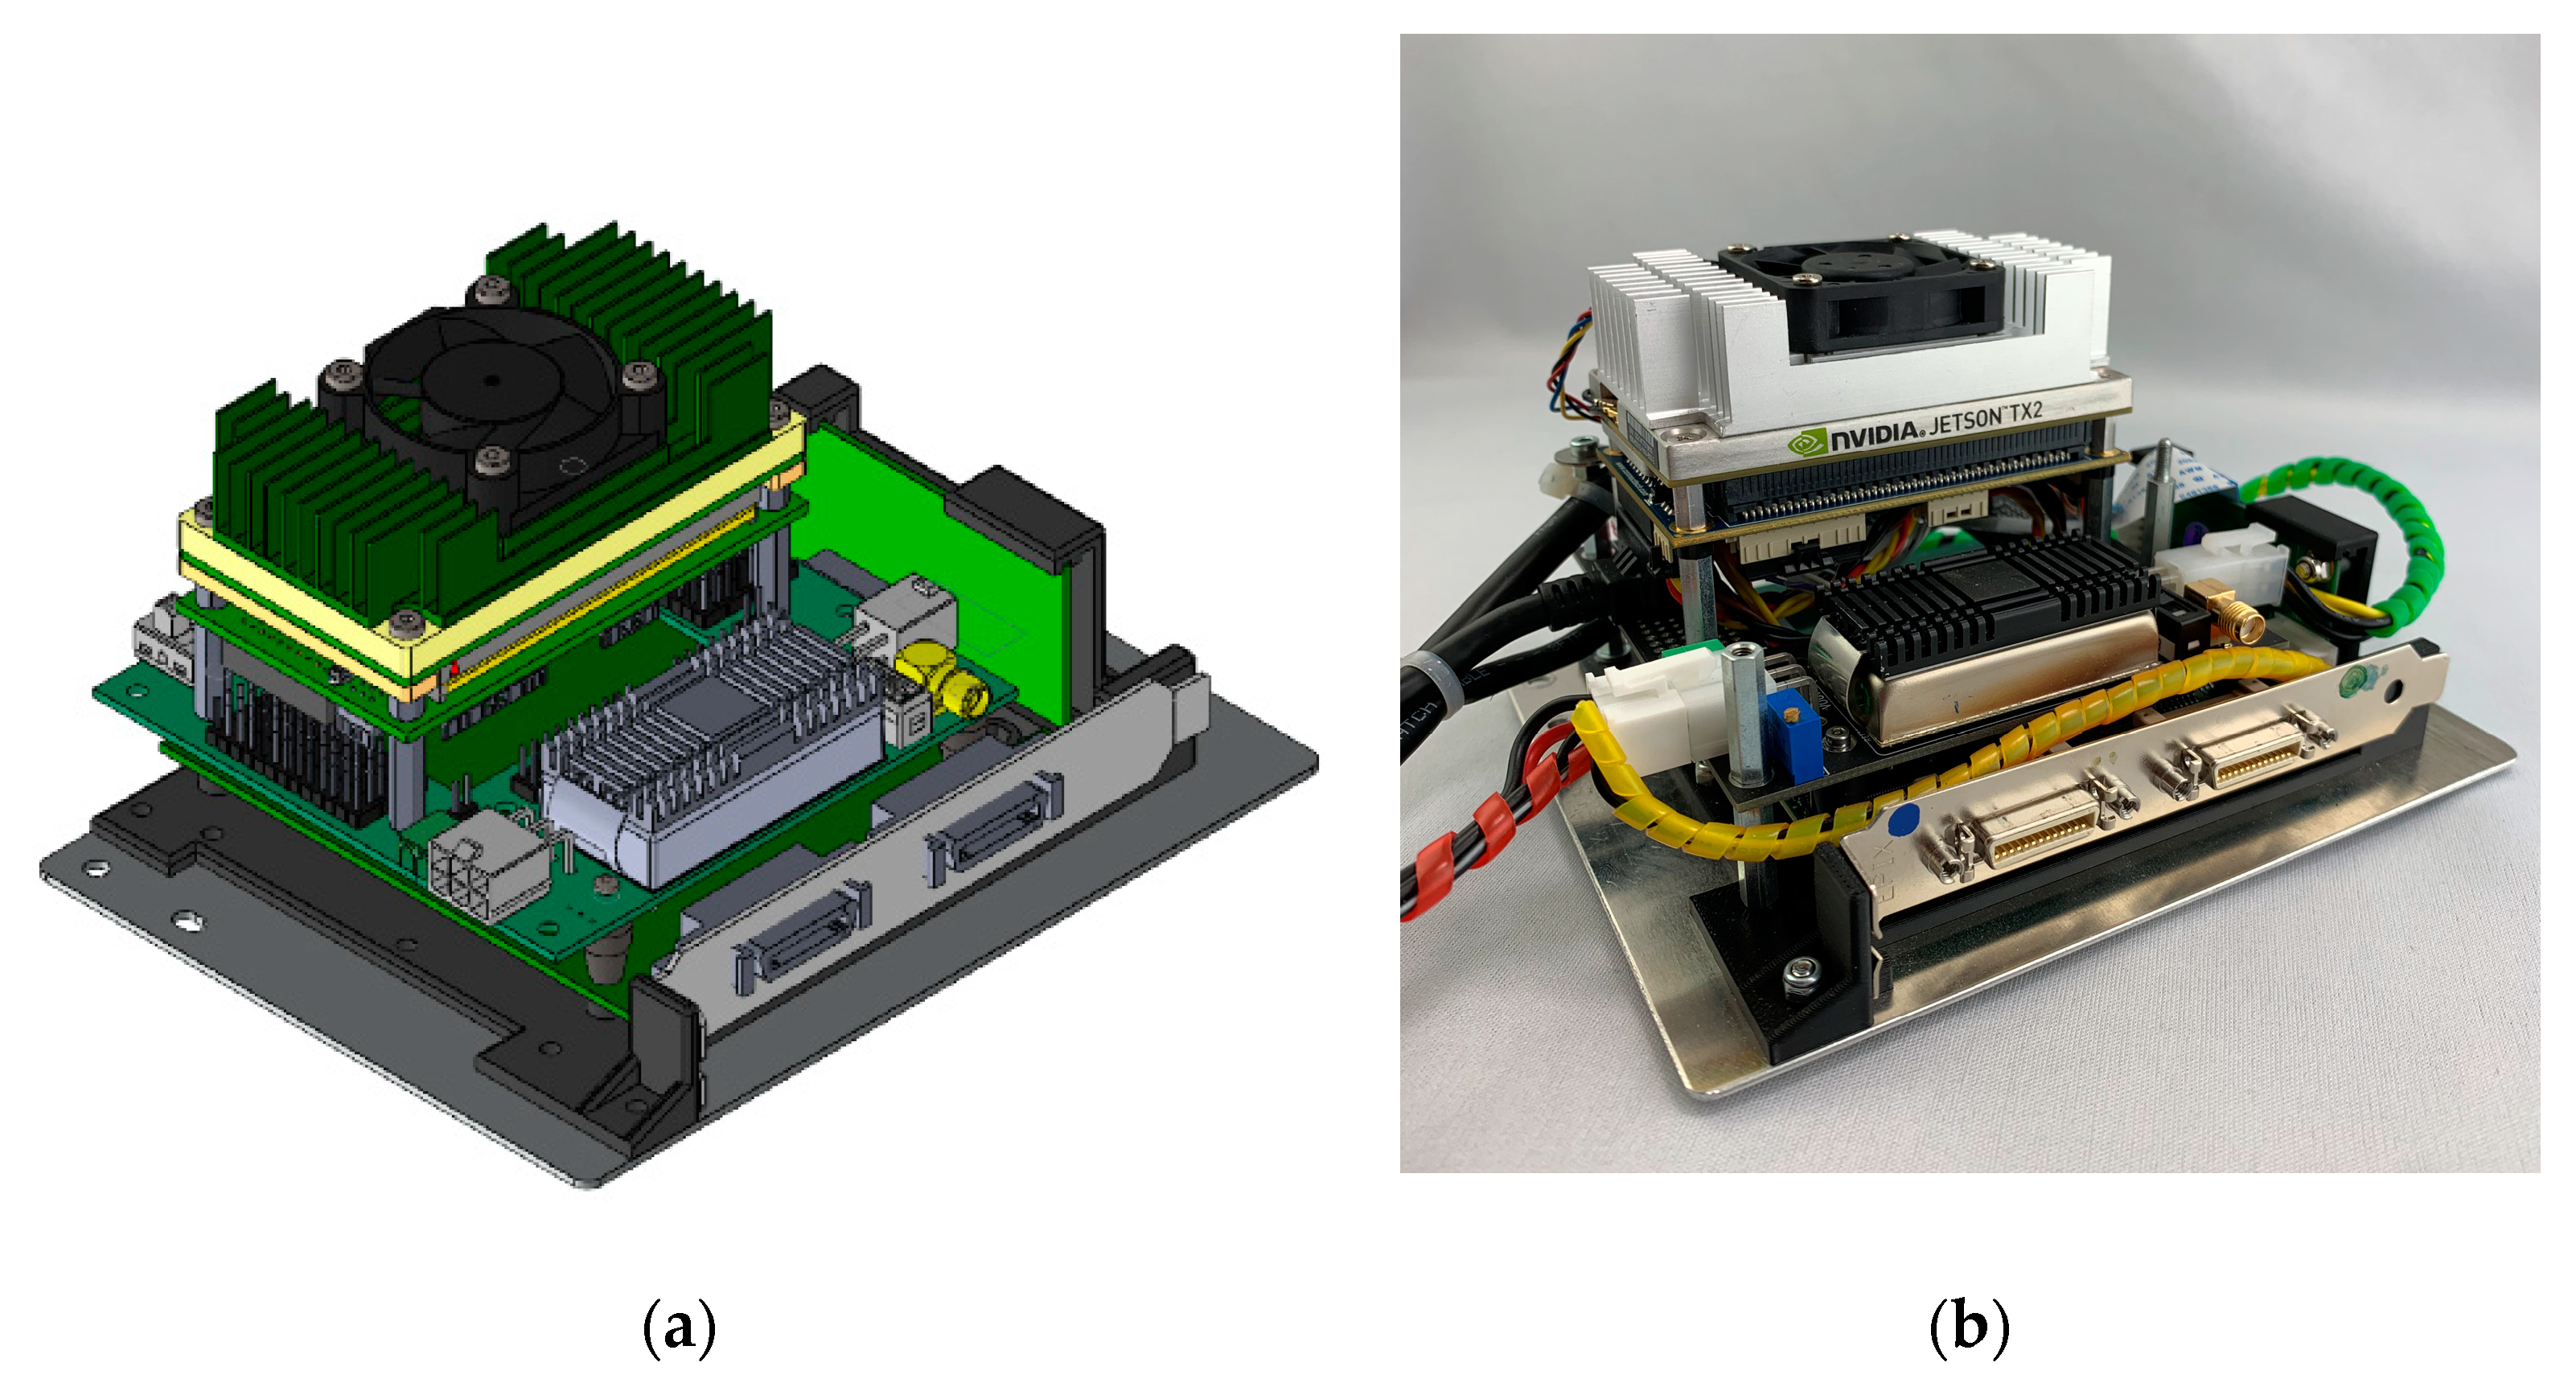
2.2. Sensor Management Unit (SMU)
- Frame grabber
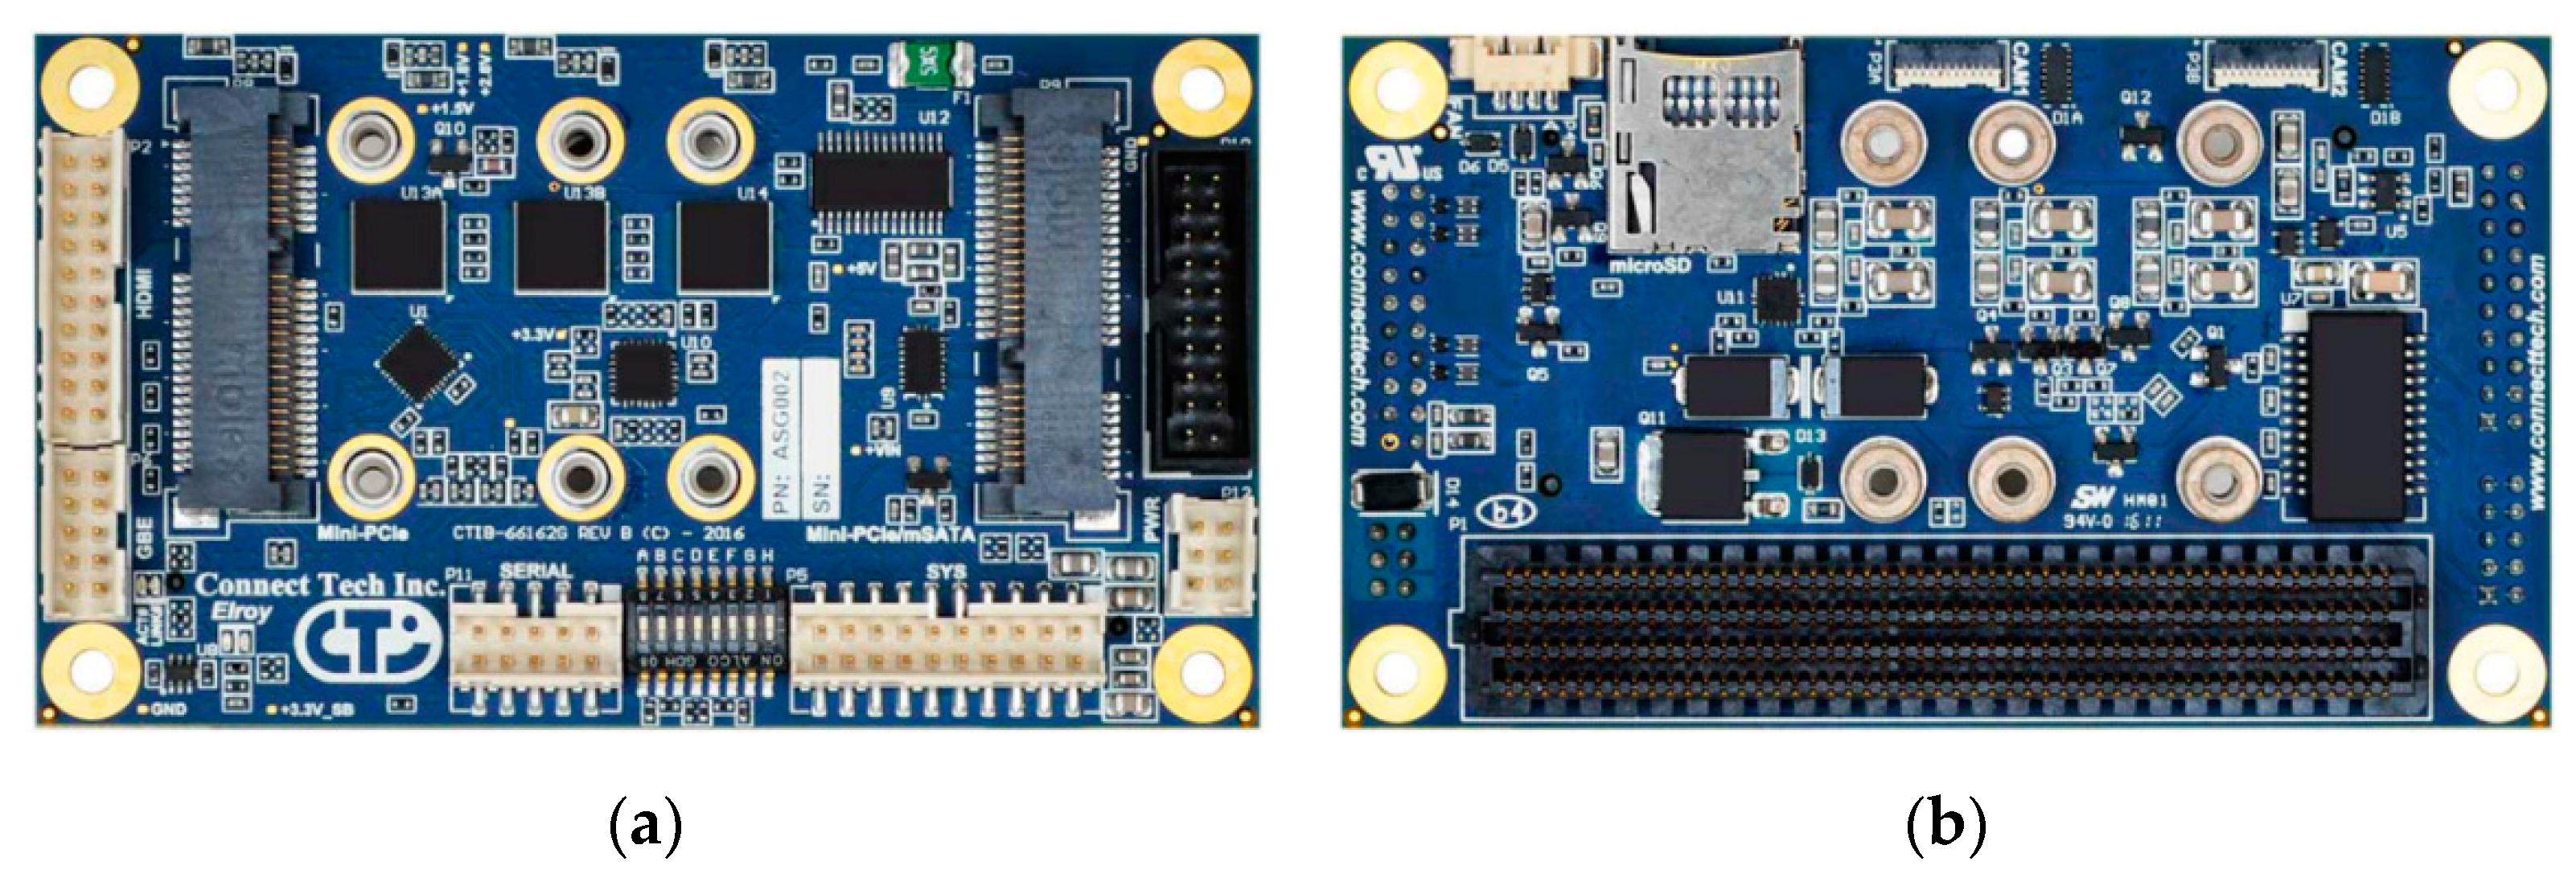
- Adapter PCB
- Computing unit
- connecting the SCU to the computing unit via a frame grabber,
- providing regulated power with safety features to the overall system,
- controlling the two cameras of the SCU,
- storing the image data from the SCU,
- providing connections for additional hardware and future extensions like GNSS or IMU,
- providing enough computing power for future direct onboard image processing and machine learning tasks,
- providing further interfaces for additional cameras.
2.2.1. Frame Grabber
2.2.2. Computing Unit (CU)
2.2.3. Adapter Circuit
- (1)
- Regulated power supply
- (2)
- Mechanical Connection layer
- (3)
- Electronic connection and expansion layer
3. Methods for Preliminary Camera System Characterization and Tests
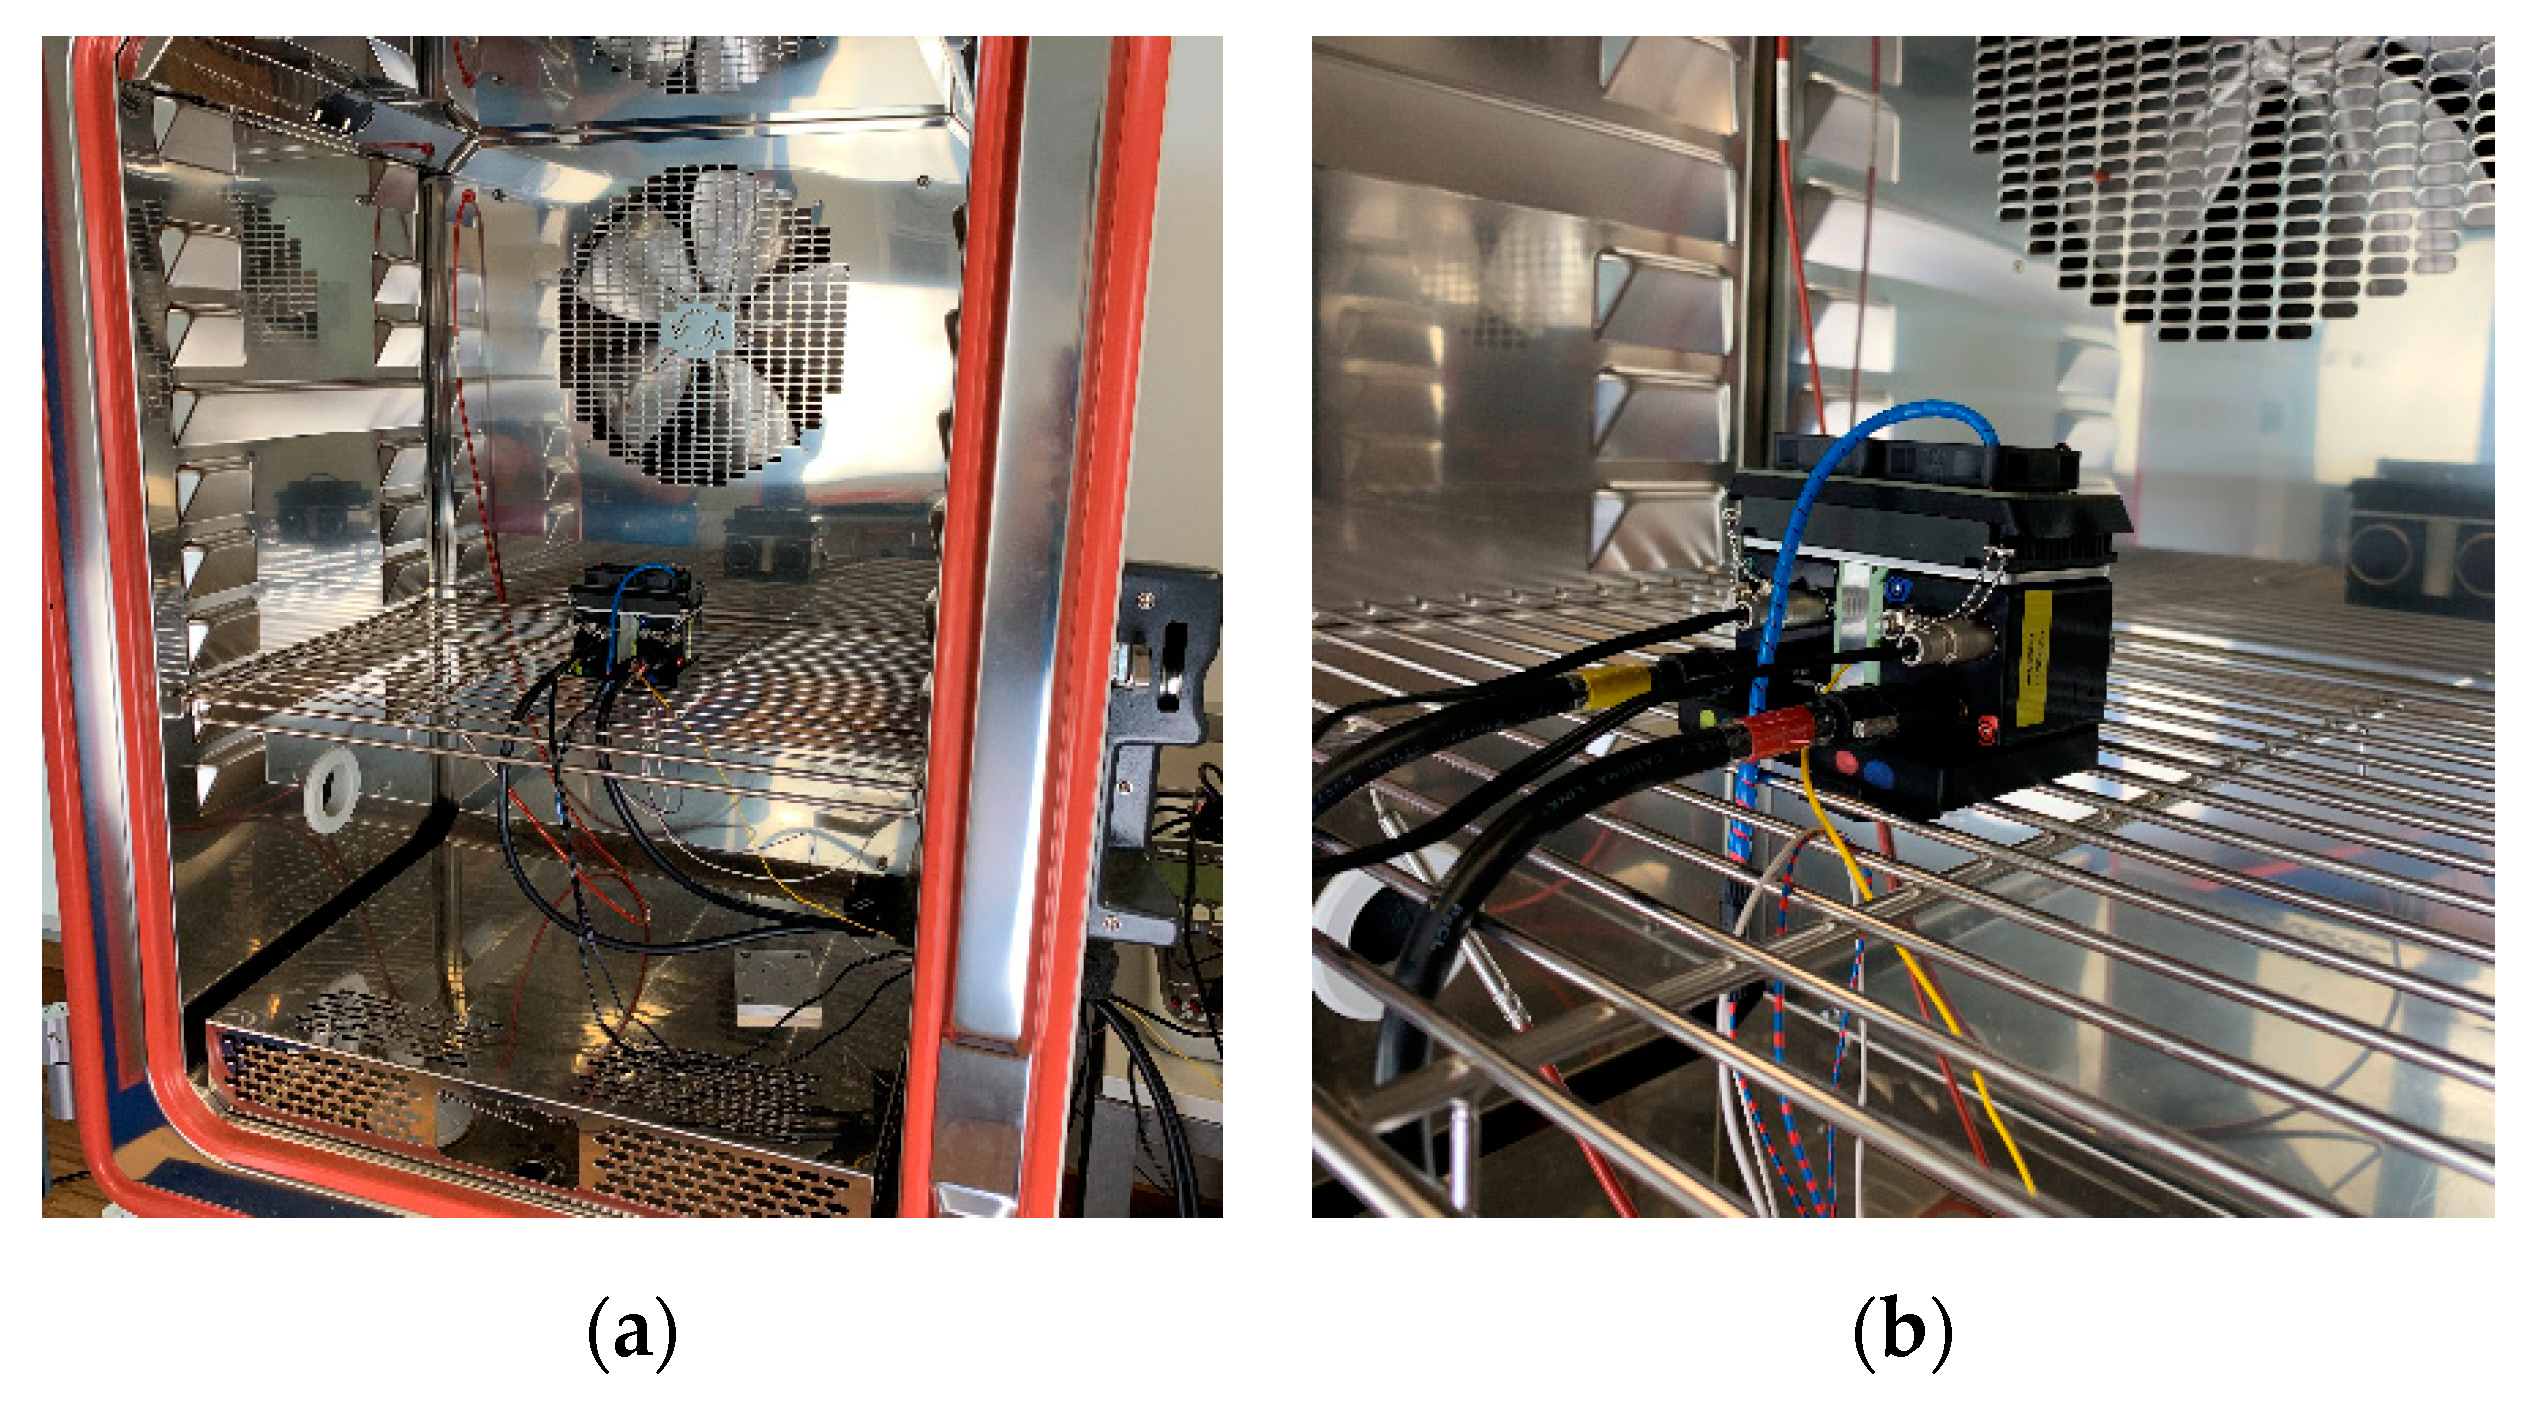
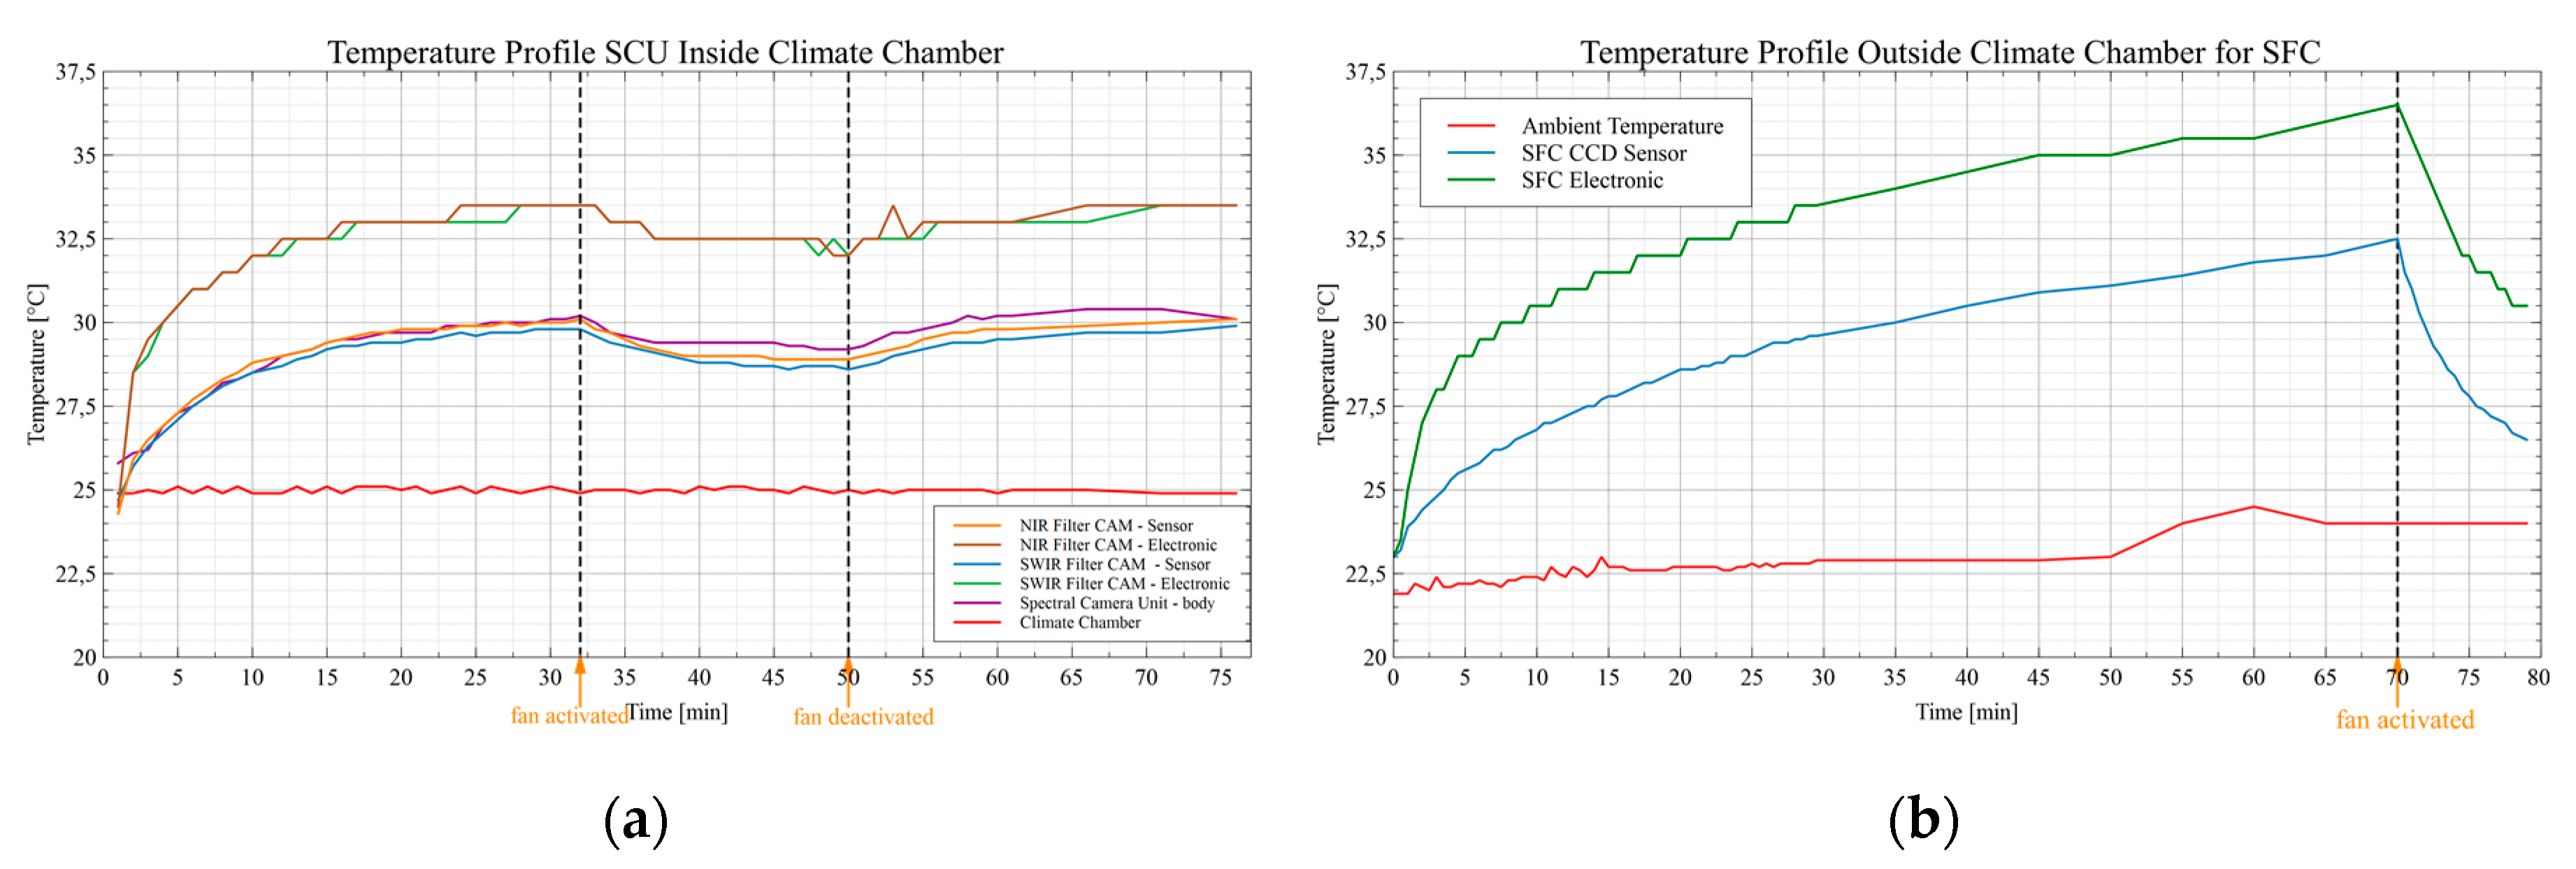
3.1. Thermal Management and Dark Noise
3.2. Evaluating the Transmission of the Optical System
3.3. Flat-Field Measurements
3.4. UAV Integration of the VNIR/SWIR Imaging System
4. Results of the Prototype Camera System Characterization and Tests
4.1. Thermal Management and Dark Signal
4.1.1. Thermal Management
4.1.2. Dark Signal
4.2. Properties of the Optical System and Filter Layout
4.3. Flat-Field Measurements
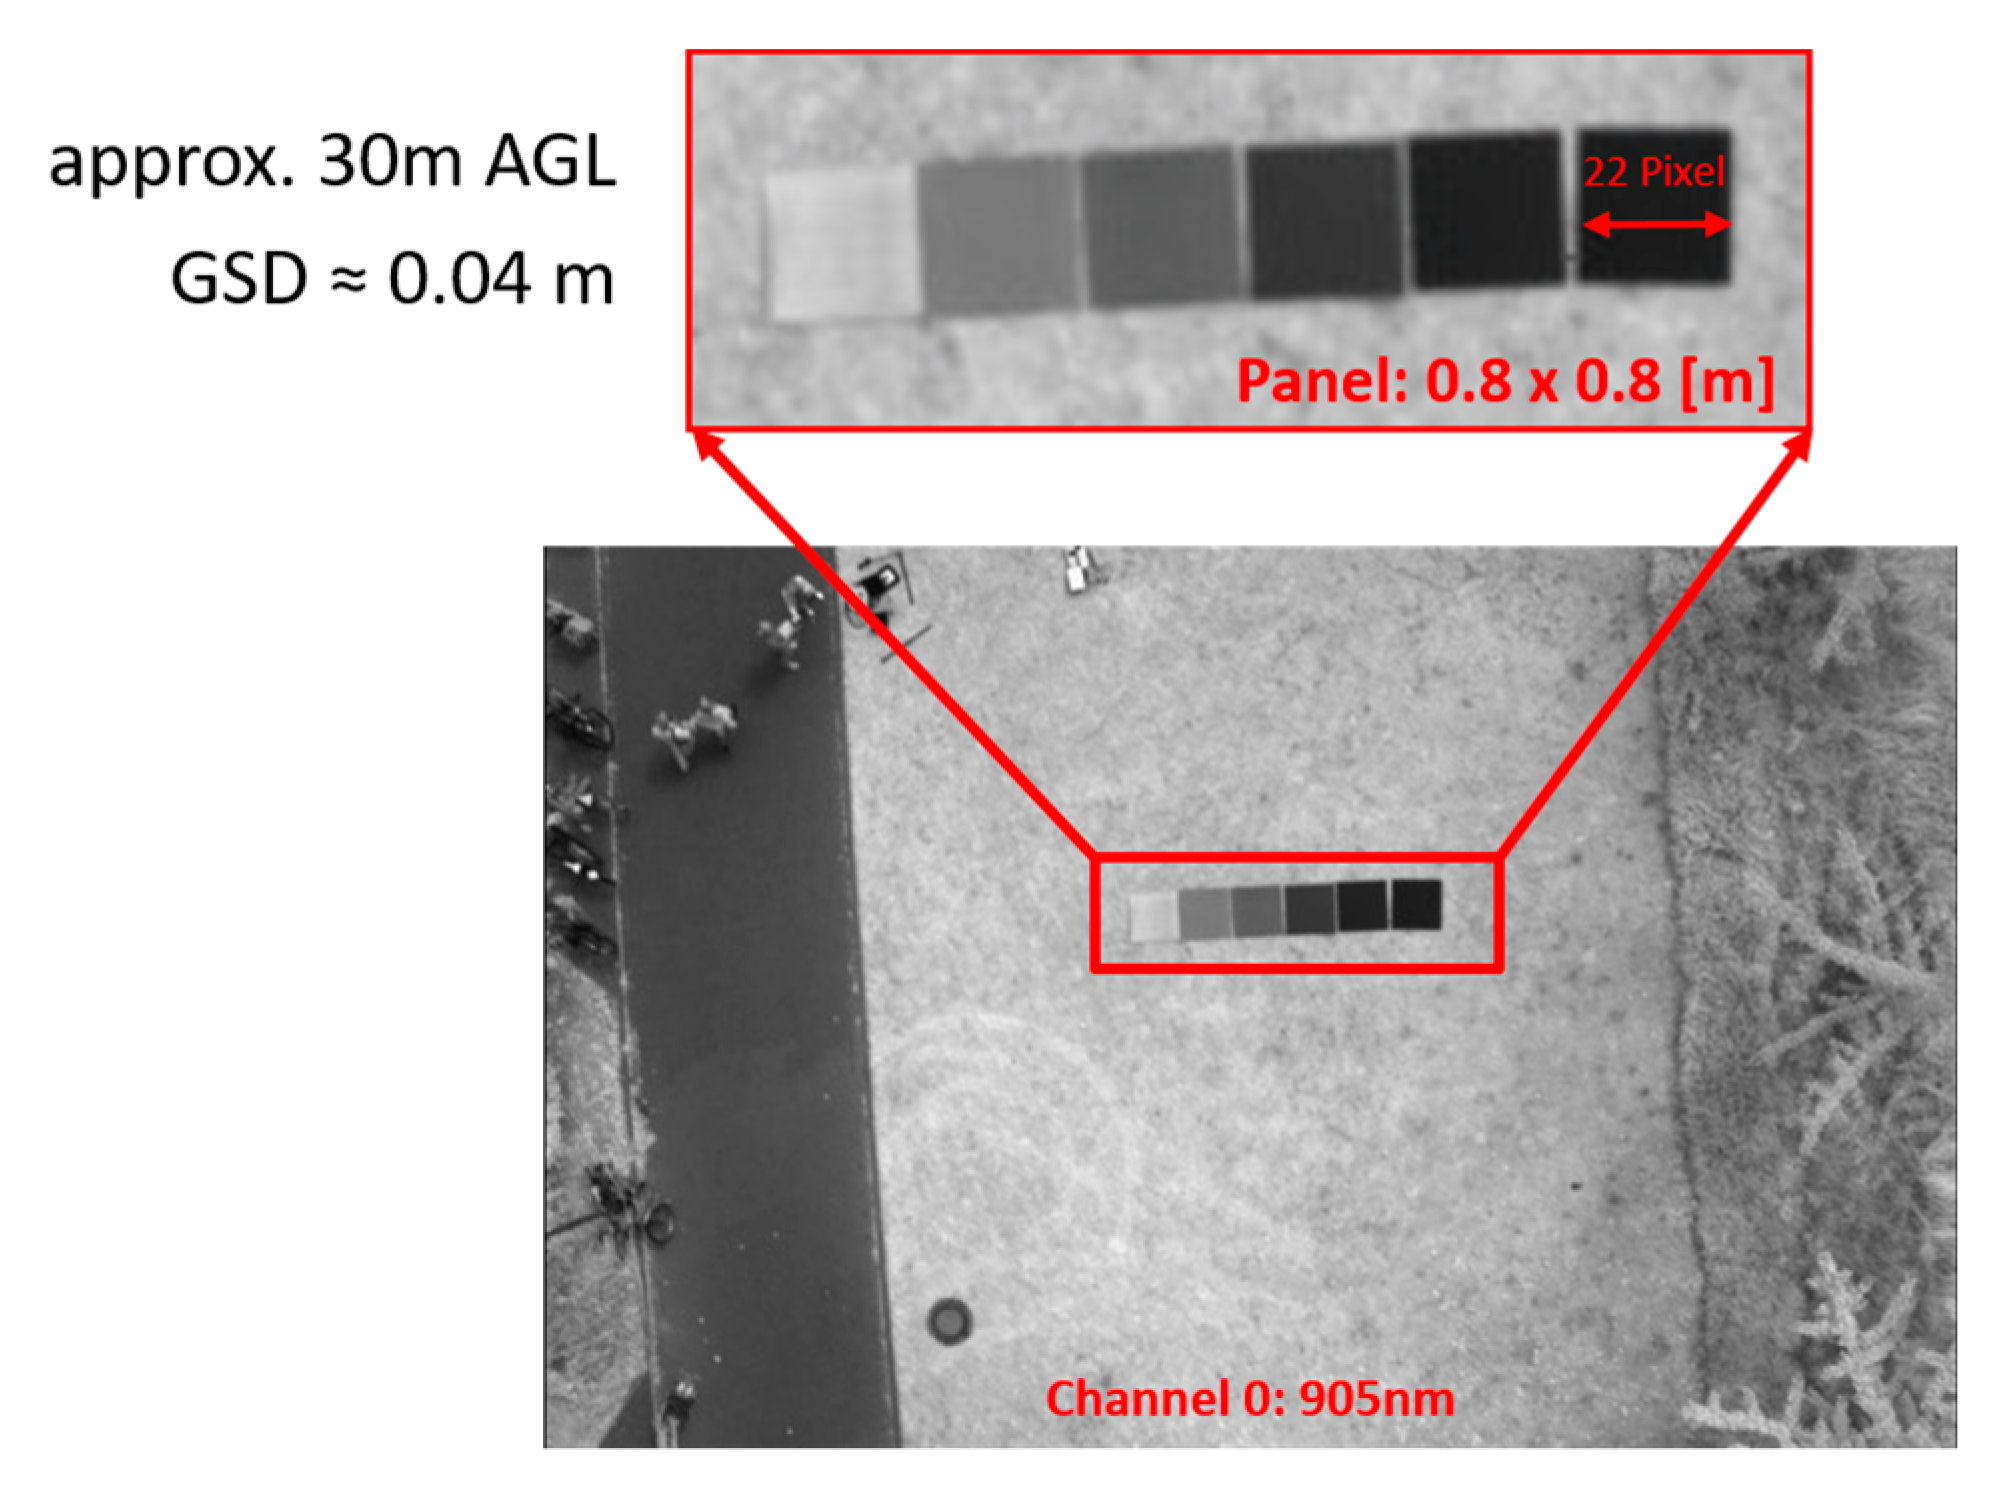
4.4. UAV Integration, System Test, and Test Flight of the Newly Developed VNIR/SWIR Imaging System
5. Discussion and Conclusions
Author Contributions
Funding
Acknowledgments
Conflicts of Interest
References
- Aasen, H.; Burkart, A.; Bolten, A.; Bareth, G. Generating 3D hyperspectral information with lightweight UAV snapshot cameras for vegetation monitoring: From camera calibration to quality assurance. ISPRS J. Photogramm. Remote Sens. 2015, 108, 245–259. [Google Scholar] [CrossRef]
- Berni, J.A.J.; Zarco-Tejada, P.J.; Suarez, L.; Fereres, E. Thermal and Narrowband Multispectral Remote Sensing for Vegetation Monitoring from an Unmanned Aerial Vehicle. IEEE Trans. Geosci. Remote Sens. 2009, 47, 722–738. [Google Scholar] [CrossRef]
- Colomina, I.; Molina, P. Unmanned aerial systems for photogrammetry and remote sensing: A review. ISPRS J. Photogramm. Remote Sens. 2014, 92, 79–97. [Google Scholar] [CrossRef]
- Jaakkola, A.; Hyyppä, J.; Kukko, A.; Yu, X.; Kaartinen, H.; Lehtomäki, M.; Lin, Y. A low-cost multi-sensoral mobile mapping system and its feasibility for tree measurements. ISPRS J. Photogramm. Remote Sens. 2010, 65, 514–522. [Google Scholar] [CrossRef]
- Lucieer, A.; Malenovský, Z.; Veness, T.; Wallace, L. HyperUAS-Imaging spectroscopy from a multirotor unmanned aircraft system. J. Field Robot. 2014, 31, 571–590. [Google Scholar] [CrossRef]
- Calderón, R.; Navas-Cortés, J.A.; Lucena, C.; Zarco-Tejada, P.J. High-resolution airborne hyperspectral and thermal imagery for early detection of Verticillium wilt of olive using fluorescence, temperature and narrow-band spectral indices. Remote Sens. Environ. 2013, 139, 231–245. [Google Scholar] [CrossRef]
- Honkavaara, E.; Eskelinen, M.A.; Pölönen, I.; Saari, H.; Ojanen, H.; Mannila, R.; Holmlund, C.; Hakala, T.; Litkey, P.; Rosnell, T.; et al. Remote Sensing of 3-D Geometry and Surface Moisture of a Peat Production Area Using Hyperspectral Frame Cameras in Visible to Short-Wave Infrared Spectral Ranges Onboard a Small Unmanned Airborne Vehicle (UAV). IEEE Trans. Geosci. Remote Sens. 2016, 54, 5440–5454. [Google Scholar] [CrossRef]
- Näsi, R.; Honkavaara, E.; Lyytikäinen-Saarenmaa, P.; Blomqvist, M.; Litkey, P.; Hakala, T.; Viljanen, N.; Kantola, T.; Tanhuanpää, T.; Holopainen, M. Using UAV-Based Photogrammetry and Hyperspectral Imaging for Mapping Bark Beetle Damage at Tree-Level. Remote Sens. 2015, 7, 15467–15493. [Google Scholar] [CrossRef]
- Mahlein, A.-K.; Kuska, M.T.; Thomas, S.; Wahabzada, M.; Behmann, J.; Rascher, U.; Kersting, K. Quantitative and qualitative phenotyping of disease resistance of crops by hyperspectral sensors: Seamless interlocking of phytopathology, sensors, and machine learning is needed! Curr. Opin. Plant Biol. 2019, 50, 156–162. [Google Scholar] [CrossRef]
- Mahlein, A.-K.; Rumpf, T.; Welke, P.; Dehne, H.-W.; Plümer, L.; Steiner, U.; Oerke, E.-C. Development of spectral indices for detecting and identifying plant diseases. Remote Sens. Environ. 2013, 128, 21–30. [Google Scholar] [CrossRef]
- Zarco-Tejada, P.J.; González-Dugo, V.; Berni, J.A.J. Fluorescence, temperature and narrow-band indices acquired from a UAV platform for water stress detection using a micro-hyperspectral imager and a thermal camera. Remote Sens. Environ. 2012, 117, 322–337. [Google Scholar] [CrossRef]
- Zheng, H.; Li, W.; Jiang, J.; Liu, Y.; Cheng, T.; Tian, Y.; Zhu, Y.; Cao, W.; Zhang, Y.; Yao, X. A Comparative Assessment of Different Modeling Algorithms for Estimating Leaf Nitrogen Content in Winter Wheat Using Multispectral Images from an Unmanned Aerial Vehicle. Remote Sens. 2018, 10, 2026. [Google Scholar] [CrossRef]
- Aasen, H.; Honkavaara, E.; Lucieer, A.; Zarco-Tejada, P.J. Quantitative remote sensing at ultra-high resolution with UAV spectroscopy: A review of sensor technology, measurement procedures, and data correction workflows. Remote Sens. 2018, 10, 1091. [Google Scholar] [CrossRef]
- Tuominen, S.; Näsi, R.; Honkavaara, E.; Balazs, A.; Hakala, T.; Viljanen, N.; Pölönen, I.; Saari, H.; Ojanen, H. Assessment of Classifiers and Remote Sensing Features of Hyperspectral Imagery and Stereo-Photogrammetric Point Clouds for Recognition of Tree Species in a Forest Area of High Species Diversity. Remote Sens. 2018, 10, 714. [Google Scholar] [CrossRef]
- Camino, C.; González-Dugo, V.; Hernández, P.; Sillero, J.C.; Zarco-Tejada, P.J. Improved nitrogen retrievals with airborne-derived fluorescence and plant traits quantified from VNIR-SWIR hyperspectral imagery in the context of precision agriculture. Int. J. Appl. Earth Obs. Geoinf. 2018, 70, 105–117. [Google Scholar] [CrossRef]
- Stark, B.; McGee, M.; Chen, Y. Short wave infrared (SWIR) imaging systems using small Unmanned Aerial Systems (sUAS). In Proceedings of the 2015 International Conference on Unmanned Aircraft Systems (ICUAS), Denver, CO, USA, 9–12 June 2015; pp. 495–501. [Google Scholar]
- Aasen, H.; Bolten, A. Multi-temporal high-resolution imaging spectroscopy with hyperspectral 2D imagers—From theory to application. Remote Sens. Environ. 2018, 205, 374–389. [Google Scholar] [CrossRef]
- Bendig, J.; Yu, K.; Aasen, H.; Bolten, A.; Bennertz, S.; Broscheit, J.; Gnyp, M.L.; Bareth, G. Combining UAV-based plant height from crop surface models, visible, and near infrared vegetation indices for biomass monitoring in barley. Int. J. Appl. Earth Obs. Geoinf. 2015, 39, 79–87. [Google Scholar] [CrossRef]
- Näsi, R.; Viljanen, N.; Kaivosoja, J.; Alhonoja, K.; Hakala, T.; Markelin, L.; Honkavaara, E. Estimating Biomass and Nitrogen Amount of Barley and Grass Using UAV and Aircraft Based Spectral and Photogrammetric 3D Features. Remote Sens. 2018, 10, 1082. [Google Scholar] [CrossRef]
- Tilly, N.; Bareth, G. Estimating Nitrogen from Structural Crop Traits at Field Scale—A Novel Approach Versus Spectral Vegetation Indices. Remote Sens. 2019, 11, 2066. [Google Scholar] [CrossRef]
- Saarinen, N.; Vastaranta, M.; Näsi, R.; Hakala, T.; Honkavaara, E.; Wulder, M.A.; Luoma, V.; Tommaselli, A.M.G.; Imai, N.N.; Ribeiro, E.A.W.; et al. Assessing Biodiversity in Boreal Forests with UAV-Based Photogrammetric Point Clouds and Hyperspectral Imaging. Remote Sens. 2018, 10, 338. [Google Scholar] [CrossRef]
- Waser, L.T.; Ginzler, C.; Kuechler, M.; Baltsavias, E.; Hurni, L. Semi-automatic classification of tree species in different forest ecosystems by spectral and geometric variables derived from Airborne Digital Sensor (ADS40) and RC30 data. Remote Sens. Environ. 2011, 115, 76–85. [Google Scholar] [CrossRef]
- Aasen, H.; Bareth, G. Spectral and 3D Nonspectral Approaches to Crop Trait Estimation Using Ground and UAV Sensing. In Hyperspectral Remote Sensing of Vegetation (Second, Edition, Four-Volume-Set); Thenkabail, P.S., Lyon, G.J., Huete, A.R., Eds.; CRC Press Taylor & Francis Group: Boca Raton, FL, USA; London, UK; New York, NY, USA, 2018; Volume III Title: Biophysical and Biochemical Characterization and Plant Species Studies; pp. 103–131. ISBN 978-0-429-43118-0. [Google Scholar]
- Van der Meer, F.D.; van der Werff, H.M.A.; van Ruitenbeek, F.J.A.; Hecker, C.A.; Bakker, W.H.; Noomen, M.F.; van der Meijde, M.; Carranza, E.J.M.; de Smeth, J.B.; Woldai, T. Multi- and hyperspectral geologic remote sensing: A review. Int. J. Appl. Earth Obs. Geoinf. 2012, 14, 112–128. [Google Scholar] [CrossRef]
- Hunt, G.R. Near-infrared (1.3–2.4) μm spectra of alteration minerals—Potential for use in remote sensing. Geophysics 1979, 44, 1974–1986. [Google Scholar] [CrossRef]
- Kumar, L.; Schmidt, K.; Dury, S.; Skidmore, A. Imaging Spectrometry and Vegetation Science. In Imaging Spectrometry: Basic Principles and Prospective Applications; Meer, F.D.v.d., Jong, S.M.D., Eds.; Remote Sensing and Digital Image Processing; Springer Netherlands: Dordrecht, The Netherlands, 2001; pp. 111–155. ISBN 978-0-306-47578-8. [Google Scholar]
- Thenkabail, P.S.; Smith, R.B.; De Pauw, E. Hyperspectral vegetation indices and their relationships with agricultural crop characteristics. Remote Sens. Environ. 2000, 71, 158–182. [Google Scholar] [CrossRef]
- Koppe, W.; Li, F.; Gnyp, M.L.; Miao, Y.; Jia, L.; Chen, X.; Zhang, F.; Bareth, G. Evaluating Multispectral and Hyperspectral Satellite Remote Sensing Data for Estimating Winter Wheat Growth Parameters at Regional Scale in the North China Plain. Photogramm.-Fernerkund.-Geoinf. 2010, 2010, 167–178. [Google Scholar] [CrossRef]
- Koppe, W.; Gnyp, M.L.; Hennig, S.D.; Li, F.; Miao, Y.; Chen, X.; Jia, L.; Bareth, G. Multi-Temporal Hyperspectral and Radar Remote Sensing for Estimating Winter Wheat Biomass in the North China Plain. Photogramm.-Fernerkund.-Geoinf. 2012, 2012, 281–298. [Google Scholar] [CrossRef]
- Gnyp, M.L.; Bareth, G.; Li, F.; Lenz-Wiedemann, V.I.S.; Koppe, W.; Miao, Y.; Hennig, S.D.; Jia, L.; Laudien, R.; Chen, X.; et al. Development and implementation of a multiscale biomass model using hyperspectral vegetation indices for winter wheat in the North China Plain. Int. J. Appl. Earth Obs. Geoinf. 2014, 33, 232–242. [Google Scholar] [CrossRef]
- Tilly, N.; Aasen, H.; Bareth, G. Fusion of plant height and vegetation indices for the estimation of barley biomass. Remote Sens. 2015, 7, 11449–11480. [Google Scholar] [CrossRef]
- Gao, B. NDWI—A normalized difference water index for remote sensing of vegetation liquid water from space. Remote Sens. Environ. 1996, 58, 257–266. [Google Scholar] [CrossRef]
- Haboudane, D.; Miller, J.R.; Pattey, E.; Zarco-Tejada, P.J.; Strachan, I.B. Hyperspectral vegetation indices and novel algorithms for predicting green LAI of crop canopies: Modeling and validation in the context of precision agriculture. Remote Sens. Environ. 2004, 90, 337–352. [Google Scholar] [CrossRef]
- Serrano, L.; Penuelas, J.; Ustin, S.L. Remote sensing of nitrogen and lignin in Mediterranean vegetation from AVIRIS data: Decomposing biochemical from structural signals. Remote Sens. Environ. 2002, 81, 355–364. [Google Scholar] [CrossRef]
- Roberts, D.; Roth, K.; Wetherley, E.; Meerdink, S.; Perroy, R. Hyperspectral Vegetation Indices. In Hyperspectral Remote Sensing of Vegetation (Second, Edition, Four-Volume-Set); Thenkabail, P.S., Lyon, G.J., Huete, A., Eds.; CRC Press Taylor & Francis Group: Boca Raton, FL, USA; London, UK; New York, NY, USA, 2018; Vol. II Title: Hyperspectral Indices and Image Classifications for Agriculture and Vegetation; pp. 3–26. ISBN 978-1-315-15933-1. [Google Scholar]
- MicaSense. Available online: https://www.micasense.com (accessed on 14 November 2019).
- MAIA-the Multispectral Camera. Available online: https://www.spectralcam.com/ (accessed on 17 September 2019).
- Parrot SEQUOIA+. Available online: https://www.parrot.com/business-solutions-us/parrot-professional/parrot-sequoia (accessed on 14 November 2019).
- Tetracam Multispectral and Smart NDVI Mapping Cameras. Available online: http://www.tetracam.com/ (accessed on 14 November 2019).
- Hansen, M.P.; Malchow, D.S. Overview of SWIR detectors, cameras, and applications. In Proceedings of the SPIE Defense and Scurity Symposium: Thermosense XXX, Orlando, FL, USA, 17 March 2008; Volume 6939. [Google Scholar]
- Raptor Photonics Limited. InGaAs SWIR VIS-SWIR SWaP 640 TEC-less Camera for Low Power Lost Cost OEMs. Available online: https://www.raptorphotonics.com/products/owl-640-tecless-vis-swir-ingaas/ (accessed on 18 September 2019).
- Martin, G. High Performance SWIR Imaging Cameras. In Raptor Photonics White Papers; Raptor Photonics Ltd.: Milbrook, Larne, UK, 2015. [Google Scholar]
- Gardner, M.C.; Rogers, P.J.; Wilde, M.F.; Cook, T.; Shipton, A. Challenges and solutions for high performance SWIR lens design. In Proceedings of the Electro-Optical and Infrared Systems: Technology and Applications XIII; International Society for Optics and Photonics: Edinburgh, UK, 2016; Volume 9987, p. 99870C. [Google Scholar]
- Cohen, N.; Aphek, O. Extended wavelength SWIR detectors with reduced dark current. Infrared Technol. Appl. XLI 2015, 9451, 945106. [Google Scholar]
- Sullivan, P.W.; Croll, B.; Simcoe, R.A. Precision of a Low-Cost InGaAs Detector for Near Infrared Photometry. In Publications of the Astronomical Society of the Pacific; The Astronomical Society of the Pacific: San Francisco, CA, USA, 2013; Volume 125. [Google Scholar]
- Hansen, M. What you should ask before investing in a shortwave infrared (SWIR) lens. In Photonics Online: Photonics Solut. Update; Photonics Online: Cranberry Township, PA, USA, 2009; pp. 14–17. [Google Scholar]
- Roth, L.; Hund, A.; Aasen, H. PhenoFly Planning Tool: Flight planning for high-resolution optical remote sensing with unmanned areal systems. Plant Methods 2018, 14, 116. [Google Scholar] [CrossRef] [PubMed]
- O’Connor, J.; Smith, M.J.; James, M.R. Cameras and settings for aerial surveys in the geosciences: Optimising image data. Prog. Phys. Geogr. 2017, 41. [Google Scholar] [CrossRef]
- Wang, W.; Li, C.; Tollner, E.W.; Rains, G.C.; Gitaitis, R.D. A liquid crystal tunable filter based shortwave infrared spectral imaging system: Calibration and characterization. Comput. Electron. Agric. 2012, 80, 135–144. [Google Scholar] [CrossRef]
- NIR Bandpass & Laser Line Filters: 700–1650 nm Center Wavelength. Available online: https://www.thorlabs.com/newgrouppage9.cfm?objectgroup_id=1000 (accessed on 12 March 2019).
- Strausbaugh, R.; Jackson, R.; Butler, N. Night Vision for Small Telescopes. Publ. Astron. Soc. Pac. 2018, 130, 095001. [Google Scholar] [CrossRef]
- Hochedez, J.-F.; Timmermans, C.; Hauchecorne, A.; Meftah, M. Dark signal correction for a lukecold frame-transfer CCD: New method and application to the solar imager of the PICARD space mission. AA 2014, 561, A17. [Google Scholar] [CrossRef]
- Theuwissen, A. How to measure the average dark signal? In Harvest Imaging Blog; Harvest Imaging bvba: Bree, Belgium, 2011. [Google Scholar]
- Theuwissen, A. How to measure the Fixed-Pattern Noise in Dark or DSNU (1). In Harvest Imaging Blog; Harvest Imaging bvba: Bree, Belgium, 2011. [Google Scholar]
- Theuwissen, A. How to Measure the Fixed-Pattern Noise in Dark (2). In Harvest Imaging Blog; Harvest Imaging bvba: Bree, Belgium, 2011. [Google Scholar]
- Theuwissen, A. How to Measure the Fixed-Pattern Noise in Dark (3). In Harvest Imaging Blog; Harvest Imaging bvba: Bree, Belgium, 2011. [Google Scholar]
- EMVA. European Machine Vision Association. Available online: https://www.emva.org/ (accessed on 18 September 2019).
- Mansouri, A.; Marzani, F.S.; Gouton, P. Development of a Protocol for CCD Calibration: Application to a Multispectral Imaging System. Int. J. Robot. Autom. 2005, 20. [Google Scholar] [CrossRef]
- Bareth, G.; Bolten, A.; Gnyp, M.L.; Reusch, S.; Jasper, J. Comparison of Uncalibrated RGBVI with Spectrometer-Based NDVI Derived from UAV Sensing Systems on Field Scale. Int. Arch. Photogramm. Remote Sens. Spat. Inf. Sci. 2016, XLI-B8, 837–843. [Google Scholar] [CrossRef]
- Misgaiski-Hass, M.; Hieronymus, J. Radiometric Calibration of dual Sensor Camera System, a Comparison of classical and low cost Calibration. ISPRS-Int. Arch. Photogramm. Remote Sens. Spat. Inf. Sci. 2014, XL–5, 421–424. [Google Scholar] [CrossRef]
- Ewald, F.; Kölling, T.; Baumgartner, A.; Zinner, T.; Mayer, B. Design and characterization of specMACS, a multipurpose hyperspectral cloud and sky imager. Atmos. Meas. Tech. 2016, 9, 2015–2042. [Google Scholar] [CrossRef]
- Lenhard, K.; Baumgartner, A.; Schwarzmaier, T. Independent Laboratory Characterization of NEO HySpex Imaging Spectrometers VNIR-1600 and SWIR-320m-e. IEEE Trans. Geosci. Remote Sens. 2015, 53, 1828–1841. [Google Scholar] [CrossRef]
- The MathWorks, Inc. MATLAB and Image Processing Toolbox R2015a; The MathWorks, Inc.: Natic, MA, USA, 2015. [Google Scholar]
- Xavier, A.C.; Rudorff, B.F.T.; Moreira, M.A.; Alvarenga, B.S.; de Freitas, J.G.; Salomon, M.V. Hyperspectral field reflectance measurements to estimate wheat grain yield and plant height. Sci. Agric. 2006, 63, 130–138. [Google Scholar] [CrossRef][Green Version]
- Thenkabail, P.S.; Enclona, E.A.; Ashton, M.S.; Van Der Meer, B. Accuracy assessments of hyperspectral waveband performance for vegetation analysis applications. Remote Sens. Environ. 2004, 91, 354–376. [Google Scholar] [CrossRef]
- Mutanga, O.; Skidmore, A.K. Narrow band vegetation indices overcome the saturation problem in biomass estimation. Int. J. Remote Sens. 2004, 25, 3999–4014. [Google Scholar] [CrossRef]
- Gnyp, M.L.; Yu, K.; Aasen, H.; Yao, Y.; Huang, S.; Miao, Y.; Bareth, C.G. Analysis of Crop Reflectance for Estimating Biomass in Rice Canopies at Different Phenological StagesReflexionsanalyse zur Abschätzung der Biomasse von Reis in unterschiedlichen phänologischen Stadien. Photogramm.-Fernerkund.-Geoinf. 2013, 2013, 351–365. [Google Scholar]
- Hu, J.; Peng, J.; Zhou, Y.; Xu, D.; Zhao, R.; Jiang, Q.; Fu, T.; Wang, F.; Shi, Z. Quantitative Estimation of Soil Salinity Using UAV-Borne Hyperspectral and Satellite Multispectral Images. Remote Sens. 2019, 11, 736. [Google Scholar] [CrossRef]
- Viscarra Rossel, R.A.; Walvoort, D.J.J.; McBratney, A.B.; Janik, L.J.; Skjemstad, J.O. Visible, near infrared, mid infrared or combined diffuse reflectance spectroscopy for simultaneous assessment of various soil properties. Geoderma 2006, 131, 59–75. [Google Scholar] [CrossRef]
- Suomalainen, J.; Anders, N.; Iqbal, S.; Roerink, G.; Franke, J.; Wenting, P.; Hünniger, D.; Bartholomeus, H.; Becker, R.; Kooistra, L.; et al. A Lightweight Hyperspectral Mapping System and Photogrammetric Processing Chain for Unmanned Aerial Vehicles. Remote Sens. 2014, 6, 11013–11030. [Google Scholar] [CrossRef]
- Zarco-Tejada, P.J.; Diaz-Varela, R.; Angileri, V.; Loudjani, P. Tree height quantification using very high resolution imagery acquired from an unmanned aerial vehicle (UAV) and automatic 3D photo-reconstruction methods. Eur. J. Agron. 2014, 55, 89–99. [Google Scholar] [CrossRef]
- Hakala, T.; Markelin, L.; Honkavaara, E.; Scott, B.; Theocharous, T.; Nevalainen, O.; Näsi, R.; Suomalainen, J.; Viljanen, N.; Greenwell, C.; et al. Direct Reflectance Measurements from Drones: Sensor Absolute Radiometric Calibration and System Tests for Forest Reflectance Characterization. Sensors 2018, 18, 1417. [Google Scholar] [CrossRef] [PubMed]
- Näsi, R.; Honkavaara, E.; Tuominen, S.; Saari, H.; Pölönen, I.; Hakala, T.; Viljanen, N.; Soukkamäki, J.; Näkki, I.; Ojanen, H.; et al. Uas based tree species identification using the novel fpi based hyperspectral cameras in visible, nir and swir spectral ranges. Int. Arch. Photogramm. Remote Sens. Spat. Inf. Sci.-ISPRS Arch. 2016, 2016-Janua, 1143–1148. [Google Scholar]
- MicaSense Altum. Available online: https://www.micasense.com/altum (accessed on 17 September 2019).
- MicaSense RedEdge-MX. Available online: https://www.micasense.com/rededge-mx (accessed on 17 September 2019).
- Tetracam Micro-MCA. Available online: http://www.tetracam.com/Products-Micro_MCA.htm (accessed on 17 September 2019).
- Pinto, F.; Müller-Linow, M.; Schickling, A.; Cendrero-Mateo, M.P.; Ballvora, A.; Rascher, U. Multiangular Observation of Canopy Sun-Induced Chlorophyll Fluorescence by Combining Imaging Spectroscopy and Stereoscopy. Remote Sens. 2017, 9, 415. [Google Scholar] [CrossRef]


| CWL 1 (nm) | FWHM 2 (nm) | T 3 (%) | Blocking 4 (nm) | D 5 (mm) |
|---|---|---|---|---|
| 910 ± 2 | 10 ± 2 | ≥50 | 200–2500 | 25.4 |
| 980 ± 2 | 10 ± 2 | ≥50 | 200–2500 | 25.4 |
| 1100 ± 2 | 10 ± 2 | ≥40 | 200–3000 | 25.4 |
| 1200 ± 2 | 10 ± 2 | ≥40 | 200–3000 | 25.4 |
| Parameter | Specified Value |
|---|---|
| Sensors | InGaAs PIN-Photodiode |
| Data acquisition | Multi-Camera 2D imager |
| Spectral response | 400 to 1700 nm |
| SNRPeak | 58 dB |
| Dynamic Range | 71 dB |
| Shutter mode | Global Shutter |
| Power Supply | 9 to 36 V |
| Power consumption | 15 W @ 12 V |
| Weight: | |
| SMU | 600 g |
| SCU | 900 g |
© 2019 by the authors. Licensee MDPI, Basel, Switzerland. This article is an open access article distributed under the terms and conditions of the Creative Commons Attribution (CC BY) license (http://creativecommons.org/licenses/by/4.0/).
Share and Cite
Jenal, A.; Bareth, G.; Bolten, A.; Kneer, C.; Weber, I.; Bongartz, J. Development of a VNIR/SWIR Multispectral Imaging System for Vegetation Monitoring with Unmanned Aerial Vehicles. Sensors 2019, 19, 5507. https://doi.org/10.3390/s19245507
Jenal A, Bareth G, Bolten A, Kneer C, Weber I, Bongartz J. Development of a VNIR/SWIR Multispectral Imaging System for Vegetation Monitoring with Unmanned Aerial Vehicles. Sensors. 2019; 19(24):5507. https://doi.org/10.3390/s19245507
Chicago/Turabian StyleJenal, Alexander, Georg Bareth, Andreas Bolten, Caspar Kneer, Immanuel Weber, and Jens Bongartz. 2019. "Development of a VNIR/SWIR Multispectral Imaging System for Vegetation Monitoring with Unmanned Aerial Vehicles" Sensors 19, no. 24: 5507. https://doi.org/10.3390/s19245507
APA StyleJenal, A., Bareth, G., Bolten, A., Kneer, C., Weber, I., & Bongartz, J. (2019). Development of a VNIR/SWIR Multispectral Imaging System for Vegetation Monitoring with Unmanned Aerial Vehicles. Sensors, 19(24), 5507. https://doi.org/10.3390/s19245507