Static and Dynamic Evaluation of a Winding Deformation FBG Sensor for Power Transformer Applications

 , ,
, ,  ,
, 
Abstract
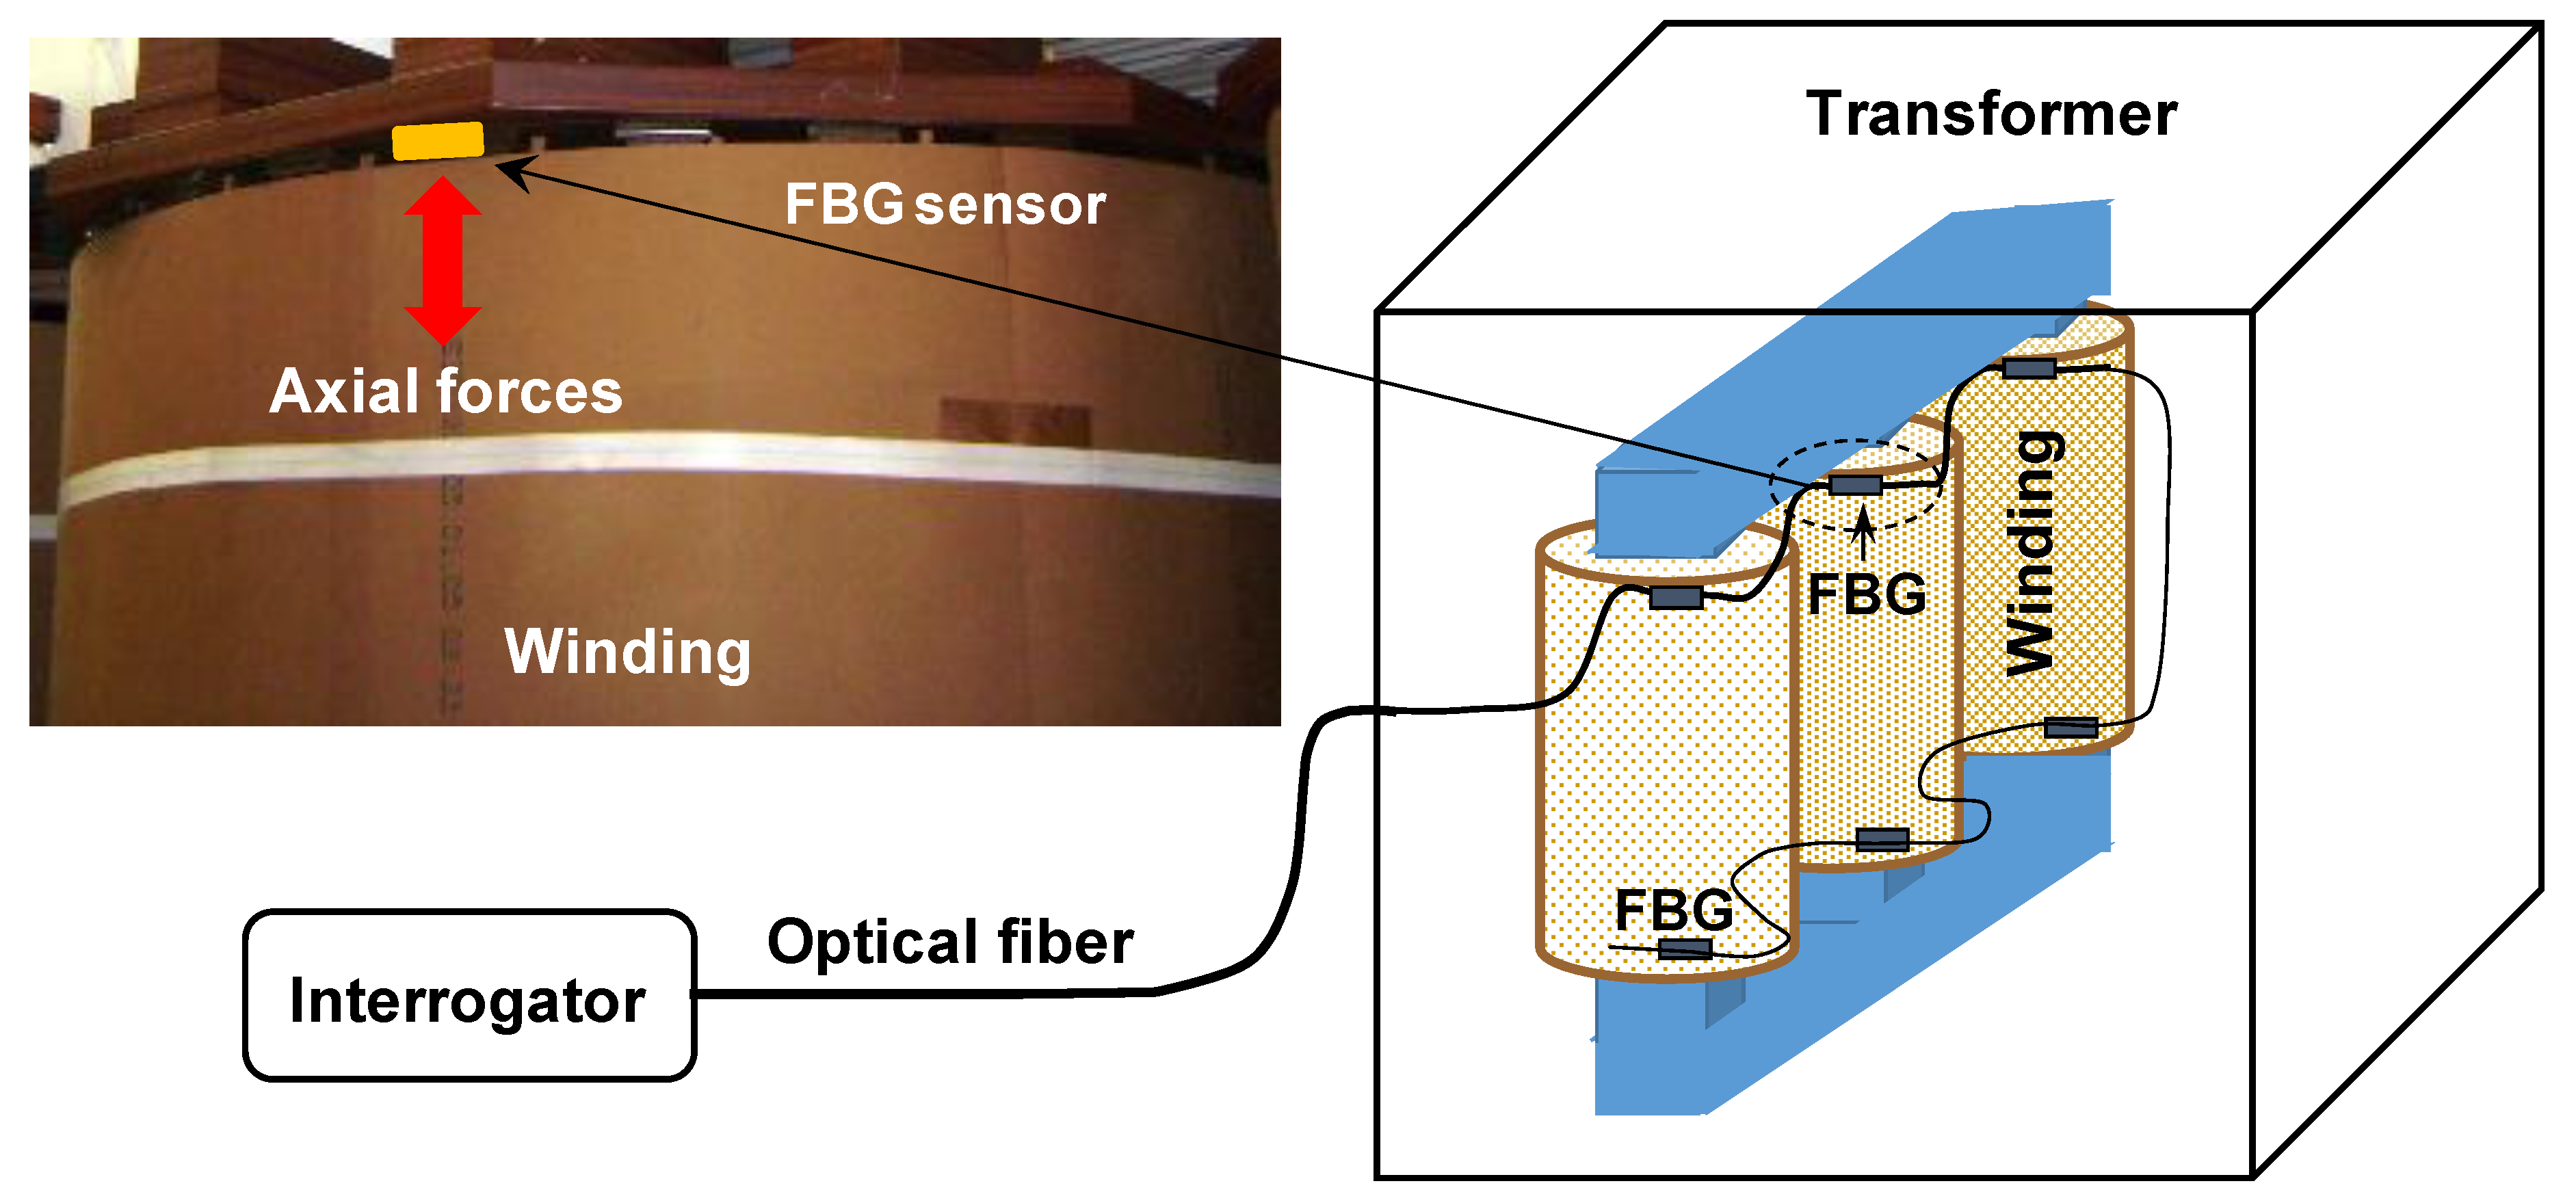
1. Introduction
2. Materials and Methods
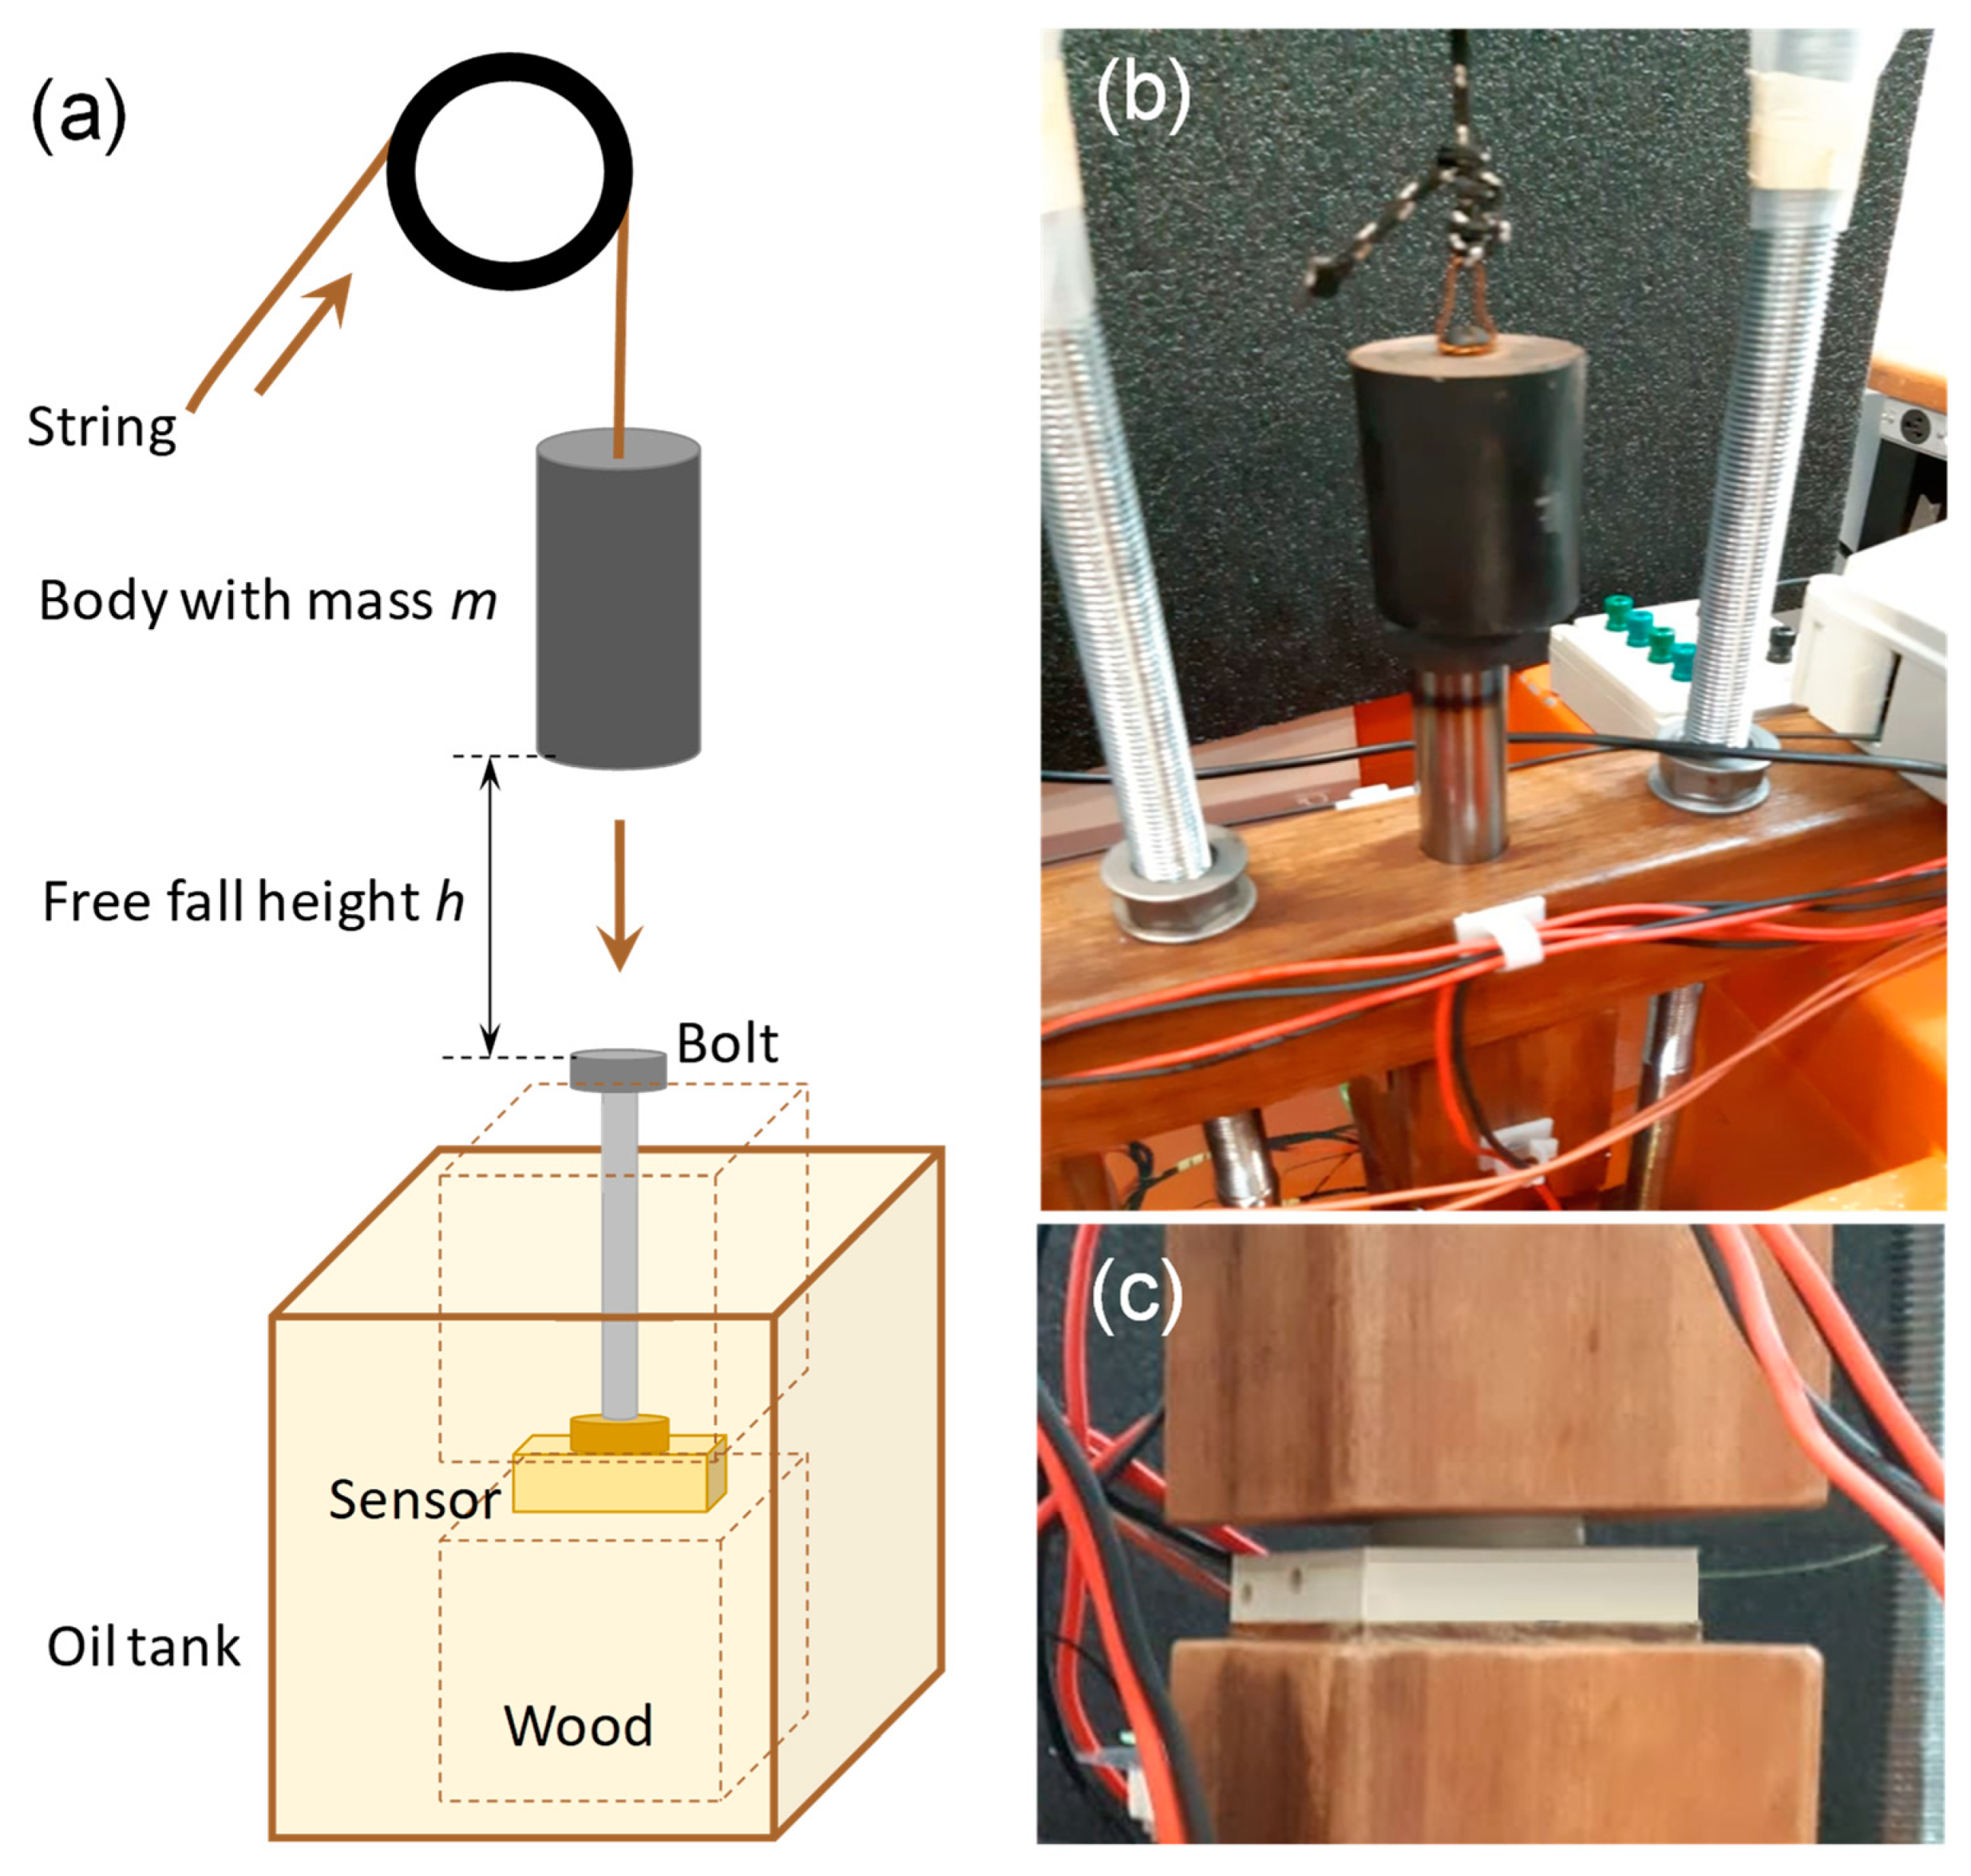
2.1. Methods
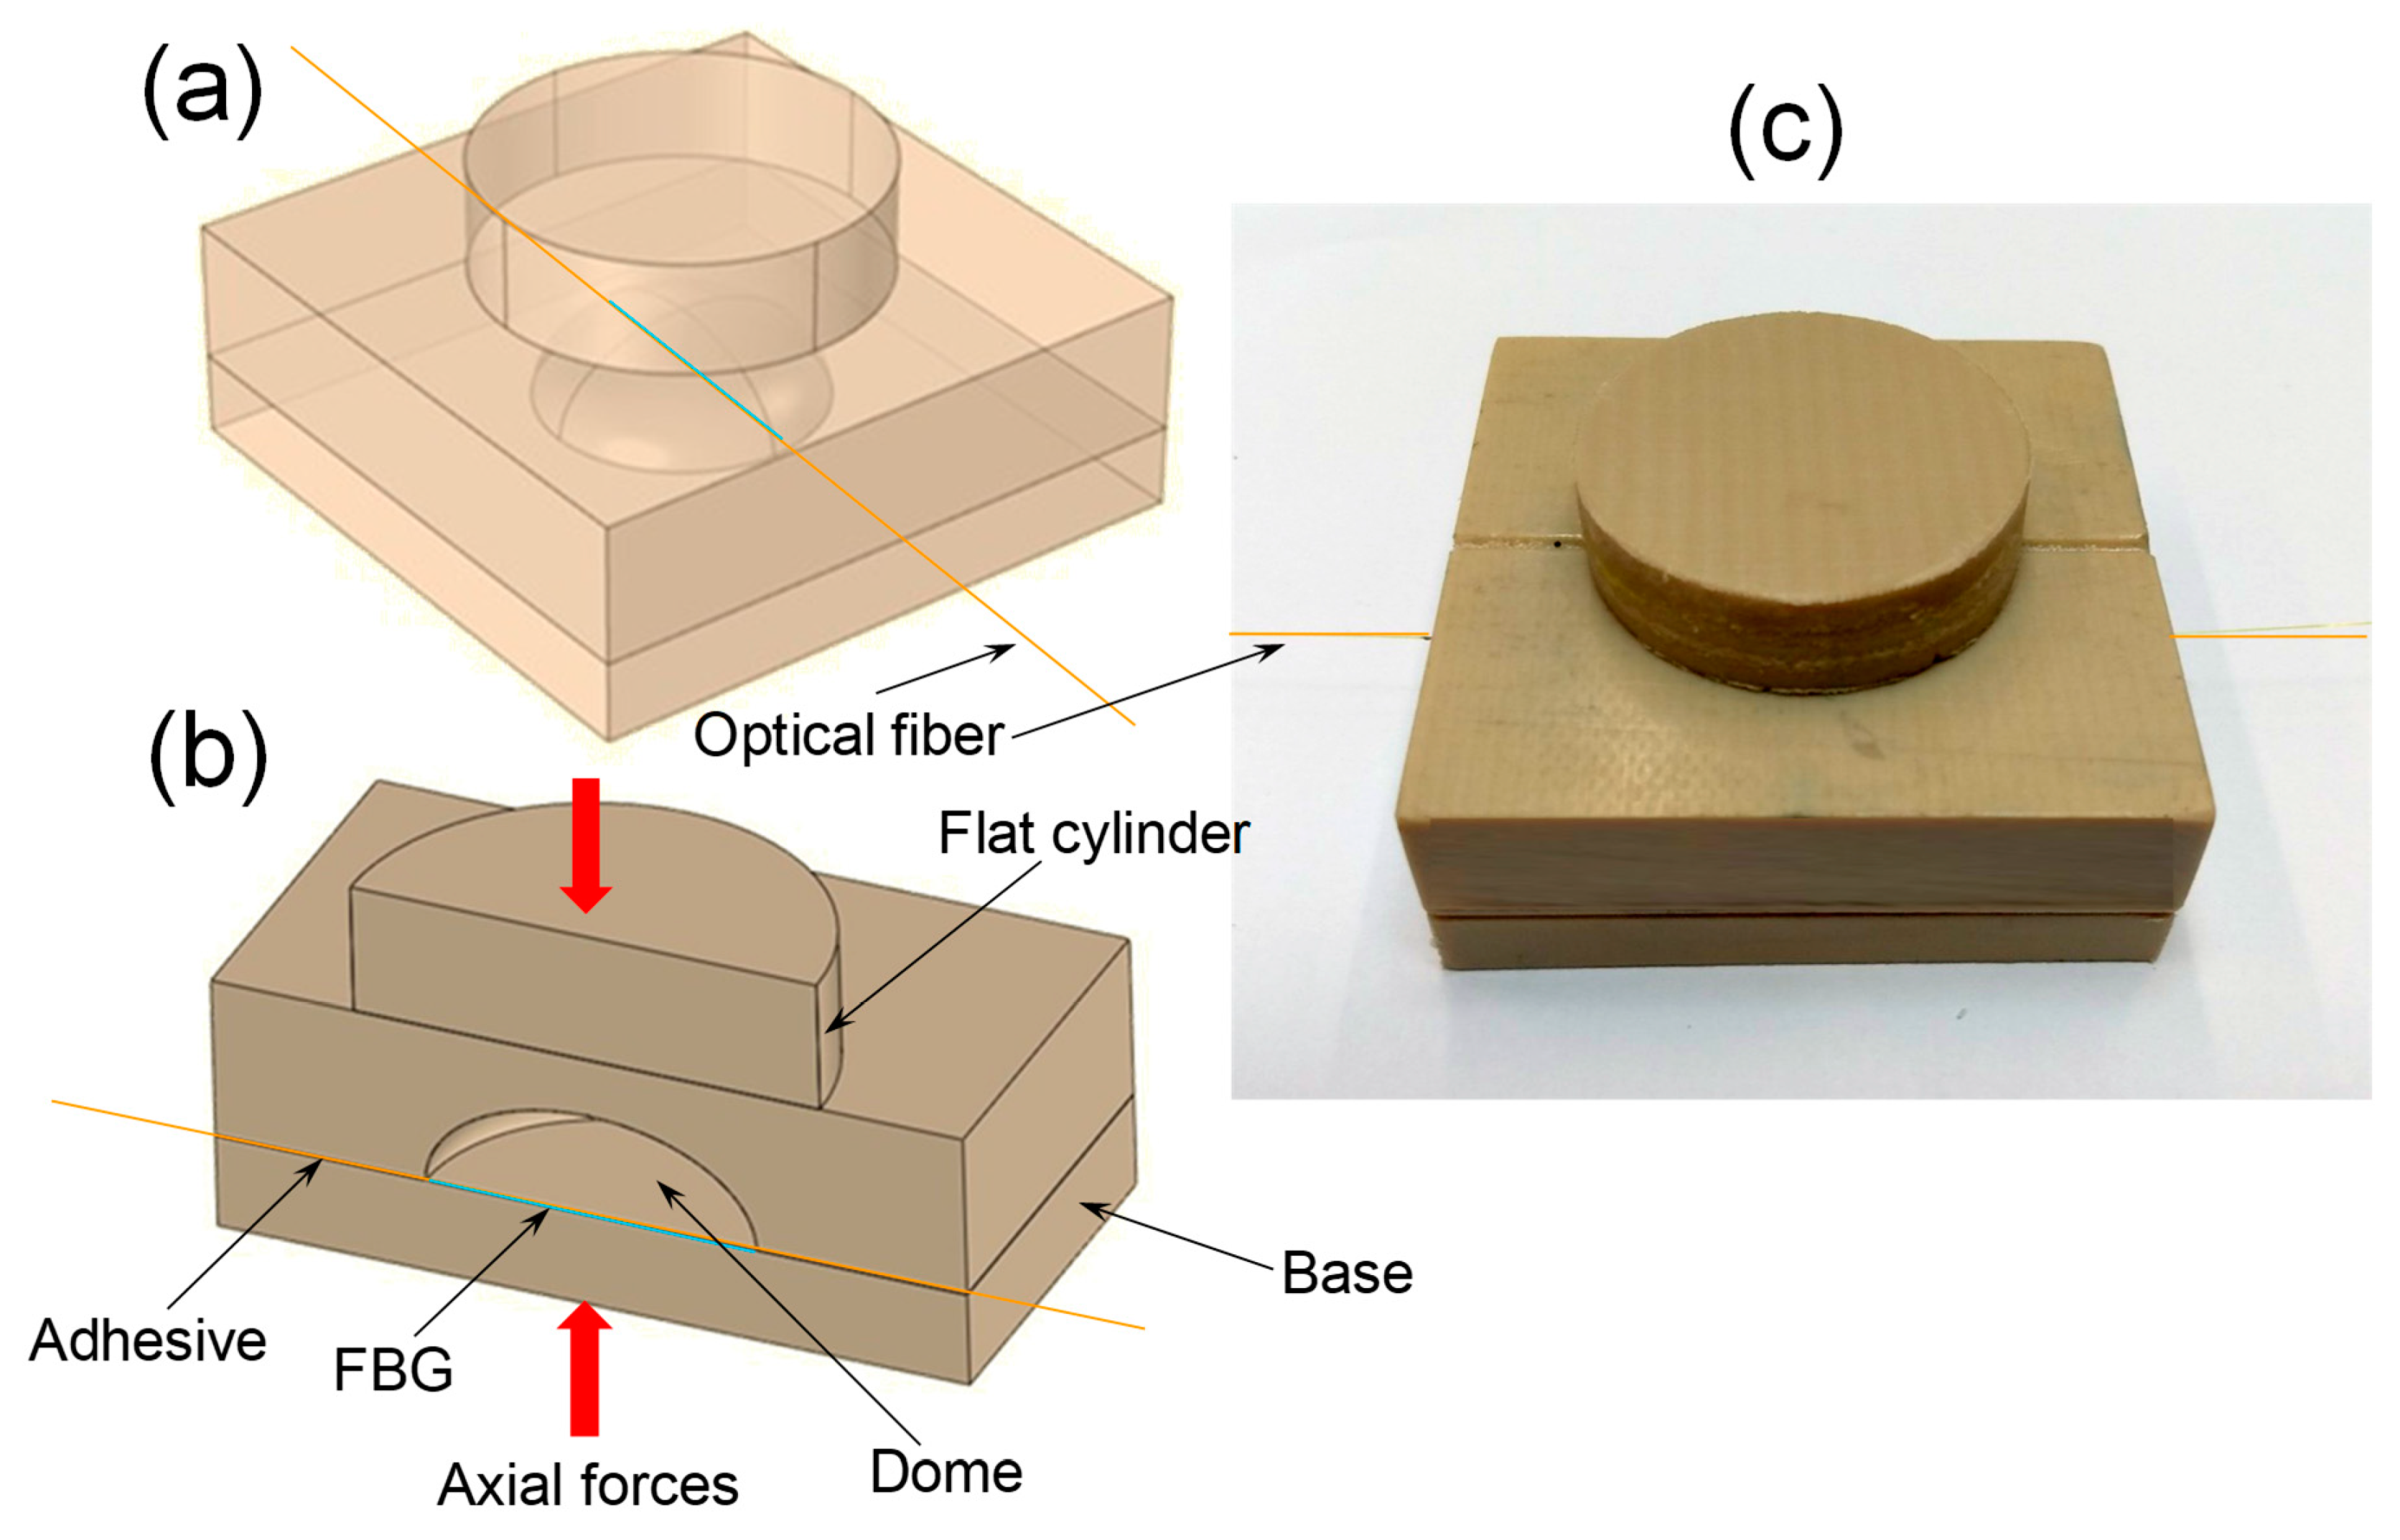
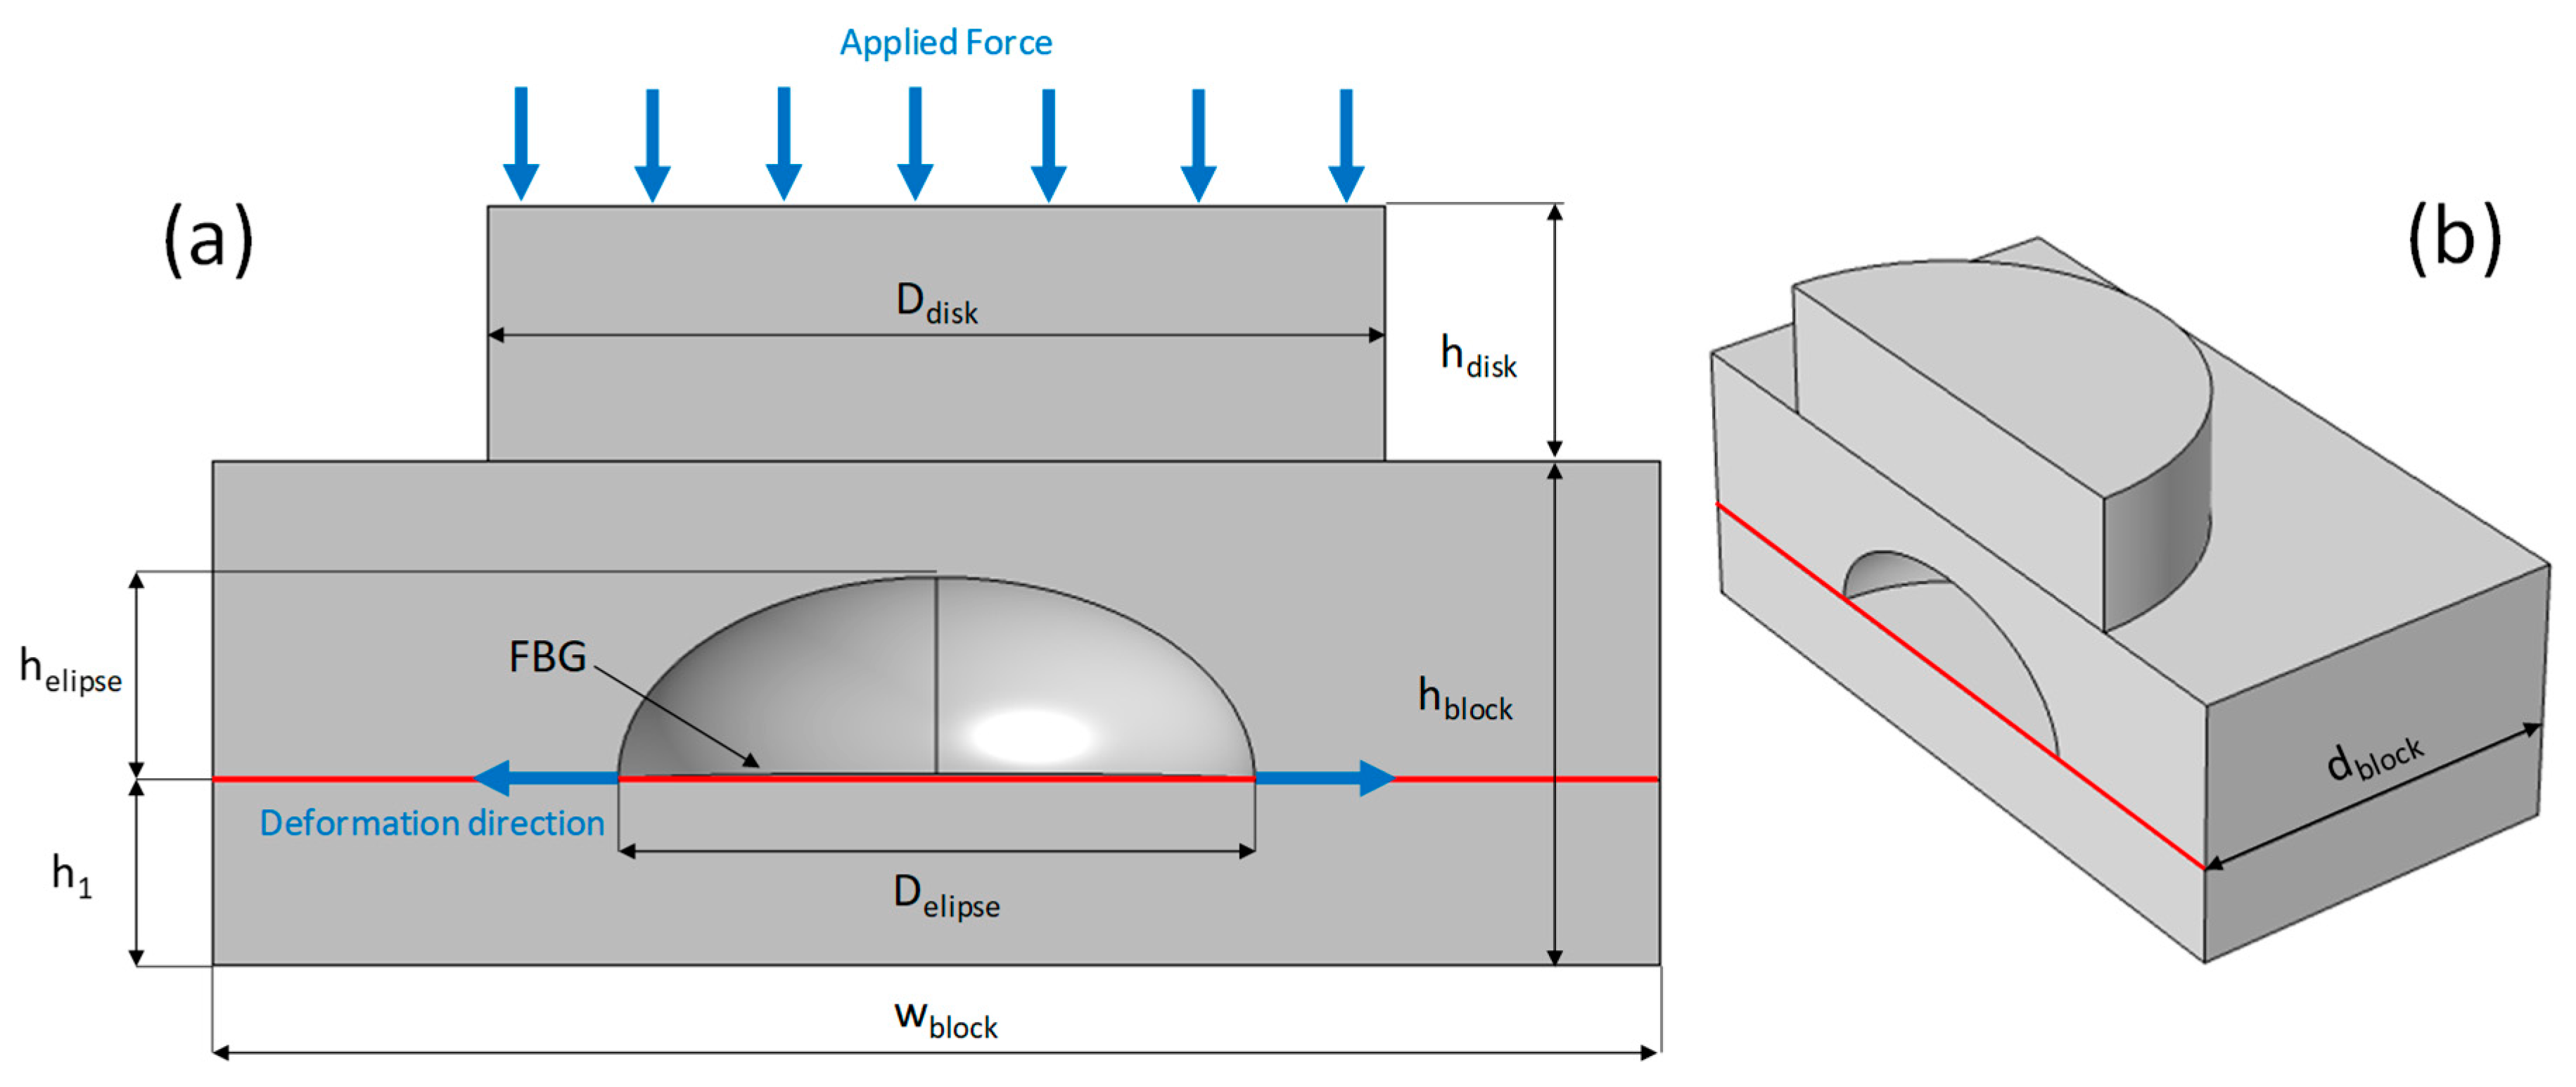
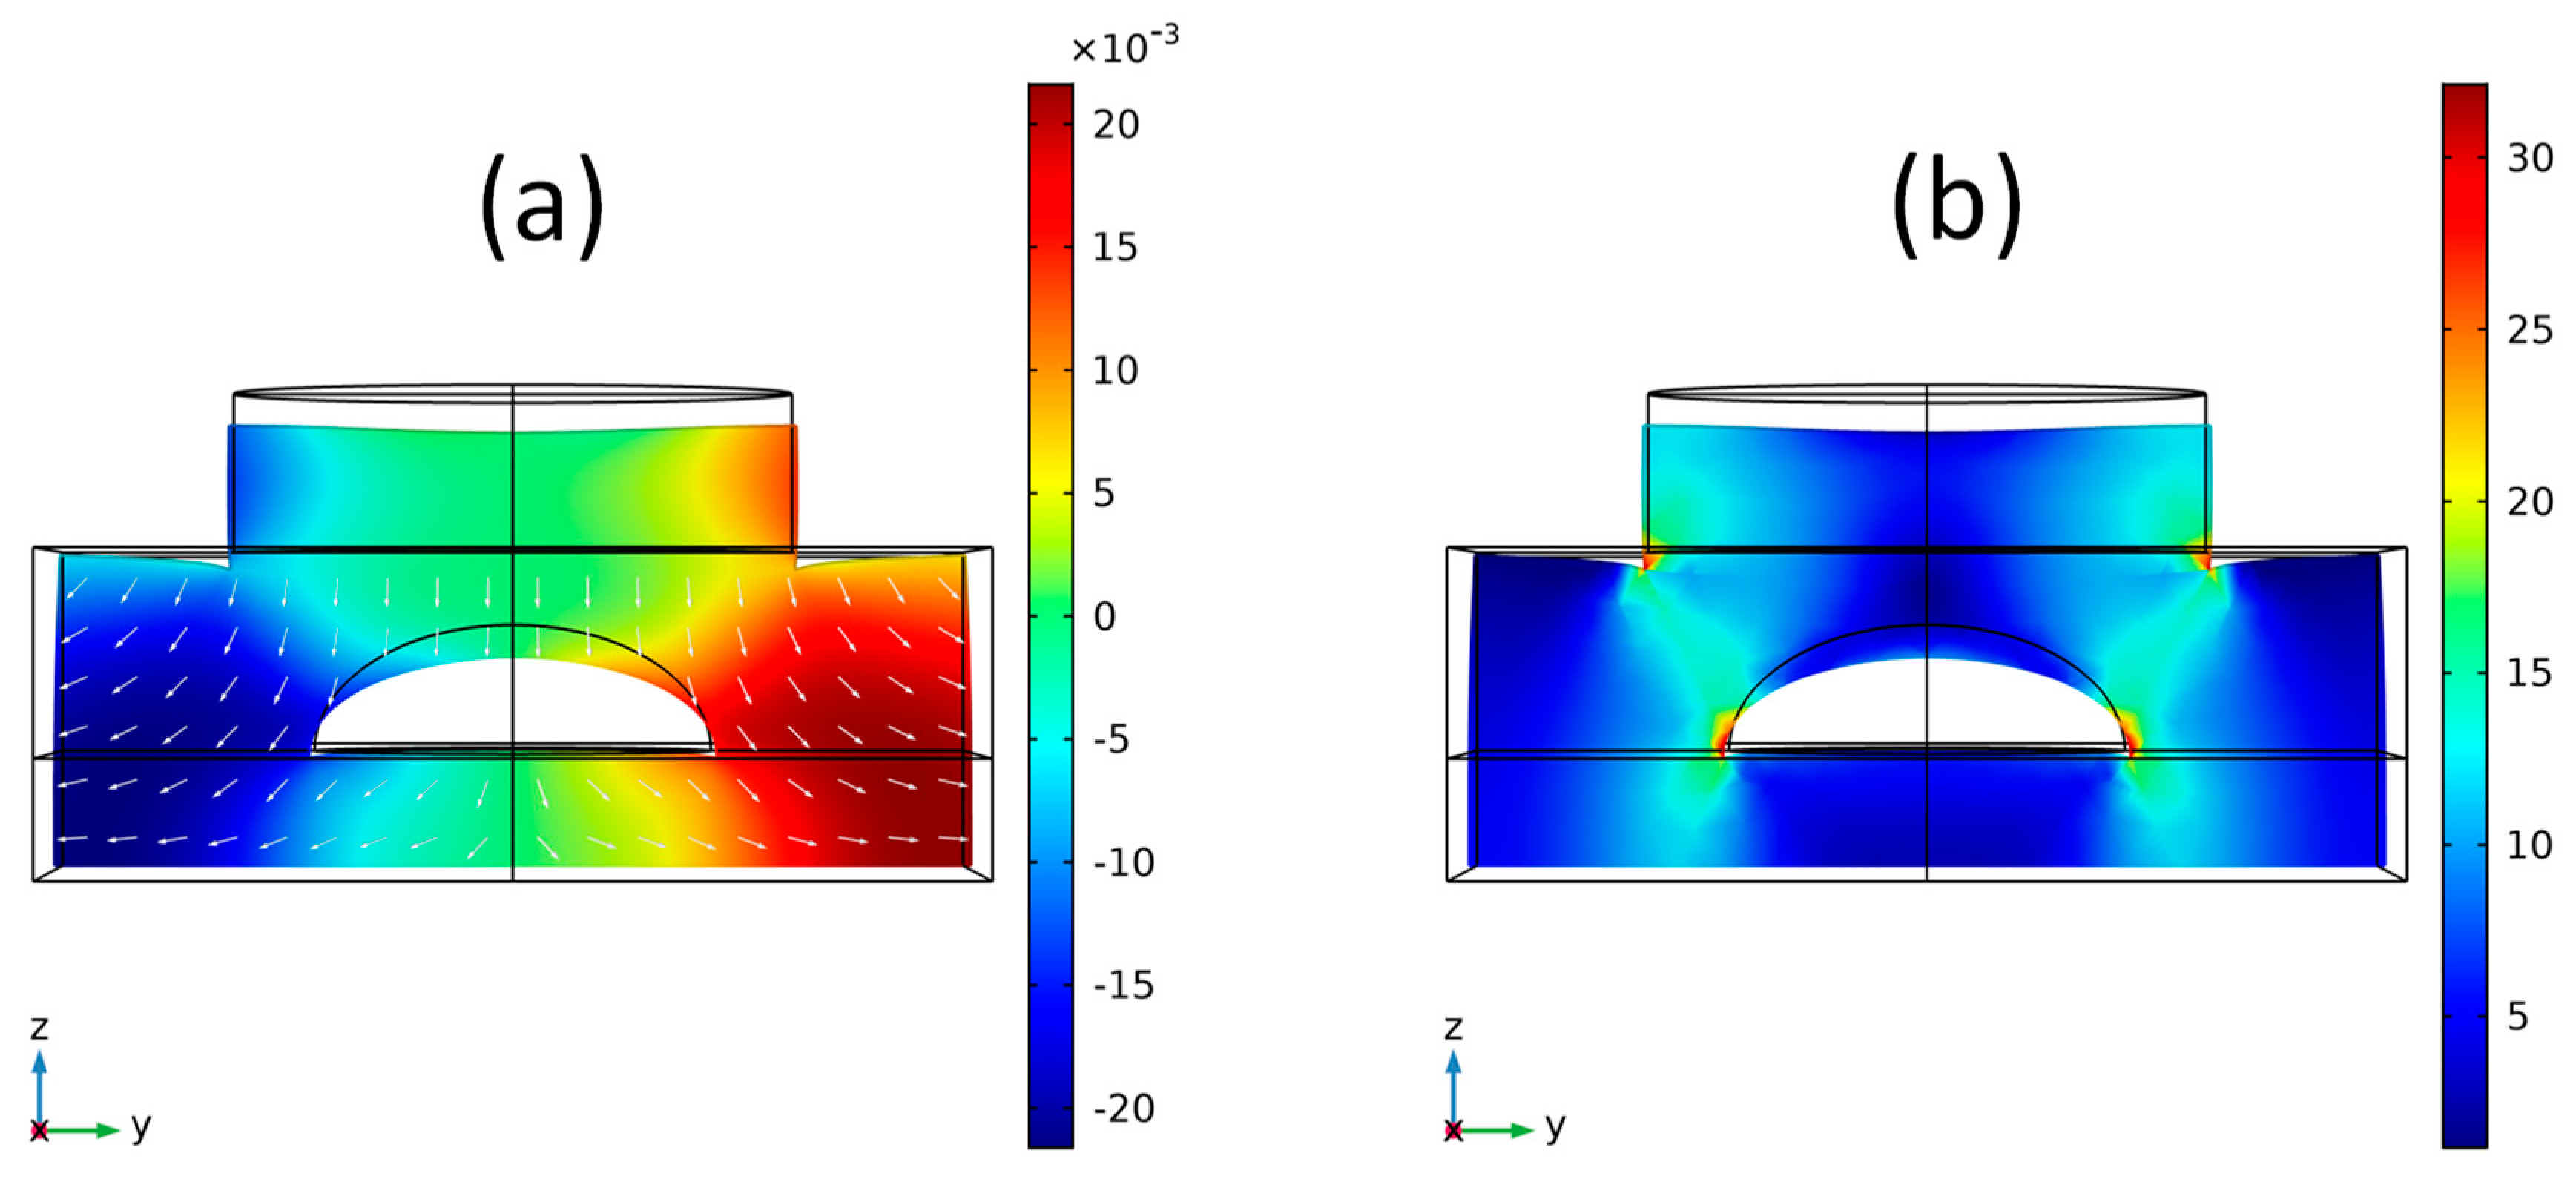
2.2. FBG Deformation Sensor Shape
2.3. FBG Deformation Sensor Materials
3. Results
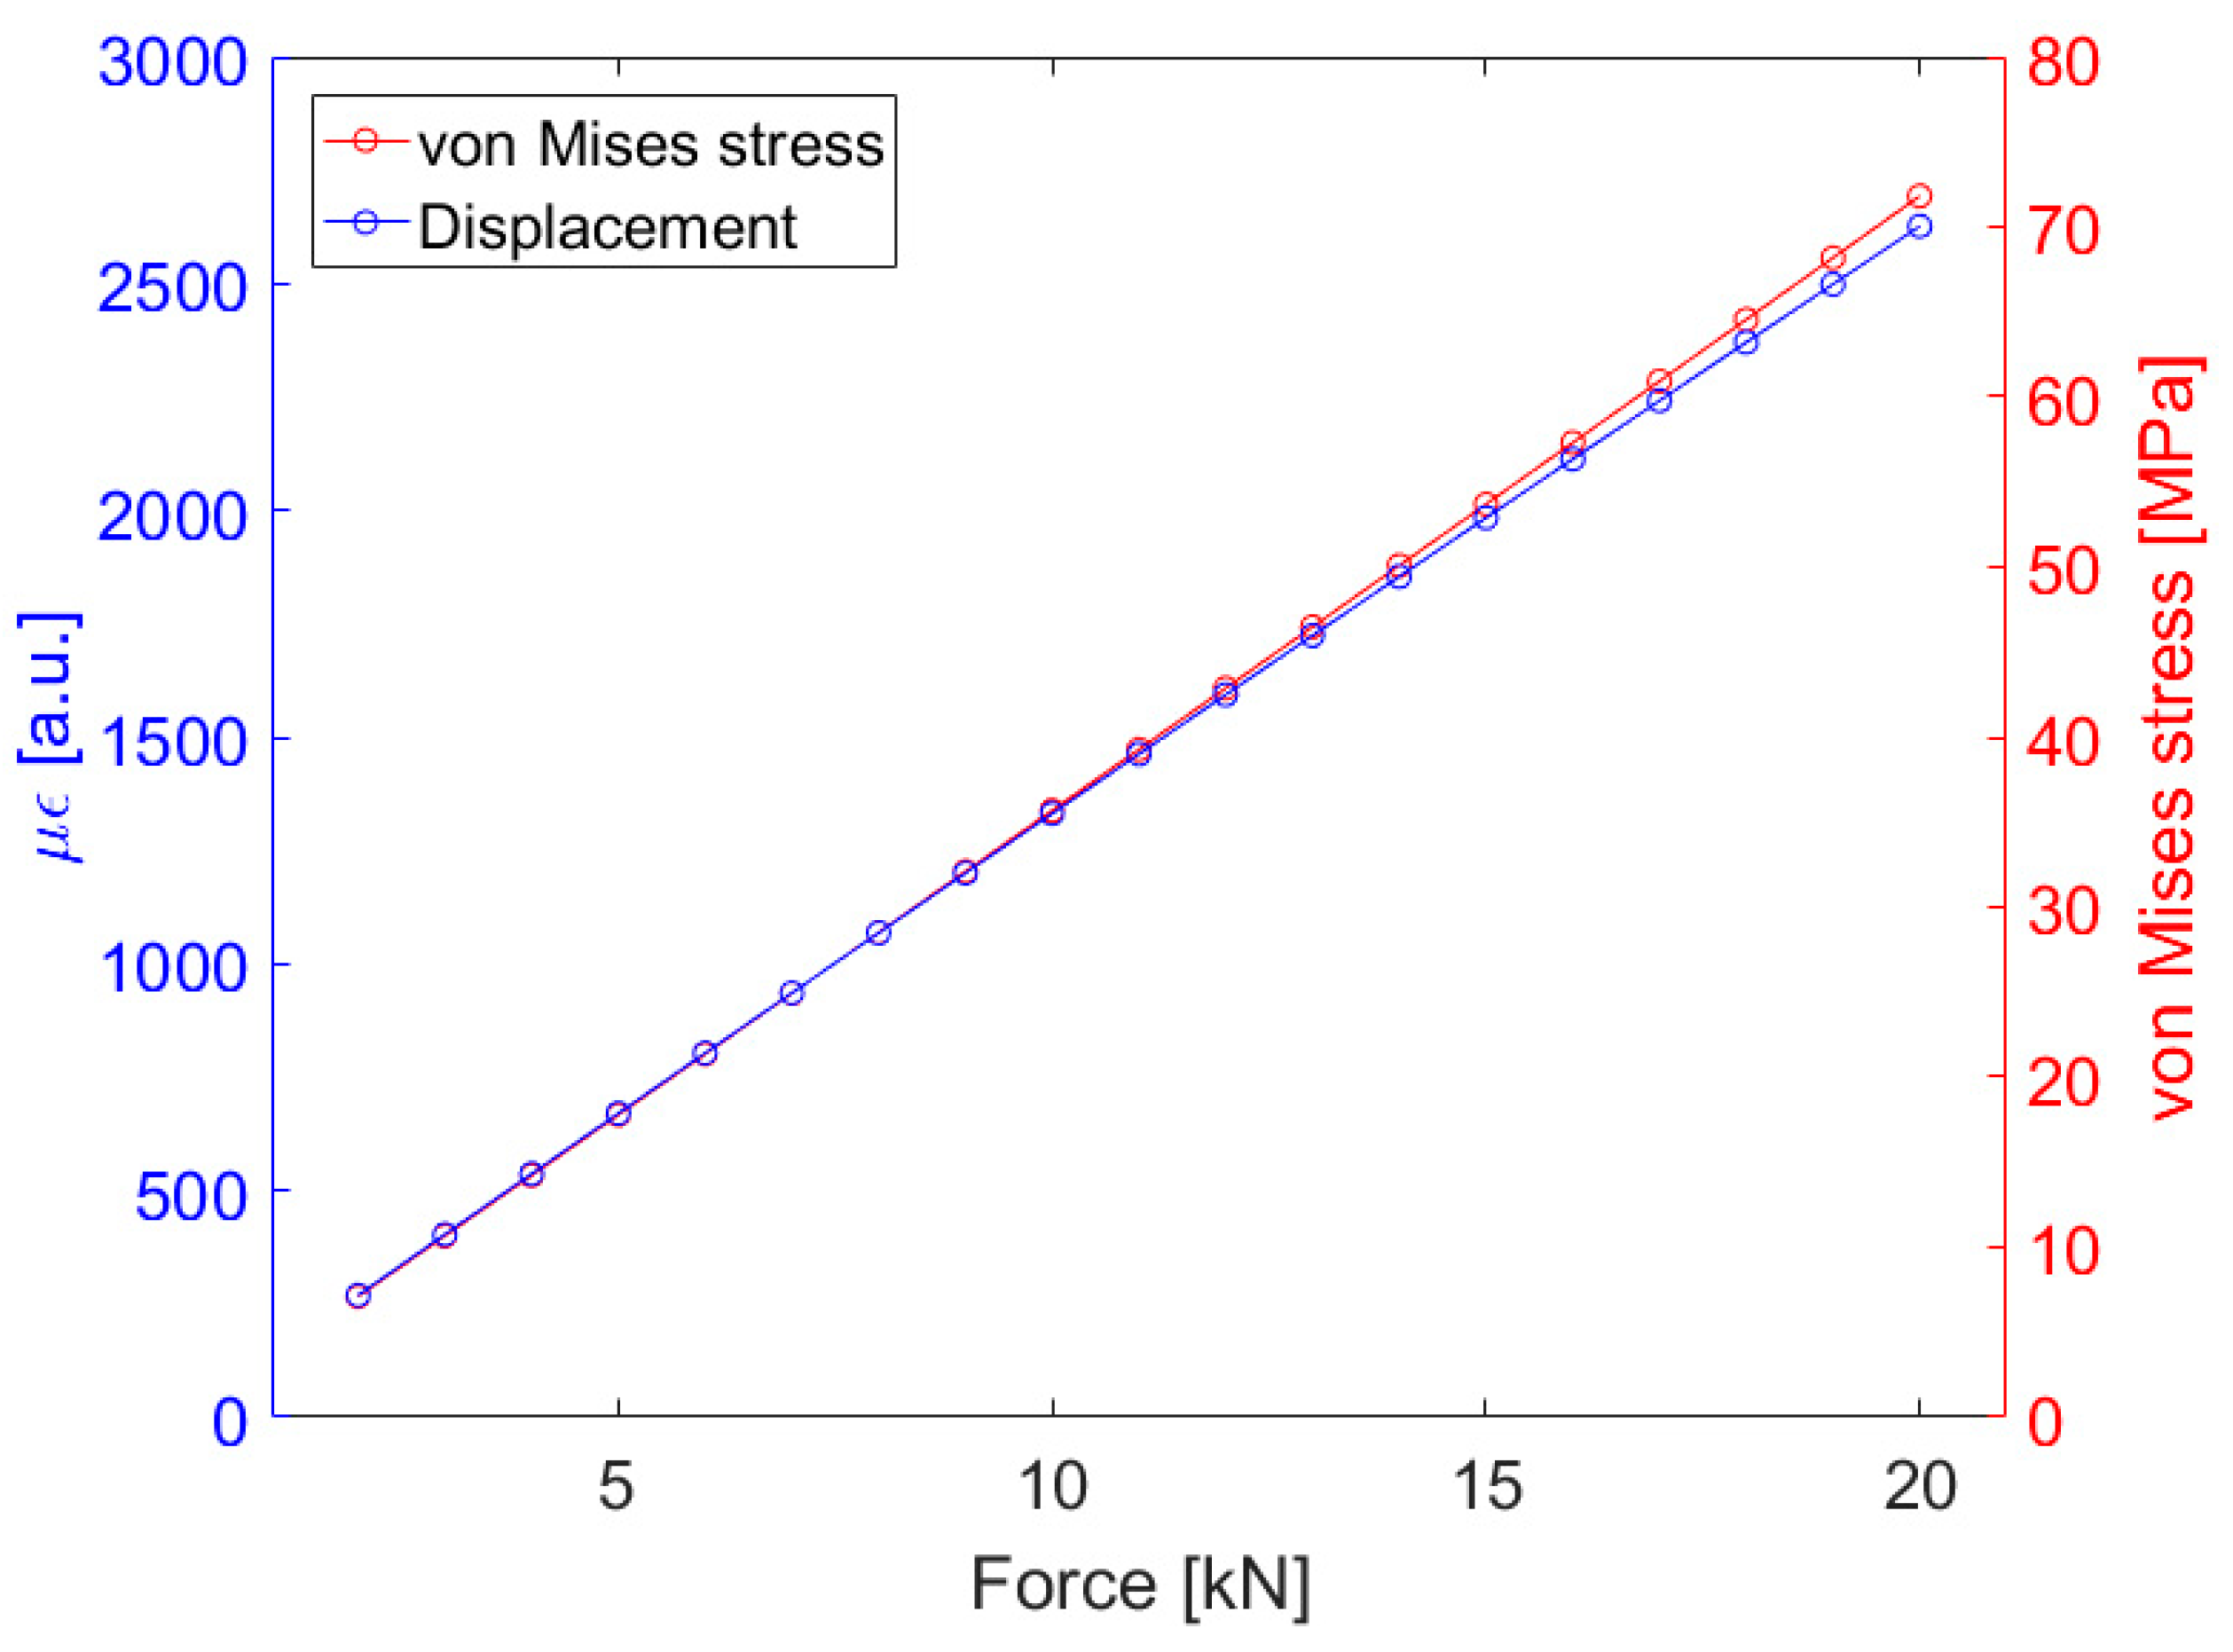
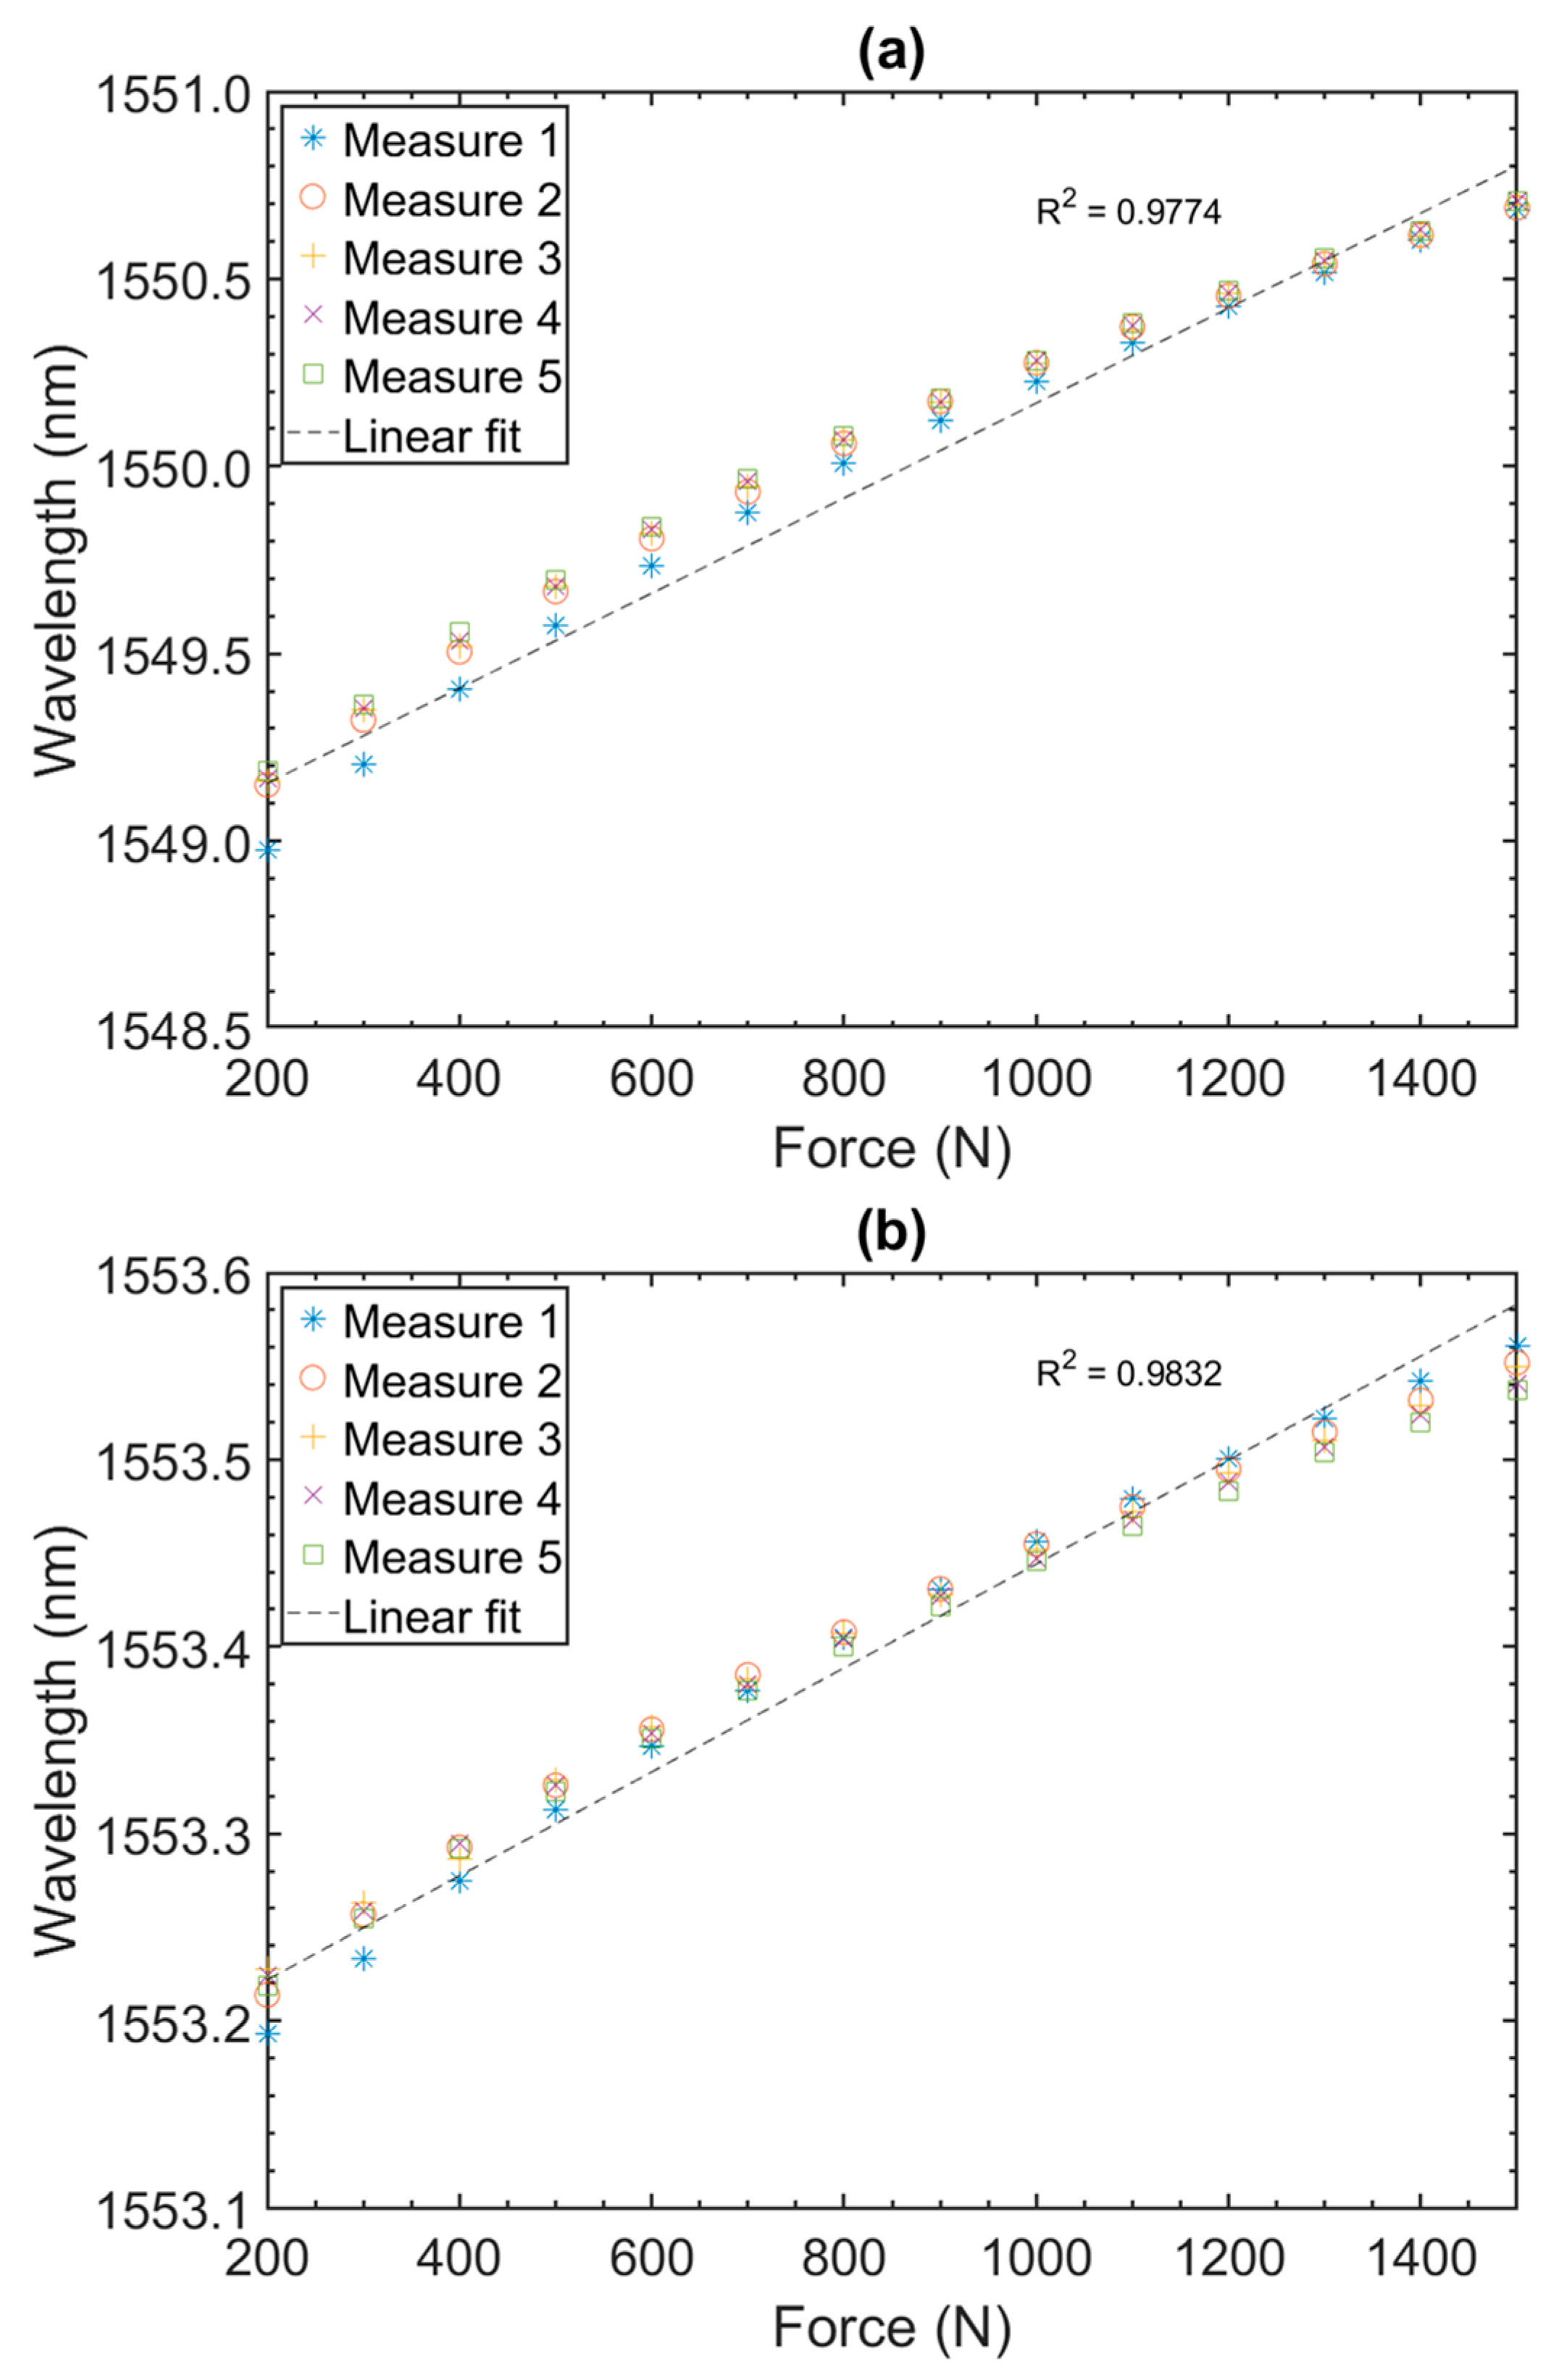
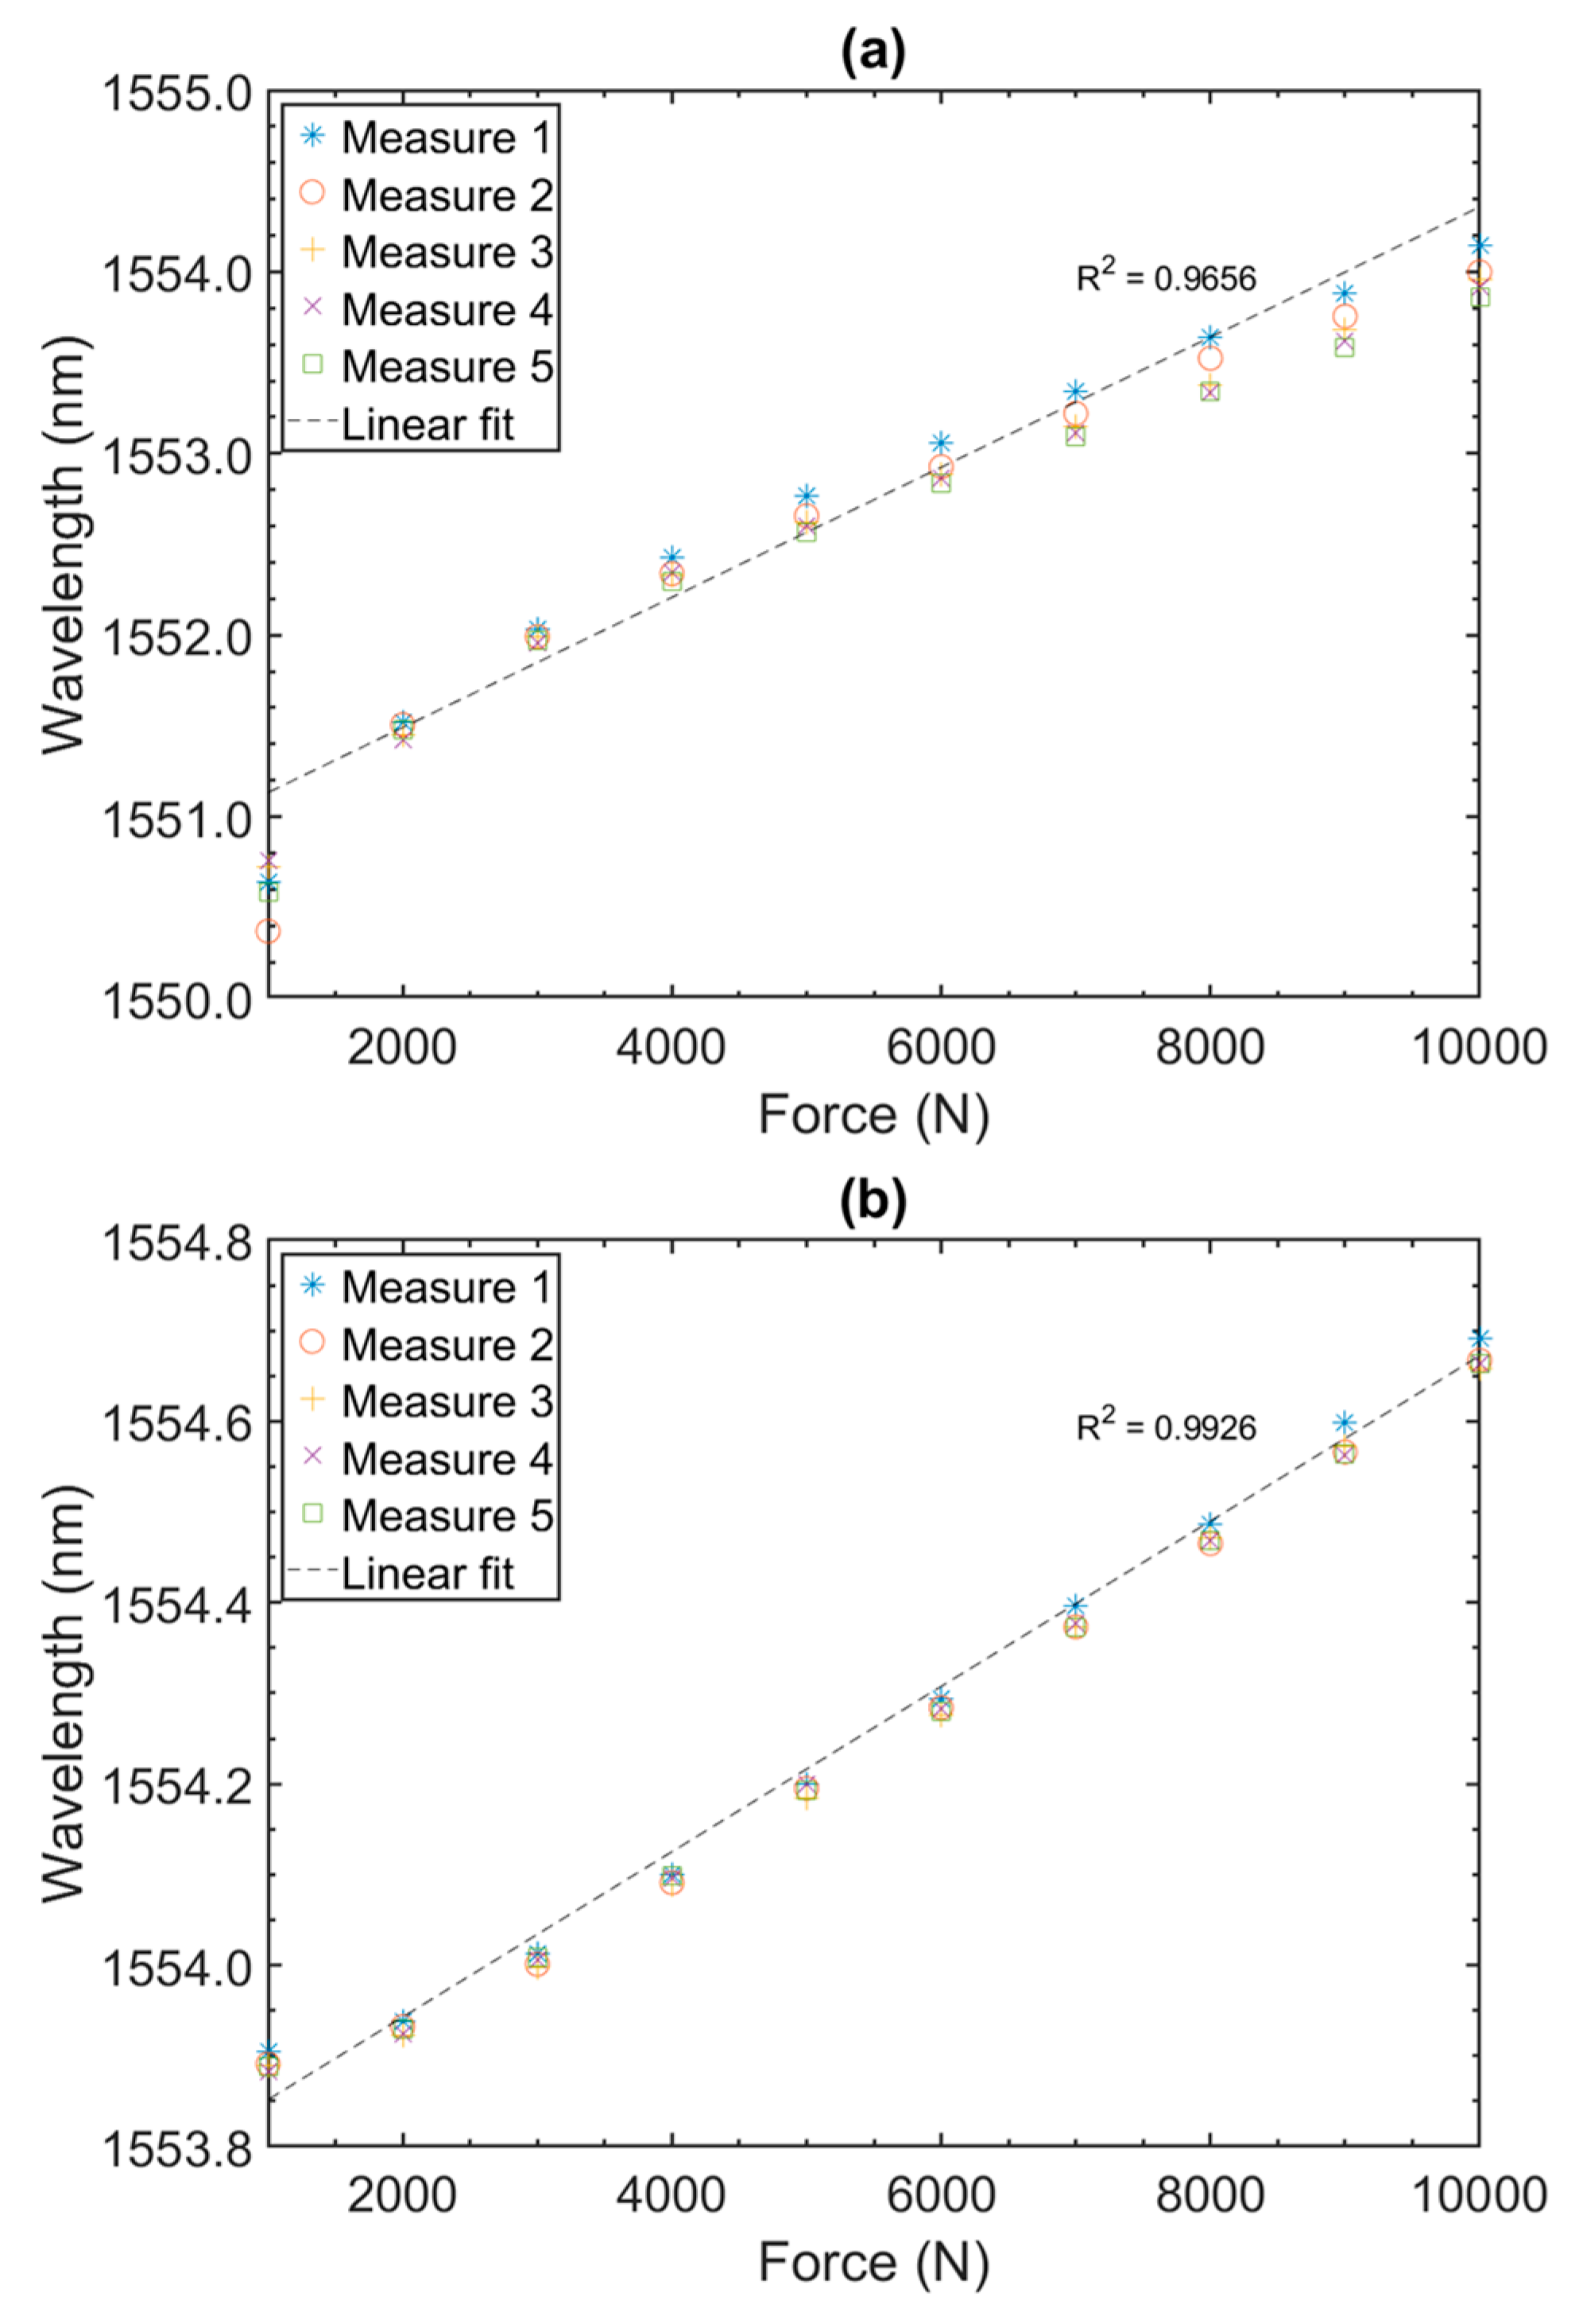
3.1. Static Tests
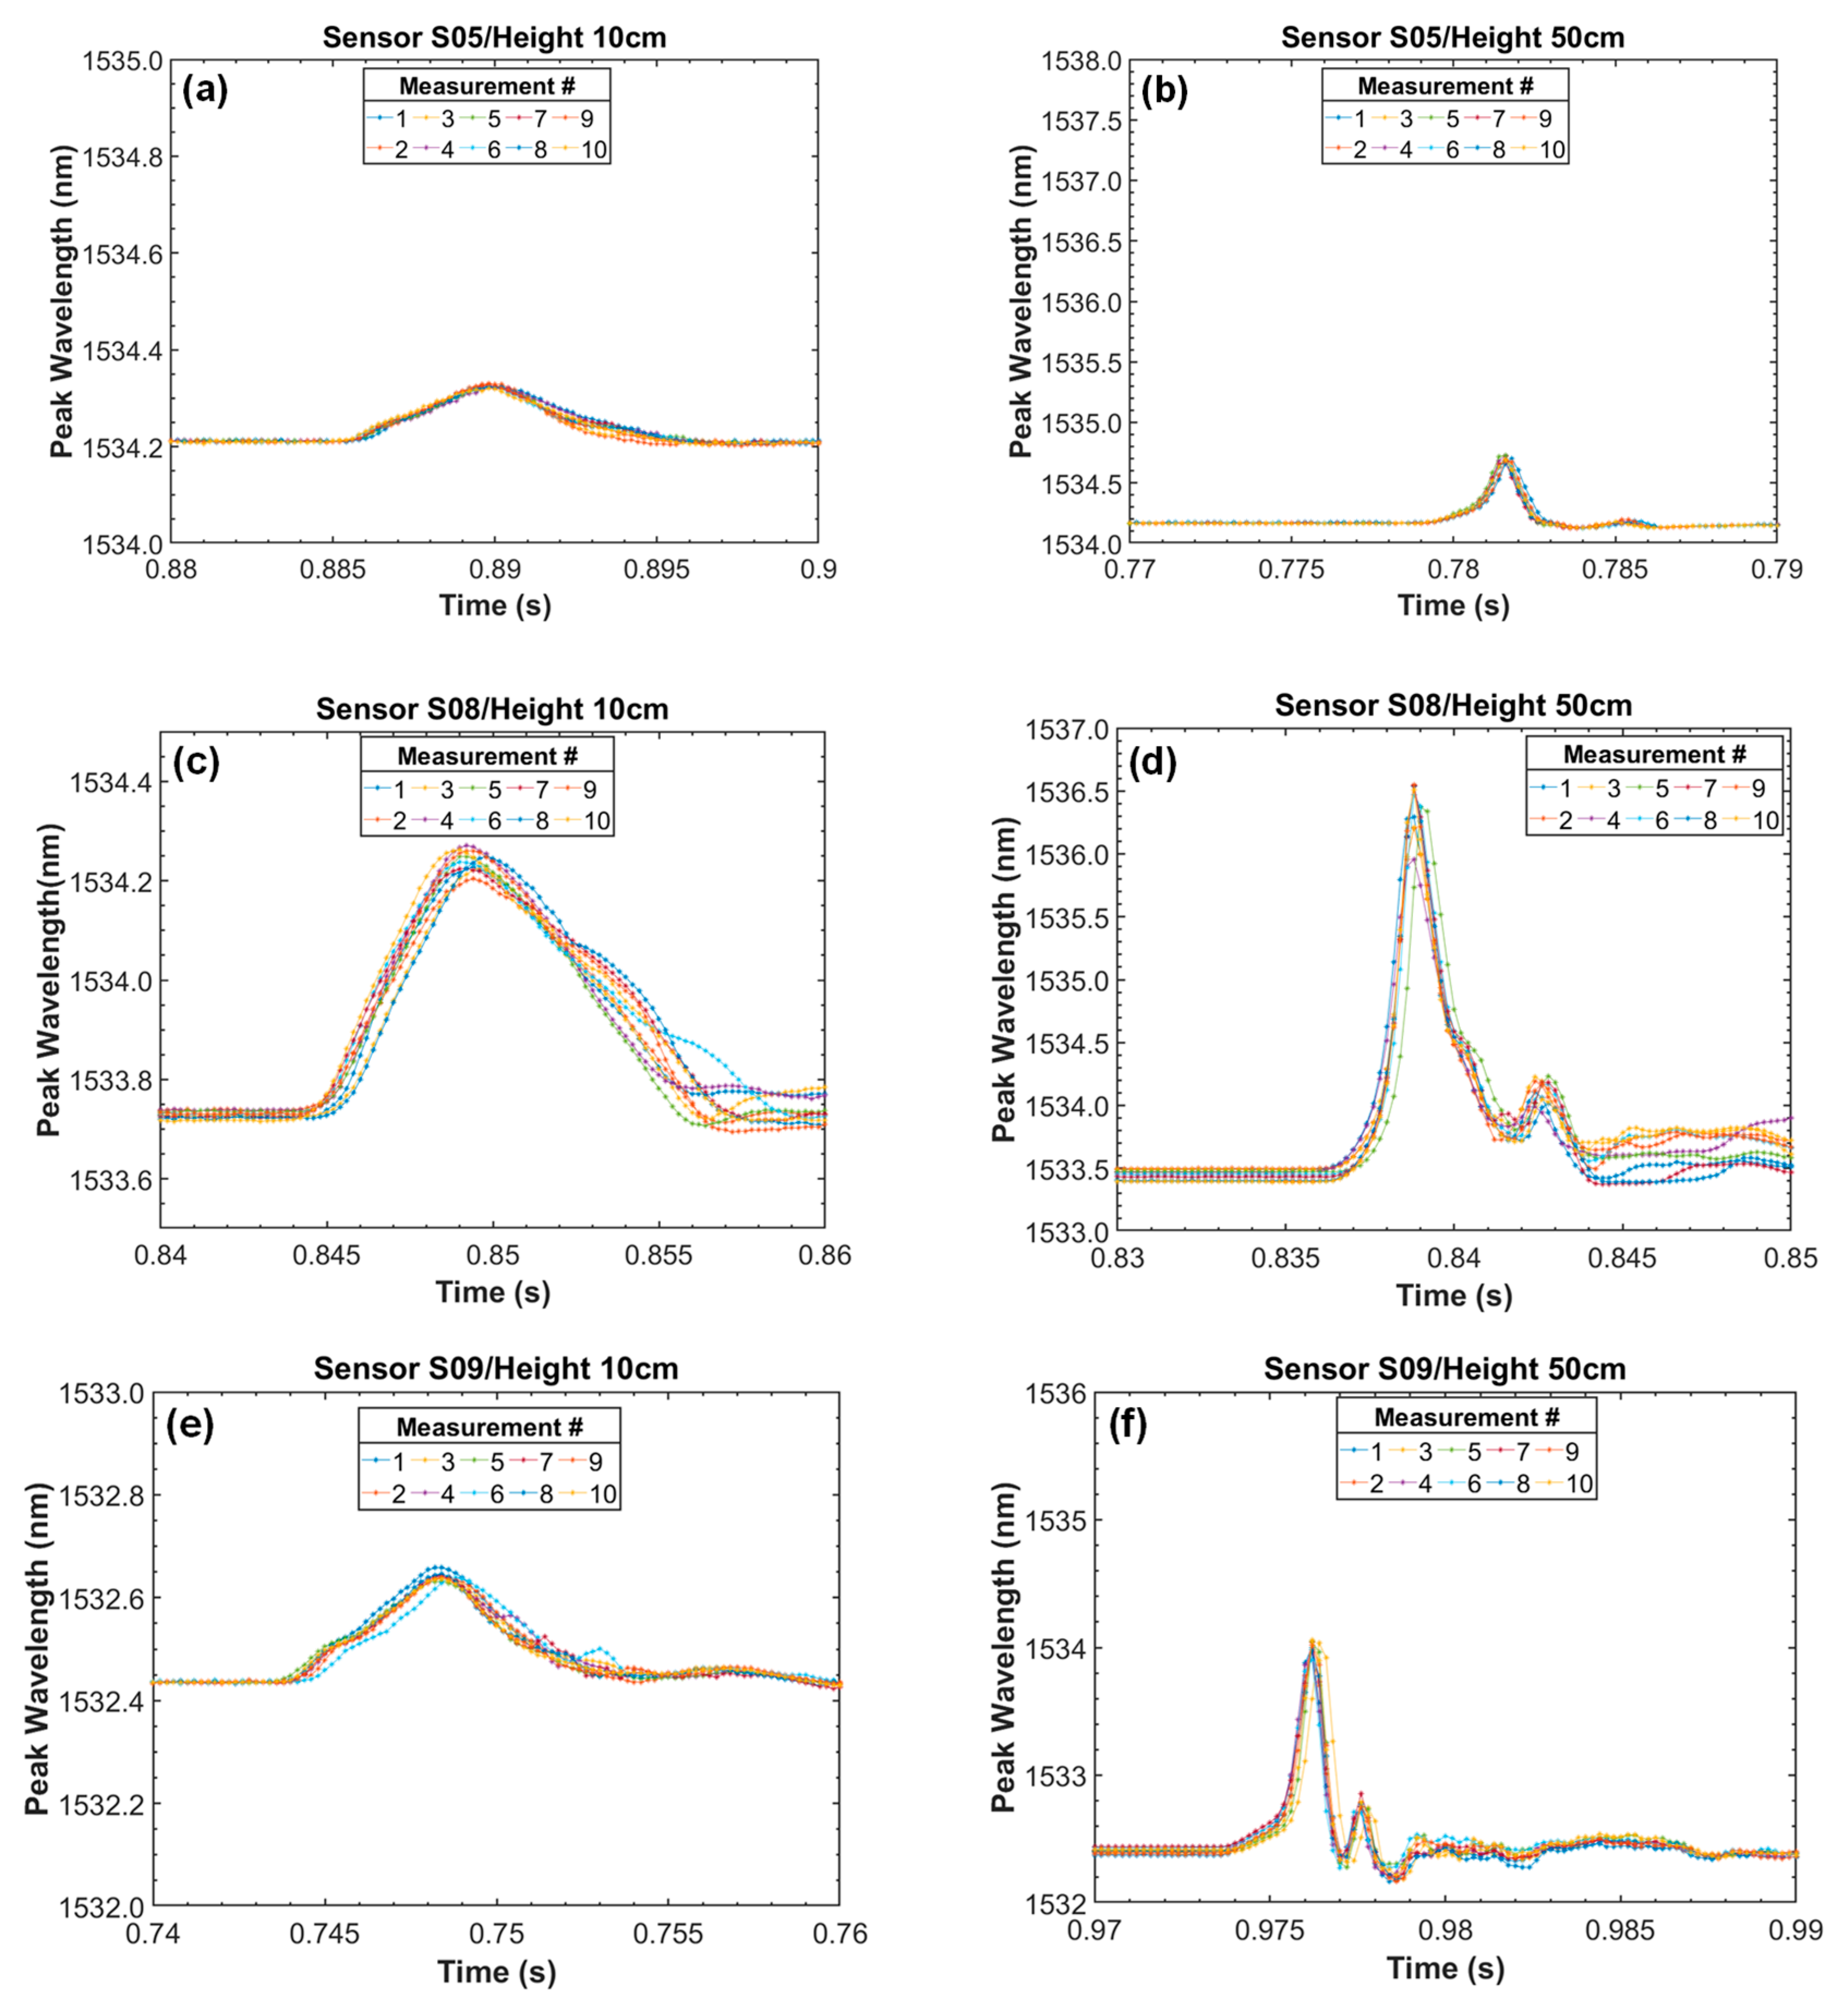
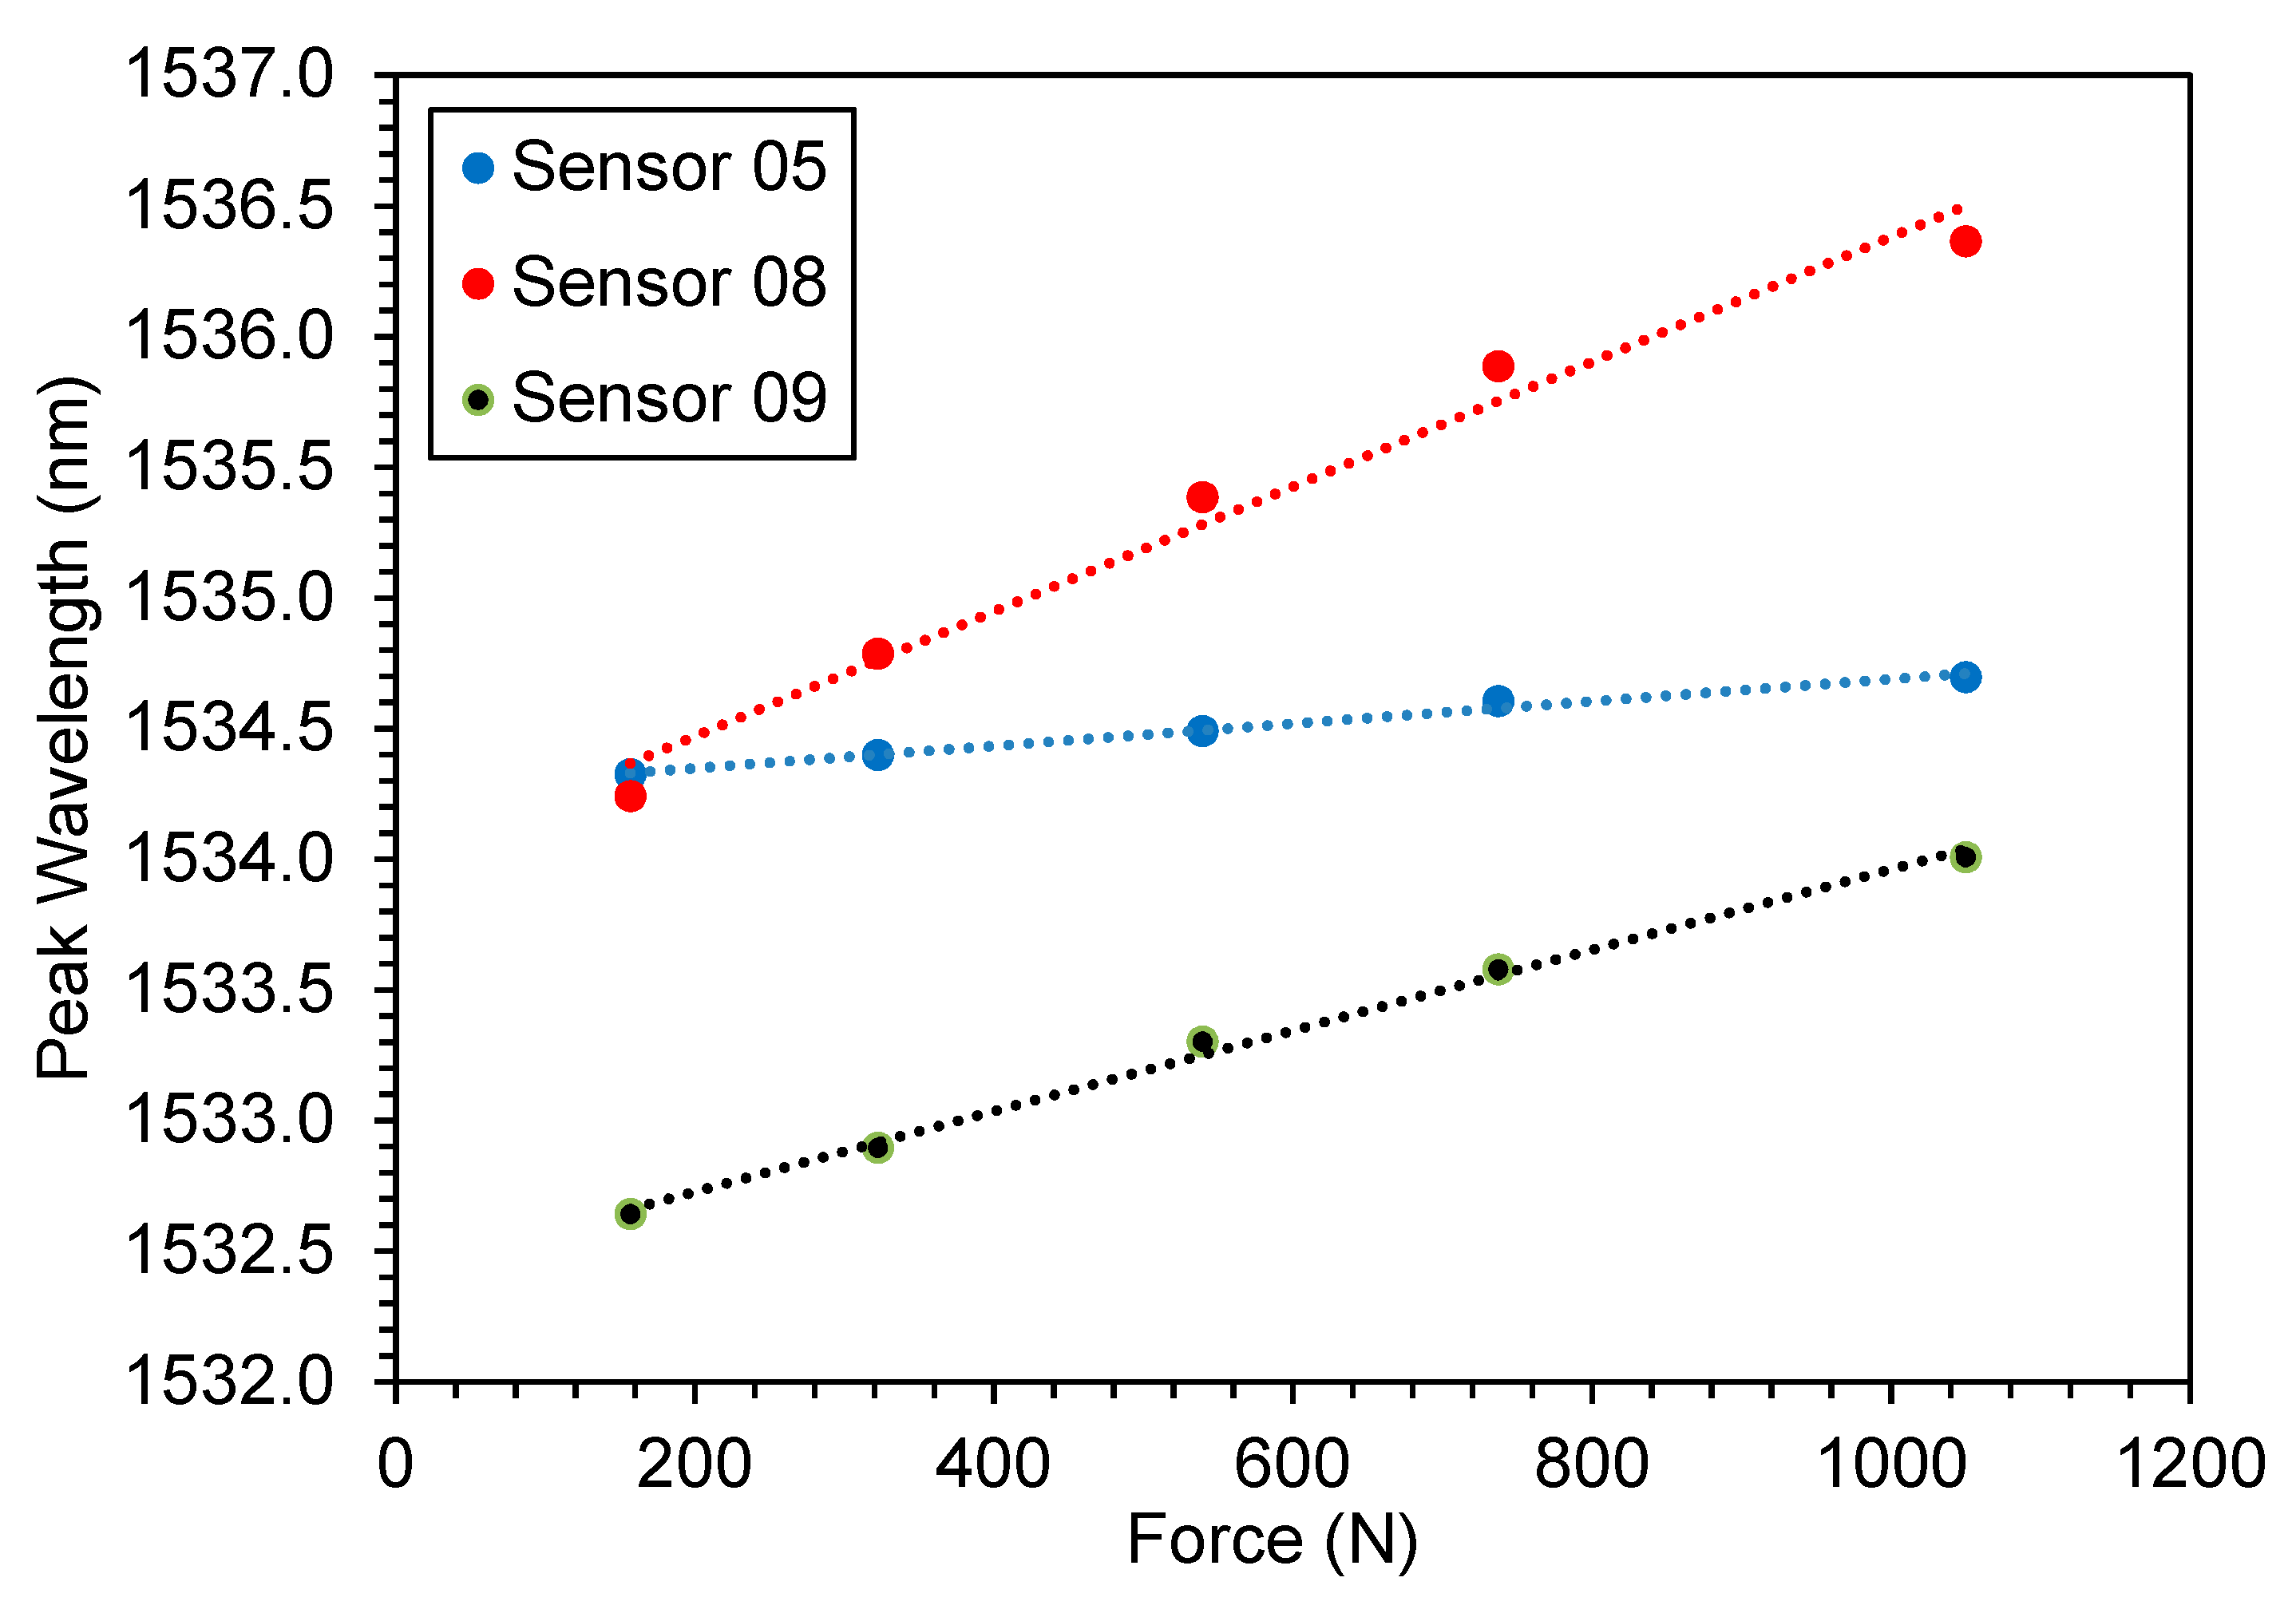
3.2. Dynamic Impact Tests
4. Discussion
Supplementary Materials
Author Contributions
Funding
Acknowledgments
Conflicts of Interest
References
- Aburaghiega, E.; Farrag, M.E.; Hepburn, D.M.; Garcia, B. Power transformer health monitoring: A shift from off-line to on-line detection. In Proceedings of the 2015 50th International Universities Power Engineering Conference (UPEC), Stoke on Trent, UK, 1–4 September 2015; pp. 1–6. [Google Scholar]
- Secue, J.R.; Mombello, E. Sweep frequency response analysis (SFRA) for the assessment of winding displacements and deformation in power transformers. Electr. Power Syst. Res. 2008, 78, 1119–1128. [Google Scholar] [CrossRef]
- Bagheri, M.; Naderi, M.S.; Blackburn, T.; Phung, T. Frequency response analysis and short-circuit impedance measurement in detection of winding deformation within power transformers. IEEE Electr. Insul. Mag. 2013, 29, 33–40. [Google Scholar] [CrossRef]
- Zhang, H.; Yang, B.; Xu, W.; Wang, S.; Wang, G.; Huangfu, Y.; Zhang, J. Dynamic Deformation Analysis of Power Transformer Windings in Short-Circuit Fault by FEM. IEEE Trans. Appl. Supercond. 2014, 24, 1–4. [Google Scholar]
- Perez, I.M.; Cui, H.; Udd, E. Acoustic emission detection using fiber Bragg gratings. In Proceedings of the SPIE’s 8th Annual International Symposium on Smart Structures and Materials, Newport Beach, CA, USA, 4–8 March 2001; pp. 209–215. [Google Scholar]
- Lima, S.E.; Frazão, O.; Farias, R.G.; Araújo, F.M.; Ferreira, L.A.; Santos, J.L.; Miranda, V. Mandrel-Based Fiber-Optic Sensors for Acoustic Detection of Partial Discharges—A Proof of Concept. IEEE Trans. Power Deliv. 2010, 25, 2526–2534. [Google Scholar] [CrossRef]
- Zheng, Q.; Ma, G.; Jiang, J.; Li, C.; Zhan, H. A comparative study on partial discharge ultrasonic detection using fiber Bragg grating sensor and piezoelectric transducer. In Proceedings of the 2015 IEEE Conference on Electrical Insulation and Dielectric Phenomena (CEIDP), Ann Arbor, MI, USA, 18–21 October 2015; pp. 282–285. [Google Scholar]
- Ghorat, M.; Gharehpetian, G.B.; Latifi, H.; Hejazi, M.A.; Layeghi, A. Partial discharge acoustic emission detector using mandrel-connected fiber Bragg grating sensor. Opt. Eng. 2018, 57, 074107. [Google Scholar] [CrossRef]
- Kung, P.; Wang, L.; Pan, S.; Comanici, M.I. Adapting the FBG cavity sensor structure to monitor and diagnose PD in large power transformer. In Proceedings of the IEEE Electrical Insulation Conference (EIC), Ottawa, ON, Canada, 2–5 June 2013; pp. 318–322. [Google Scholar]
- Ma, G.M.; Zhou, H.Y.; Shi, C.; Li, Y.B.; Zhang, Q.; Li, C.R.; Zheng, Q. Distributed Partial Discharge Detection in a Power Transformer Based on Phase-Shifted FBG. IEEE Sens. J. 2018, 18, 2788–2795. [Google Scholar] [CrossRef]
- Ma, G.M.; Zhou, H.Y.; Zhang, M.; Li, C.R.; Yin, Y.; Wu, Y.Y. A High Sensitivity Optical Fiber Sensor for GIS Partial Discharge Detection. IEEE Sens. J. 2019, 19, 9235–9243. [Google Scholar] [CrossRef]
- Ma, G.M.; Li, C.R.; Luo, Y.T.; Mu, R.D.; Wang, L. High sensitive and reliable fiber Bragg grating hydrogen sensor for fault detection of power transformer. Sens. Actuators B 2012, 169, 195–198. [Google Scholar] [CrossRef]
- Fisser, M.; Badcock, R.A.; Teal, P.D.; Swanson, A.; Hunze, A. Development of hydrogen sensors based on fiber Bragg grating with a palladium foil for online dissolved gas analysis in transformers. In Proceedings of the SPIE 10329, Optical Measurement Systems for Industrial Inspection X, 103292P, Munich, Germany, 25–29 June 2017; p. 103292P. [Google Scholar]
- Chen, W.G.; Liu, J.; Wang, Y.Y.; Liang, L.M.; Zhao, J.B.; Yue, Y.F. The Measuring Method for Internal Temperature of Power Transformer Based on FBG Sensors. In Proceedings of the 2008 International Conference on High Voltage Engineering and Application, Chongqing, China, 9–12 November 2008; pp. 672–676. [Google Scholar]
- Ribeiro, A.B.L.; Eira, N.F.; Sousa, J.M.; Guerreiro, P.T.; Salcedo, J.R. Multipoint Fiber-Optic Hot-Spot Sensing Network Integrated Into High Power Transformer for Continuous Monitoring. IEEE Sens. J. 2008, 8, 1264–1267. [Google Scholar] [CrossRef]
- Zhang, X.; Huang, R.; Huang, W.; Yao, S.; Hou, D.; Zheng, M. Real-time temperature monitoring system using FBG sensors on an oil-immersed power transformer. High Voltage Eng. 2014, 40, 253–259. [Google Scholar]
- Jiang, Y.; Liu, S.; Xiao, L.; Li, W. Fiber Bragg grating sensors for temperature monitoring in oil-immersed transformers. In Proceedings of the 2016 15th International Conference on Optical Communications and Networks (ICOCN), Hangzhou, China, 24–27 September 2016; pp. 1–3. [Google Scholar]
- Liu, Y.; Li, L.; Zhao, L.; Wang, J.; Liu, T. Research on a new fiber-optic axial pressure sensor of transformer winding based on fiber Bragg grating. Photonic Sens. 2017, 7, 365–371. [Google Scholar] [CrossRef]
- Kuhn, G.G.; de Morais Sousa, K.; da Silva, J.C.C. Dynamic Strain Analysis of Transformer Iron Core with Fiber Bragg Gratings. In Proceedings of the Advanced Photonics Congress 2018, ETH Zürich, Switzerland, 2–5 July 2018; p. JTu2A-74. [Google Scholar]
- Allil, R.C.d.B.; de Nazaré, F.V.B.; Werneck, M.M. Fiber Bragg Gratings: Theory, Fabrication, and Applications; SPIE Press: Bellingham, WA, USA, 2017; pp. 19–32. [Google Scholar]
- PEEK Datasheet. Available online: www.vick.com.br/datasheets/datasheet-peek.pdf (accessed on 30 October 2019).
- Transformerboard Datasheet. Available online: https://sibel.bg/upl_doc/Brochure_Transformerboard.pdf (accessed on 30 October 2019).
- Li, D.; Ren, L.; Li, H. Mechanical Property and Strain Transferring Mechanism in Optical Fiber Sensors. In Fiber Optic Sensors; Yasin, M., Ed.; IntechOpen: London, UK, 2012; pp. 439–458. [Google Scholar]
- Li, J.; Sun, X.; Huang, L.; Stolov, A. Optical fibers for distributed sensing in harsh environments. In Proceedings of the SPIE Fiber Optic Sensors and Applications XV, Orlando, FL, USA, 17–18 April 2018; p. 106540E. [Google Scholar]
- Rumble, R.J. CRC Handbook of Chemistry and Physics 100th edition. 2019. [Google Scholar]
- Enser, H.; Sell, J.K.; Schatzl-Linder, M.; Strauß, B.; Hilber, W.; Jakoby, B. Hysteresis and Material Effects of Printed Strain Gauges Embedded in Organic Coatings. In Proceedings of the Eurosensors 2017 Conference, Paris, France, 3–6 September 2017; p. 624. [Google Scholar]
- Buzuayene, M. Rise Time vs. Bandwidth and Applications. Interference Technol. Available online: https://interferencetechnology.com/rise-time-vs-bandwidth-and-applications/ (accessed on 30 October 2019).
- Associação Brasileira de Normas Técnicas. ABNT NBR 14274: 2013—Insulating Mineral Oil—Determination of Compatibility of Materials Employed in Electrical Equipment. 2013. [Google Scholar]


| Properties | Unit | TB | PEEK | Fiber |
|---|---|---|---|---|
| Density | Kg/m³ | 1250 | 1320 | 2200 [23] |
| Tensile strength | MPa | 97 | 92 | 3500 [23] |
| Maximum Temperature | °C | 105 | 250 | 300 * [24] |
| Dielectric strength | kV/mm | 14.5 (in oil) | 20 | 47–67 [25] |
| Dimensions (mm) | TB | PEEK |
|---|---|---|
| Ddisk | 31 | 31 |
| hdisk | 8.8 | 8.8 |
| hblock | 19 | 17.4 |
| helipse | 11 | 7 |
| h1 | 4.2 | 6.4 |
| Delipse | 22 | 22 |
| wblock | 50 | 50 |
| Dblock | 50 | 50 |
| Height (cm) | Impact Time (ms) | Calculated Force (N) |
|---|---|---|
| 10 | 10.8 | 155.6 |
| 20 | 7.7 | 309.9 |
| 30 | 5.4 | 538.9 |
| 40 | 4.6 | 730.4 |
| 50 | 3.7 | 1024.5 |
© 2019 by the authors. Licensee MDPI, Basel, Switzerland. This article is an open access article distributed under the terms and conditions of the Creative Commons Attribution (CC BY) license (http://creativecommons.org/licenses/by/4.0/).
Share and Cite
de Melo, A.G.; Benetti, D.; de Lacerda, L.A.; Peres, R.; Floridia, C.; Silva, A.d.A.; Rosolem, J.B. Static and Dynamic Evaluation of a Winding Deformation FBG Sensor for Power Transformer Applications. Sensors 2019, 19, 4877. https://doi.org/10.3390/s19224877
de Melo AG, Benetti D, de Lacerda LA, Peres R, Floridia C, Silva AdA, Rosolem JB. Static and Dynamic Evaluation of a Winding Deformation FBG Sensor for Power Transformer Applications. Sensors. 2019; 19(22):4877. https://doi.org/10.3390/s19224877
Chicago/Turabian Stylede Melo, Aguinaldo Goes, Daniel Benetti, Luiz Alkimin de Lacerda, Rodrigo Peres, Claudio Floridia, Artur de Araujo Silva, and Joao Batista Rosolem. 2019. "Static and Dynamic Evaluation of a Winding Deformation FBG Sensor for Power Transformer Applications" Sensors 19, no. 22: 4877. https://doi.org/10.3390/s19224877
APA Stylede Melo, A. G., Benetti, D., de Lacerda, L. A., Peres, R., Floridia, C., Silva, A. d. A., & Rosolem, J. B. (2019). Static and Dynamic Evaluation of a Winding Deformation FBG Sensor for Power Transformer Applications. Sensors, 19(22), 4877. https://doi.org/10.3390/s19224877