Voltammetric Electronic Tongues in Food Analysis
Abstract
:1. Introduction
2. Characterization, Classification and Authentication of Food Products
3. Determination of Chemical Species and Other Quantitative Parameters Related to Food Analysis
4. Conclusions
Author Contributions
Funding
Conflicts of Interest
References
- Persaud, K.C.; Dodd, G. Analysis of discrimination mechanisms in the mammalian olfactory system using a model nose. Nature 1982, 299, 352–355. [Google Scholar] [CrossRef] [PubMed]
- Otto, M.; Thomas, J.D.R. Model studies on multiple channel analysis of free magnesium, calcium, sodium, and potassium at physiological concentration levels with ion-selective electrodes. Anal. Chem. 1985, 57, 2647–2651. [Google Scholar] [CrossRef]
- Gardner, J.W.; Bartlett, P.N. A brief history of electronic noses. Sens. Actuators B Chem. 1994, 18, 210–211. [Google Scholar] [CrossRef]
- Vlasov, Y.; Legin, A. Non-selective chemical sensors in analytical chemistry: From “electronic nose” to “electronic tongue”. Fresenius J. Anal. Chem. 1998, 361, 255–260. [Google Scholar] [CrossRef]
- Ciosek, P.; Wróblewski, W. Sensor arrays for liquid sensing–electronic tongue systems. Analyst 2007, 132, 963–978. [Google Scholar] [CrossRef] [PubMed]
- del Valle, M. Electronic tongues employing electrochemical sensors. Electroanalysis 2010, 22, 1539–1555. [Google Scholar] [CrossRef]
- Krantz-Rülcker, C.; Stenberg, M.; Winquist, F.; Lundström, I. Electronic tongues for environmental monitoring based on sensor arrays and pattern recognition: A review. Anal. Chim. Acta 2001, 426, 217–226. [Google Scholar] [CrossRef]
- Woertz, K.; Tissen, C.; Kleinebudde, P.; Breitkreutz, J. Taste sensing systems (electronic tongues) for pharmaceutical applications. Int. J. Pharm. 2011, 417, 256–271. [Google Scholar] [CrossRef] [PubMed]
- Rudnitskaya, A.; Legin, A. Sensor systems, electronic tongues and electronic noses, for the monitoring of biotechnological processes. J. Ind. Microbiol. Biotechnol. 2008, 35, 443–451. [Google Scholar] [CrossRef] [PubMed]
- Deisingh, A.K.; Stone, D.C.; Thompson, M. Applications of electronic noses and tongues in food analysis. Int. J. Food Sci. Technol. 2004, 39, 587–604. [Google Scholar] [CrossRef]
- Escuder-Gilabert, L.; Peris, M. Highlights in recent applications of electronic tongues in food analysis. Anal. Chim. Acta 2010, 665, 15–25. [Google Scholar] [CrossRef] [PubMed]
- Ciosek, P.; Wróblewski, W. Potentiometric electronic tongues for foodstuff and biosample recognition—An overview. Sensors 2011, 11, 4688–4701. [Google Scholar] [CrossRef] [PubMed]
- Peris, M.; Escuder-Gilabert, L. Electronic noses and tongues to assess food authenticity and adulteration. Trends Food Sci. Technol. 2016, 58, 40–54. [Google Scholar] [CrossRef] [Green Version]
- Winquist, F.; Wide, P.; Lundström, I. An electronic tongue based on voltammetry. Anal. Chim. Acta 1997, 357, 21–31. [Google Scholar] [CrossRef]
- Wei, Z.; Wang, J.; Zhang, X. Monitoring of quality and storage time of unsealed pasteurized milk by voltammetric electronic tongue. Electrochim. Acta 2013, 88, 231–239. [Google Scholar] [CrossRef]
- Parra, V.; Arrieta, A.A.; Fernández-Escudero, J.A.; Rodríguez-Méndez, M.L.; De Saja, J.A. Electronic tongue based on chemically modified electrodes and voltammetry for the detection of adulterations in wines. Sens. Actuators B Chem. 2006, 118, 448–453. [Google Scholar] [CrossRef]
- Cetó, X.; Capdevila, J.; Puig-Pujol, A.; del Valle, M. Cava wine authentication employing a voltammetric electronic tongue. Electroanalysis 2014, 26, 1504–1512. [Google Scholar] [CrossRef]
- de Sá, A.C.; Cipri, A.; González-Calabuig, A.; Stradiotto, N.R.; del Valle, M. Resolution of galactose, glucose, xylose and mannose in sugarcane bagasse employing a voltammetric electronic tongue formed by metals oxy-hydroxide/MWCNT modified electrodes. Sens. Actuators B Chem. 2016, 222, 645–653. [Google Scholar] [CrossRef] [Green Version]
- Pérez-Ràfols, C.; Puy-Llovera, J.; Serrano, N.; Ariño, C.; Esteban, M.; Díaz-Cruz, J.M. A new multivariate standard addition strategy for stripping voltammetric electronic tongues: Application to the determination of Tl(I) and In(III) in samples with complex matrices. Talanta 2019, 192, 147–153. [Google Scholar] [CrossRef]
- Esbensen, K.H.; Guyot, D.; Westad, F. Multivariate Data Analysis in Practice: An Introduction to Multivariate Data Analysis and Experimental Design, 4th ed.; Camo: Oslo, Norway, 2000. [Google Scholar]
- Brown, S.D.; Tauler, R.; Walczak, B. Comprehensive Chemometrics: Chemical and Biochemical Data Analysis; Elsevier: Amsterdam, The Netherlands, 2009. [Google Scholar]
- Esteban, M.; Ariño, C.; Díaz-Cruz, J.M. Chemometrics for the analysis of voltammetric data. Trends Anal. Chem. 2006, 25, 86–92. [Google Scholar] [CrossRef]
- Oliveri, P.; Casolino, M.C.; Forina, M. Chemometric brains for artificial tongues. Adv. Food Nutr. Res. 2010, 61, 57–117. [Google Scholar] [CrossRef] [PubMed]
- Cetó, X.; Céspedes, F.; del Valle, M. Comparison of methods for the processing of voltammetric electronic tongues data. Microchim. Acta 2013, 180, 319–330. [Google Scholar] [CrossRef]
- Despagne, F.; Massart, D.L. Neural networks in multivariate calibration. Analyst 1998, 123, 157R–178R. [Google Scholar] [CrossRef] [PubMed]
- Burges, C.J. A tutorial on support vector machines for pattern recognition. Data Min. Knowl. Discov. 1998, 2, 121–167. [Google Scholar] [CrossRef]
- Wei, Z.; Yang, Y.; Wang, J.; Zhang, W.; Ren, Q. The measurement principles, working parameters and configurations of voltammetric electronic tongues and its applications for foodstuff analysis. J. Food Eng. 2018, 217, 75–92. [Google Scholar] [CrossRef]
- Winquist, F.; Bjorklund, R.; Krantz-Rülcker, C.; Lundström, I.; Östergren, K.; Skoglund, T. An electronic tongue in the dairy industry. Sens. Actuators B Chem. 2005, 111, 299–304. [Google Scholar] [CrossRef]
- Paixão, T.R.; Bertotti, M. Fabrication of disposable voltammetric electronic tongues by using Prussian Blue films electrodeposited onto CD-R gold surfaces and recognition of milk adulteration. Sens. Actuators B Chem. 2009, 137, 266–273. [Google Scholar] [CrossRef]
- Bueno, L.; de Araujo, W.; Salles, M.; Kussuda, M.; Paixão, T. Voltammetric electronic tongue for discrimination of milk adulterated with urea, formaldehyde and melamine. Chemosensors 2014, 2, 251–266. [Google Scholar] [CrossRef]
- Li, L.A.; Yu, Y.; Yang, J.; Yang, R.; Dong, G.; Jin, T. Voltammetric electronic tongue for the qualitative analysis of milk adulterated with urea combined with multi-way data analysis. Int. J. Electrochem. Sci. 2015, 10, 5970–5980. [Google Scholar]
- Yu, Y.; Zhao, H.; Yang, R.; Dong, G.; Li, L.; Yang, J.; Jin, T.; Zhang, W.; Liu, Y. Pure milk brands classification by means of a voltammetric electronic tongue and multivariate analysis. Int. J. Electrochem. Sci. 2015, 10, 4381–4392. [Google Scholar]
- Wei, Z.; Zhang, W.; Wang, Y.; Wang, J. Monitoring the fermentation, post-ripeness and storage processes of set yogurt using voltammetric electronic tongue. J. Food Eng. 2017, 203, 41–52. [Google Scholar] [CrossRef]
- Wei, Z.; Wang, J.; Jin, W. Evaluation of varieties of set yogurts and their physical properties using a voltammetric electronic tongue based on various potential waveforms. Sens. Actuators B Chem. 2013, 177, 684–694. [Google Scholar] [CrossRef]
- Novakowski, W.; Bertotti, M.; Paixao, T.R. Use of copper and gold electrodes as sensitive elements for fabrication of an electronic tongue: Discrimination of wines and whiskies. Microchem. J. 2011, 99, 145–151. [Google Scholar] [CrossRef]
- Wei, Z.; Wang, J.; Ye, L. Classification and prediction of rice wines with different marked ages by using a voltammetric electronic tongue. Biosens. Bioelectron. 2011, 26, 4767–4773. [Google Scholar] [CrossRef] [PubMed]
- Cetó, X.; Gutiérrez, J.M.; Moreno-Barón, L.; Alegret, S.; del Valle, M. Voltammetric electronic tongue in the analysis of cava wines. Electroanalysis 2011, 23, 72–78. [Google Scholar] [CrossRef]
- Gutiérrez, J.M.; Moreno-Barón, L.; Pividori, M.I.; Alegret, S.; del Valle, M. A voltammetric electronic tongue made of modified epoxy-graphite electrodes for the qualitative analysis of wine. Microchim. Acta 2010, 169, 261–268. [Google Scholar] [CrossRef]
- Cetó, X.; González-Calabuig, A.; Capdevila, J.; Puig-Pujol, A.; del Valle, M. Instrumental measurement of wine sensory descriptors using a voltammetric electronic tongue. Sens. Actuators B Chem. 2015, 207, 1053–1059. [Google Scholar] [CrossRef] [Green Version]
- Apetrei, C.; Apetrei, I.M.; Nevares, I.; Del Alamo, M.; Parra, V.; Rodríguez-Méndez, M.L.; De Saja, J.A. Using an e-tongue based on voltammetric electrodes to discriminate among red wines aged in oak barrels or aged using alternative methods: Correlation between electrochemical signals and analytical parameters. Electrochim. Acta 2007, 52, 2588–2594. [Google Scholar] [CrossRef]
- Wang, J.; Zhu, L.; Zhang, W.; Wei, Z. Application of the voltammetric electronic tongue based on nanocomposite modified electrodes for identifying rice wines of different geographical origins. Anal. Chim. Acta 2019, 1050, 60–70. [Google Scholar] [CrossRef]
- Cetó, X.; Llobet, M.; Marco, J.; del Valle, M. Application of an electronic tongue towards the analysis of brandies. Anal. Methods 2015, 5, 1120–1129. [Google Scholar] [CrossRef]
- Śliwińska, M.; Garcia-Hernandez, C.; Kościński, M.; Dymerski, T.; Wardencki, W.; Namieśnik, J.; Śliwińska-Bartkowiak, M.; Jurga, S.; Garcia-Cabezon, C.; Rodriguez-Mendez, M. Discrimination of apple liqueurs (nalewka) using a voltammetric electronic tongue, UV-Vis and Raman spectroscopy. Sensors 2016, 16, 1654. [Google Scholar] [CrossRef] [PubMed]
- Campos, I.; Bataller, R.; Armero, R.; Gandia, J.M.; Soto, J.; Martínez-Máñez, R.; Gil-Sánchez, L. Monitoring grape ripeness using a voltammetric electronic tongue. Food Res. Int. 2013, 54, 1369–1375. [Google Scholar] [CrossRef]
- Pigani, L.; Simone, G.V.; Foca, G.; Ulrici, A.; Masino, F.; Cubillana-Aguilera, L.; Calvini, R.; Seeber, R. Prediction of parameters related to grape ripening by multivariate calibration of voltammetric signals acquired by an electronic tongue. Talanta 2018, 178, 178–187. [Google Scholar] [CrossRef] [PubMed]
- Ghasemi-Varnamkhasti, M.; Rodríguez-Méndez, M.L.; Mohtasebi, S.S.; Apetrei, C.; Lozano, J.; Ahmadi, H.; Razavi, S.H.; de Saja, J.A. Monitoring the aging of beers using a bioelectronic tongue. Food Control 2012, 25, 216–224. [Google Scholar] [CrossRef]
- Cetó, X.; Gutiérrez, J.M.; Mimendia, A.; Céspedes, F.; del Valle, M. Voltammetric electronic tongue for the qualitative analysis of beers. Electroanalysis 2013, 25, 1635–1644. [Google Scholar] [CrossRef]
- Blanco, C.A.; De la Fuente, R.; Caballero, I.; Rodríguez-Méndez, M.L. Beer discrimination using a portable electronic tongue based on screen-printed electrodes. J. Food Eng. 2015, 157, 57–62. [Google Scholar] [CrossRef]
- Domínguez, R.B.; Moreno-Barón, L.; Muñoz, R.; Gutiérrez, J.M. Voltammetric electronic tongue and support vector machines for identification of selected features in Mexican coffee. Sensors 2014, 14, 17770–17785. [Google Scholar] [CrossRef]
- Lopetcharat, K.; Kulapichitr, F.; Suppavorasatit, I.; Chodjarusawad, T.; Phatthara-aneksin, A.; Pratontep, S.; Borompichaichartkul, C. Relationship between overall difference decision and electronic tongue: Discrimination of civet coffee. J. Food Eng. 2016, 180, 60–68. [Google Scholar] [CrossRef]
- Ivarsson, P.; Holmin, S.; Höjer, N.E.; Krantz-Rülcker, C.; Winquist, F. Discrimination of tea by means of a voltammetric electronic tongue and different applied waveforms. Sens. Actuators B Chem. 2001, 76, 449–454. [Google Scholar] [CrossRef]
- Palit, M.; Tudu, B.; Dutta, P.K.; Dutta, A.; Jana, A.; Roy, J.K.; Bhattacharyya, N.; Bandyopadhyay, R.; Chatterjee, A. Classification of black tea taste and correlation with tea taster’s mark using voltammetric electronic tongue. IEEE Trans. Instrum. Meas. 2010, 59, 2230–2239. [Google Scholar] [CrossRef]
- Palit, M.; Tudu, B.; Bhattacharyya, N.; Dutta, A.; Dutta, P.K.; Jana, A.; Bandyopadhyay, R.; Chatterjee, A. Comparison of multivariate preprocessing techniques as applied to electronic tongue based pattern classification for black tea. Anal. Chim. Acta 2010, 675, 8–15. [Google Scholar] [CrossRef] [PubMed]
- Bhattacharyya, R.; Tudu, B.; Das, S.C.; Bhattacharyya, N.; Bandyopadhyay, R.; Pramanik, P. Classification of black tea liquor using cyclic voltammetry. J. Food Eng. 2012, 109, 120–126. [Google Scholar] [CrossRef]
- Liu, N.; Liang, Y.; Bin, J.; Zhang, Z.; Huang, J.; Shu, R.; Yang, K. Classification of green and black teas by PCA and SVM analysis of cyclic voltammetric signals from metallic oxide-modified electrode. Food Anal. Methods 2014, 7, 472–480. [Google Scholar] [CrossRef]
- Ghosh, A.; Bag, A.K.; Sharma, P.; Tudu, B.; Sabhapondit, S.; Baruah, B.D.; Tamuly, P.; Bhattacharyya, N.; Bandyopadhyay, R. Monitoring the fermentation process and detection of optimum fermentation time of black tea using an electronic tongue. IEEE Sens. J. 2015, 15, 6255–6262. [Google Scholar] [CrossRef]
- Ghosh, A.; Sharma, P.; Tudu, B.; Sabhapondit, S.; Baruah, B.D.; Tamuly, P.; Bandyopadhyay, R. Detection of optimum fermentation time of black CTC tea using a voltammetric electronic tongue. IEEE Trans. Instrum. Meas. 2015, 64, 2720–2729. [Google Scholar] [CrossRef]
- Wei, Z.; Wang, J. Classification of monofloral honeys by voltammetric electronic tongue with chemometrics method. Electrochim. Acta 2011, 56, 4907–4915. [Google Scholar] [CrossRef]
- Wei, Z.; Wang, J. Tracing floral and geographical origins of honeys by potentiometric and voltammetric electronic tongue. Comput. Electron. Agric. 2014, 108, 112–122. [Google Scholar] [CrossRef]
- Bougrini, M.; Tahri, K.; Saidi, T.; El Hassani, N.E.A.; Bouchikhi, B.; El Bari, N. Classification of honey according to geographical and botanical origins and detection of its adulteration using voltammetric electronic tongue. Food Anal. Methods 2016, 9, 2161–2173. [Google Scholar] [CrossRef]
- El Hassani, N.E.A.; Tahri, K.; Llobet, E.; Bouchikhi, B.; Errachid, A.; Zine, N.; El Bari, N. Emerging approach for analytical characterization and geographical classification of Moroccan and French honeys by means of a voltammetric electronic tongue. Food Chem. 2018, 243, 36–42. [Google Scholar] [CrossRef]
- Oroian, M.; Ropciuc, S. Romanian honey authentication using voltammetric electronic tongue. Correlation of voltammetric data with physico-chemical parameters and phenolic compounds. Comput. Electron. Agric. 2019, 157, 371–379. [Google Scholar] [CrossRef]
- Sobrino-Gregorio, L.; Bataller, R.; Soto, J.; Escriche, I. Monitoring honey adulteration with sugar syrups using an automatic pulse voltammetric electronic tongue. Food Control 2018, 91, 254–260. [Google Scholar] [CrossRef]
- Oroian, M.; Paduret, S.; Ropciuc, S. Honey adulteration detection: Voltammetric e-tongue versus official methods for physicochemical parameter determination. J. Sci. Food Agric. 2018, 98, 4304–4311. [Google Scholar] [CrossRef] [PubMed]
- Apetrei, C. Novel method based on polypyrrole-modified sensors and emulsions for the evaluation of bitterness in extra virgin olive oils. Food Res. Int. 2012, 48, 673–680. [Google Scholar] [CrossRef]
- Bougrini, M.; Tahri, K.; Haddi, Z.; Saidi, T.; El Bari, N.; Bouchikhi, B. Detection of adulteration in argan oil by using an electronic nose and a voltammetric electronic tongue. J. Sens. 2014, 2014, 245831. [Google Scholar] [CrossRef]
- Apetrei, I.M.; Apetrei, C. Detection of virgin olive oil adulteration using a voltammetric e-tongue. Comput. Electron. Agric. 2014, 108, 148–154. [Google Scholar] [CrossRef]
- Tahri, K.; Duarte, A.A.; Carvalho, G.; Ribeiro, P.A.; da Silva, M.G.; Mendes, D.; El Bari, N.; Raposo, M.; Bouchikhi, B. Distinguishment, identification and aroma compound quantification of Portuguese olive oils based on physicochemical attributes, HS-GC/MS analysis and voltammetric electronic tongue. J. Sci. Food Agric. 2018, 98, 681–690. [Google Scholar] [CrossRef]
- Apetrei, I.M.; Apetrei, C. Application of voltammetric e-tongue for the detection of ammonia and putrescine in beef products. Sens. Actuators B Chem. 2016, 234, 371–379. [Google Scholar] [CrossRef]
- Haddi, Z.; El Barbri, N.; Tahri, K.; Bougrini, M.; El Bari, N.; Llobet, E.; Bouchikhi, B. Instrumental assessment of red meat origins and their storage time using electronic sensing systems. Anal. Methods 2015, 7, 5193–5203. [Google Scholar] [CrossRef] [Green Version]
- Ruiz-Rico, M.; Fuentes, A.; Masot, R.; Alcañiz, M.; Fernández-Segovia, I.; Barat, J.M. Use of the voltammetric tongue in fresh cod (Gadus morhua) quality assessment. Innov. Food Sci. Emerg. Technol. 2013, 18, 256–263. [Google Scholar] [CrossRef]
- González-Calabuig, A.; Cetó, X.; del Valle, M. A Voltammetric electronic tongue for the resolution of ternary nitrophenol mixtures. Sensors 2018, 18, 216. [Google Scholar] [CrossRef]
- Pérez-Ràfols, C.; Serrano, N.; Díaz-Cruz, J.M.; Ariño, C.; Esteban, M. A screen-printed voltammetric electronic tongue for the analysis of complex mixtures of metal ions. Sens. Actuators B Chem. 2017, 250, 393–401. [Google Scholar] [CrossRef] [Green Version]
- Bataller, R.; Campos, I.; Laguarda-Miro, N.; Alcañiz, M.; Soto, J.; Martínez-Máñez, R.; Gil, L.; García-Breijo, E.; Ibáñez-Civera, J. Glyphosate detection by means of a voltammetric electronic tongue and discrimination of potential interferents. Sensors 2012, 12, 17553–17568. [Google Scholar] [CrossRef] [PubMed]
- Arrieta, A.A.; Rodríguez-Méndez, M.L.; De Saja, J.A.; Blanco, C.A.; Nimubona, D. Prediction of bitterness and alcoholic strength in beer using an electronic tongue. Food Chem. 2010, 123, 642–646. [Google Scholar] [CrossRef]
- Cetó, X.; Gutiérrez, J.M.; Gutiérrez, M.; Céspedes, F.; Capdevila, J.; Mínguez, S.; Jiménez-Jorquera, C.; del Valle, M. Determination of total polyphenol index in wines employing a voltammetric electronic tongue. Anal. Chim. Acta 2012, 732, 172–179. [Google Scholar] [CrossRef] [PubMed] [Green Version]
- Ghosh, A.; Tudu, B.; Tamuly, P.; Bhattacharyya, N.; Bandyopadhyay, R. Prediction of theaflavin and thearubigin content in black tea using a voltammetric electronic tongue. Chemom. Intell. Lab. Syst. 2012, 116, 57–66. [Google Scholar] [CrossRef]
- Ghosh, A.; Tamuly, P.; Bhattacharyya, N.; Tudu, B.; Gogoi, N.; Bandyopadhyay, R. Estimation of theaflavin content in black tea using electronic tongue. J. Food Eng. 2012, 110, 71–79. [Google Scholar] [CrossRef]
- Wei, Z.; Wang, J. The evaluation of sugar content and firmness of non-climacteric pears based on voltammetric electronic tongue. J. Food Eng. 2013, 117, 158–164. [Google Scholar] [CrossRef]
- Cetó, X.; Apetrei, C.; del Valle, M.; Rodríguez-Méndez, M.L. Evaluation of red wines antioxidant capacity by means of a voltammetric e-tongue with an optimized sensor array. Electrochim. Acta 2014, 120, 180–186. [Google Scholar] [CrossRef]
- Rodriguez-Mendez, M.L.; Apetrei, C.; Gay, M.; Medina-Plaza, C.; de Saja, J.A.; Vidal, S.; Aagaard, O.; Ugliano, M.; Wirth, J.; Cheynier, V. Evaluation of oxygen exposure levels and polyphenolic content of red wines using an electronic panel formed by an electronic nose and an electronic tongue. Food Chem. 2014, 155, 91–97. [Google Scholar] [CrossRef]
- Cetó, X.; Capdevila, J.; Mínguez, S.; del Valle, M. Voltammetric BioElectronic Tongue for the analysis of phenolic compounds in rosé cava wines. Food Res. Int. 2014, 55, 455–461. [Google Scholar] [CrossRef]
- Carbó, N.; López Carrero, J.; Garcia-Castillo, F.J.; Tormos, I.; Olivas, E.; Folch, E.; Alcañiz-Fillol, M.; Soto, J.; Martínez-Máñez, R.; Martínez-Bisbal, M.C. Quantitative Determination of Spring Water Quality Parameters via Electronic Tongue. Sensors 2017, 18, 40. [Google Scholar] [CrossRef] [PubMed]
- Labrador, R.H.; Olsson, J.; Winquist, F.; Martínez-Máñez, R.; Soto, J. Determination of bisulfites in wines with an electronic tongue based on pulse voltammetry. Electroanalysis 2009, 21, 612–617. [Google Scholar] [CrossRef]
- González-Calabuig, A.; del Valle, M. Voltammetric electronic tongue to identify Brett character in wines. On-site quantification of its ethylphenol metabolites. Talanta 2018, 179, 70–74. [Google Scholar] [CrossRef] [PubMed]
- Campos, I.; Masot, R.; Alcaniz, M.; Gil, L.; Soto, J.; Vivancos, J.L.; García-Breijo, E.; Labrador, R.H.; Barat, J.M.; Martínez-Mañez, R. Accurate concentration determination of anions nitrate, nitrite and chloride in minced meat using a voltammetric electronic tongue. Sens. Actuators B Chem. 2010, 149, 71–78. [Google Scholar] [CrossRef]
- Rodríguez-Méndez, M.L.; Apetrei, C.; De Saja, J.A. Evaluation of the polyphenolic content of extra virgin olive oils using an array of voltammetric sensors. Electrochim. Acta 2008, 53, 5867–5872. [Google Scholar] [CrossRef]
- Apetrei, I.M.; Apetrei, C. Voltammetric e-tongue for the quantification of total polyphenol content in olive oils. Food Res. Int. 2013, 54, 2075–2082. [Google Scholar] [CrossRef]
- Wei, Z.; Wang, J. Detection of antibiotic residues in bovine milk by a voltammetric electronic tongue system. Anal Chim. Acta 2011, 694, 46–56. [Google Scholar] [CrossRef]
- Baldeón, E.O.; Alcañiz, M.; Masot, R.; Fuentes, E.M.; Barat, J.M.; Grau, R. Voltammetry pulse array developed to determine the antioxidant activity of camu–camu (Myrciaria dubia (HBK) McVaug) and tumbo (Passiflora mollisima (Kunth) LH Bailey) juices employing voltammetric electronic tongues. Food Control 2015, 54, 181–187. [Google Scholar] [CrossRef]
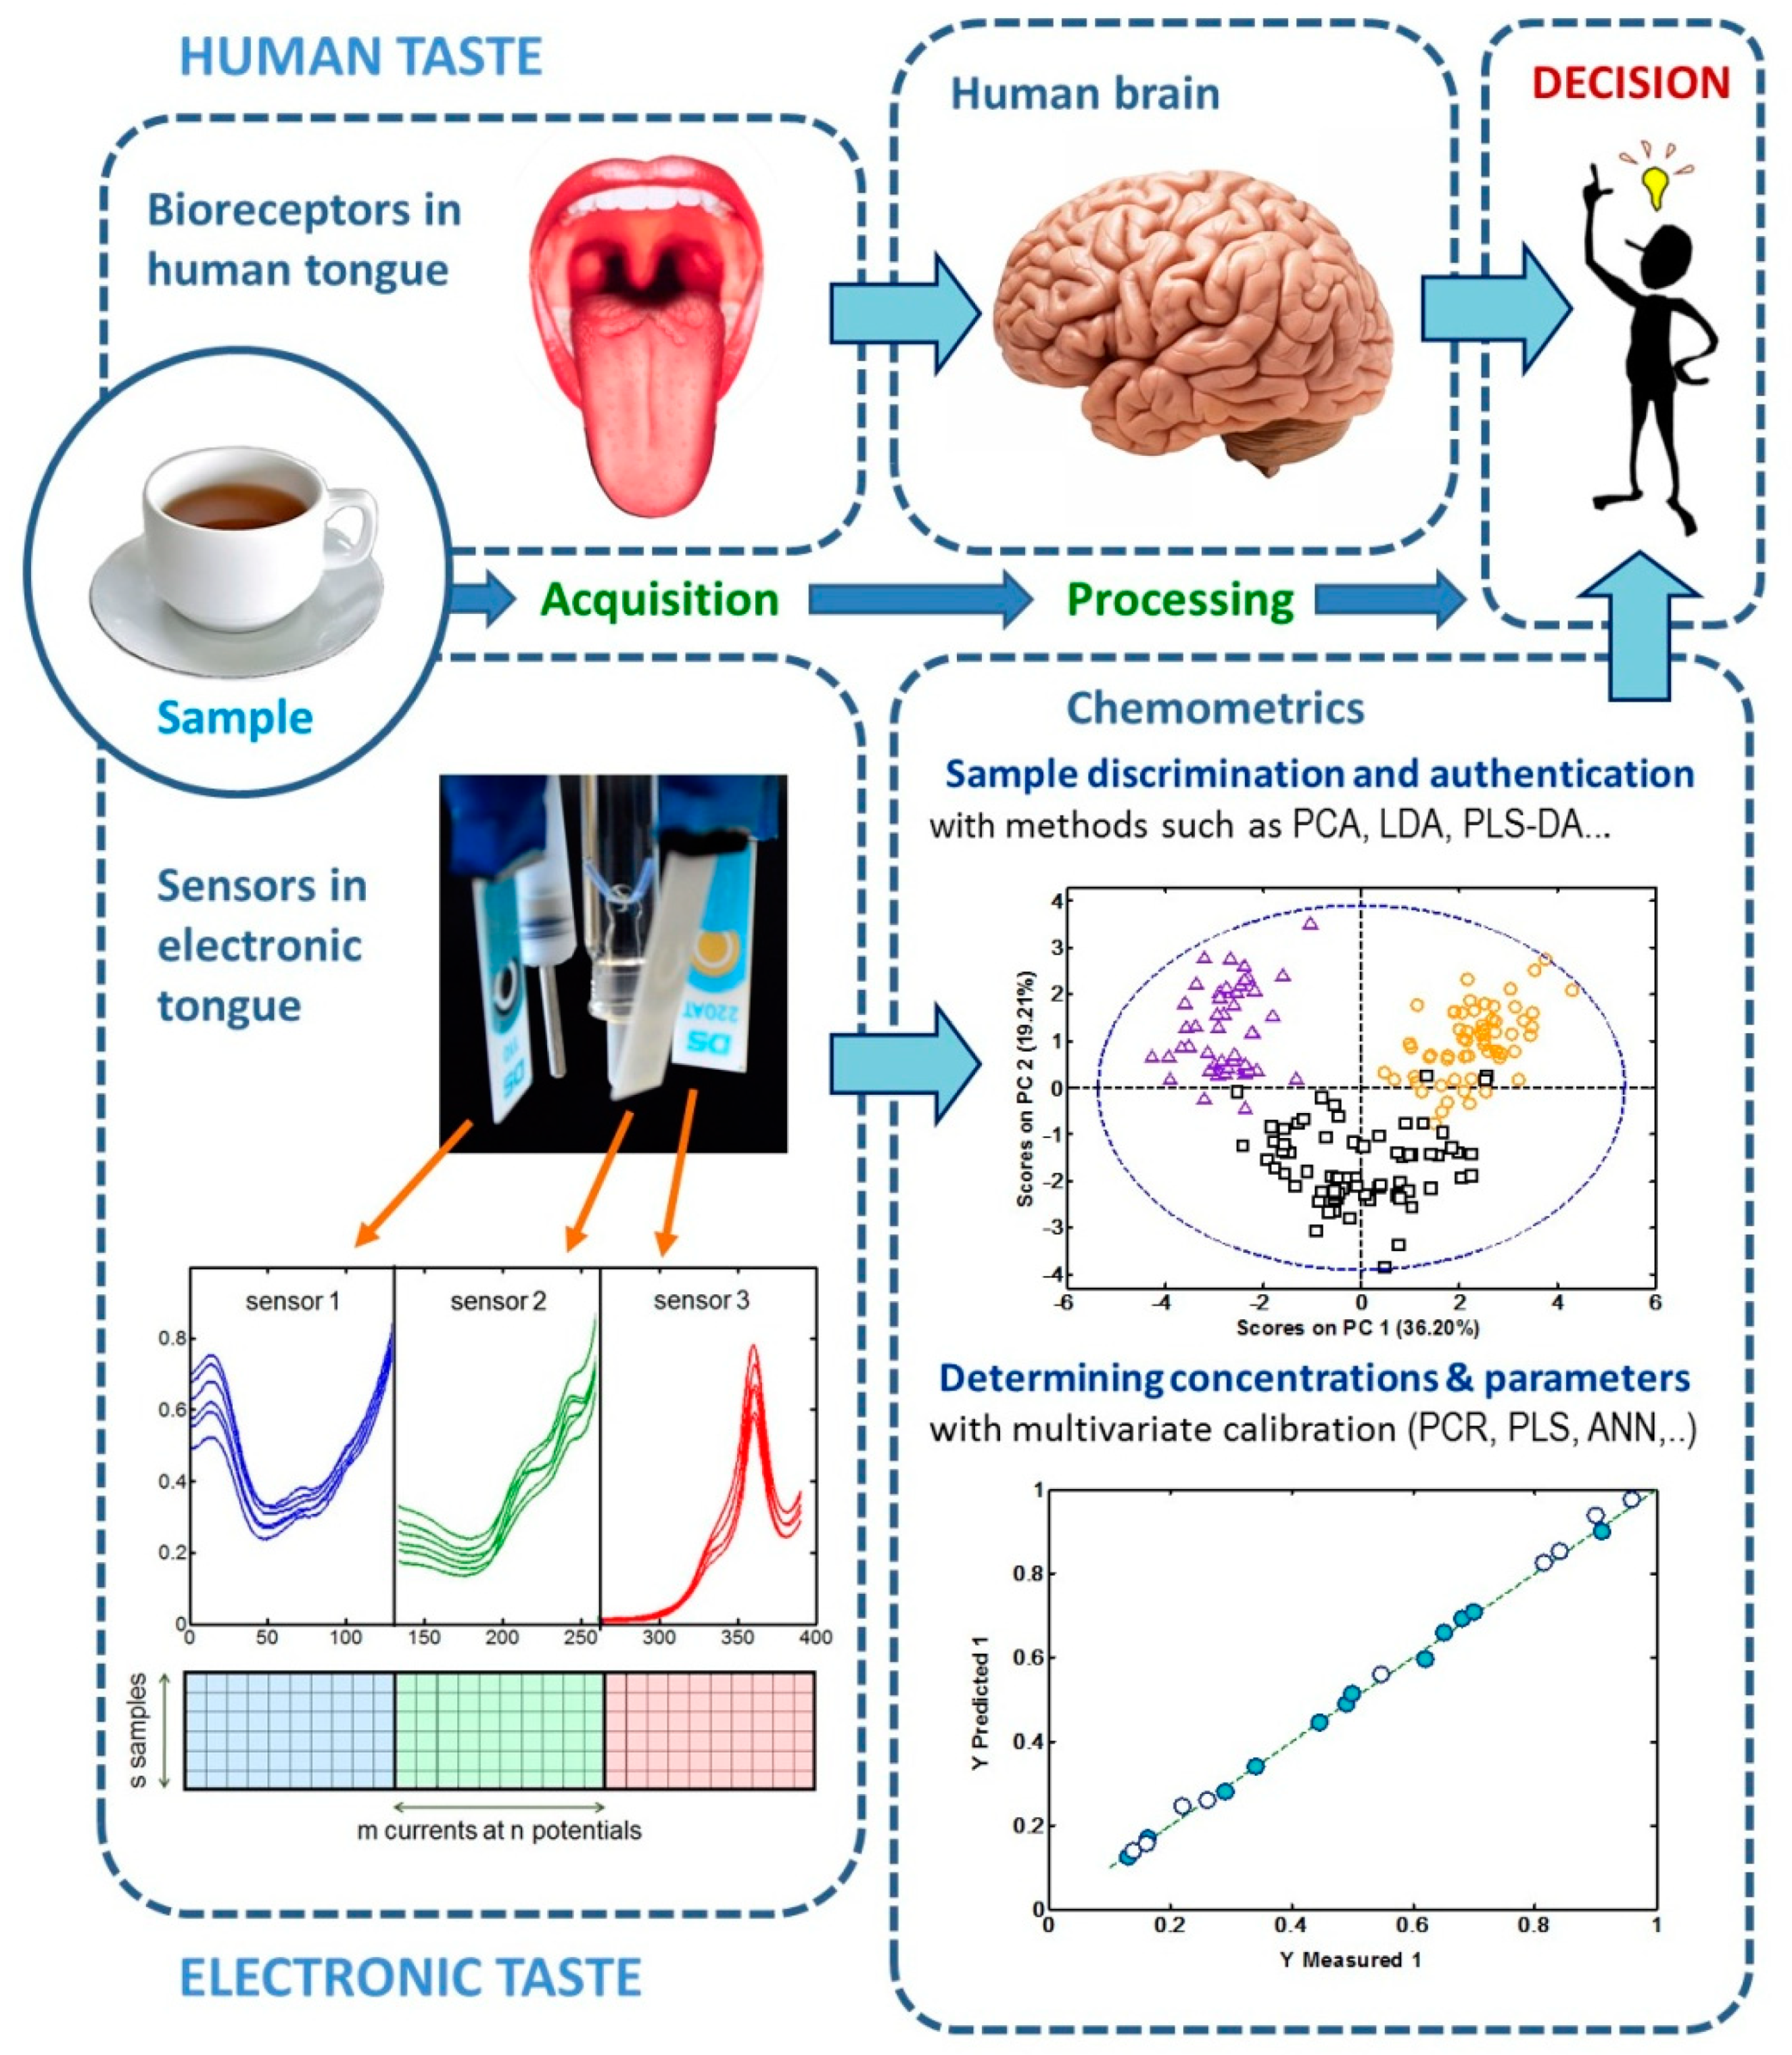

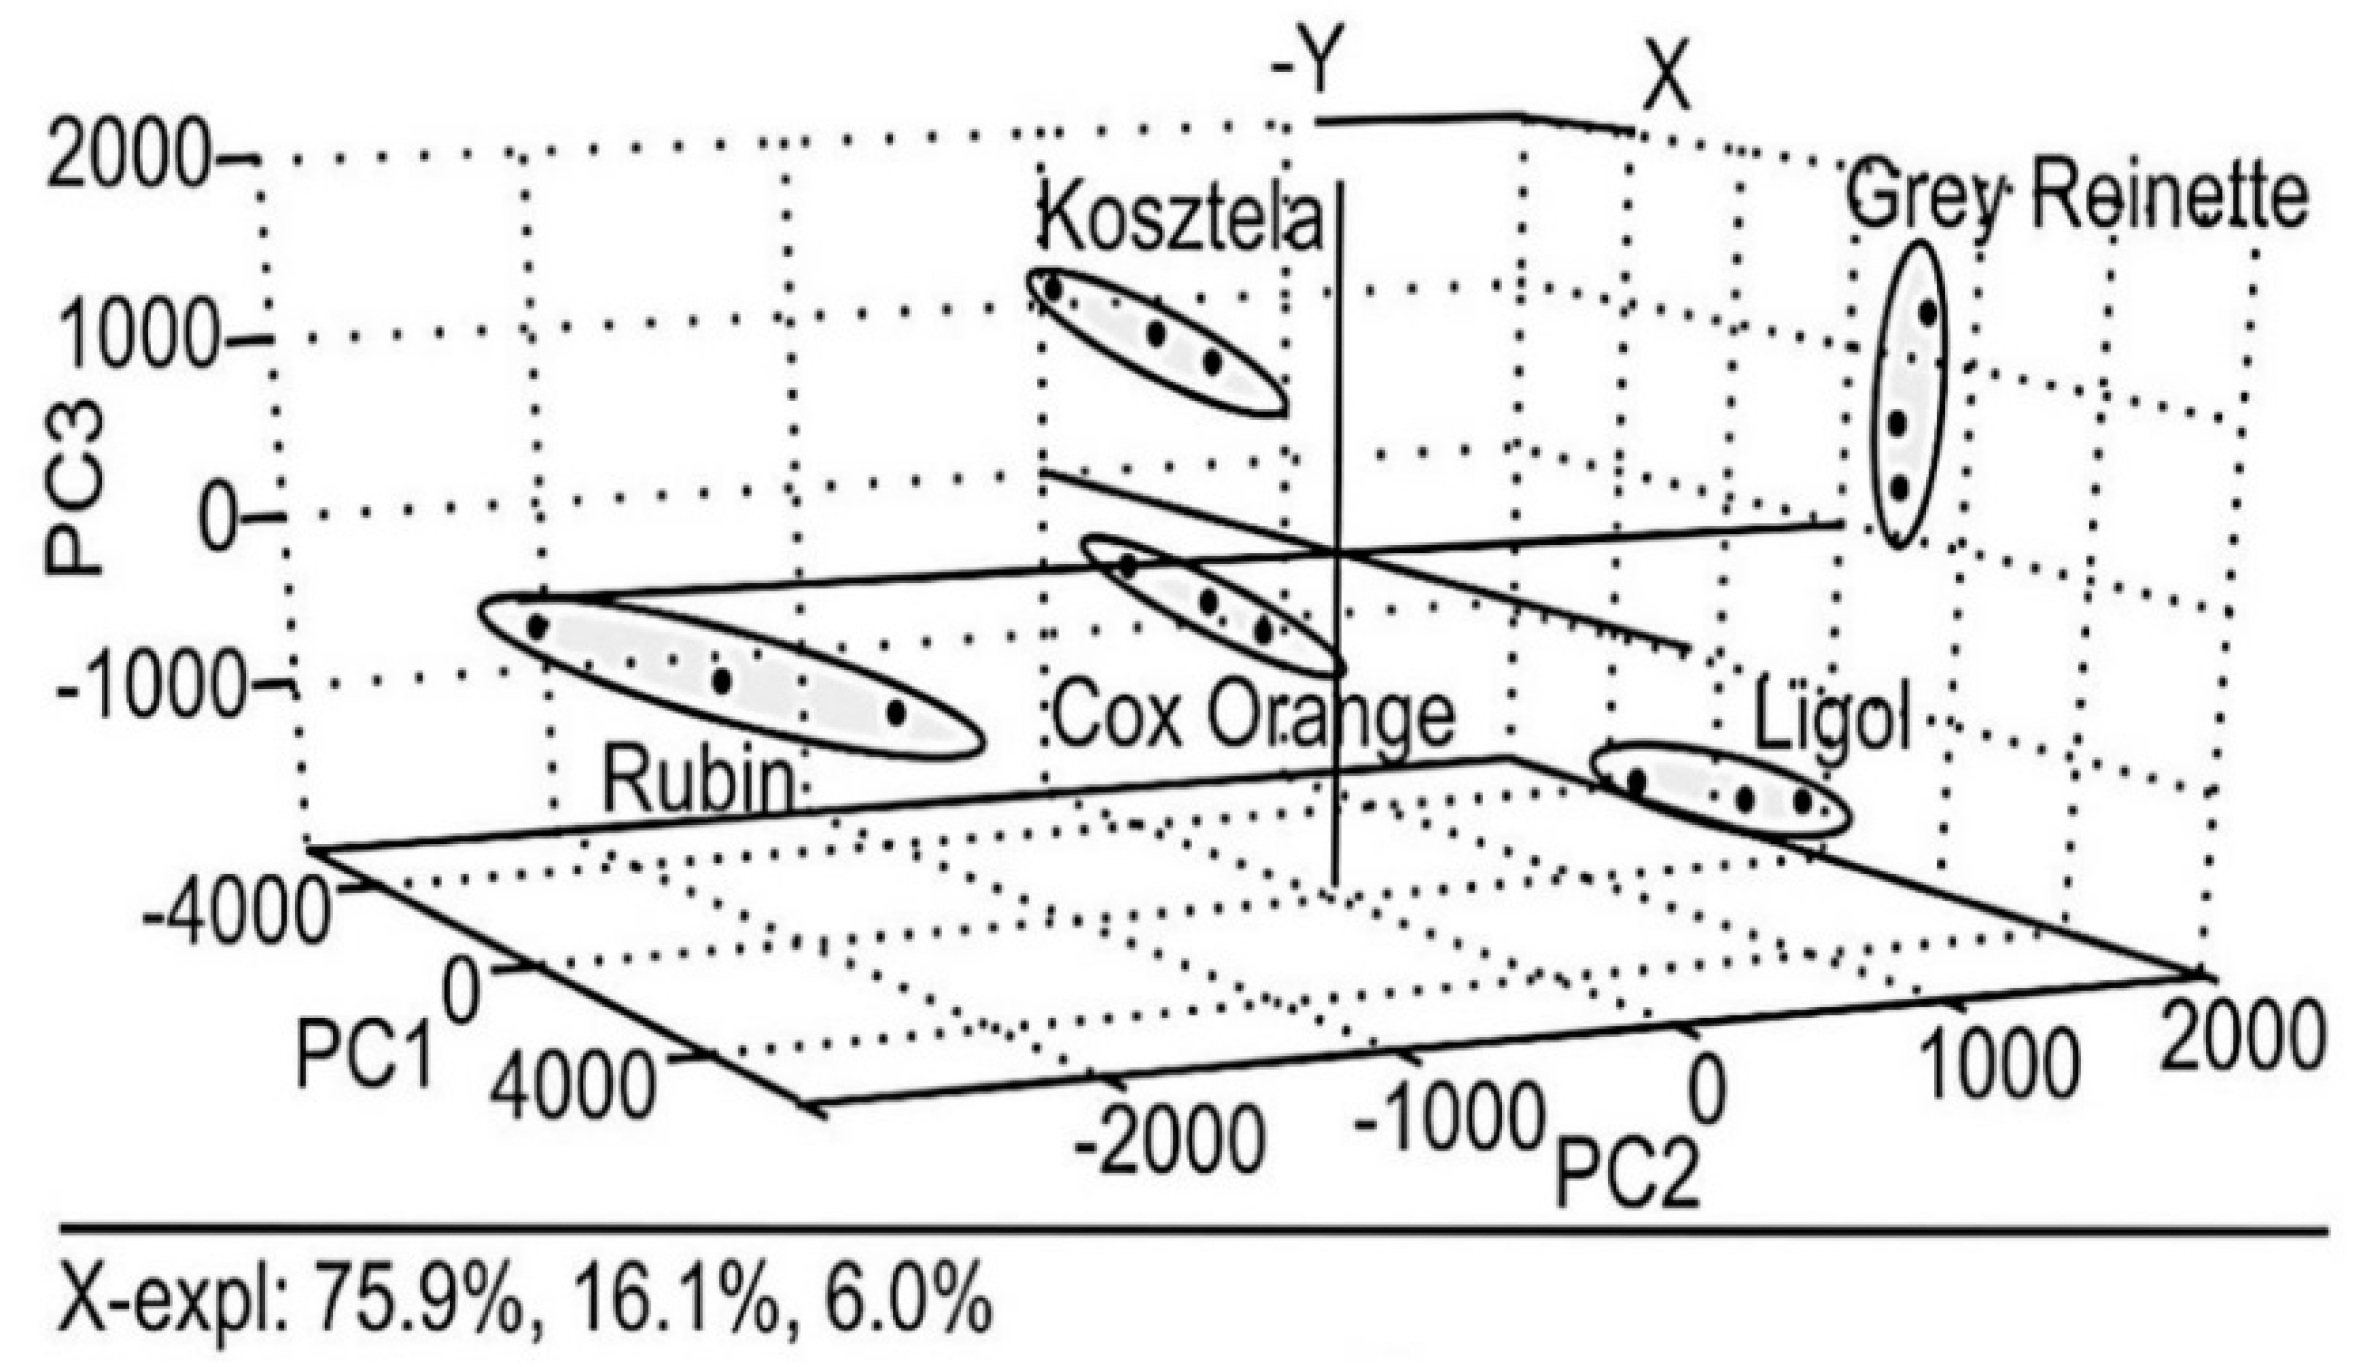
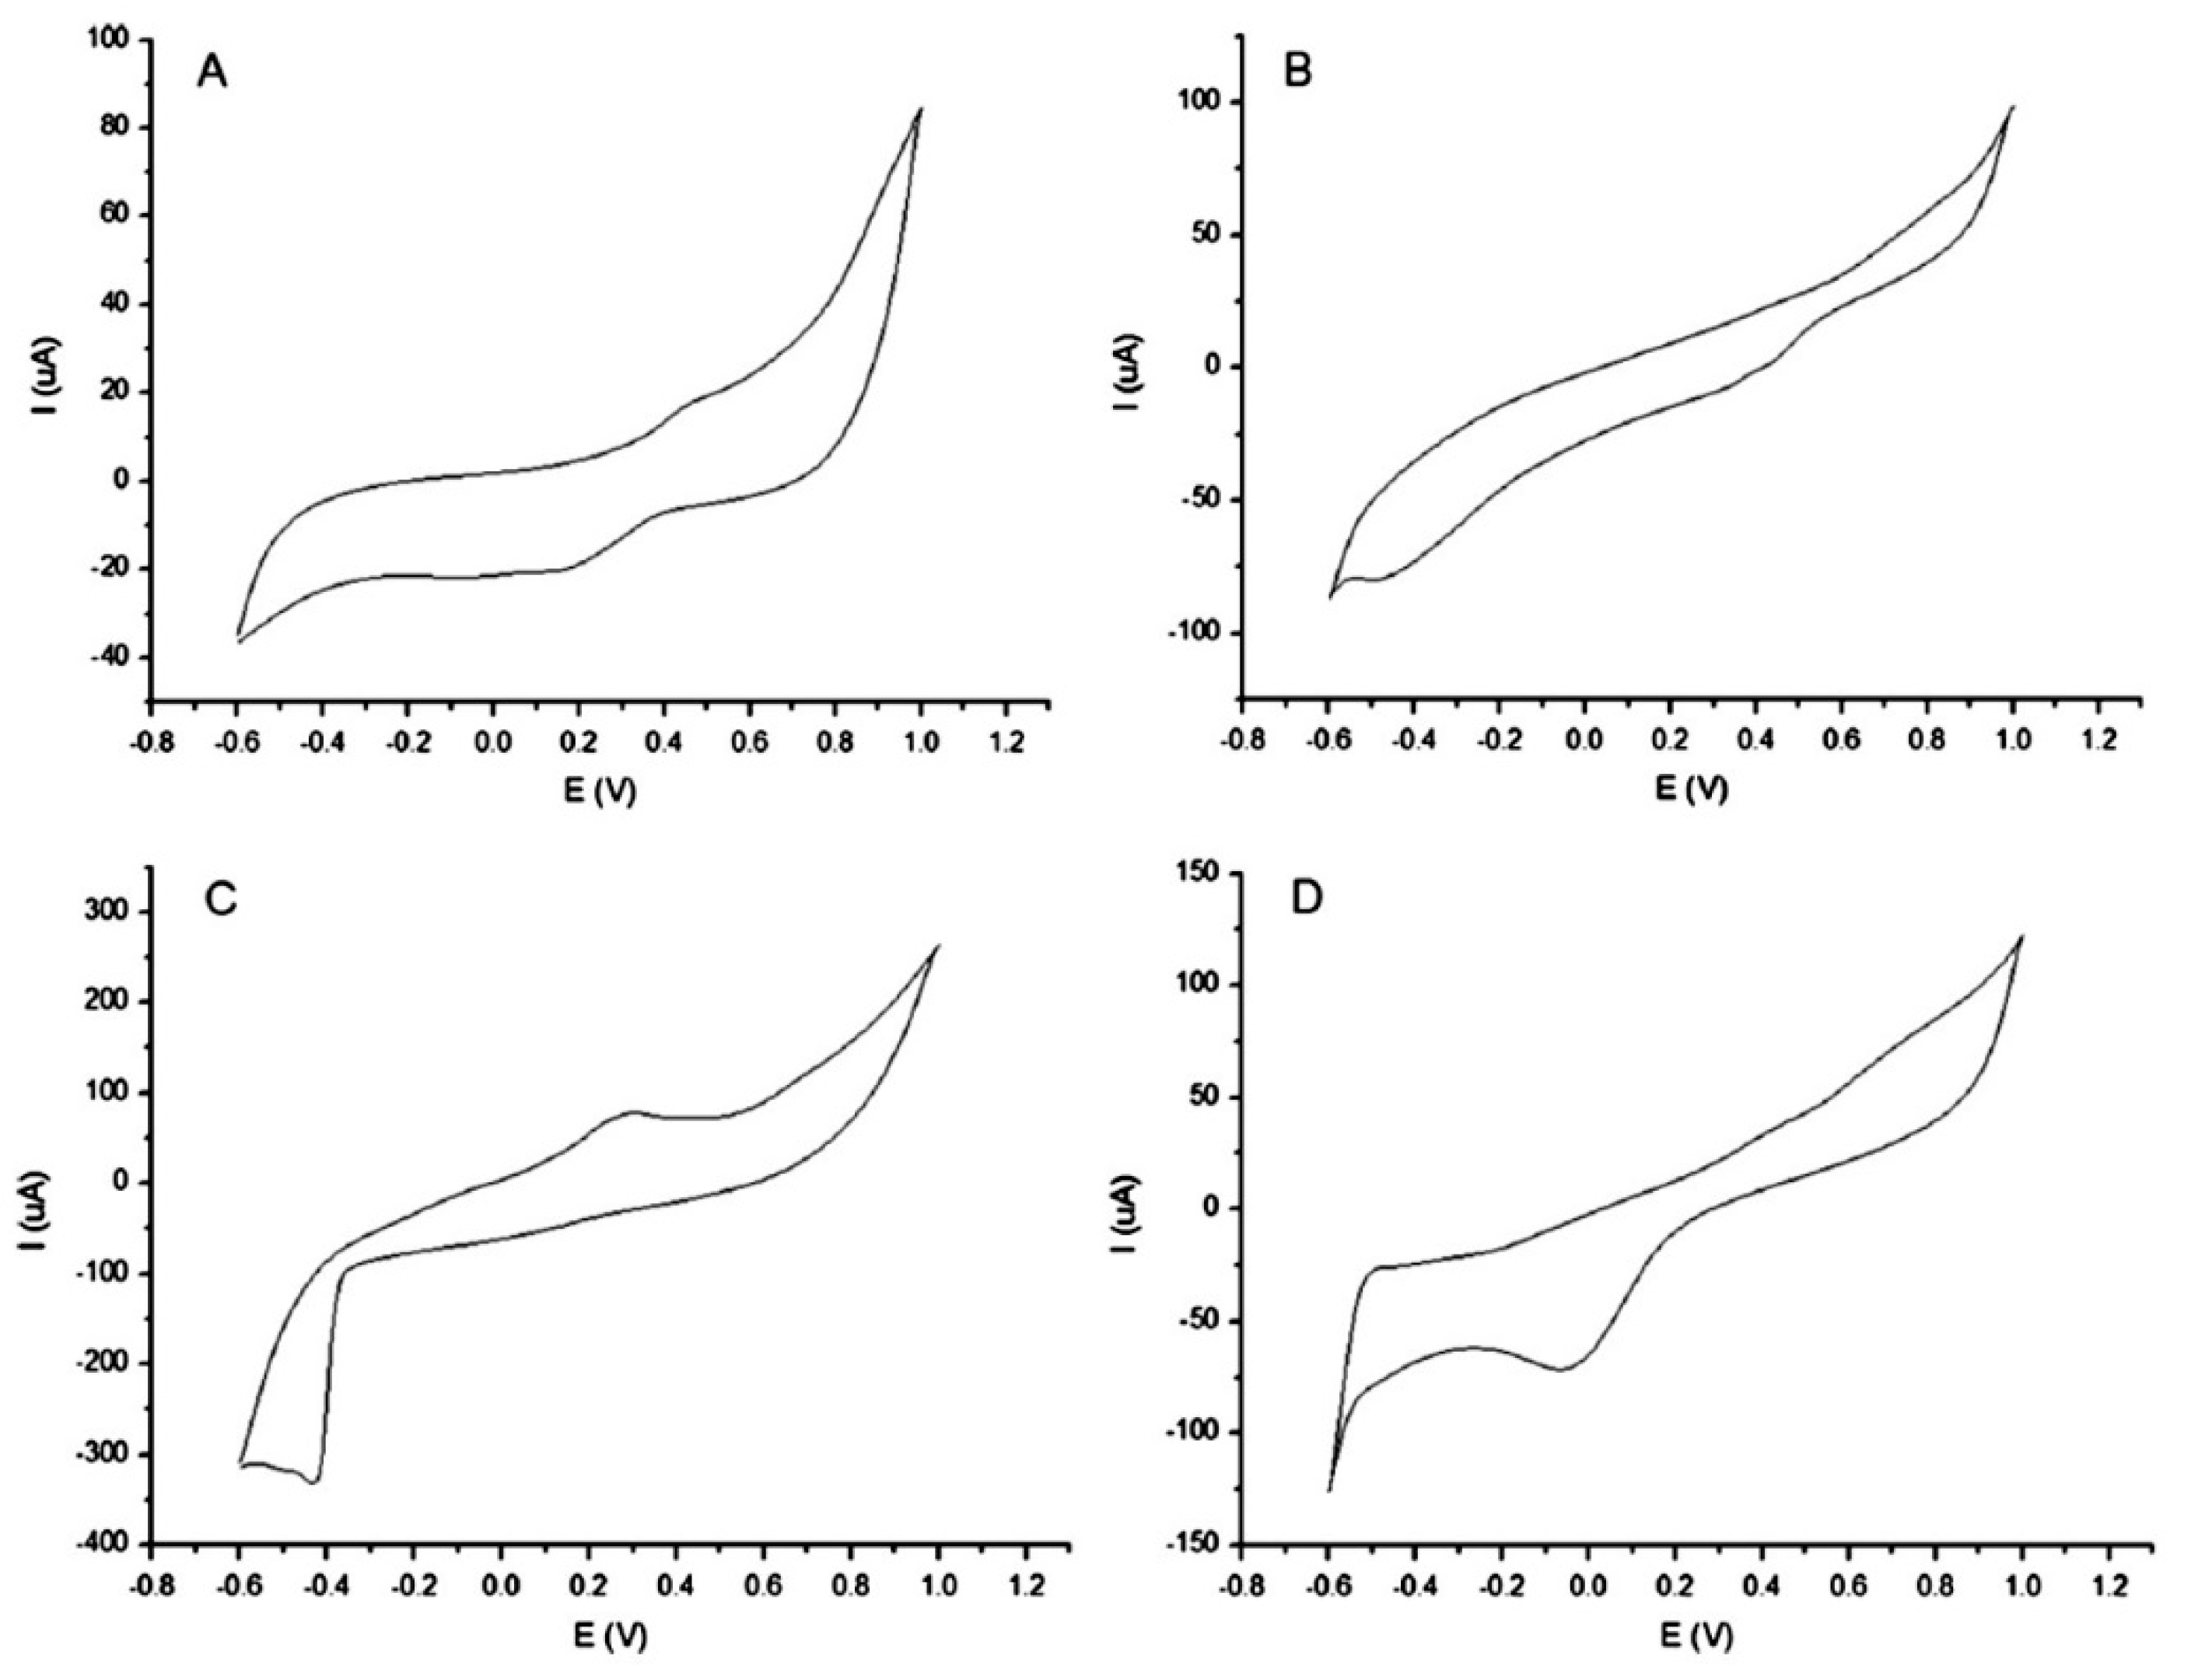
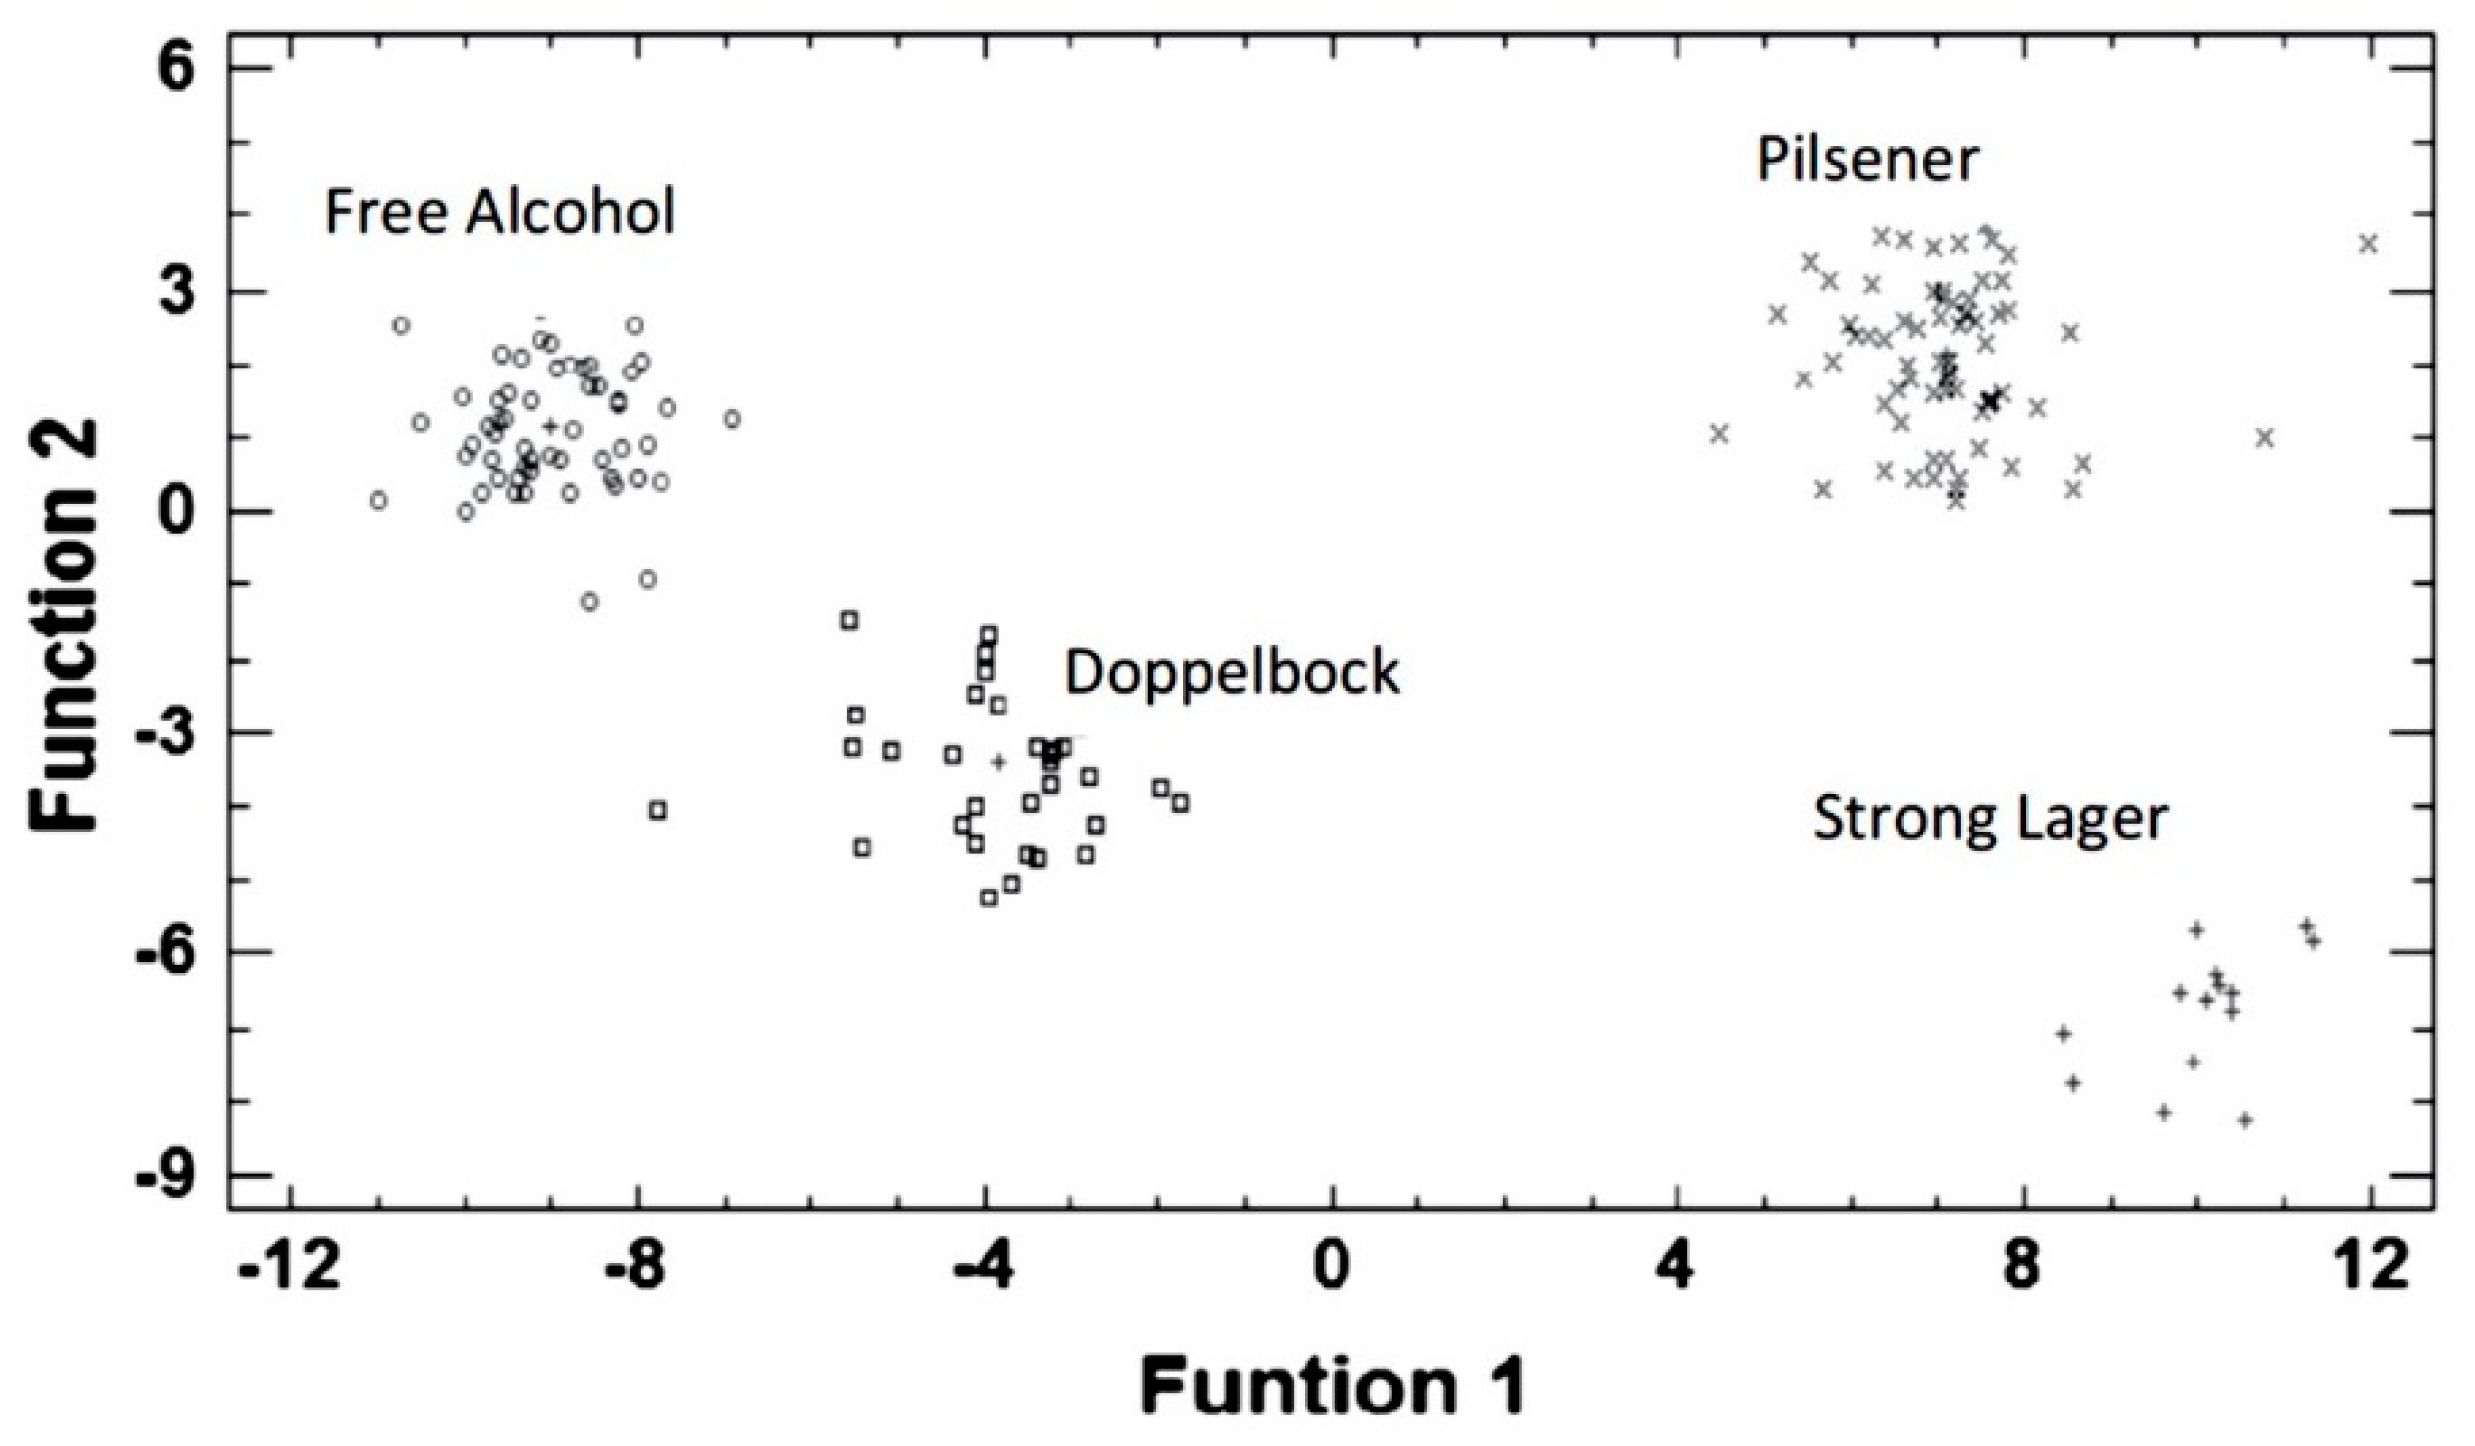
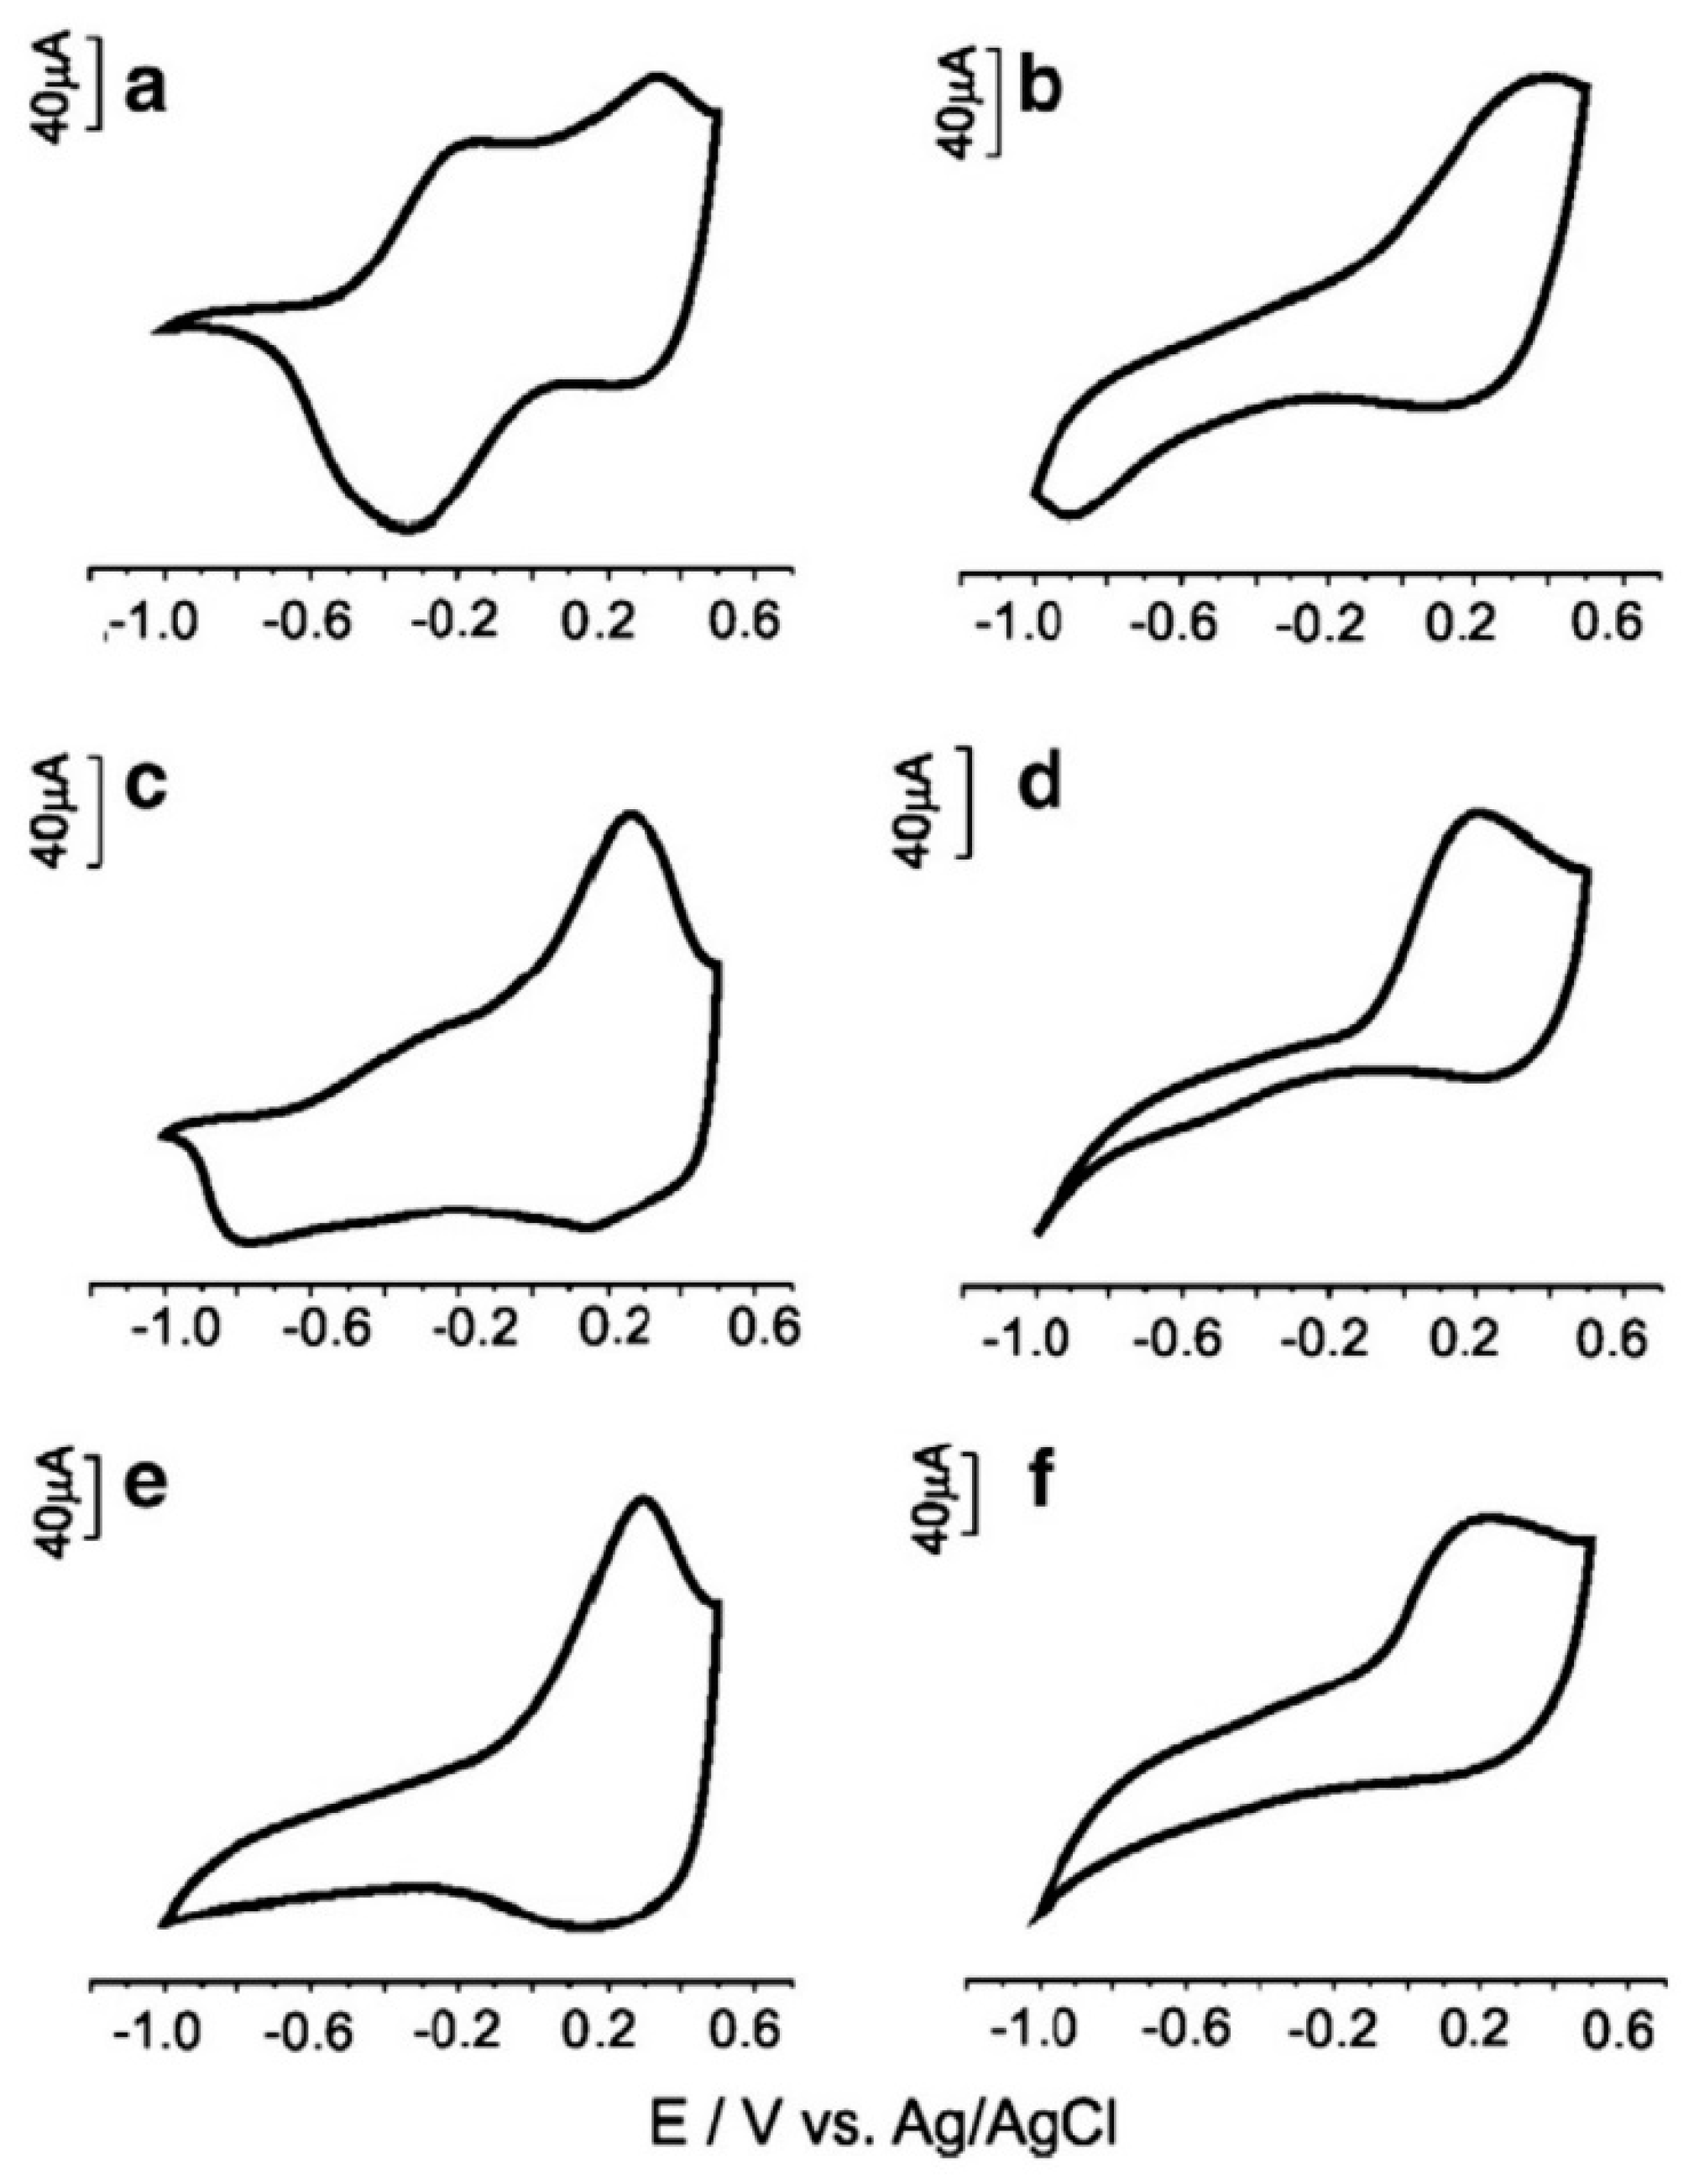

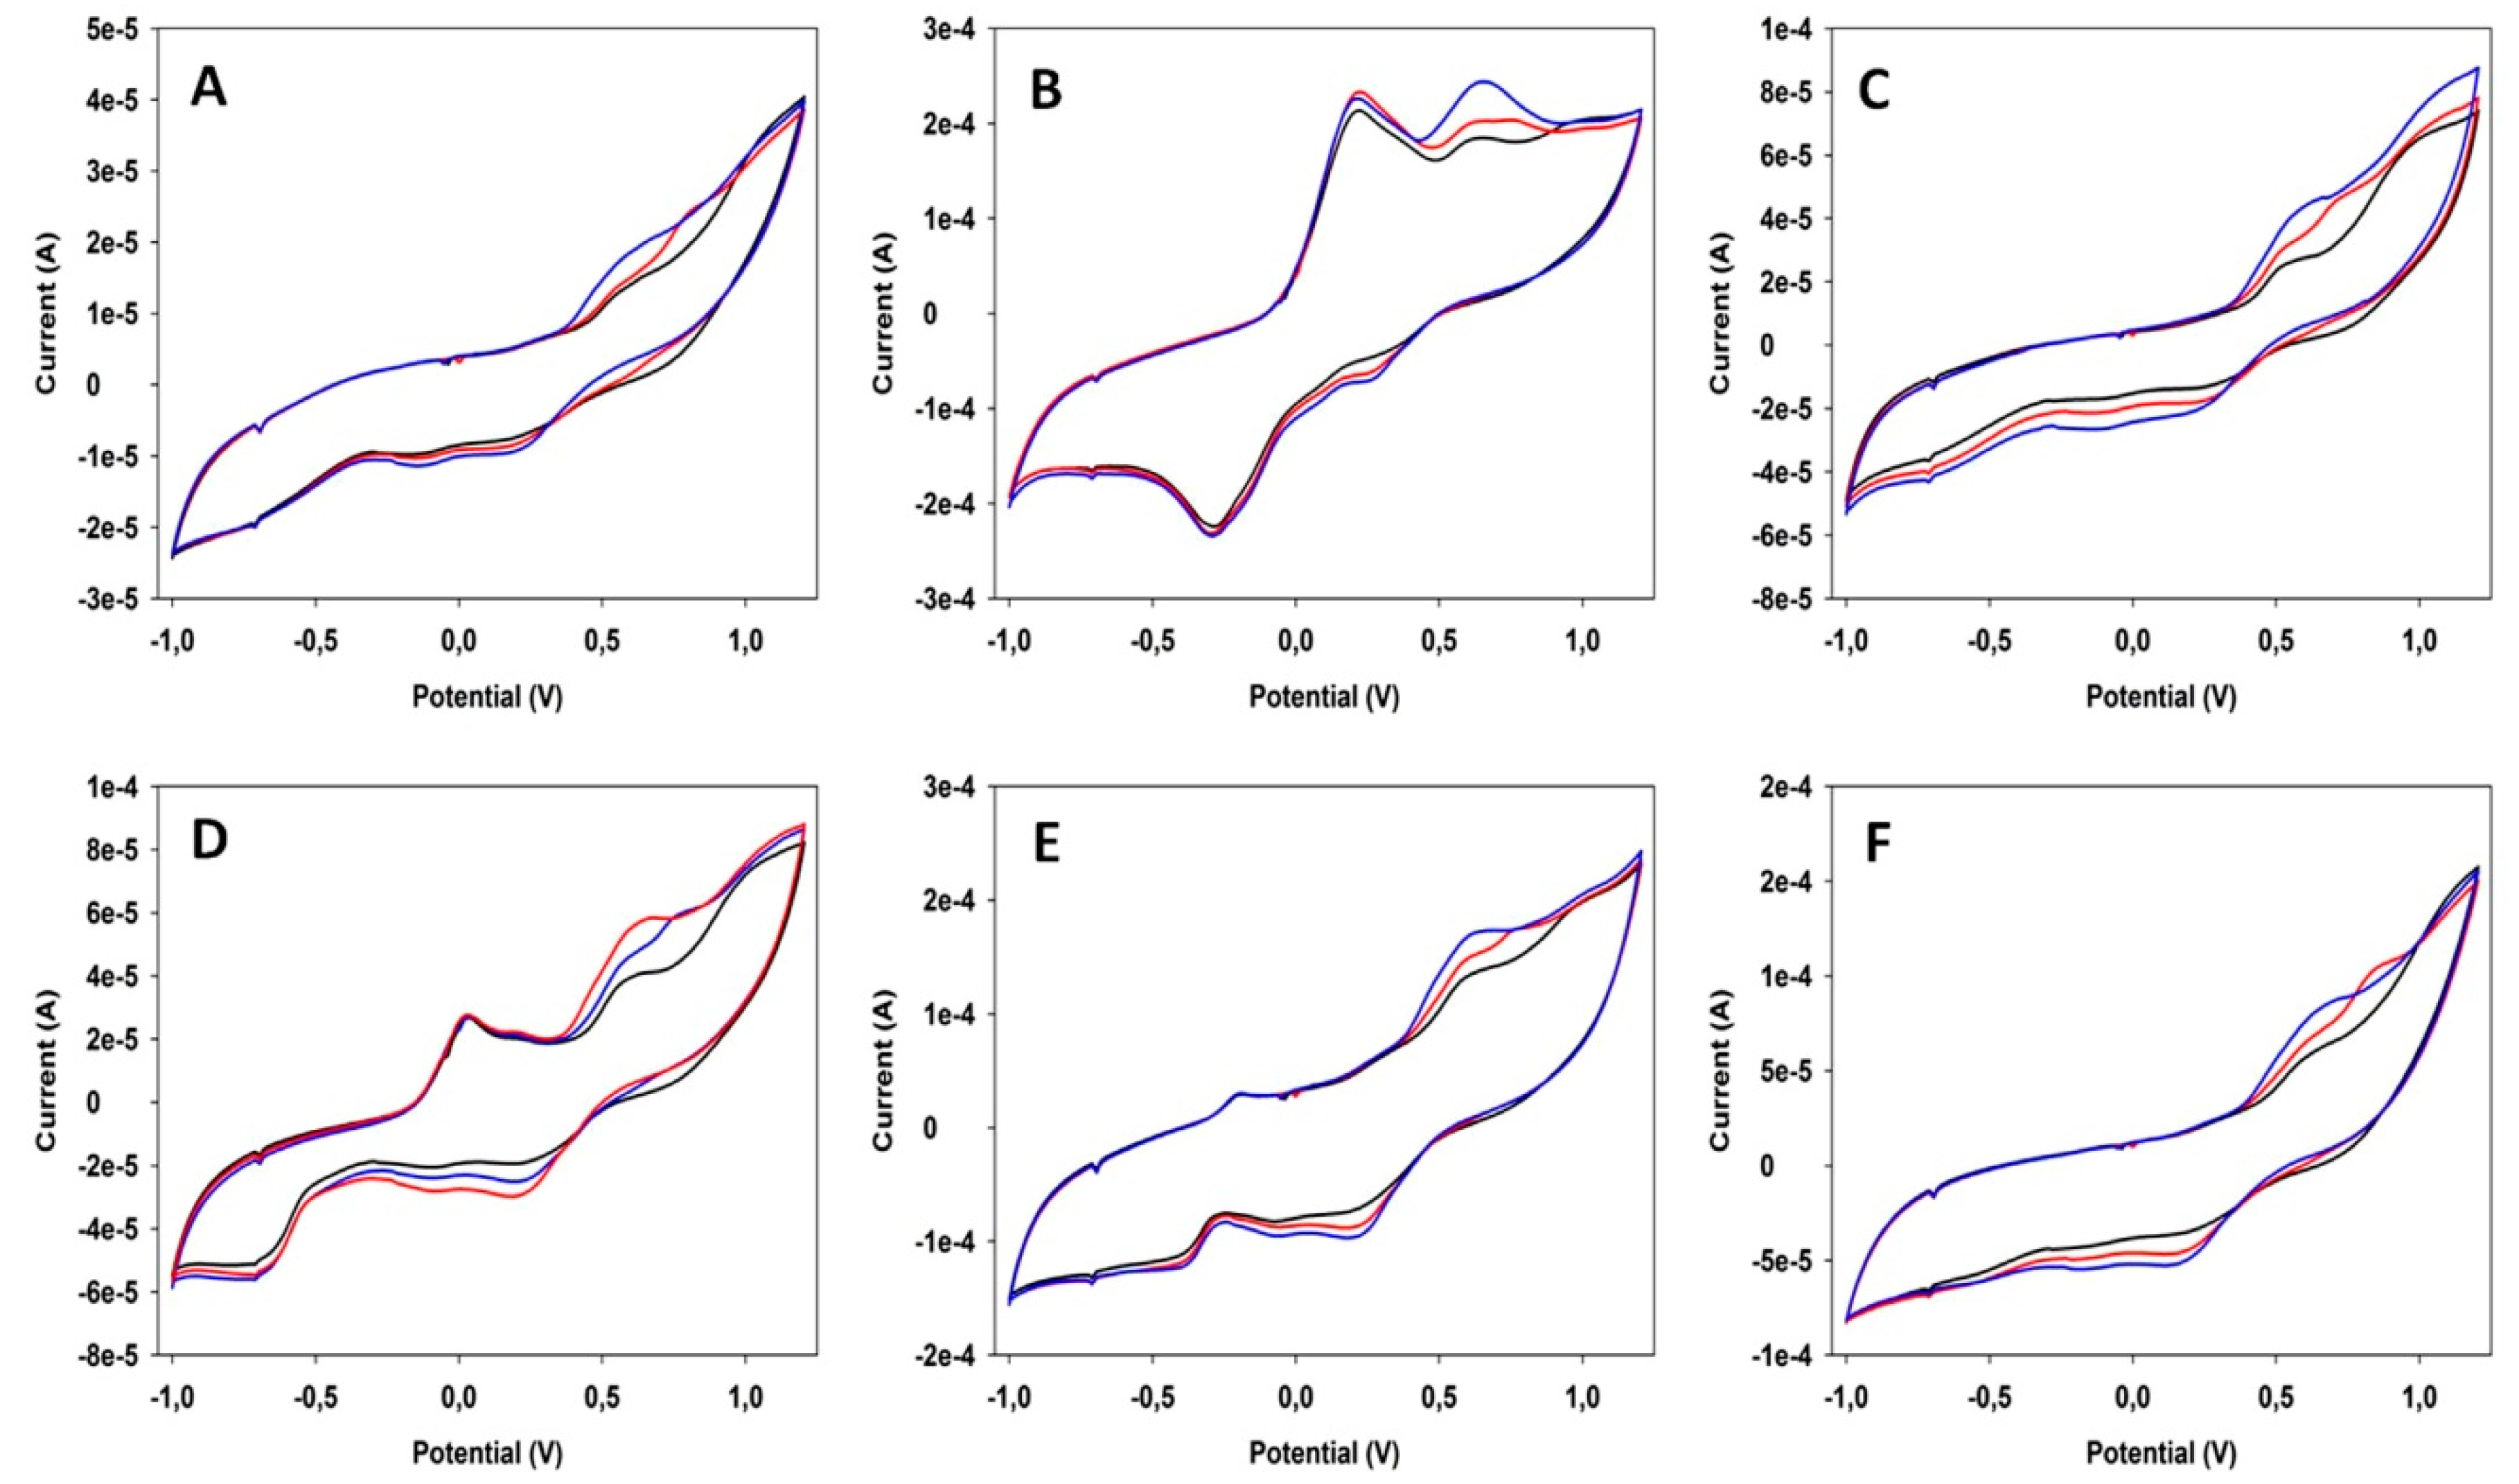

| Food Product | Working Electrodes | Data Analysis | Comments | Ref. |
|---|---|---|---|---|
| Orange juice and milk | Pt and Au | PCA | First voltammetric e-tongue | [14] |
| Milk | Au, Pt, Rh, stainless steel | PCA | Monitoring of milk in dairy industry | [28] |
| Au, Cu, Au modified with Prussian blue | PCA | Recognition of milk adulteration with hydrogen peroxide | [29] | |
| Au, Cu, Pt | PCA | Recognition of milk adulteration with urea, formaldehyde and melamine | [30] | |
| Au, Pd, Pt | MPCA, NPLS-DA | Recognition of milk adulteration with urea | [31] | |
| Au, Pt, Ag | PCA, PLS-DA | Discrimination of various brands of pure milk | [32] | |
| Au, Ag, Pt, Pd | PCA, CA | Monitoring of quality and storage time of unsealed pasteurized milk | [15] | |
| Yogurt | Au, Ag, Pt, Pd | SVM | Monitoring the fermentation, post-ripeness and storage processes of set yogurts | [33] |
| Au, Ag, Pt, Pd | PCA, CA | Evaluation of varieties of set yogurts | [34] | |
| Wines and liqueurs | Phthalocyanine-based carbon paste electrodes and electrodes covered with conducting polypyrrole doped with different counter ions | PCA | Detection of adulterations in wines | [16] |
| Au, Cu | PCA | Discrimination of wines and whiskies of different quality | [35] | |
| Au, Ag, Pt, Pd, W, Ti | PCA, CA | Classification of rice wines of different ages | [36] | |
| Five bulk-modified graphite-epoxy electrodes | PCA, ANN | Cava wine authentication | [37] | |
| Six bulk-modified graphite-epoxy electrodes | LDA | Cava wine authentication | [17] | |
| Five different graphite-epoxy composite electrodes | PCA, ANN | Discrimination of wines of different types and PDO | [38] | |
| Sensors based on metallic and bulk-modified graphite electrodes | LDA | Classification of wines of different PDO | [39] | |
| Four carbon paste electrodes chemically modified in different ways | PCA | Discrimination between red wines aged in oak barrels and matured in steel tanks in contact with oak wood chips | [40] | |
| Three nanocomposites modified electrodes prepared with Au and Cu nanoparticles in the presence of conducting polymers and carbon nanotubes. | PCA, LDA | Classification of rice wines of different geographical origins | [41] | |
| Six modified epoxy-composite electrodes | LDA | Classification of brandies according to their taste category and ageing method | [42] | |
| Four carbon paste electrodes: one unmodified and the others chemically modified with Co, Fe and Zn phthalocyanines | PCA | Discrimination of apple liqueurs | [43] | |
| Grapes | Eight metallic electrodes housed inside a stainless steel cylinder | PCA | Study of grape ripening | [44] |
| Poly-ethylendioxythiophene modified Pt electrode and sonogel carbon electrode | PCA | Study of grape ripening | [45] | |
| Beer | Three enzymatic biosensors based on tyrosinase and phthalocyanines as mediators | PCA, LDA | Monitoring of the aging of beers | [46] |
| Six bulk-modified graphite-epoxy electrodes | PCA, LDA, PLS-DA | Classification of three types of beer: Lager, Stout and IPA | [47] | |
| Four commercial screen-printed electrodes made of carbon, Au, carbon/Co-Phtahlocyanine and Pt | PCA, LDA | Classification of different types of beer | [48] | |
| Coffee | Six graphite-epoxy electrodes modified in different ways | LDA, SVM | Geographical classification of Mexican coffees | [49] |
| Au wire and graphite rod | PCA | Discrimination of civet coffee | [50] | |
| Tea | Ir, Pt, Rh | PCA | Discrimination of nine different teas | [51] |
| Au, Ir, Pd, Pt, Rh | PCA, LDA | Tea quality assessment | [52,53] | |
| Pt and glassy C | PCA, LDA | Classification of black tea liquor | [54] | |
| Metallic oxide-modified nickel foam electrodes (SnO2, ZnO, TiO2, Bi2O3) | PCA, SVM | Classification of green and black teas | [55] | |
| Au, Ir, Pd, Pt, Rh | PCA | Monitoring the fermentation process of black tea | [56,57] | |
| Honey | Au, Ag, Pt, Pd, W, Ti | PCA, CA, DFA | Classification of mono-floral honeys | [58] |
| Au, Ag, Pt, Pd, W, Ti | PCA, DFA | Tracing floral and geographical origins of honey | [59] | |
| Pt, Au, glassy C, Ag, Pd, Ni, Cu | PCA, SVM, HCA | Classification of Moroccan and French honeys according to geographical and botanical origins and detection of adulteration | [60,61] | |
| Au, Ag, Pt | PCA, LDA | Authentication of mono-floral and honeydew Romanian honeys | [62] | |
| Ir, Rh, Pt, Au | PCA | Monitoring honey adulteration with sugar syrups | [63] | |
| Au, Ag, Pt, glass electrode | PLS-DA | Monitoring honey adulteration | [64] | |
| Oil | Six electrodes based on polypyrrole | PCA, PLS-DA | Discrimination of extra virgin olive oils according to their degree of bitterness | [65] |
| Pt, Au, glassy C, Ag, Ni, Pd, Cu | PCA, DFA, SVM | Detection of adulteration in argan oil | [66] | |
| Modified carbon paste electrodes | PLS-DA | Detection of virgin olive oil adulteration | [67] | |
| Cu, glassy C, Au, Ni, Pd, Pt, Ag | PCA, SVM, HCA | Identification of Portuguese olive oils | [68] | |
| Meat and fish | Screen-printed electrodes modified with bisphthalocyanine and polypyrrole | PCA, PLS-DA | Beef freshness monitoring by detection of ammonia and putrescine | [69] |
| Pt, Au, Ag, glassy C, Pd, Cu, Ni | PCA | Assessment the origins of red meats and their storage time | [70] | |
| Ir, Rh, Pt, Au, Ag, Co, Cu, Ni | PCA | Shelf-life assessment of fresh cod in cold storage | [71] |
| Application | Working Electrodes | Data Analysis | Ref. |
|---|---|---|---|
| Prediction of bitterness and alcoholic strength in beers | Polypyrrole polymerized onto Pt disks and doped with different modifiers | PLS | [75] |
| Determination of total polyphenol index in wines | Five graphite-epoxy electrodes modified in different ways | PLS, ANN | [76] |
| Determination of theaflavin and thearubigin in black tea | Au, Ir, Pd, Pt, Rh | PLS, SVM, ANN | [77,78] |
| Evaluation of sugar content and firmness of non-climacteric pears | Au, Ag, Pt, Pd, W, Ti | PLS, PCR, SVM | [79] |
| Evaluation of the antioxidant capacity of red wines | Graphite-epoxy composite electrodes and modified carbon paste electrodes | PLS, ANN | [80] |
| Evaluation of oxygen exposure levels and polyphenolic content of red wines | Modified carbon paste electrodes based on bisphthalocyanines and perylenes | PLS | [81] |
| Quantification in rosé cava wines of different indexes related to total phenolic content and other specific phenolic features | Four graphite–epoxy voltammetric (bio)sensors with different modifiers such as tyrosinase, laccase and copper nanoparticles | ANN | [82] |
| Determination of galactose, glucose, xylose and mannose in sugar cane bagasse | Glassy carbon electrodes modified with multi-walled carbon nanotubes containing metal (Pd, Au, Cu, Ni, Co) | ANN | [18] |
| Determination of spring water quality parameters | Ir, Rh, Pt, Au | PLS | [83] |
| Determination of bisulphites in wines | Au, Rh, Pt, stainless steel | PLS | [84] |
| Determination of ethylphenol metabolites in wines | Six graphite–epoxy modified composite electrodes | ANN | [85] |
| Determination of nitrate, nitrite and chloride in minced meat | Au, Pt, Rh, Ir, Ag, Ni, Co, Cu | PLS | [86] |
| Determination of Tl(I) and In(III) in tonic water by using a multivariate standard addition method | A screen-printed carbon nanofibers electrode modified with selenocystine and a screen-printed carbon electrode modified with a Bi film | PLS | [19] |
| Determination of the polyphenolic content of extra virgin olive oils | Twelve sensors: five of them based on lanthanide bisphthalocyanines, six based on polypyrrole and one unmodified carbon paste electrode. | PLS | [87] |
| Determination of bitterness index in olive oils | Six polypyrrole-based screen-printed electrodes | PLS | [65] |
| Quantification of total polyphenol content in olive oils | Polypyrrole modified screen-printed electrodes | PLS | [88] |
| Detection of antibiotic residues in bovine milk | Au, Ag, Pt, Pd, Ti | PCR, PLS, SVM | [89] |
| Determination of the antioxidant activity of camu camu and tumbo juices | Au, Pt, Ir, Rh, Ag, Cu, Ni, Co | PLS | [90] |
© 2019 by the authors. Licensee MDPI, Basel, Switzerland. This article is an open access article distributed under the terms and conditions of the Creative Commons Attribution (CC BY) license (http://creativecommons.org/licenses/by/4.0/).
Share and Cite
Pérez-Ràfols, C.; Serrano, N.; Ariño, C.; Esteban, M.; Díaz-Cruz, J.M. Voltammetric Electronic Tongues in Food Analysis. Sensors 2019, 19, 4261. https://doi.org/10.3390/s19194261
Pérez-Ràfols C, Serrano N, Ariño C, Esteban M, Díaz-Cruz JM. Voltammetric Electronic Tongues in Food Analysis. Sensors. 2019; 19(19):4261. https://doi.org/10.3390/s19194261
Chicago/Turabian StylePérez-Ràfols, Clara, Núria Serrano, Cristina Ariño, Miquel Esteban, and José Manuel Díaz-Cruz. 2019. "Voltammetric Electronic Tongues in Food Analysis" Sensors 19, no. 19: 4261. https://doi.org/10.3390/s19194261


