1. Introduction
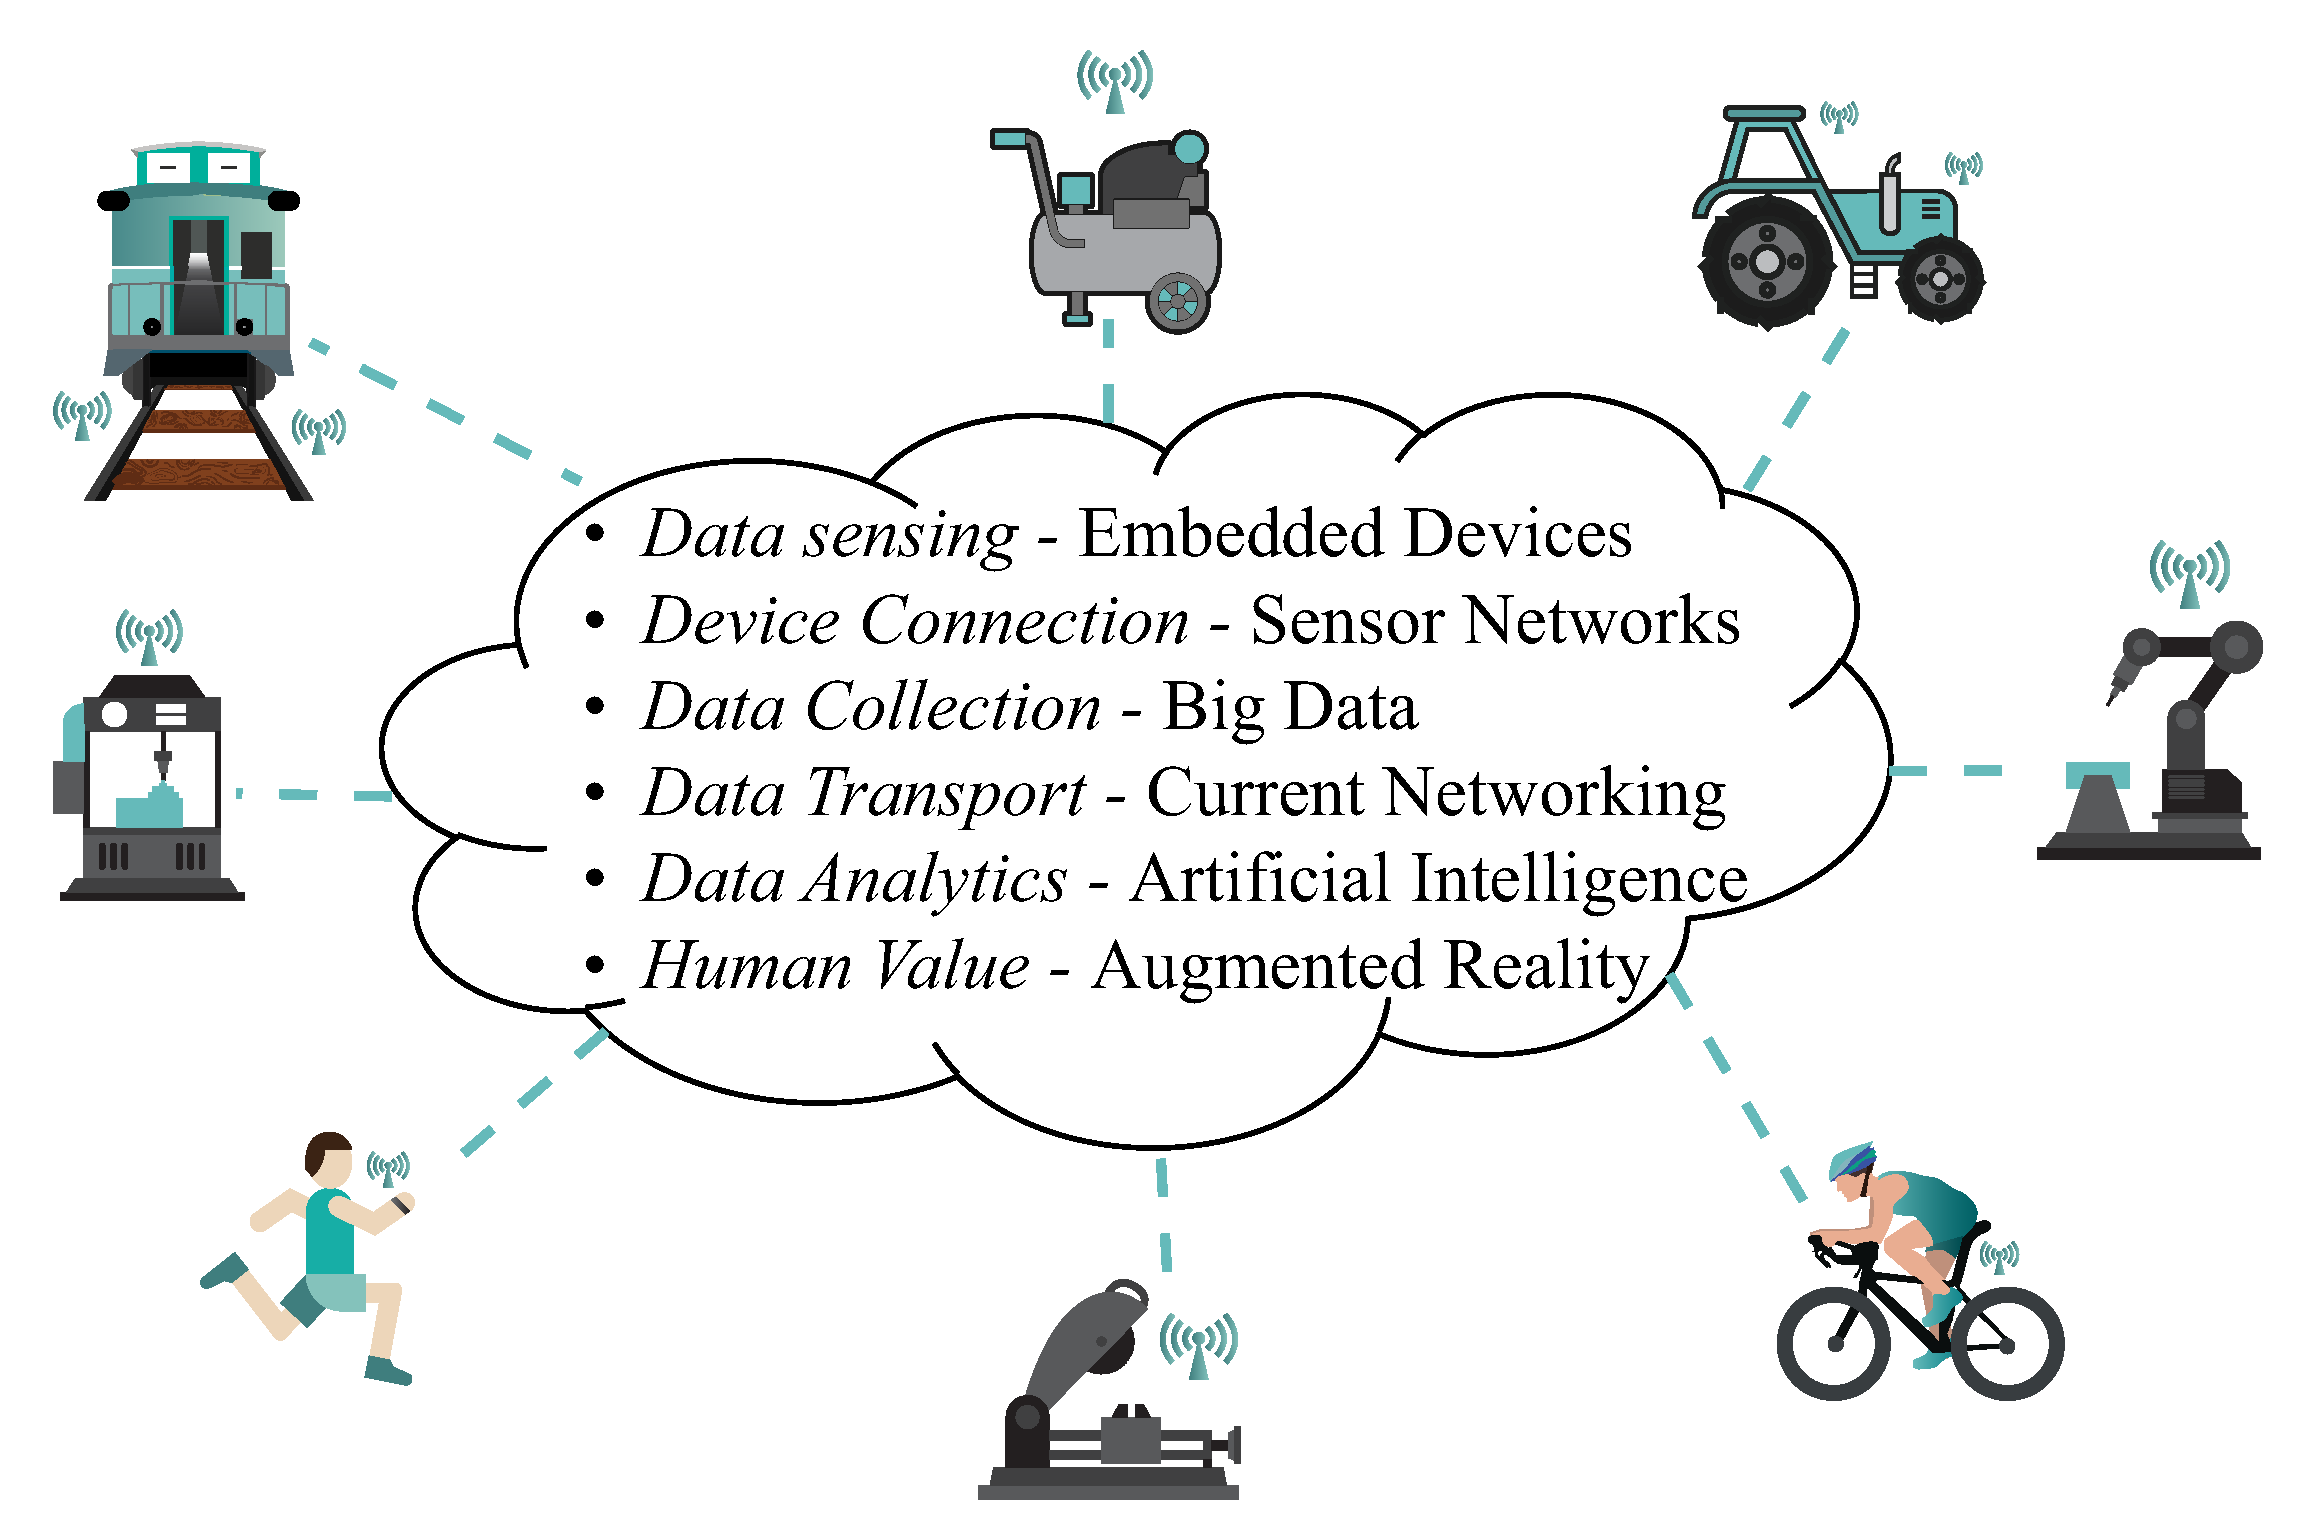
The Internet of Things (IoT) proposes an environment where individual nodes such as industrial machinery, home appliances, and wearable technology are all interconnected for data collection and exchange, in particular using Wireless Sensor Networks (WSNs) (
Figure 1). The current worldwide investment in IoT of around USD 130 billion [
1], with up to 7 billion nodes currently connected, has created a thriving market that is forecast to grow to USD 1567 billion by 2025, with 21.5 billion of connected nodes [
2]. The IoT market consists of an increasing number of start-up companies, which are defining different stages in the technology development, such as: Sensors, Connection (sensor networks), Storage (solid state), Processing (big-data management), Telecommunications, and Learning (Artificial Intelligence—AI). It has been suggested that the purpose of this evolution is to bring computer systems to a state of
Awareness. As such, health care, finances, and manufacturing are expected to be re-shaped to include features for Augmented Reality (AR), of which IoT is a foundation.
IoT applications differ according to the place where the data analysis is performed. Thus, there is a differentiation between computation at the edge or in the cloud. Intelligence at the edge of the IoT is often required to increase speed of decisions, add security for data (since it is kept local), and reduce power required for transmission. IoT solutions provided by the integrated-circuit (IC) industry merge different functions (sensing, wireless communications, etc.) in single chips, and are becoming pervasive across the entire ecosystem. These solutions are designed to have low power consumption, and to be highly reliable and “always-on”. Some examples are within IoT products by Texas Instruments (TI) (Dallas, TX, USA) [
3], Microchip Technology (MCHP) (Chandler, AZ, USA) [
4], and the SmartMesh IP solution range by Analog Devices (ADI) (Norwood, MA, USA) [
5].
An underlying need for the resilient interconnection of Sensor Nodes (SNs) at the edge of the IoT is a reliable power supply, and the current standard is the use of batteries. However, expected industrial applications of the IoT such as preventive maintenance require pervasive sensing, with challenges such as a large number of SNs to power, and in places that might be difficult to reach. In such cases, the cost of battery replacement represents a significant barrier to the widespread use of WSNs [
6]. Viable alternatives to batteries are renewable power sources, in particular Energy Harvesting (EH) [
7]—the collection of small amounts of power (less than 1 W) taken from environmental sources, to feed low power-consumption loads.
Indeed, it is estimated that the operational cost over the product life-time of a harvester-assisted application is reduced to one third of that of a battery-powered one [
8]. One of the most popular options is Electromagnetic-Vibration Energy Harvesting (EM-VEH). This technology exploits the relative motion between a coil and a magnet produced by mechanical vibrations that induces AC voltage in the coil. Traditionally these systems have a narrow frequency bandwidth and must be tuned to the dominant frequency of the ambient vibrations—generally in the sub 100 Hz range [
9].
To overcome the problem of narrow bandwidth, a two-degree-of-freedom (2DoF) EM-VEH device that exploits multiple masses and a patented velocity-amplification principle has been developed by the authors’ group [
10,
11,
12,
13]. In this harvester, harmonic and random excitations can be used as vibration sources for producing higher voltage and power than in prior art.
However, to make this particular technology usable, optimised power conversion (AC-to-DC) and management is needed. Energy conversion schemes for the traditional EM-VEH system assume different conditions than what is true for the harvester in this study. Namely, the equivalent AC voltage level and series impedance of the harvesting source are much larger. This makes the requirements of the power management strategy more stringent, while it is less orthodox and therefore more challenging to be directly solved by an off-the-shelf solution “as it is”. In addition, it is more relevant for the industry of IoT applications to understand the capabilities of the overall EH system when used with real ambient vibration sources, especially those found in industry, to power real WSN loads. These topics have not yet been explored for the particular harvester under discussion.
This paper addresses these needs by introducing a power management technique specific for the multi-modal EM-VEH device reported in [
12]. The harvester and its test system are introduced first. Then, the characterisation of the EH system is explored using both ideal input vibrations and vibrations commonly found in industry. The IoT sensor nodes of two different communication technologies, to be continuously powered by the EH solution, are also described. The power management strategy is then developed. Experiments and results are presented before concluding the paper.
2. System of Interest
Common vibrational energy harvesters are based on linear mass-spring systems with a narrow frequency response, which requires that they need to be tuned to the main frequency of the external excitation. This usually limits the energy transfer in realistic applications, since ambient vibrations generally have a broad spectrum with several peaks [
9]. An alternative to overcome the problem of narrow bandwidth is the two-degree-of-freedom (2DoF) velocity-amplified EM-VEH device introduced in [
12,
13,
14].
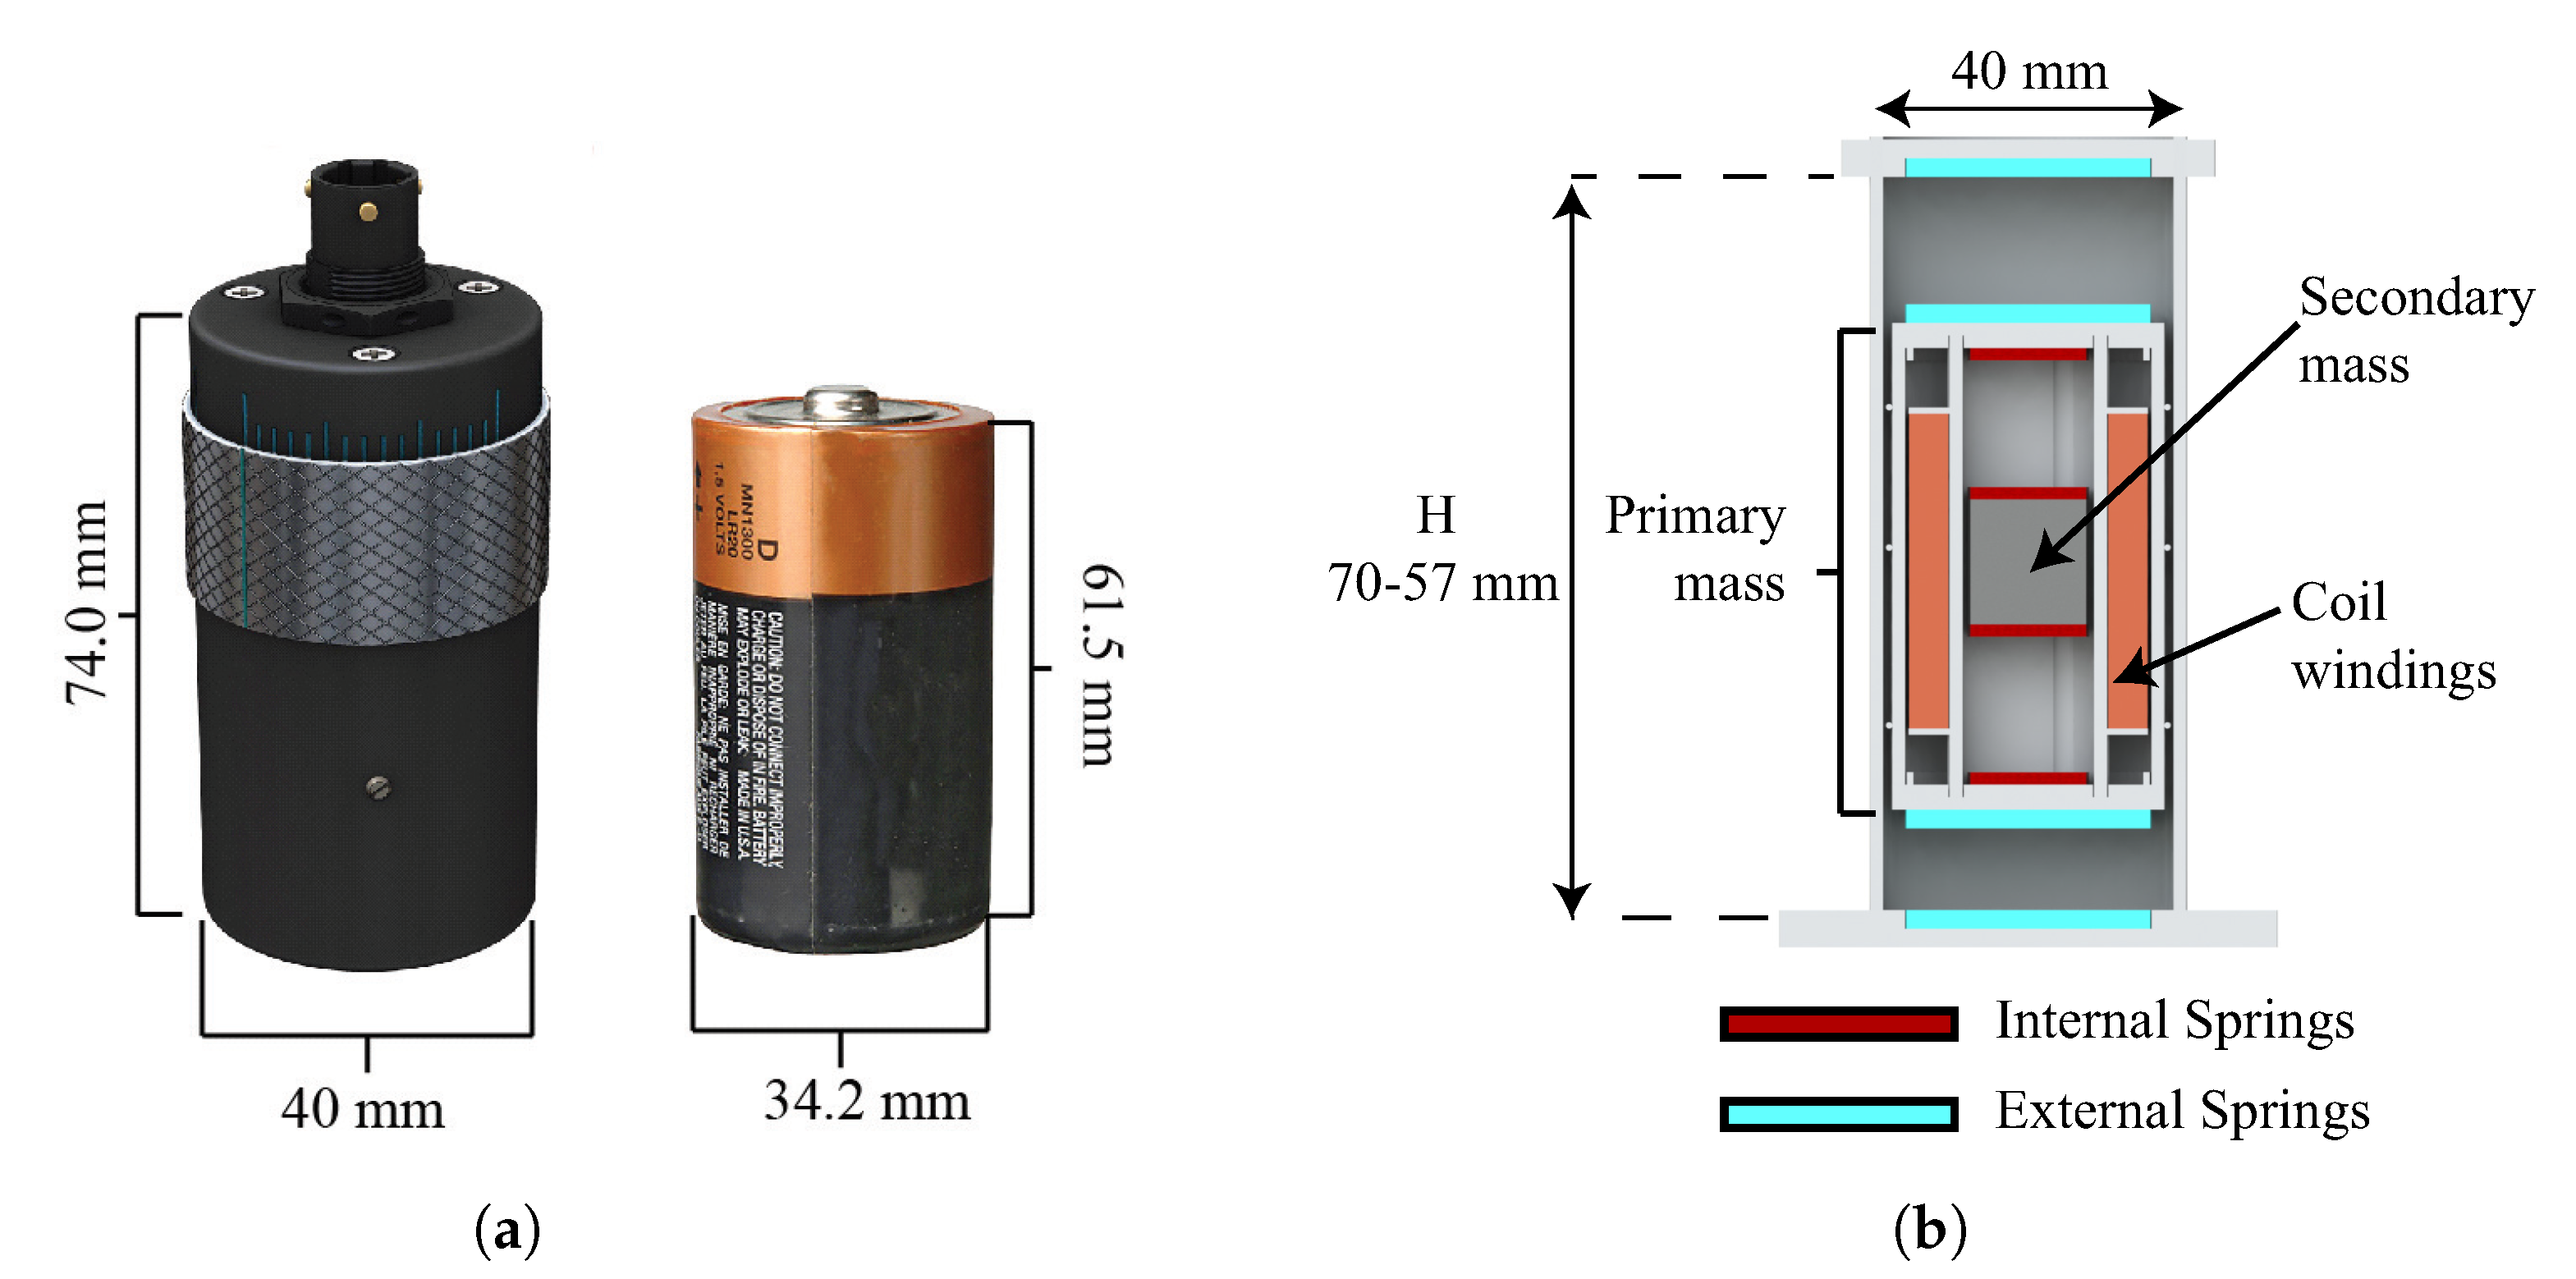
The harvester is currently going through a commercialisation path, and it has been branded by Stokes Power [
15], with the commercial name of VEH-1.
Figure 2a shows its overall size with reference to a D-battery: diameter 40 mm, height 74 mm.
The device is based on a concept developed by the authors in [
12] and its schematic is shown in
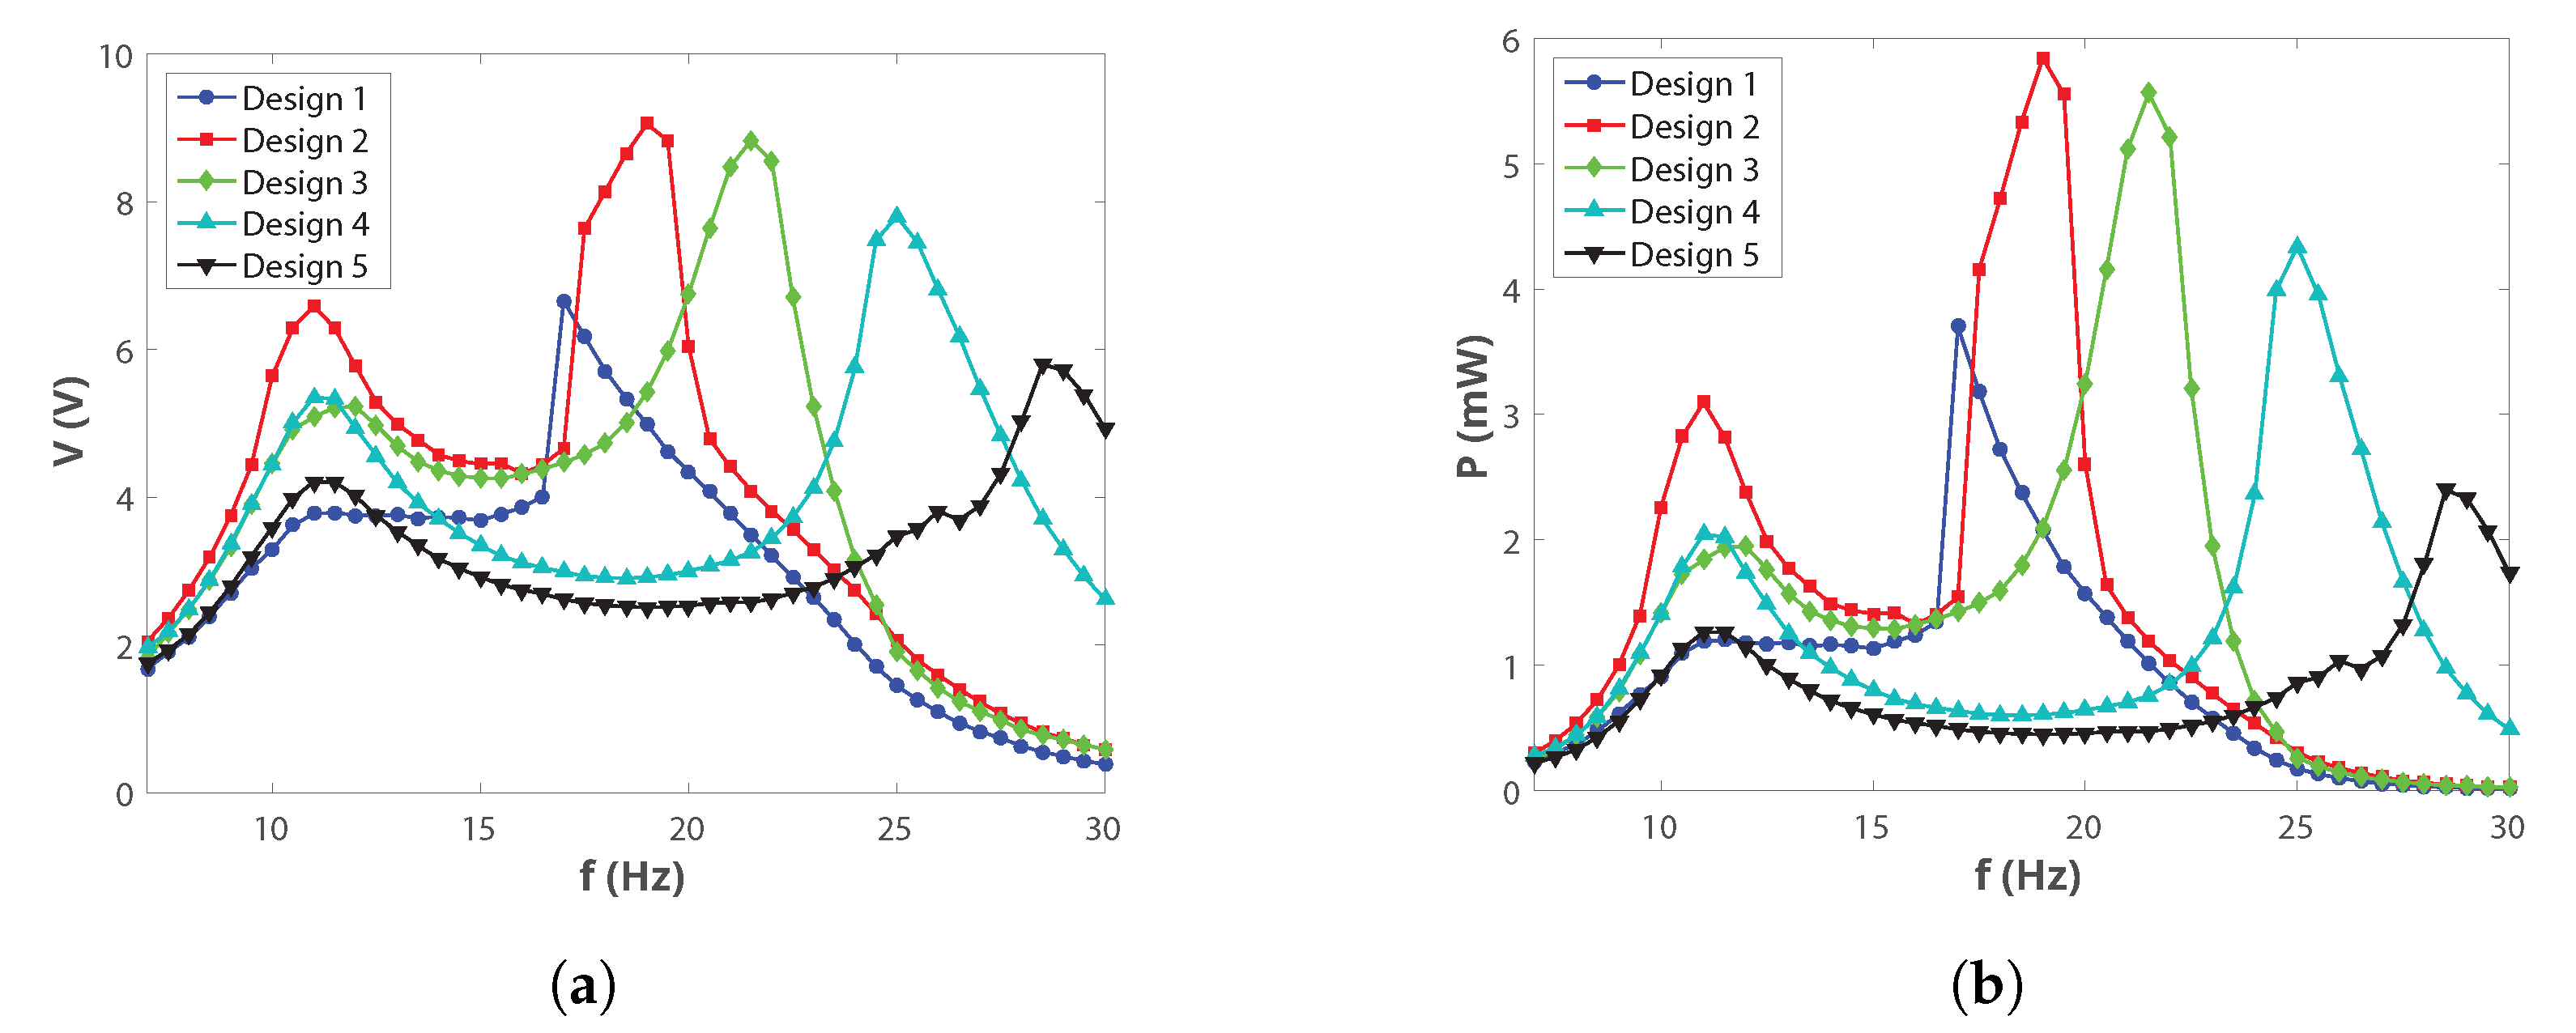
Figure 2b: it comprises two masses oscillating vertically, one inside the other, between four sets of springs. The distance (
H) between the external springs (
Figure 2b) can be varied and this affects the frequency response of the harvester as shown in
Section 3.1. Impacts between the masses can occur, allowing momentum transfer from the heavier mass (the outer mass) to the lighter (the inner mass), leading to velocity-amplification. Electromagnetic transduction is chosen as the conversion mechanism since it is easily implemented in a device that exploits velocity-amplification: the outer mass acts as a housing for the coil and the inner mass is a magnet. According to Faraday’s law, the induced voltage is given by
, where
B is the magnetic field experienced by the coil of total length
l and
v is the relative velocity between the coil and the magnet: enhancing the velocity of the inner mass increases the output voltage and the output power (
).
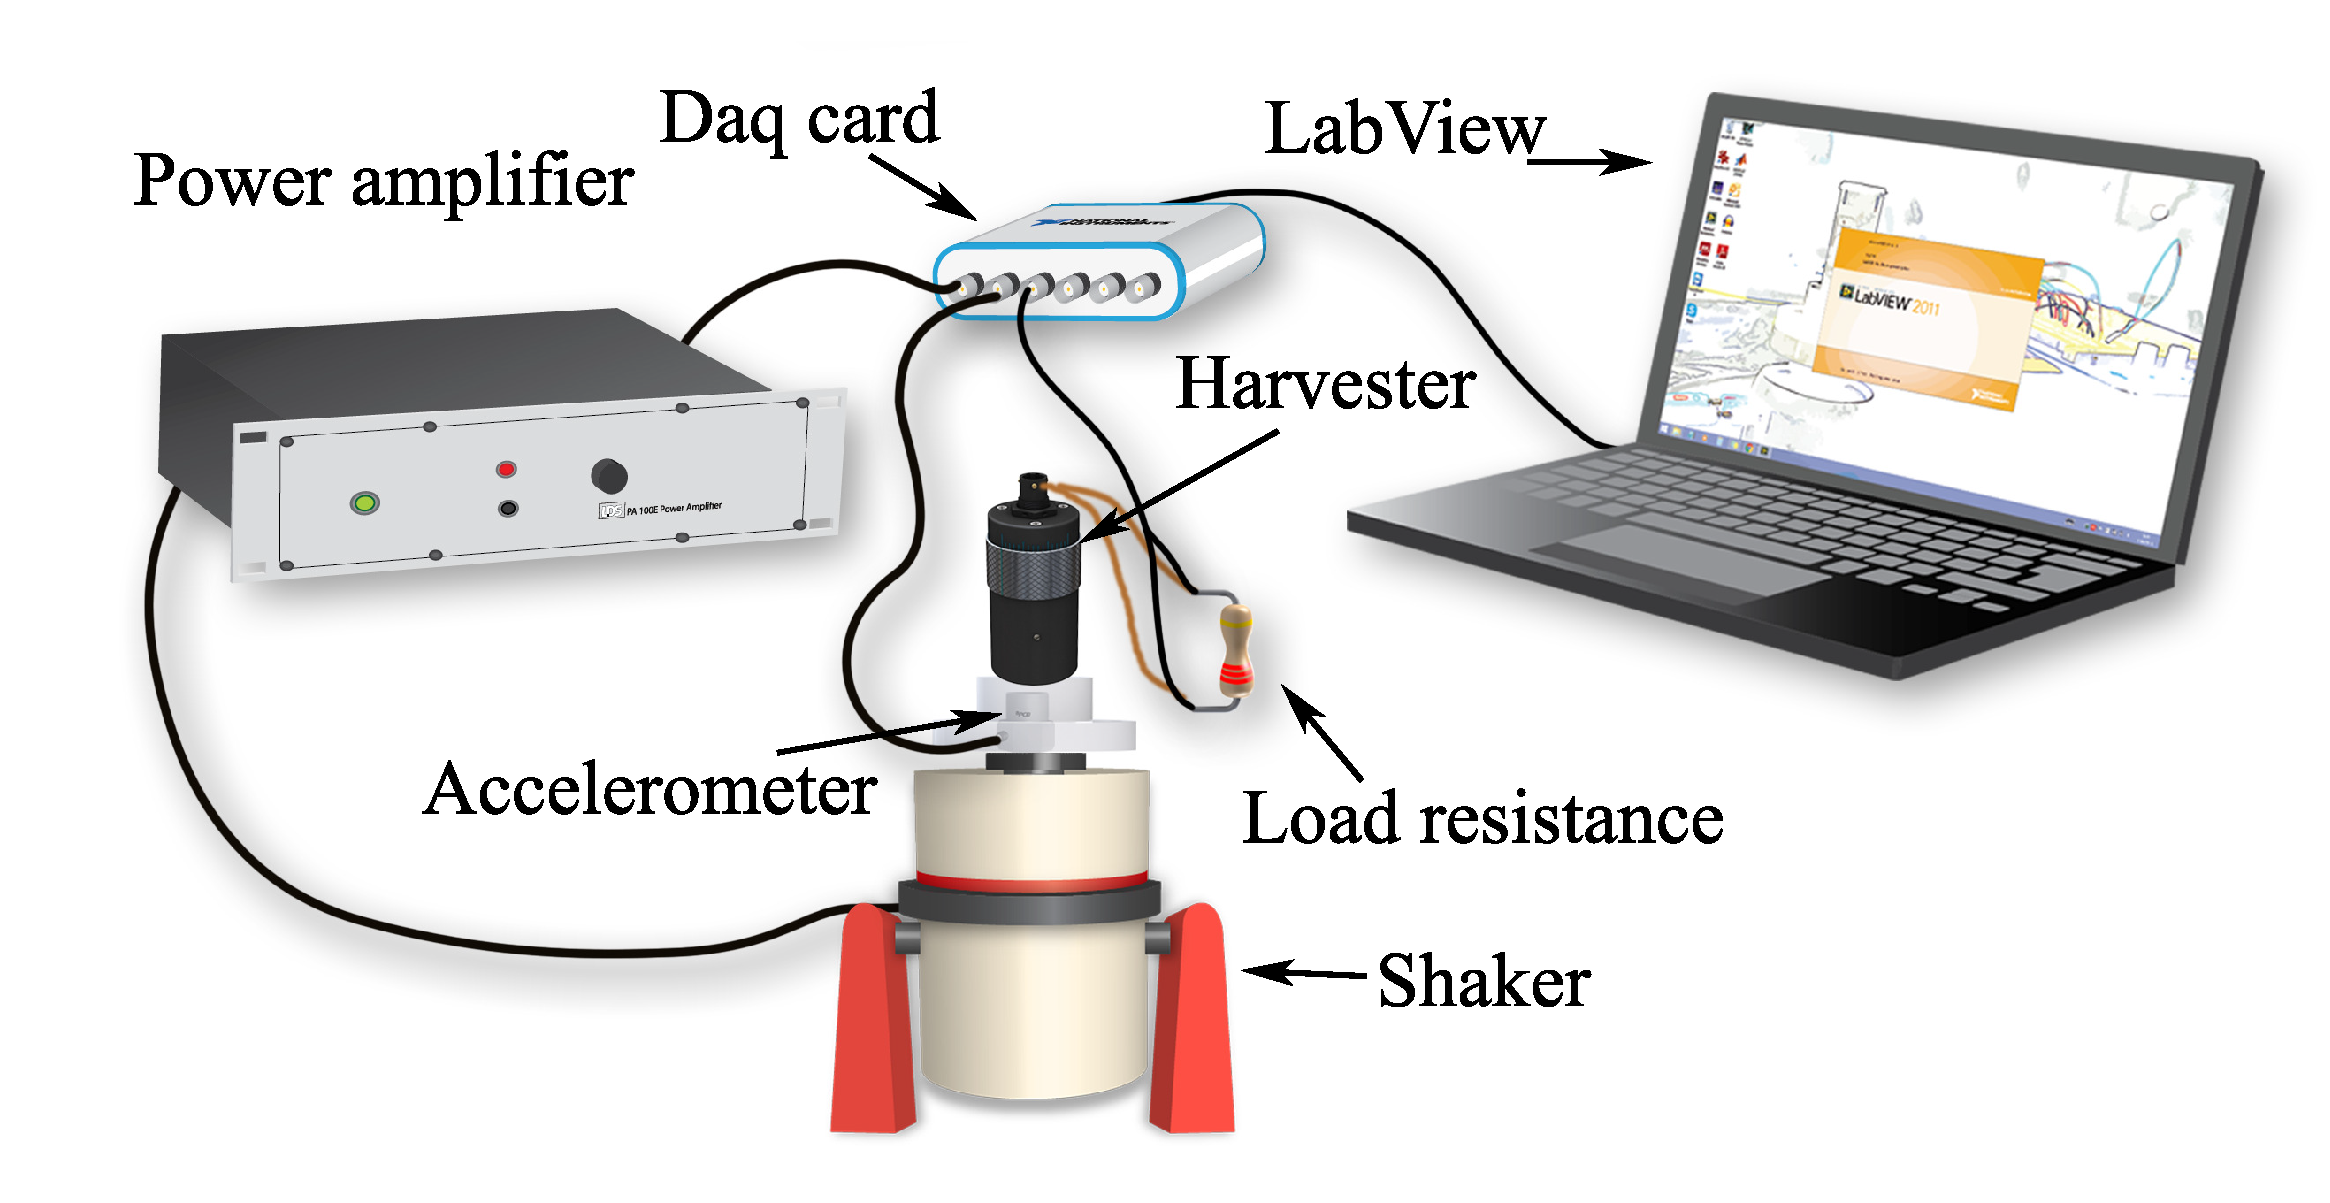
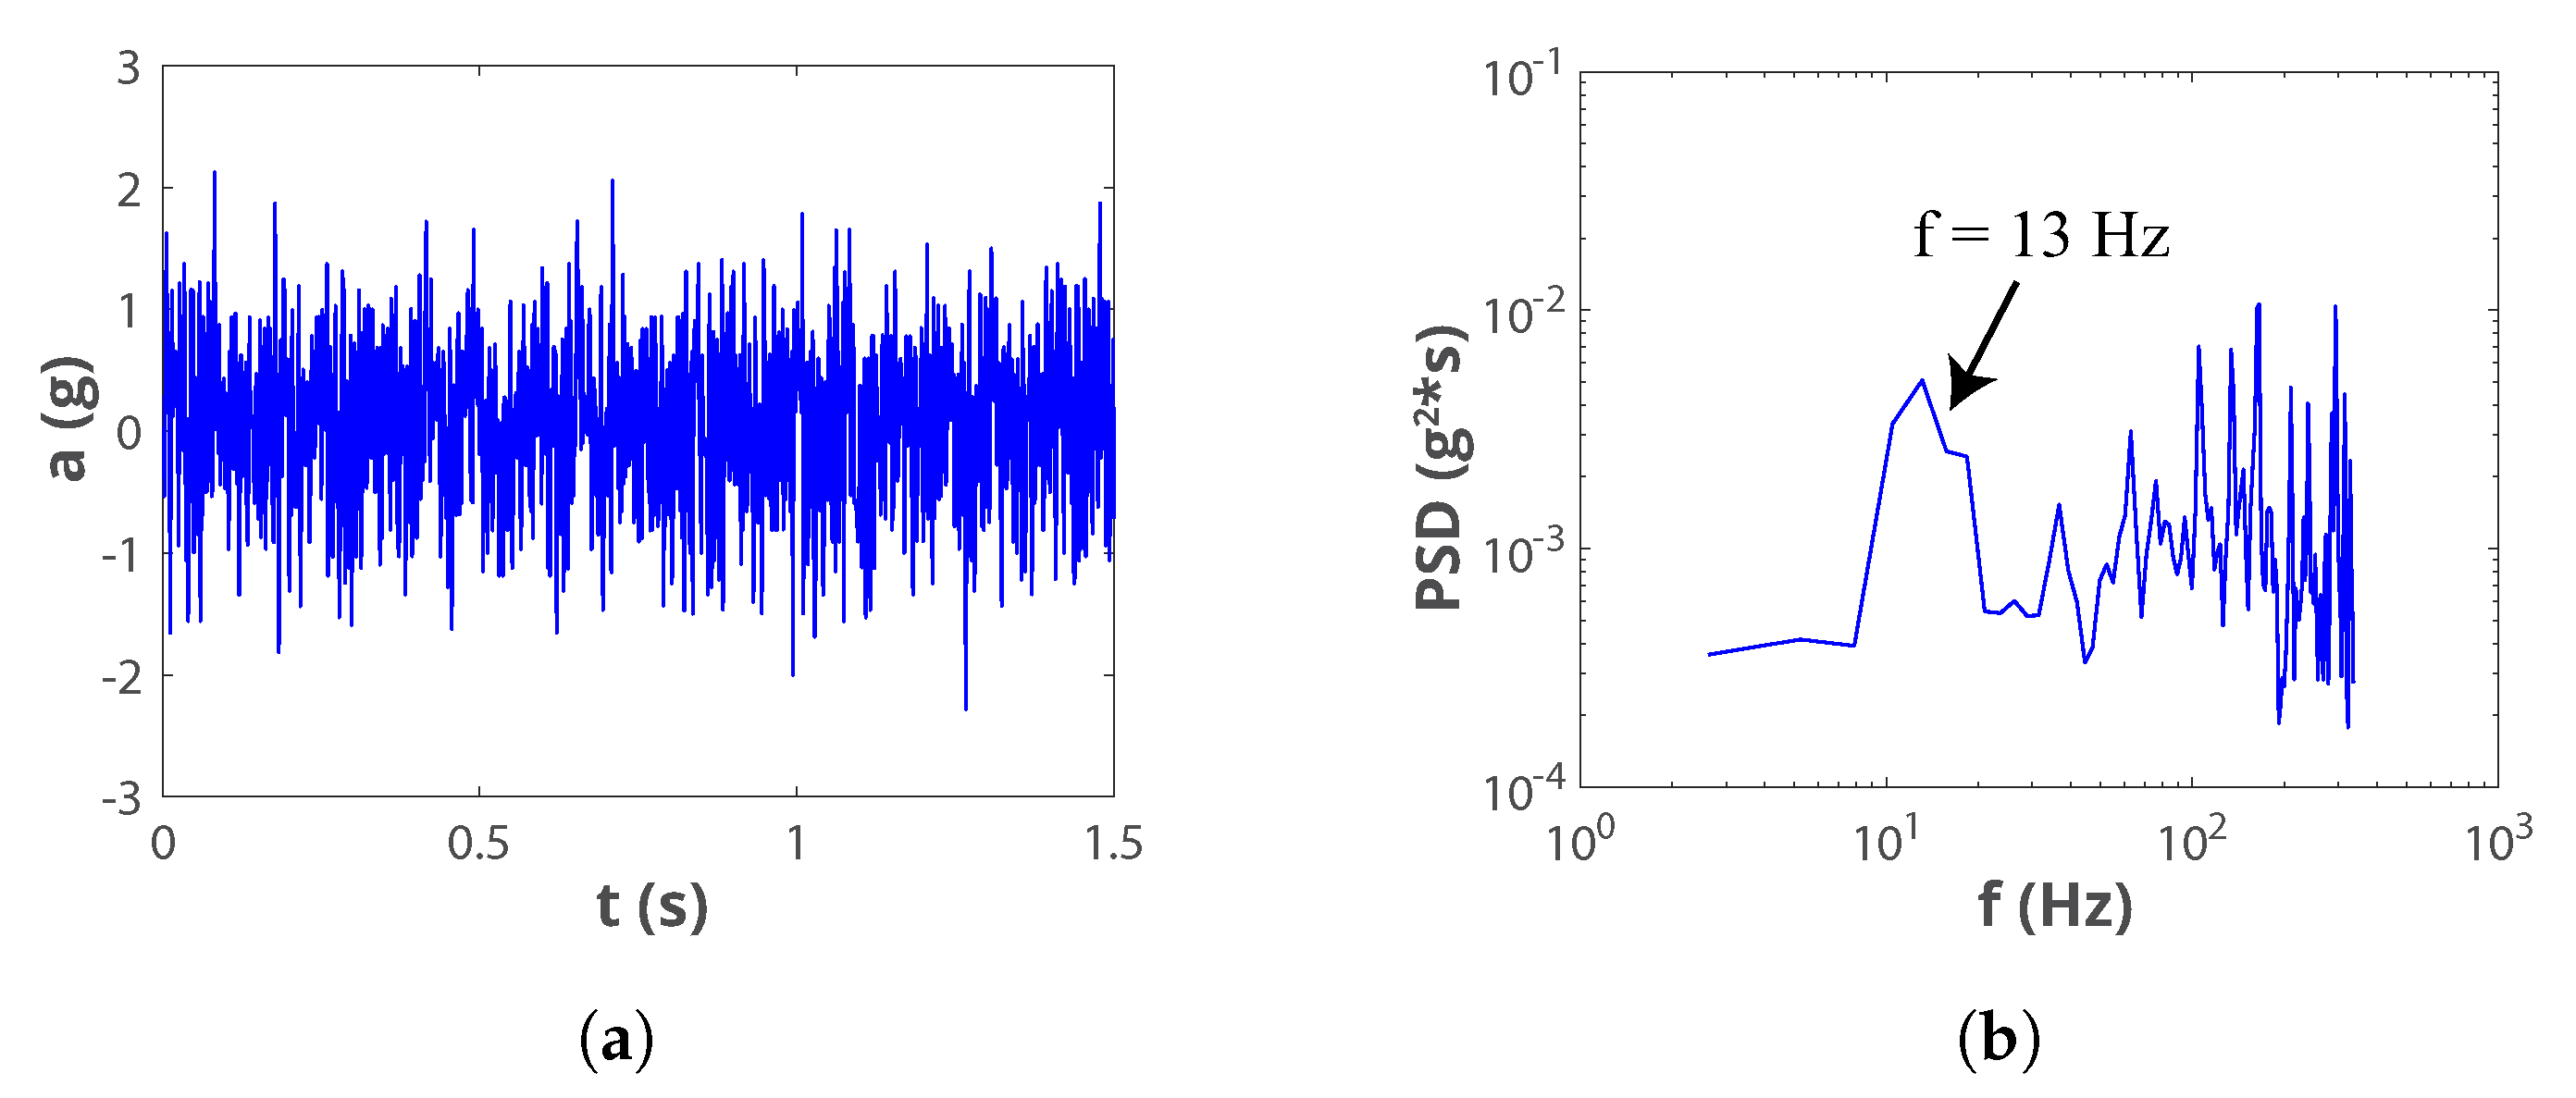
As shown in
Figure 3, the harvester was fixed to a Brüel & Kjaer LDS V406 electrodynamic shaker (Naerum, Denemark) and a PCB Piezotronic accelerometer (Depew, NY, USA), mounted on the head of the shaker below the harvester, was used to provide feedback control to set the acceleration to the desired amplitude level. The output voltage was measured across a variable resistor whose value was fixed to match the optimal load
. Labview (version 2011, National Instrument, Austin, TX, USA) was used to drive the shaker and to acquire signals from both the accelerometer and the harvester.
5. Power Management for EM-VEH
The SNs targeted by the proposed EM-VEH technique have embedded electronics designed to be powered from a coin-type battery of VDC. Since the output voltage of the VEH-1 is of AC nature, the power management (PM) strategy must first implement AC-to-DC electrical energy conversion, and then further DC voltage regulation to deliver a reliable DC supply near 3 VDC, while maximising the energy transfer.
To solve this problem, the IC industry offers a wide range of Power Management Integrated Circuits (PMICs) specifically for EH. These devices integrate ultra-low power conversion schemes with control techniques that are customised for EH applications. This is because an SN can operate continuously only if the energy production is equal to or superior to the consumption, which is challenging for any EH supply and hence low-power-management strategies are required. On the load side, this is achieved by implementing customised scheduling with data
Tx/
Rx implemented only every several seconds/minutes (
Section 4) [
23]. On the supply side, Maximum Power Point Tracking (MPPT) techniques, usually implemented by the PMIC, assist with the power delivery.
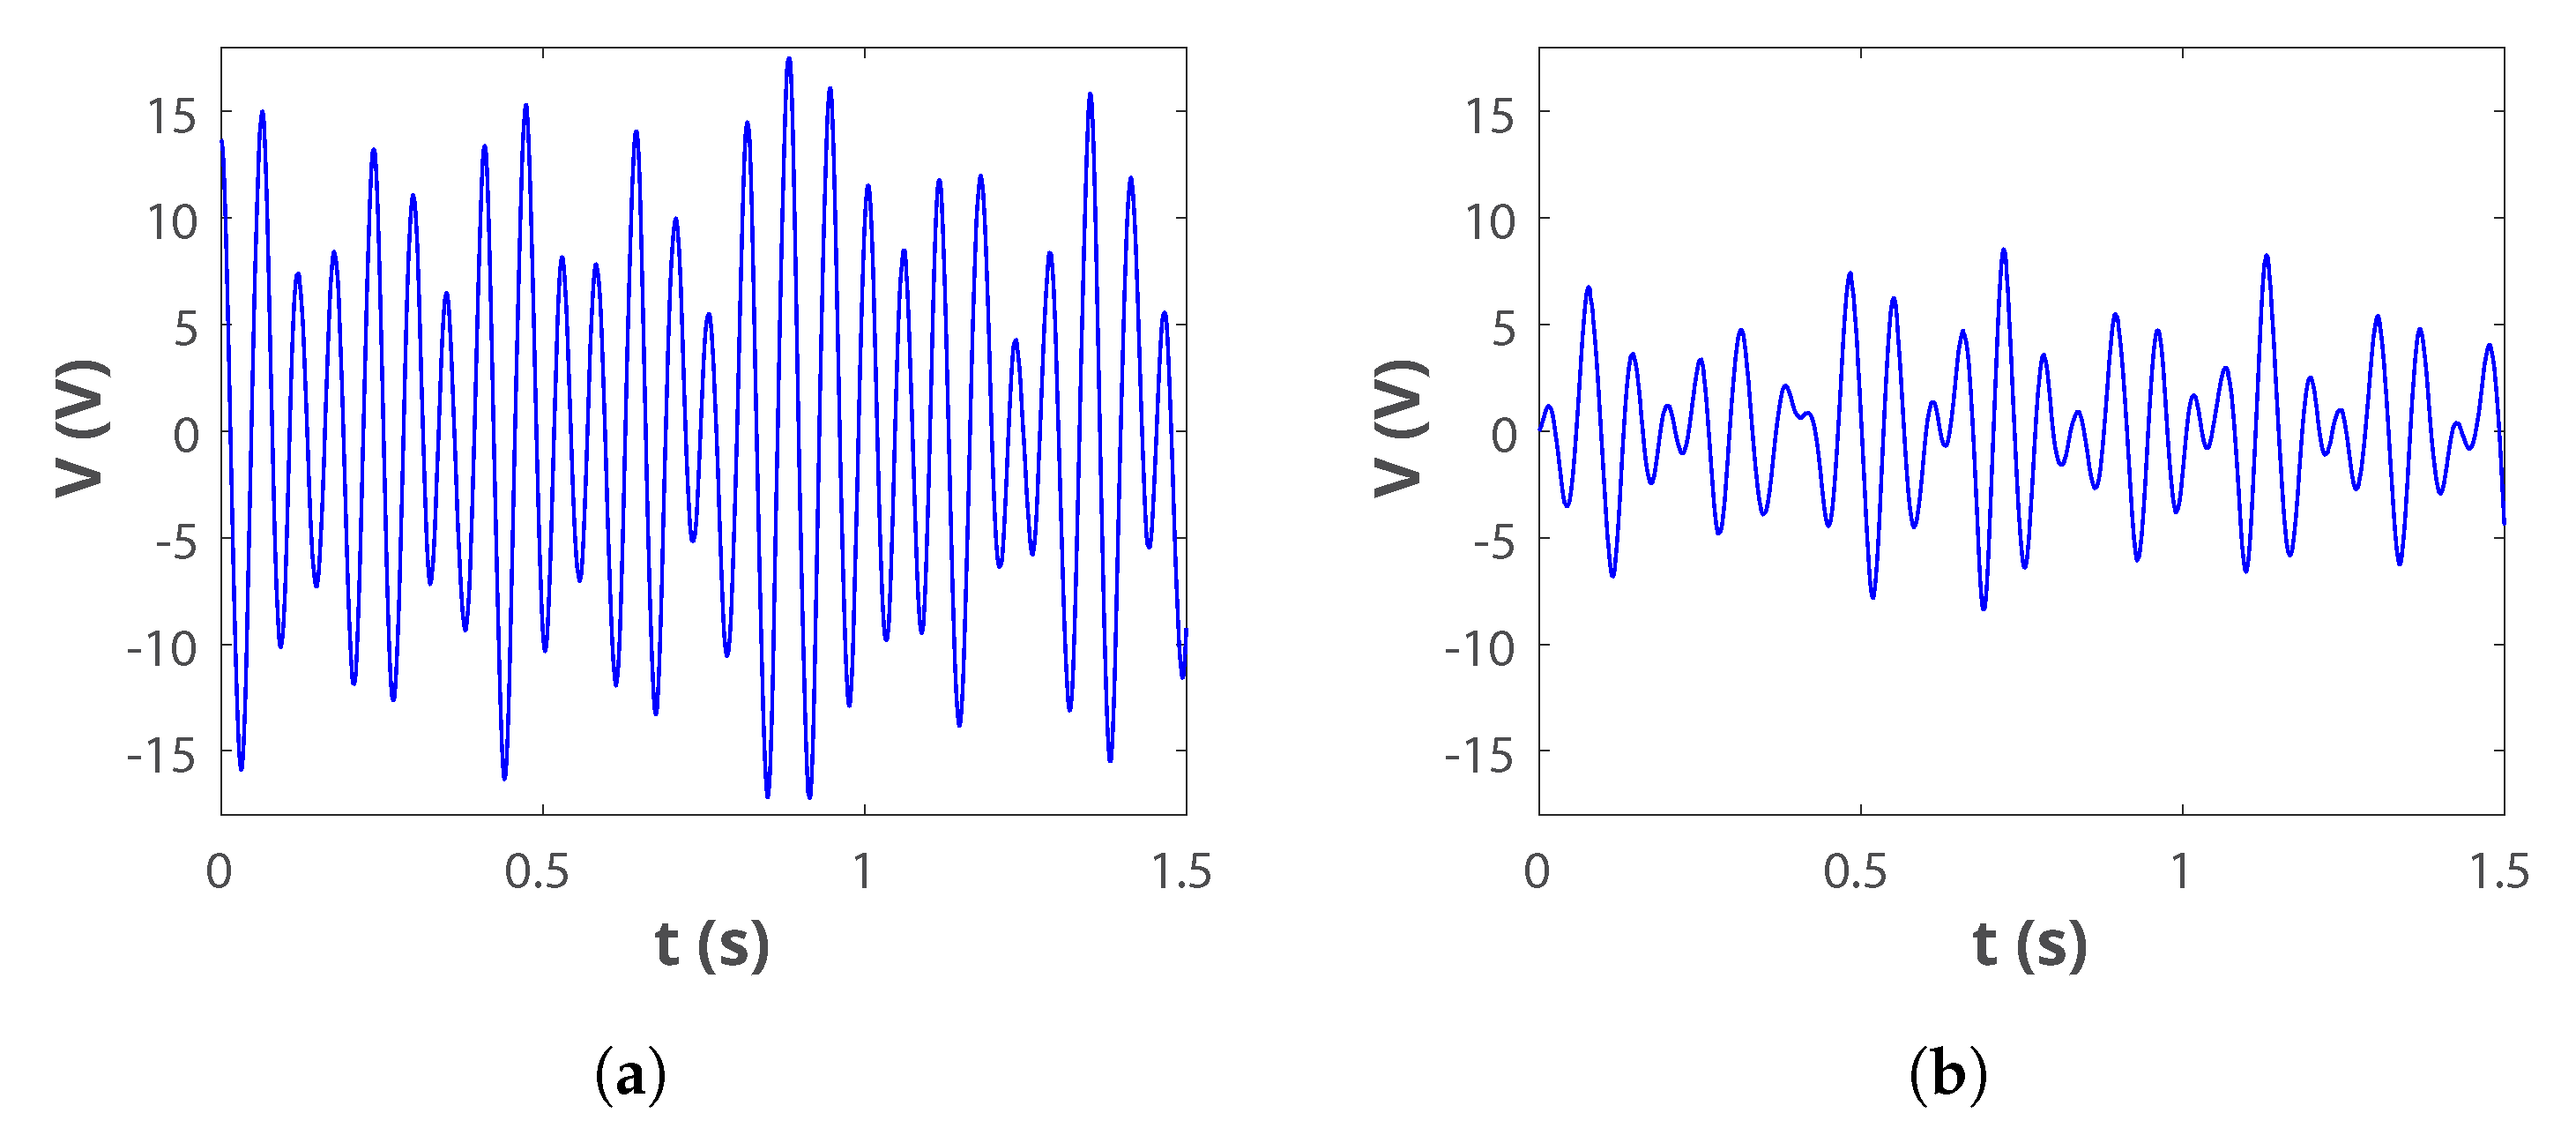
The majority of EH PMICs available in the market are specifically designed for solar photovoltaic (PV), thermoelectric (TE), and piezoelectric vibrational energy harvesting (PE-VEH), with very few options specifically for EM-VEH. The input electrical conditions for which such commercial PMICs are designed are quite different from the ones for the harvester in this study. PV and TE harvesters have very low DC input voltages with relatively higher input currents, while PE-VEH features high AC voltages with lower input impedances. In contrast, the VEH-1 features a much higher AC input voltage (
Figure 6) and input impedance. The latter is due to the high number of turns in the coil of the VEH-1 design, which makes the coil resistance (
) and inductance (
) in the typical dynamic electrical model of an EM-VEH harvester (shown in
Figure 9) high. In this study, they were measured to be 3840
/282 mH. This is larger than the usual few ohms/milli-henries in typical EM-VEH designs [
24]. This fact makes the implementation of an MPPT strategy vital and particularly difficult, since the high input impedance yields a more unstable input DC voltage.
Another challenge is that even the few PMICs in the market that are suited for EM-VEH do not implement an adequate MPPT strategy. Theoretically, MPPT involves matching the impedance of the load observed by the harvester to that of the harvester. Commercially, this is typically achieved by well-known algorithms such as perturb-and-observe, which adjusts the input voltage until the measured input power is maximised. MPPT was originally proposed for PV energy transfer [
25], and has not been deeply explored for EM-VEH in general.
To overcome these challenges, the PM in this study has been implemented by adapting commercially available solutions to the special conditions of the VEH-1 harvester. A commercial survey revealed the most suitable commercial PMICs for this EM-VEH application to be the BQ25570 by TI [
26], the LT3331 by ADI [
27], and the SPV1050 by ST [
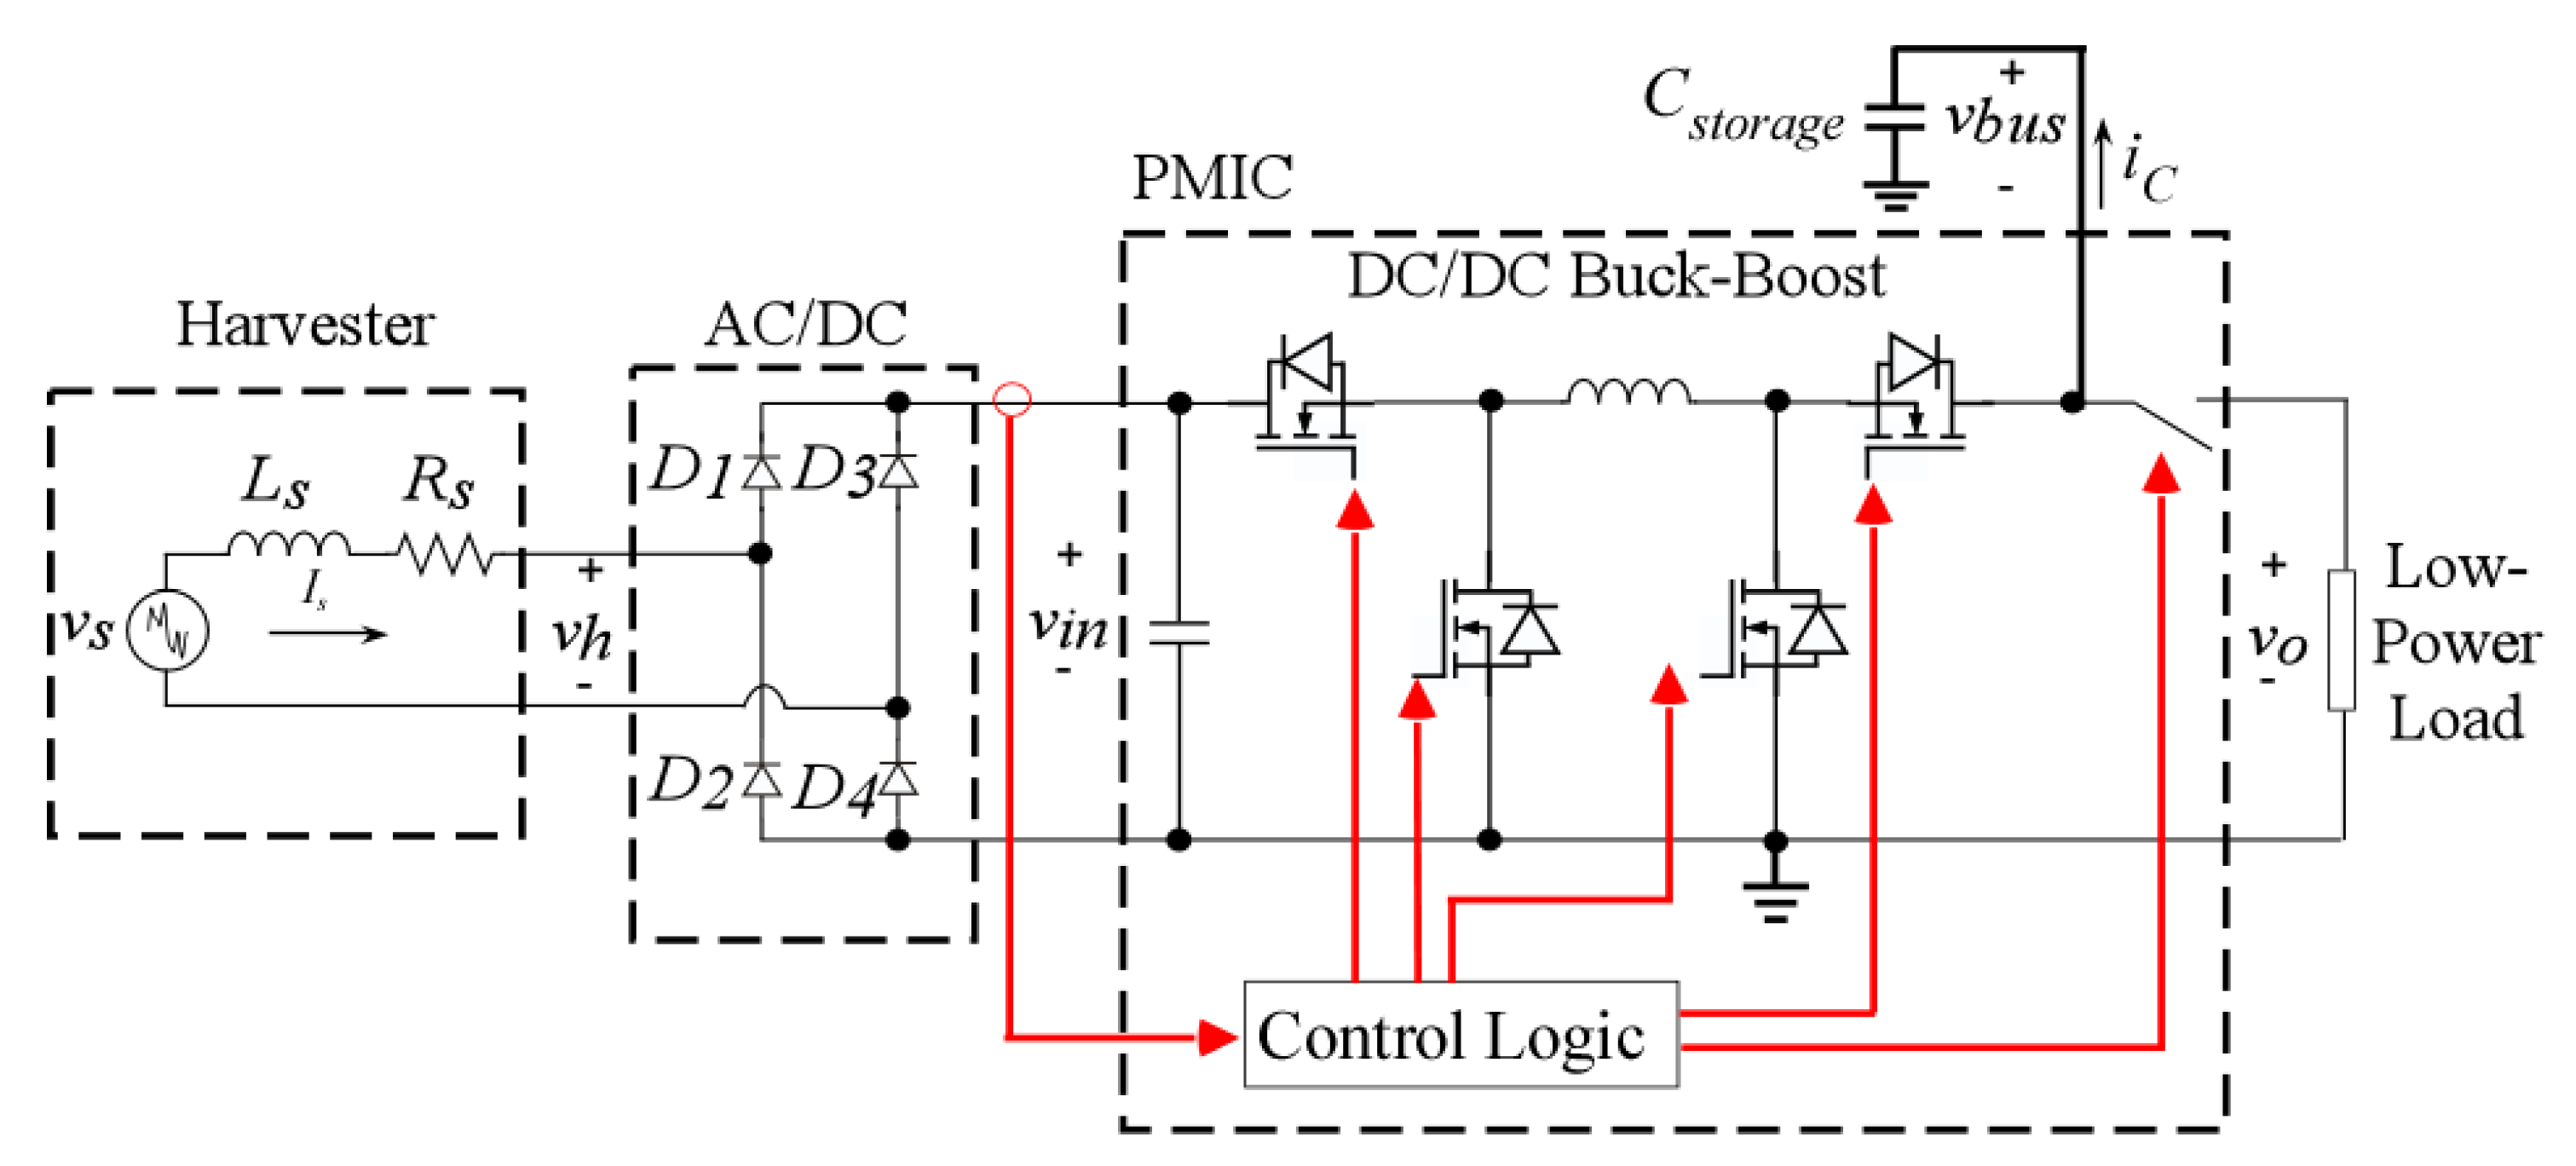
28]. A schematic of the PM strategy that was finally used in this work is introduced in
Figure 9, and the basic features of the system are detailed next.
The first stage in the PM is front-end AC-to-DC energy conversion. Several PM methods have been proposed in the literature on EM-VEH; from which the synchronous active rectifier is one of the most efficient strategies, while also providing further regulation [
29]. However, this technology has not matured enough yet to be found in commercial PMICs. Another form of active rectification is the Negative Voltage Converter (NVC)—a bridge rectifier implemented with MOSFETs (and an active diode) that reduces the device voltage drop, when compared against using a diode rectifier [
30].
These solutions are based on the idea that EM-VEH produces AC voltages of peak values less than 1 V [
9], which is true for traditional harvesters of this type. However, the VEH-1 is able to deliver higher voltages (open circuit peak voltage
= 17 V,
Figure 6a) in this particular application. Experimental work confirmed that the use of an NVC presented no particular advantage when compared to a (Schottky) Diode Bridge Rectifier (DBR), which was finally chosen as seen in
Figure 9. The rectified version of the harvester voltage
in
Figure 6a, measured across a filter capacitor, is
and it has an average value of 15 VDC. This average open-circuit value is less than
= 17 V (
Figure 6a) because the input signal is not perfectly sinusoidal. In addition, the value of
is further reduced due to the forward voltage drop caused by the rectifiers (of <240 mV per diode due to the very low input current).
The second stage in the PM implements DC-to-DC voltage regulation. Again, due to the very low voltage outputs of traditional EM-VEH devices, the most common topology for DC-to-DC conversion in several commercial PMICs is a boost converter [
31], usually rated for 5 V, which is not adequate for the voltage range of the VEH-1 (∼17 V in
Section 3.2). Instead, the PM technique in
Figure 9 implements DC-to-DC buck-boost conversion (allowing input voltages up to 20 VDC). This conversion circuit has to be controlled with an adequate MPPT strategy.
The proposed PM technique in
Figure 9 realises an MPPT from the harvesting source that stores the energy in a super-capacitor
, and delivers regulated 3.7 VDC to the low-power load. This output voltage was chosen following the maximum level admissible in the range of the loads (
Section 4). As soon as the harvester source is connected, the system goes through several intervals that will be presented next to complement the understanding of the PM strategy.
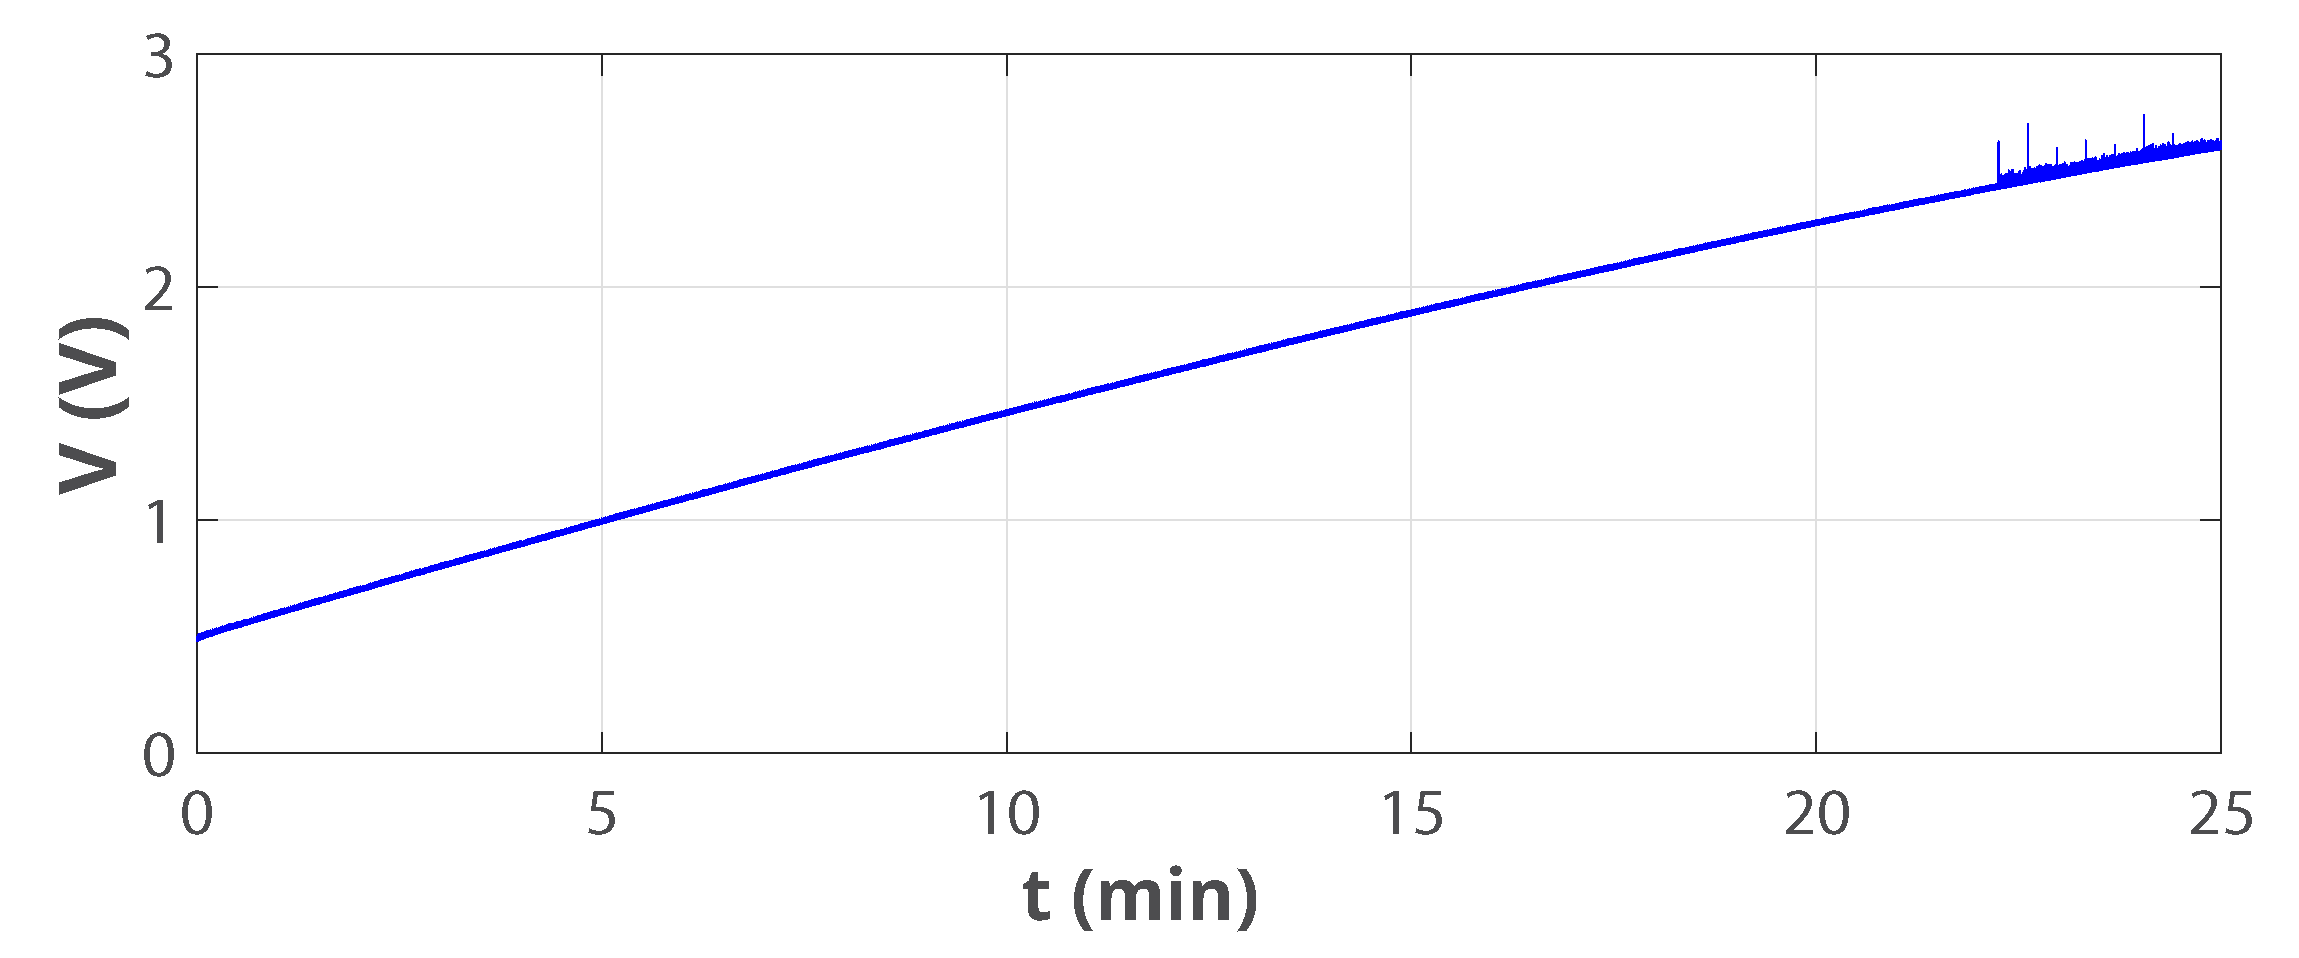
5.1. Cold-Start Interval
The (rectified) input from the harvester
is directly connected to the storage device
so that
during the cold-start interval
, which runs for:
.
and
are, respectively, the minimum input rectified voltage, and an end-of-charge voltage level which is defined by the PMIC in use. In this study:
= 150 mV and
= 2.6 V.
Figure 10 shows the bus voltage on the storage super-capacitor during cold-start. It took around 22 min for
to charge to
under the excitation detailed in
Figure 5.
5.2. Switching Interval
During the switching interval after the bus voltage has reached , the internal buck-boost DC-to-DC converter of the PMIC operates according to the MPPT algorithm: the converter will stop switchinxg for a period every certain time . In this study = 400 ms and = 16 s.
During
,
is allowed to reach its open-circuit voltage
15 V (maximum harvester voltage), in order to record this level. Once this interval is elapsed, the converter operates again, setting its own impedance such that
stays as close as possible to the (previously) programmed maximum power point voltage
, which is a percentage (
) of
, such that:
The ideal
for EH using PV panels and Thermoelectric Generators (TEGs) is well identified in the literature to be around 50% and 80% of
, respectively [
23]. For EM-VEH, however, there is no general agreement.
A particular analytical description of the ideal
for the VEH-1 can be developed by recognising that, in the dynamical electrical model of the harvester (as in any other electrical system), the inductive impedance of the coil
is negligible if it is at least 10 times smaller than its resistive impedance
i.e.,
, for a single-mode excitation of frequency
. In the VEH-1,
is negligible for excitation frequencies smaller than 611.15 Hz, which is between the expected range for the experiments in this paper (in
Figure 5), and so the equivalent series impedance of the harvester block in
Figure 9 is simply
.
If a resistive load
is connected across the harvester, maximum power occurs when the impedance of the load matches that of the input source (
), so the conditions for maximum power transfer when this harvester is single-frequency excited are:
where
is the peak voltage across the load observed by the harvester. This load is determined by the MPPT operation of the PMIC in the circuit of
Figure 9 by which effectively
is kept at a constant value
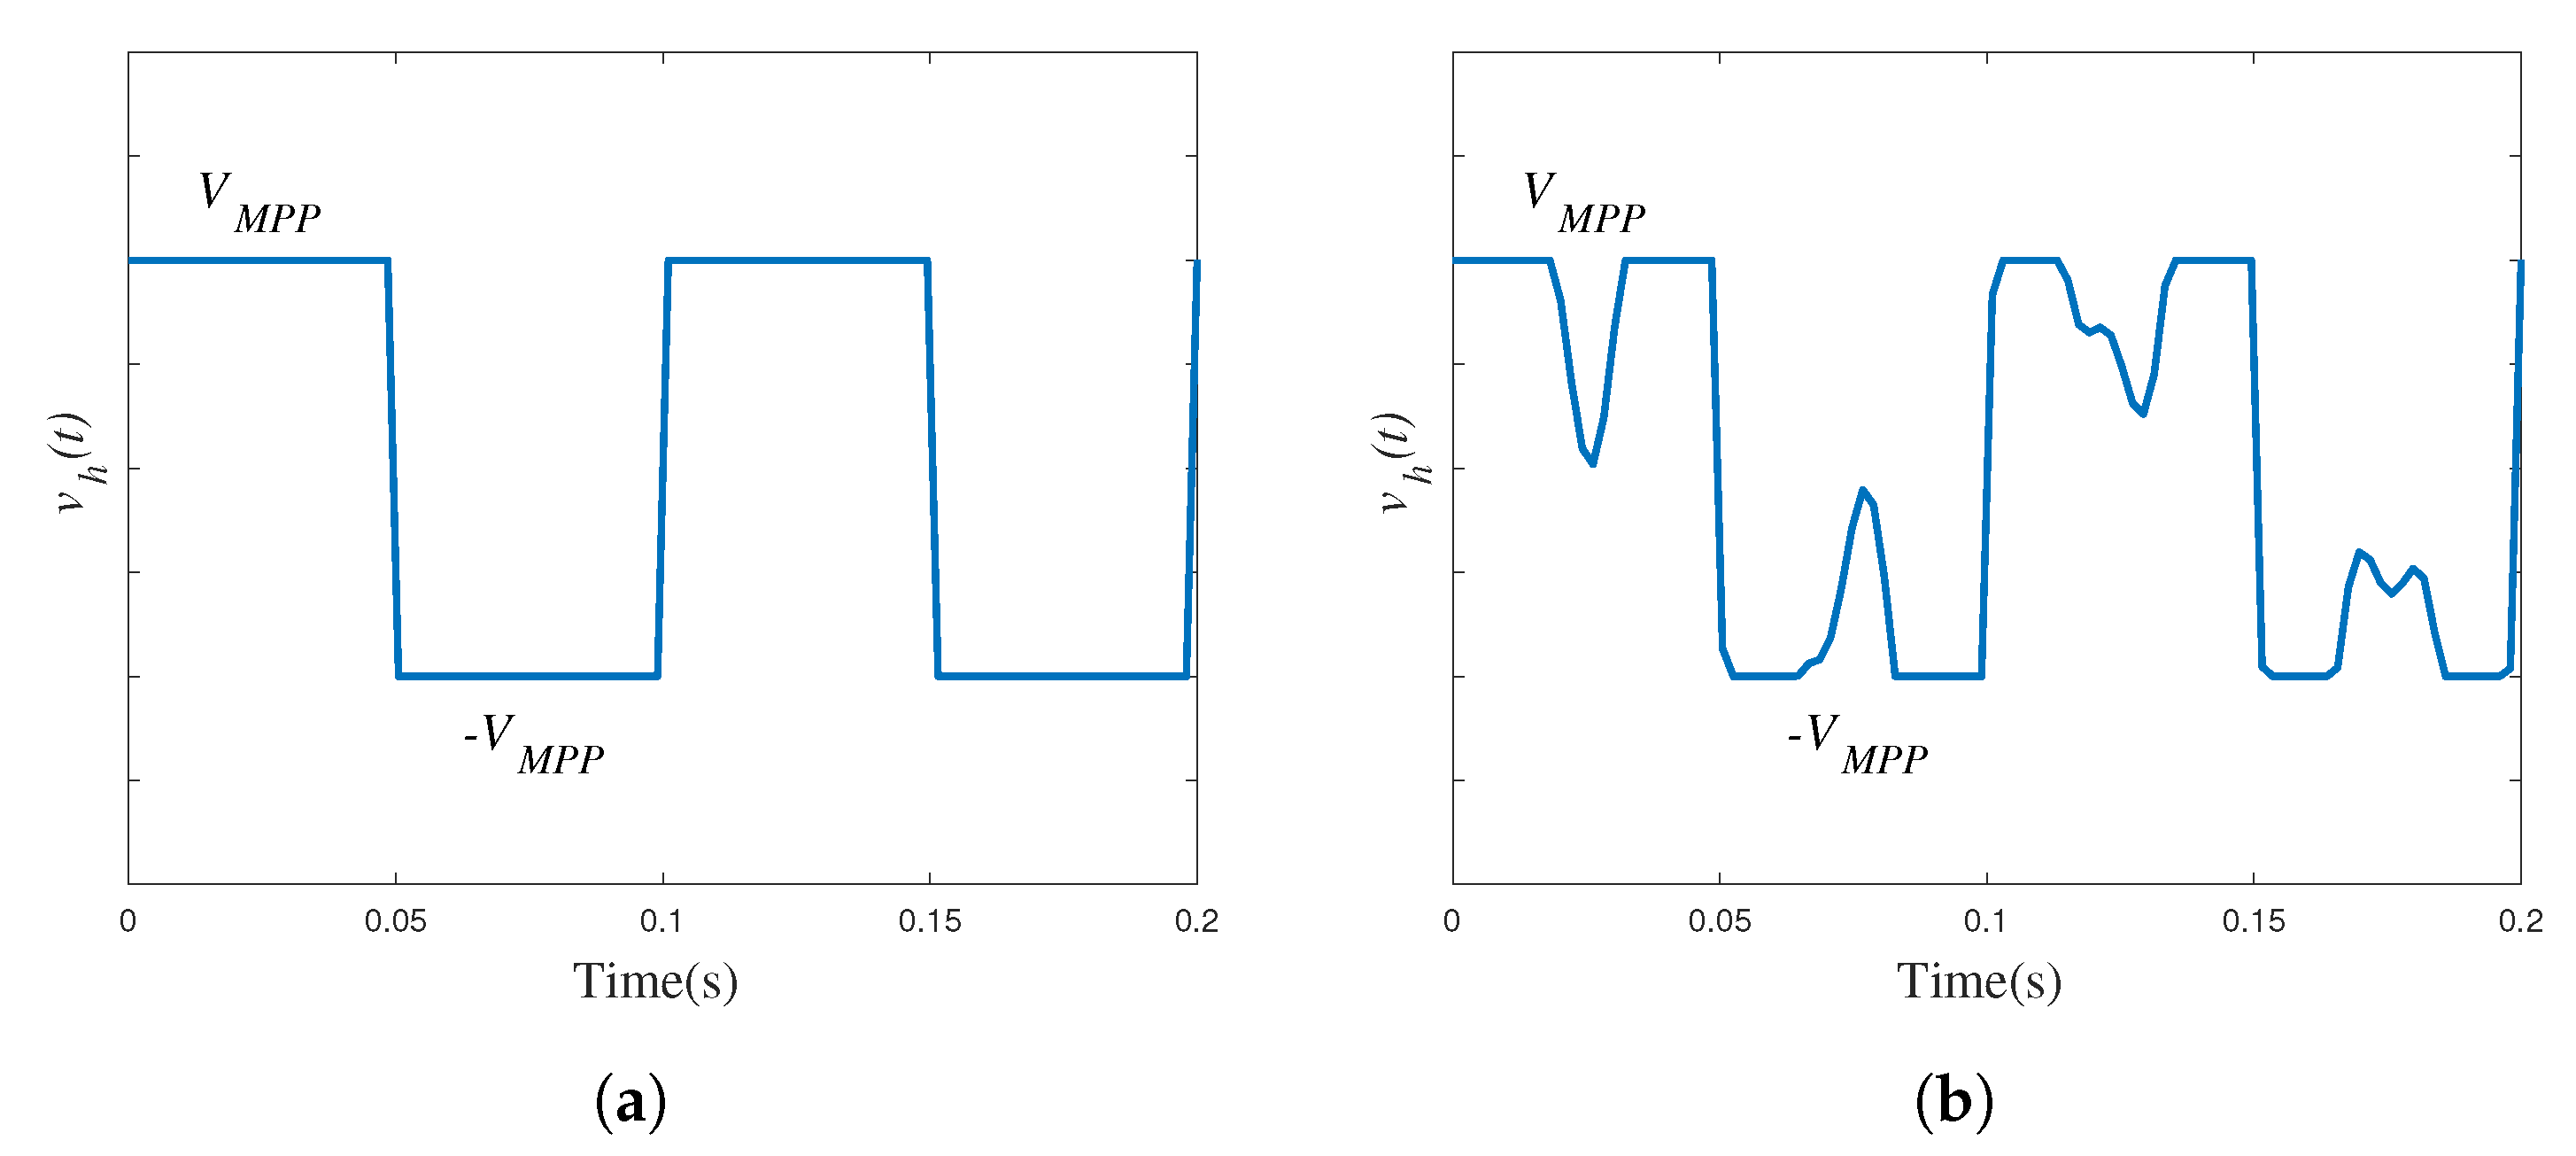
, and the shape of
(the voltage reflected into the AC-side of the DBR) is as in
Figure 11a.
This shape is close to a square waveform, which, according to its Fourier analysis, has a fundamental amplitude of:
Approximately, the peak voltage in Equation (
4) is observed by the harvester. Therefore, for a single-mode excitation, the MPPT conditions in Equation (3) dictate that under MPPT:
, and so:
This analysis shows that, if the harvester is single-frequency excited, the ideal is around 39%.
In reality, the VEH-1 cannot be represented by a single-frequency sinusoid, but instead it is a composition of different
h harmonics:
. For this input, it can be proved that the power in a resistive load
(again, considering
negligible) is
. It follows that the conditions for MPPT in Equations (
2) and (3) still apply. However, in multi-modal excitation, the shape of
cannot be expected to be perfectly square anymore. An example of the shape of a multi-frequency, rectified waveform observed experimentally is presented in
Figure 11b. For that shape, the peak of the fundamental sinusoid observed at the input of the PMIC is less than
(since the Fourier coefficients are calculated by integral analysis). Consequently,
will have to be slightly higher than in Equation (
5) and it can be said with some level of certainty that, for the multi-frequency VEH-1 harvester, the ideal
is expected to be larger than 39%. How large it will be will depend on how distorted the input voltage
is with respect to a square signal.
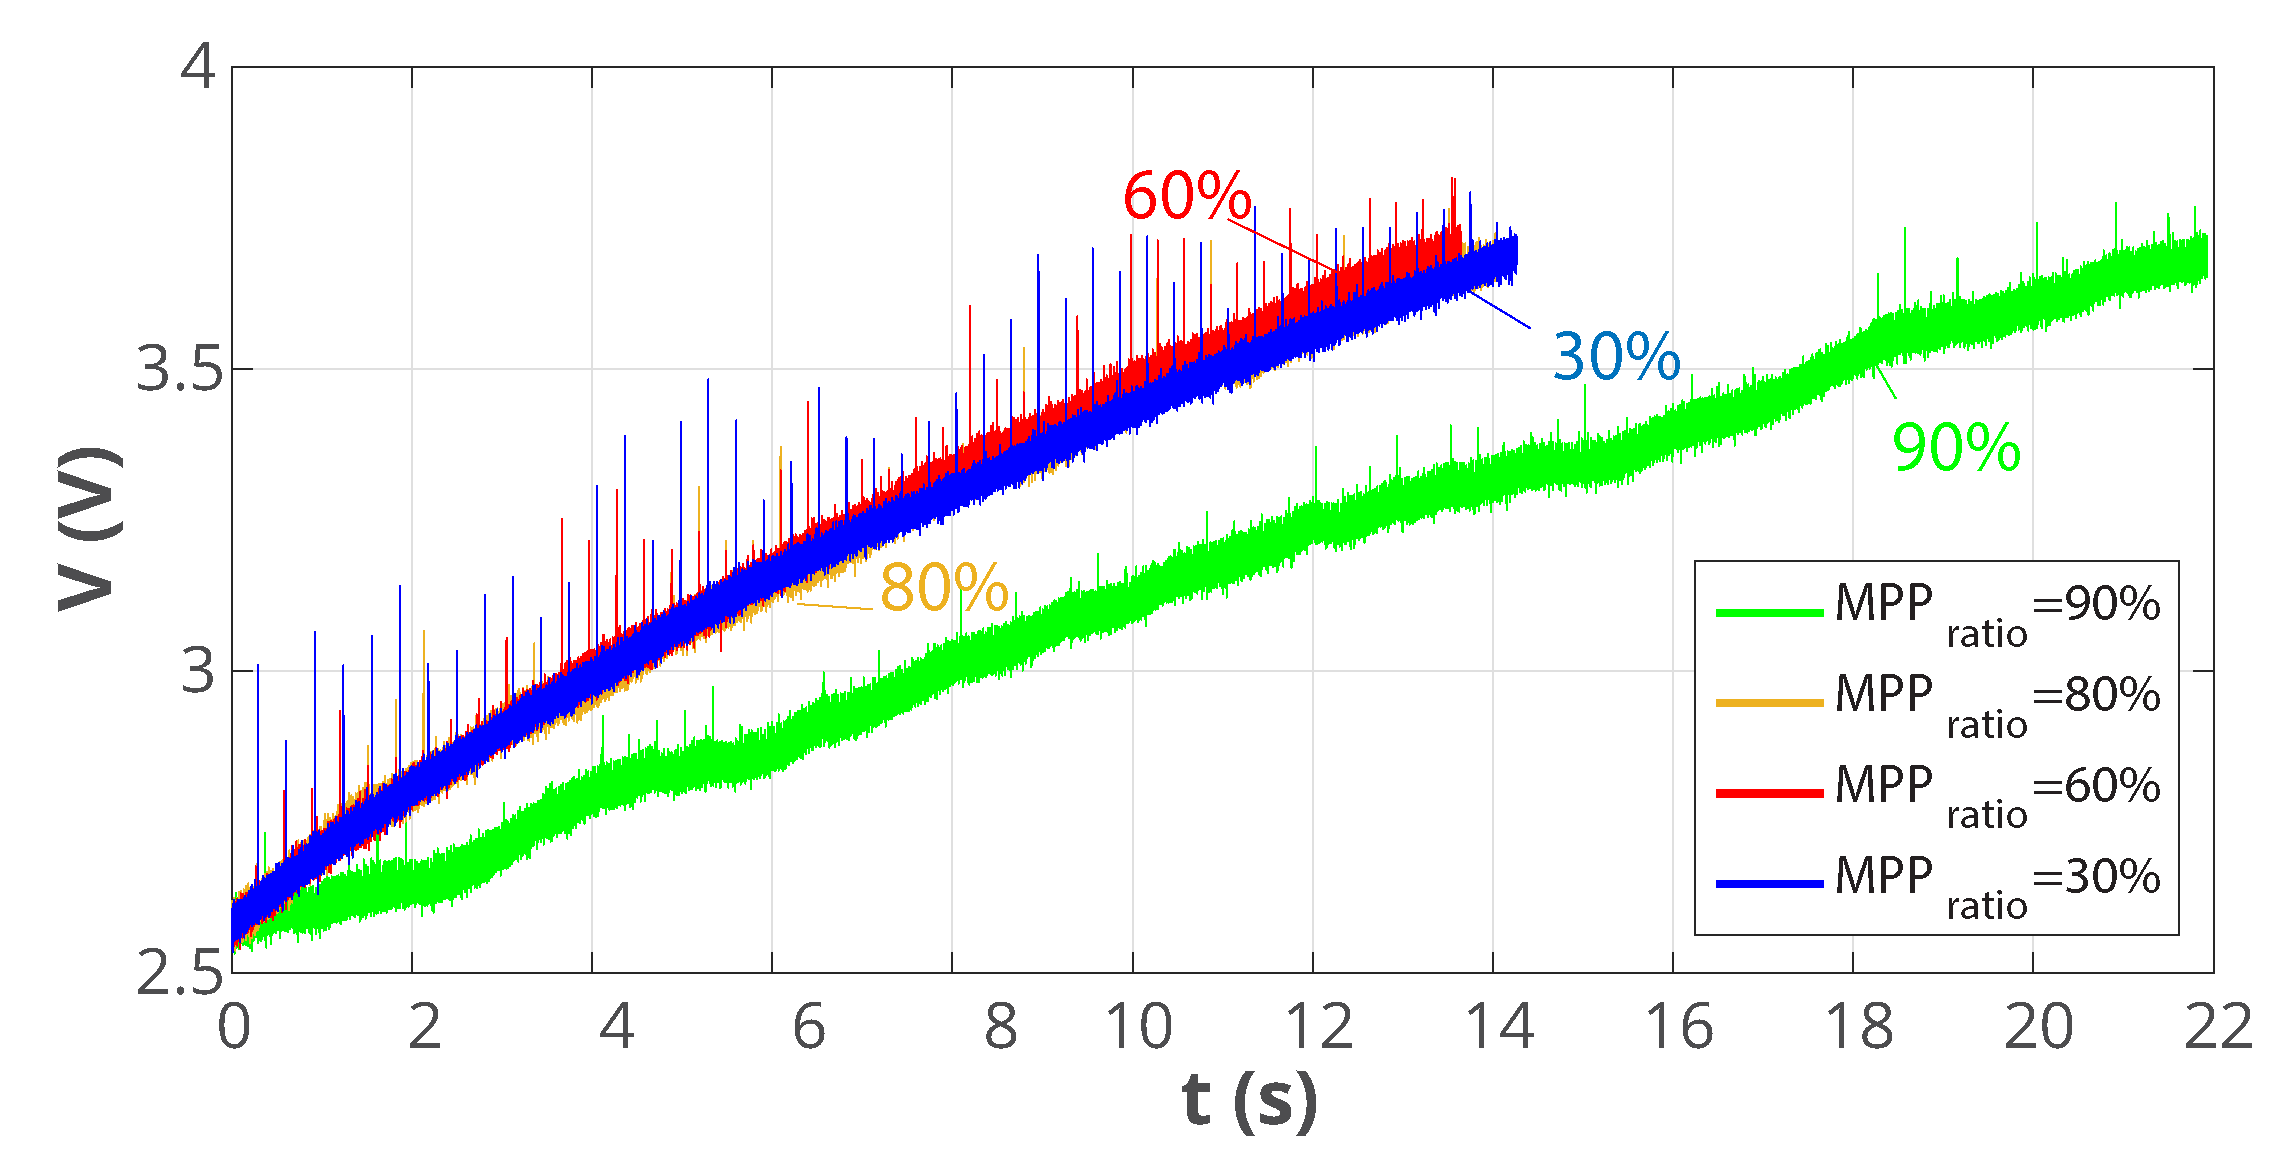
This ratio was ultimately identified experimentally.
Figure 12 shows the bus voltage during the switching interval, for different MPP ratios, in the real experiment. The results show that the optimal
is around 60%, so this is the value to be programmed in the PMIC.
5.3. Operational Interval
Once
across the storage device rises above
(around 3.6 V as defined in
Section 4), an internal output switch of the PMIC closes, making
, so the energy in
is finally transferred to the load, and thus starting the operational interval
.
During this interval, the DC-to-DC converter is enabled/disabled intermittently such that remains close to 3.6 VDC based on internally-defined hysteresis levels. Furthermore, an undervoltage protection opens the output switch when falls below a lower threshold level of 2 V, hence returning to either cold-start or switching modes, depending on the voltage drop. The value of = 0.1 F was designed considering this behaviour.
The response of this particular interval is unique for each one of the loads described in
Section 4, and the results are reported in the next section.


