Wavelet-Based Analysis of Physical Activity and Sleep Movement Data from Wearable Sensors among Obese Adults


Abstract
1. Introduction
2. Materials and Methods
3. Results
4. Discussion
5. Limitations
6. Conclusions
Author Contributions
Funding
Acknowledgments
Conflicts of Interest
References
- Yang, L.; Colditz, G.A. Prevalence of Overweight and Obesity in the United States, 2007–2012. JAMA Intern. Med. 2015, 175, 1412–1413. [Google Scholar] [CrossRef] [PubMed]
- Finkelstein, E.A.; Trogdon, J.G.; Cohen, J.W.; Dietz, W. Annual medical spending attributable to obesity: Payer-and service-specific estimates. Health Aff. 2009, 28, w822–w831. [Google Scholar] [CrossRef] [PubMed]
- Finkelstein, E.A.; Khavjou, O.A.; Thompson, H.; Trogdon, J.G.; Pan, L.; Sherry, B.; Dietz, W. Obesity and severe obesity forecasts through 2030. Am. J. Prev. Med. 2012, 42, 563–570. [Google Scholar] [CrossRef] [PubMed]
- Wang, Y.C.; McPherson, K.; Marsh, T.; Gortmaker, S.L.; Brown, M. Health and economic burden of the projected obesity trends in the USA and the UK. Lancet 2011, 378, 815–825. [Google Scholar] [CrossRef]
- World Health Organization. Global Health Observatory (GHO) Data 2018; World Health Organization: Geneva, Switzerland, 2018. [Google Scholar]
- Klein, S.; Burke, L.E.; Bray, G.A.; Blair, S.; Allison, D.B.; Pi-Sunyer, X.; Hong, Y.; Eckel, R.H.; American Heart Association Council on Nutrition, Physical Activity, and Metabolism. Clinical implications of obesity with specific focus on cardiovascular disease: A statement for professionals from the American Heart Association Council on Nutrition, Physical Activity, and Metabolism: Endorsed by the American College of Cardiology Foundation. Circulation 2004, 110, 2952–2967. [Google Scholar]
- Global Burden of Metabolic Risk Factors for Chronic Diseases Collaboration; Lu, Y.; Hajifathalian, K.; Ezzati, M.; Woodward, M.; Rimm, E.B.; Danaei, G. Metabolic mediators of the effects of body-mass index, overweight, and obesity on coronary heart disease and stroke: A pooled analysis of 97 prospective cohorts with 1.8 million participants. Lancet 2014, 383, 970–983. [Google Scholar]
- McGee, D.L.; Diverse Populations Collaboration. Body mass index and mortality: A meta-analysis based on person-level data from twenty-six observational studies. Ann. Epidemiol. 2005, 15, 87–97. [Google Scholar] [CrossRef]
- Must, A.; Spadano, J.; Coakley, E.H.; Field, A.E.; Colditz, G.; Dietz, W.H. The disease burden associated with overweight and obesity. JAMA 1999, 282, 1523–1529. [Google Scholar] [CrossRef]
- NCD Risk Factor Collaboration. Worldwide trends in body-mass index, underweight, overweight, and obesity from 1975 to 2016: A pooled analysis of 2416 population-based measurement studies in 128.9 million children, adolescents, and adults. Lancet 2017, 390, 2627–2642. [Google Scholar] [CrossRef]
- Adams, K.F.; Schatzkin, A.; Harris, T.B.; Kipnis, V.; Mouw, T.; Ballard-Barbash, R.; Hollenbeck, A.; Leitzmann, M.F. Overweight, Obesity, and Mortality in a Large Prospective Cohort of Persons 50 to 71 Years Old. N. Engl. J. Med. 2006, 355, 763–778. [Google Scholar] [CrossRef]
- Sarma, S.; Zaric, G.S.; Campbell, M.K.; Gilliland, J. The effect of physical activity on adult obesity: Evidence from the Canadian NPHS panel. Econ. Hum. Biol. 2014, 14, 1–21. [Google Scholar] [CrossRef]
- Haskell, W.L.; Lee, I.M.; Pate, R.R.; Powell, K.E.; Blair, S.N.; Franklin, B.A.; Macera, C.A.; Heath, G.W.; Thompson, P.D.; Bauman, A. Physical activity and public health: Updated recommendation for adults from the American College of Sports Medicine and the American Heart Association. Med. Sci. Sports Exerc. 2007, 39, 1423–1434. [Google Scholar] [CrossRef]
- Flegal, K.M.; Carroll, M.D.; Kuczmarski, R.J.; Johnson, C.L. Overweight and obesity in the United States: Prevalence and trends, 1960–1994. Int. J. Obes. Relat. Metab. Disord. 1998, 22, 39–47. [Google Scholar] [CrossRef]
- Hedley, A.A.; Ogden, C.L.; Johnson, C.L.; Carroll, M.D.; Curtin, L.R.; Flegal, K.M. Prevalence of overweight and obesity among US children, adolescents, and adults, 1999–2002. JAMA 2004, 291, 2847–2850. [Google Scholar] [CrossRef]
- Kuczmarski, R.J.; Flegal, K.M.; Campbell, S.M.; Johnson, C.L. Increasing prevalence of overweight among US adults. The National Health and Nutrition Examination Surveys, 1960 to 1991. JAMA 1994, 272, 205–211. [Google Scholar] [CrossRef]
- Laskowski, E.R. The role of exercise in the treatment of obesity. PM R 2012, 4, 840–844. [Google Scholar] [CrossRef]
- Tudor-Locke, C.; Bassett, D.R. How Many Steps/Day Are Enough? Sports Med. 2004, 34, 1–8. [Google Scholar] [CrossRef]
- Buman, M.P.; Hekler, E.B.; Haskell, W.L.; Pruitt, L.; Conway, T.L.; Cain, K.L.; Sallis, J.F.; Saelens, B.E.; Frank, L.D.; King, A.C. Objective light-intensity physical activity associations with rated health in older adults. Am. J. Epidemiol. 2010, 172, 1155–1165. [Google Scholar] [CrossRef]
- Healy, G.N.; Dunstan, D.W.; Salmon, J.; Cerin, E.; Shaw, J.E.; Zimmet, P.Z.; Owen, N. Objectively measured light-intensity physical activity is independently associated with 2-h plasma glucose. Diabetes Care 2007, 30, 1384–1389. [Google Scholar] [CrossRef]
- Healy, G.N.; Matthews, C.E.; Dunstan, D.W.; Winkler, E.A.; Owen, N. Sedentary time and cardio-metabolic biomarkers in US adults: NHANES 2003–06. Eur. Heart J. 2011, 32, 590–597. [Google Scholar] [CrossRef]
- Thorp, A.A.; Owen, N.; Neuhaus, M.; Dunstan, D.W. Sedentary behaviors and subsequent health outcomes in adults a systematic review of longitudinal studies, 1996–2011. Am. J. Prev. Med. 2011, 41, 207–215. [Google Scholar] [CrossRef]
- Katzmarzyk, P.T.; Church, T.S.; Craig, C.L.; Bouchard, C. Sitting time and mortality from all causes, cardiovascular disease, and cancer. Med. Sci. Sports Exerc. 2009, 41, 998–1005. [Google Scholar] [CrossRef]
- Patel, S.R.; Hu, F.B. Short sleep duration and weight gain: A systematic review. Obesity 2008, 16, 643–653. [Google Scholar] [CrossRef]
- Cappuccio, F.P.; Cooper, D.; D’Elia, L.; Strazzullo, P.; Miller, M.A. Sleep duration predicts cardiovascular outcomes: A systematic review and meta-analysis of prospective studies. Eur. Heart J. 2011, 32, 1484–1492. [Google Scholar] [CrossRef]
- Gangwisch, J.E.; Heymsfield, S.B.; Boden-Albala, B.; Buijs, R.M.; Kreier, F.; Pickering, T.G.; Rundle, A.G.; Zammit, G.K.; Malaspina, D. Sleep duration as a risk factor for diabetes incidence in a large U.S. sample. Sleep 2007, 30, 1667–1673. [Google Scholar] [CrossRef]
- Patel, S.R. Reduced sleep as an obesity risk factor. Obes. Rev. 2009, 10 (Suppl. 2), 61–68. [Google Scholar] [CrossRef]
- Bassett, D.R., Jr.; Rowlands, A.; Trost, S.G. Calibration and validation of wearable monitors. Med. Sci. Sports Exerc. 2012, 44 (Suppl. 1), S32–S38. [Google Scholar] [CrossRef]
- Sadeh, A. The role and validity of actigraphy in sleep medicine: An update. Sleep Med. Rev. 2011, 15, 259–267. [Google Scholar] [CrossRef]
- Miwa, H.; Sasahara, S.; Matsui, T. Roll-over Detection and Sleep Quality Measurement using a Wearable Sensor. Conf. Proc. IEEE Eng. Med. Biol. Soc. 2007, 2007, 1507–1510. [Google Scholar]
- Lee, J.M.; Byun, W.; Keill, A.; Dinkel, D.; Seo, Y. Comparison of Wearable Trackers‘ Ability to Estimate Sleep. Int. J. Environ. Res. Public Health 2018, 15, 1265. [Google Scholar] [CrossRef]
- Peake, J.M.; Kerr, G.; Sullivan, J.P. A Critical Review of Consumer Wearables, Mobile Applications, and Equipment for Providing Biofeedback, Monitoring Stress, and Sleep in Physically Active Populations. Front. Physiol. 2018, 9, 743. [Google Scholar] [CrossRef]
- Jalloul, N. Wearable sensors for the monitoring of movement disorders. Biomed. J. 2018, 41, 249–253. [Google Scholar] [CrossRef]
- Cooper, C.; Gross, A.; Brinkman, C.; Pope, R.; Allen, K.; Hastings, S.; Bogen, B.E.; Goode, A.P. The impact of wearable motion sensing technology on physical activity in older adults. Exp. Gerontol. 2018, 112, 9–19. [Google Scholar] [CrossRef]
- Buman, M.P.; King, A.C. Exercise as a Treatment to Enhance Sleep. Am. J. Lifestyle Med. 2010, 4, 500–514. [Google Scholar] [CrossRef]
- Lockhart, T.E.; Soangra, R.; Zhang, J.; Wu, X. Wavelet based automated postural event detection and activity classification with single imu-biomed 2013. Biomed. Sci. Instrum. 2013, 49, 224–233. [Google Scholar]
- Soangra, R.; Lockhart, T.E. A comparative study for performance evaluation of sit-to-stand task with body worn sensor and existing laboratory methods. Biomed. Sci. Instrum. 2012, 48, 407–414. [Google Scholar]
- Thompson, D.; Edelsberg, J.; Kinsey, K.L.; Oster, G. Estimated economic costs of obesity to U.S. business. Am. J. Health Promot. 1998, 13, 120–127. [Google Scholar] [CrossRef]
- Tomlinson, D.J.; Erskine, R.M.; Morse, C.I.; Winwood, K.; Onambélé-Pearson, G. The impact of obesity on skeletal muscle strength and structure through adolescence to old age. Biogerontology 2016, 17, 467–483. [Google Scholar] [CrossRef]
- Gadducci, A.V.; de Cleva, R.; Santarém, G.C.D.; Silva, P.R.S.; Greve, J.M.D.; Santo, M.A. Muscle strength and body composition in severe obesity. Clinics 2017, 72, 272–275. [Google Scholar] [CrossRef]
- Chomistek, A.K.; Shiroma, E.J.; Lee, I.M. The Relationship Between Time of Day of Physical Activity and Obesity in Older Women. J. Phys. Act. Health 2016, 13, 416–418. [Google Scholar] [CrossRef]
- Teasdale, N.; Simoneau, M.; Corbeil, P.; Handrigan, G.; Tremblay, A.; Hue, O. Obesity Alters Balance and Movement Control. Curr. Obes. Rep. 2013, 2, 235–240. [Google Scholar] [CrossRef]
- Beccuti, G.; Pannain, S. Sleep and obesity. Curr. Opin. Clin. Nutr. Metab. Care 2011, 14, 402–412. [Google Scholar] [CrossRef]
- Cooper, C.B.; Neufeld, E.V.; Dolezal, B.A.; Martin, J.L. Sleep deprivation and obesity in adults: A brief narrative review. BMJ Open Sport Exerc. Med. 2018, 4, e000392. [Google Scholar] [CrossRef]
- Pietilainen, K.H.; Kaprio, J.; Borg, P.; Plasqui, G.; Yki-Järvinen, H.; Kujala, U.M.; Rose, R.J.; Westerterp, K.R.; Rissanen, A. Physical inactivity and obesity: A vicious circle. Obesity 2008, 16, 409–414. [Google Scholar] [CrossRef]


| Parameter | Definition |
|---|---|
| Number_of_Transitions | The total number of transitions found in one sleep dataset. |
| Sleep_Hours | Total number of hours of sleep |
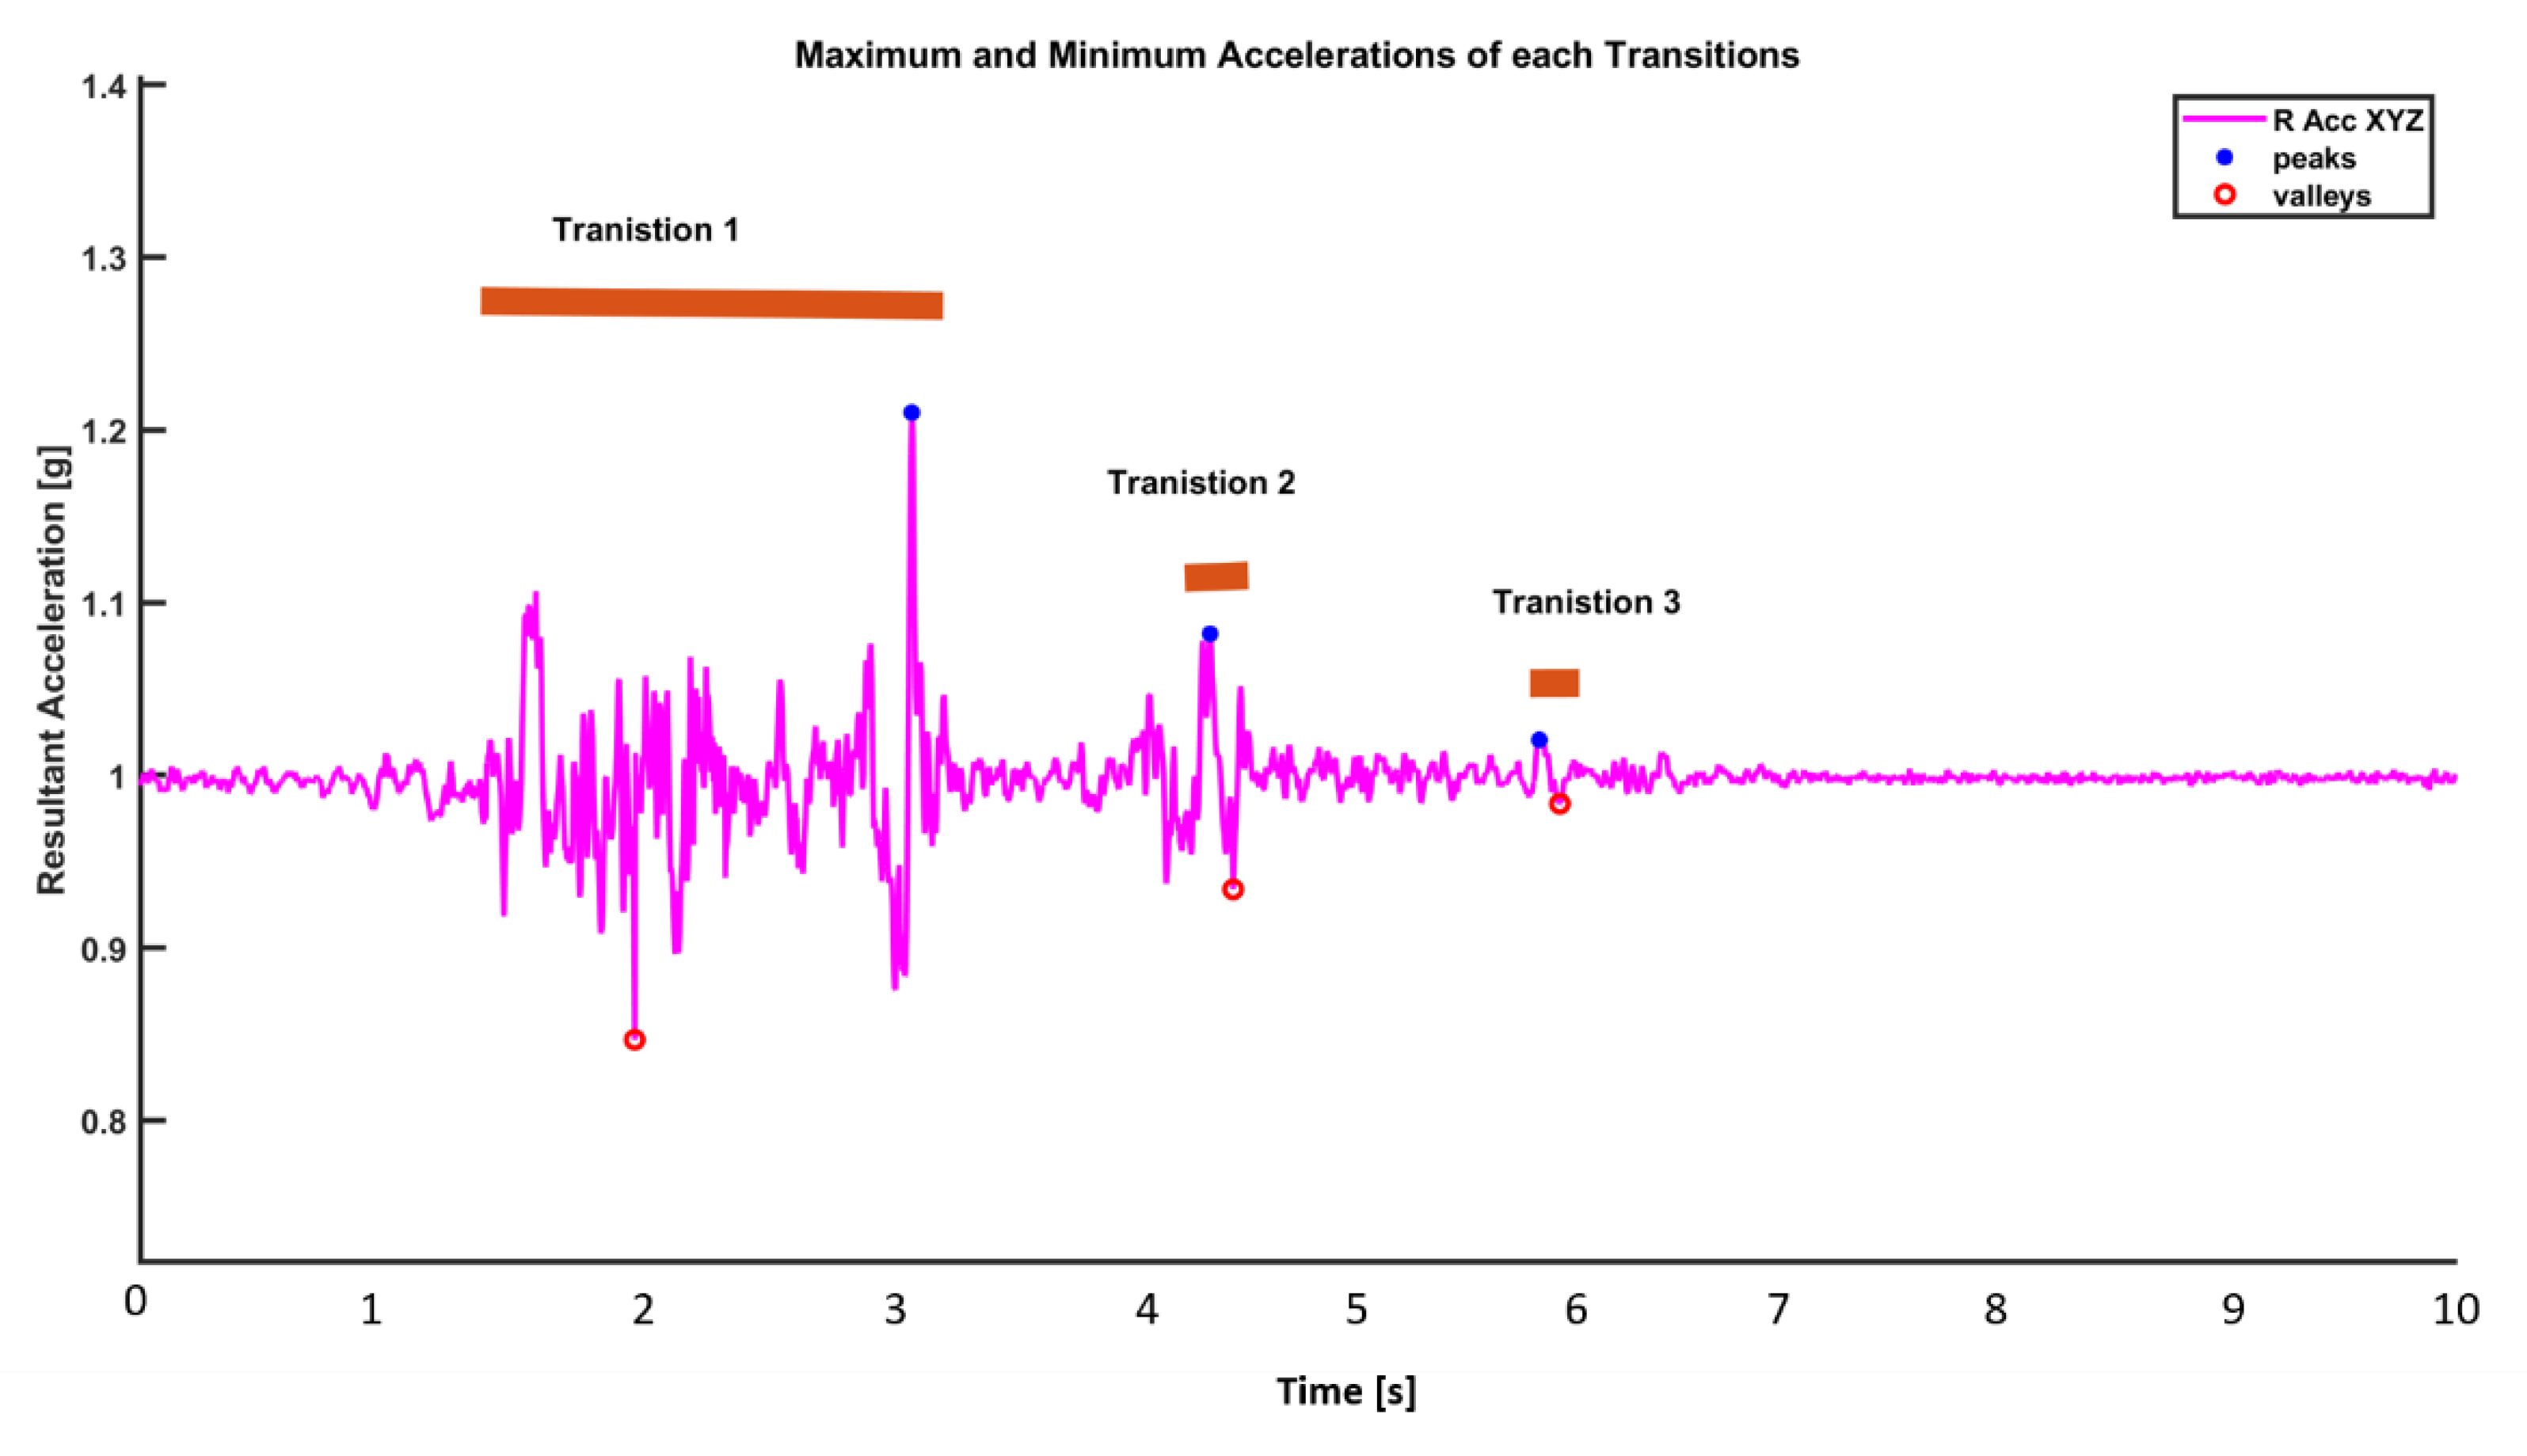
| Transition_Max_Acc | Maximum of acceleration value in each transition |
| Transition_Min_Acc | Minimum of acceleration value in each transition |
| Transition_RMS | Root mean square of acceleration during a transition |
| Transition_Range | Difference between max and min acceleration value in each transition |
| Transition_Duration | Average time for each transition |
| Total Activity Amplitude |
| Low | Medium | High | |||
|---|---|---|---|---|---|
| Mean | Standard Deviation | Mean | Standard Deviation | Mean | Standard Deviation |
| m_DRA <0.2 g | std_DRA <0.02 g | 0.2 g < m_DRA < 0.5 g | 0.02 g < std_DRA < 0.2 g | m_DRA >0.5 g | std_DRA >0.2 g |
© 2019 by the authors. Licensee MDPI, Basel, Switzerland. This article is an open access article distributed under the terms and conditions of the Creative Commons Attribution (CC BY) license (http://creativecommons.org/licenses/by/4.0/).
Share and Cite
Soangra, R.; Krishnan, V. Wavelet-Based Analysis of Physical Activity and Sleep Movement Data from Wearable Sensors among Obese Adults. Sensors 2019, 19, 3710. https://doi.org/10.3390/s19173710
Soangra R, Krishnan V. Wavelet-Based Analysis of Physical Activity and Sleep Movement Data from Wearable Sensors among Obese Adults. Sensors. 2019; 19(17):3710. https://doi.org/10.3390/s19173710
Chicago/Turabian StyleSoangra, Rahul, and Vennila Krishnan. 2019. "Wavelet-Based Analysis of Physical Activity and Sleep Movement Data from Wearable Sensors among Obese Adults" Sensors 19, no. 17: 3710. https://doi.org/10.3390/s19173710
APA StyleSoangra, R., & Krishnan, V. (2019). Wavelet-Based Analysis of Physical Activity and Sleep Movement Data from Wearable Sensors among Obese Adults. Sensors, 19(17), 3710. https://doi.org/10.3390/s19173710