Desertification Sensitivity Analysis Using MEDALUS Model and GIS: A Case Study of the Oases of Middle Draa Valley, Morocco


Abstract
1. Introduction
2. Materials and Methods
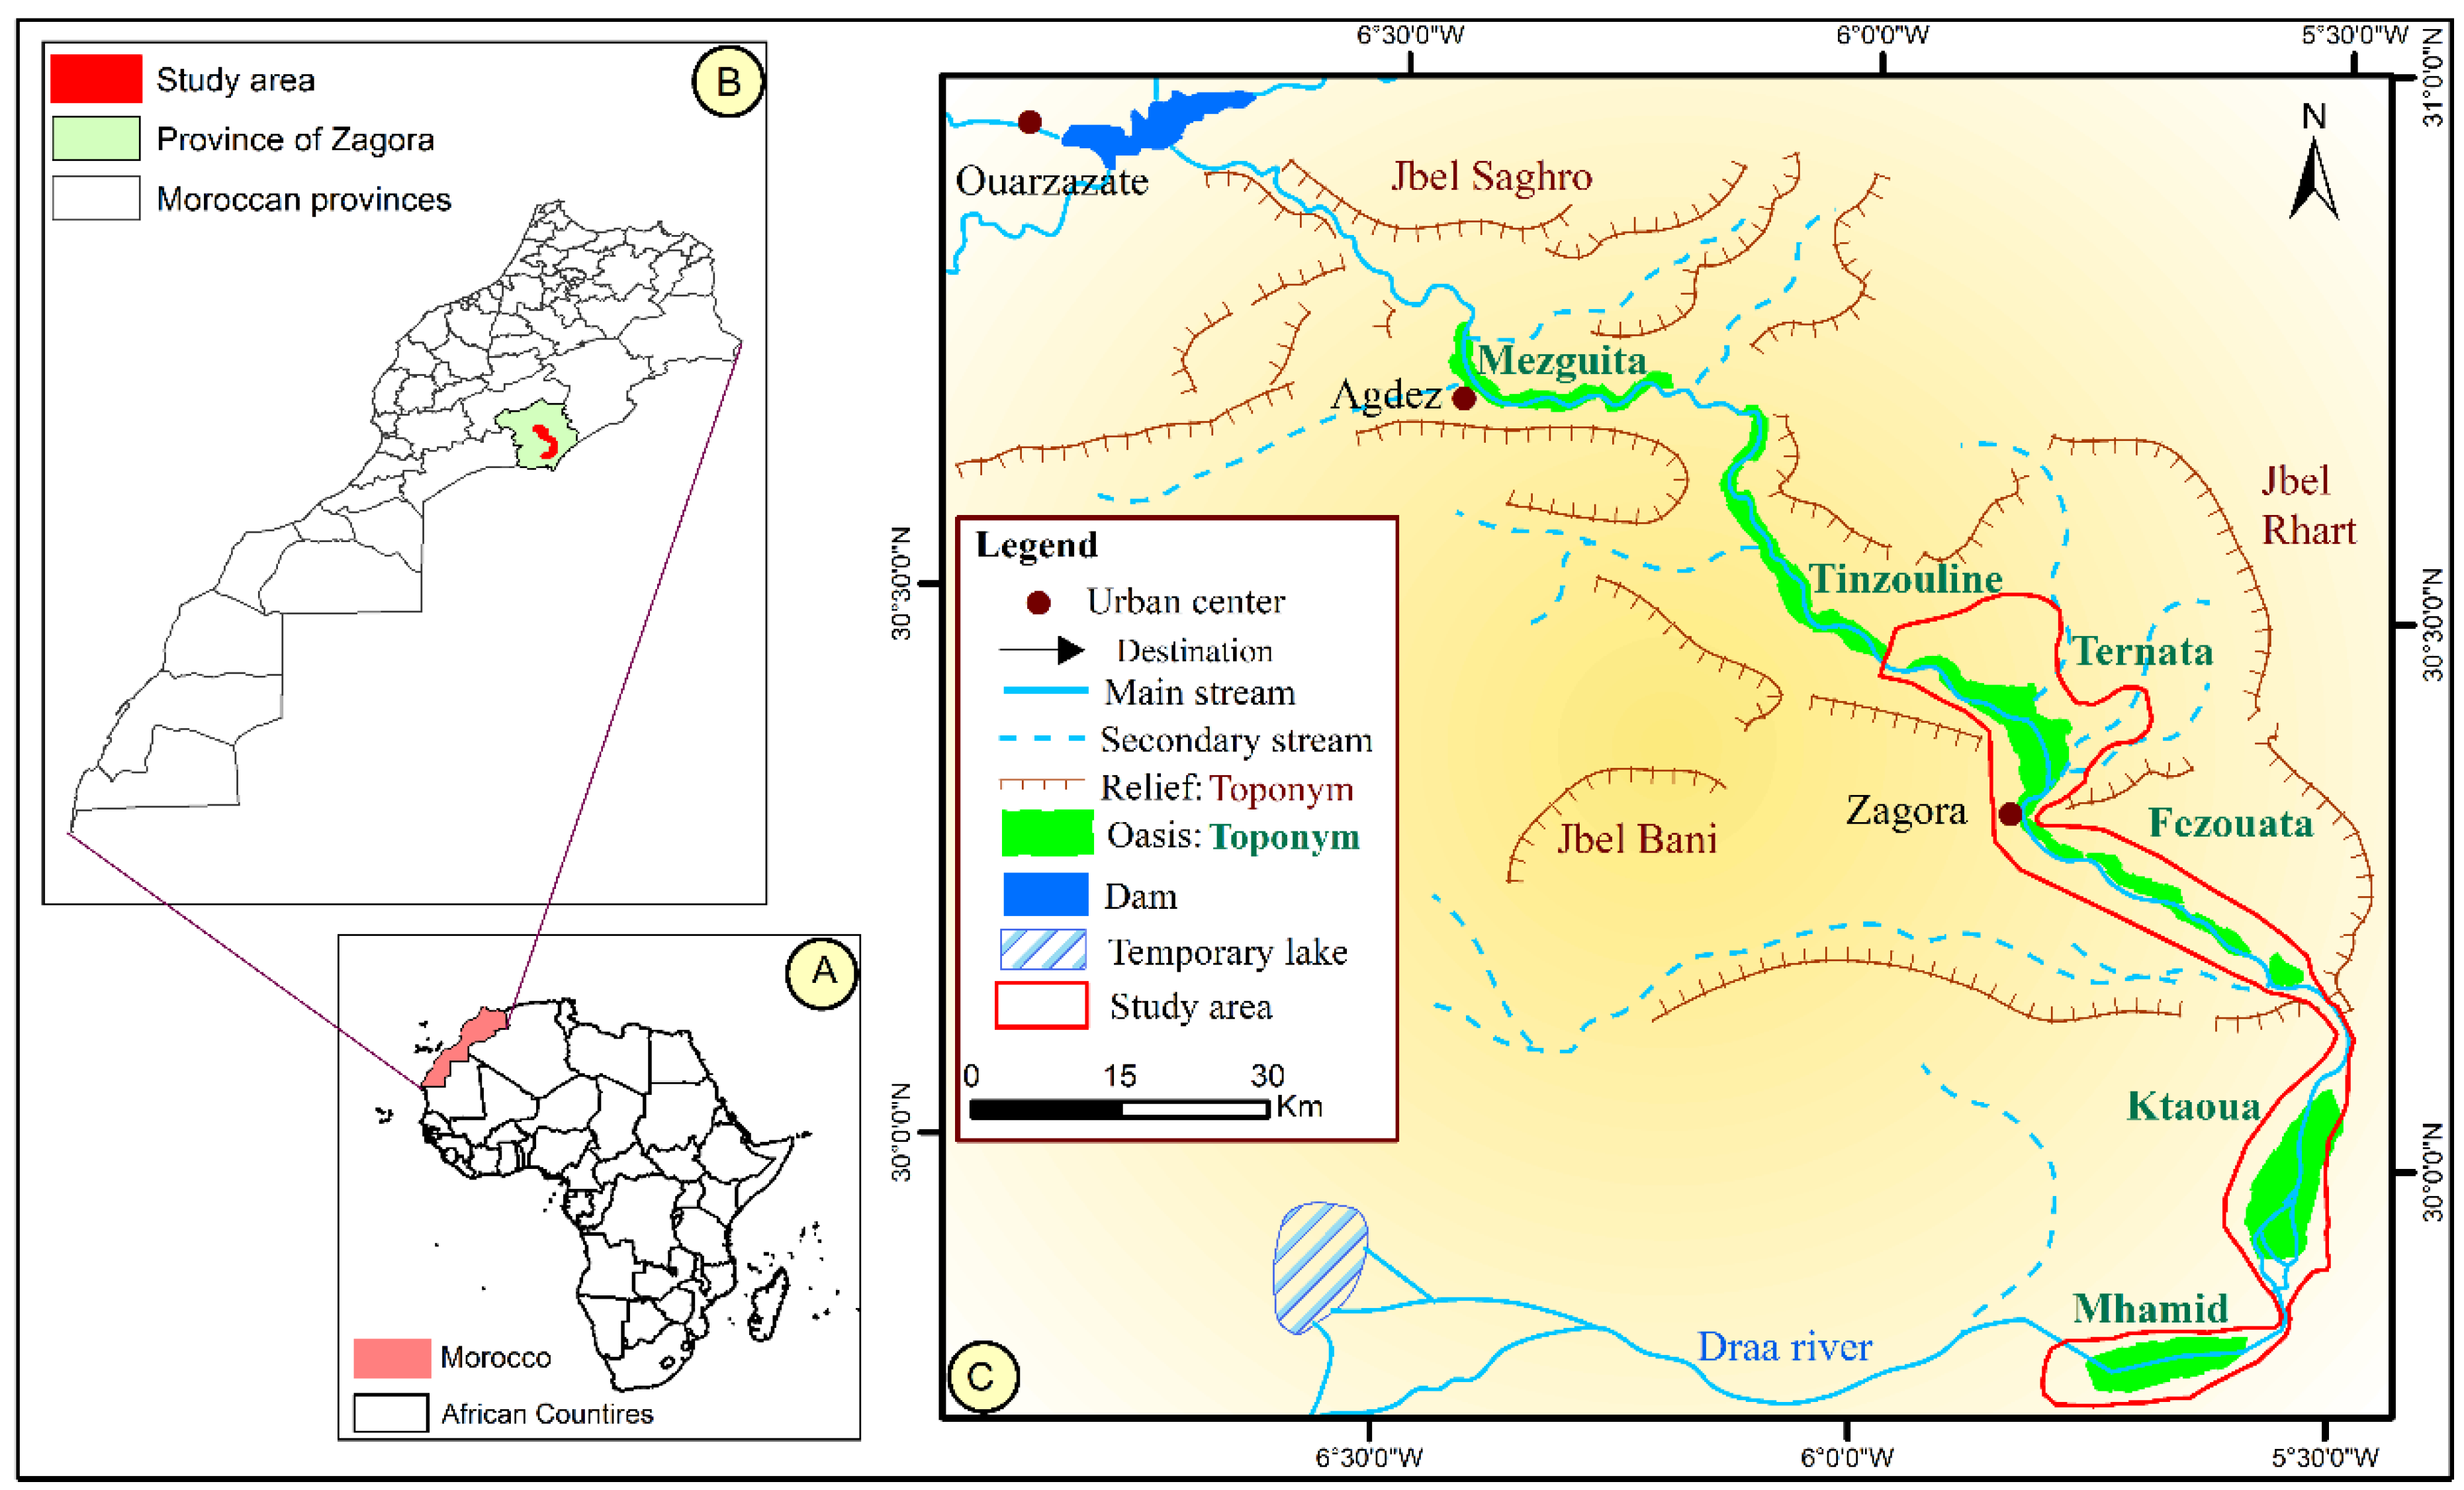
2.1. Study Area
2.2. Data Used
- The ASTER digital elevation model (DEM) was used to retrieve the slopes and aspect gradients. The data (spatial resolution of 30 m) are available at https://lpdaac.usgs.gov/.
- Demographic data of the National Census of the Population and Habitat of 2014 were acquired from the Moroccan High Commission for Planning. The data are available at https://www.hcp.ma.
- The census of livestock was collected from the Regional Centre of Agricultural Development of Ouarzazate (ORMVAO).
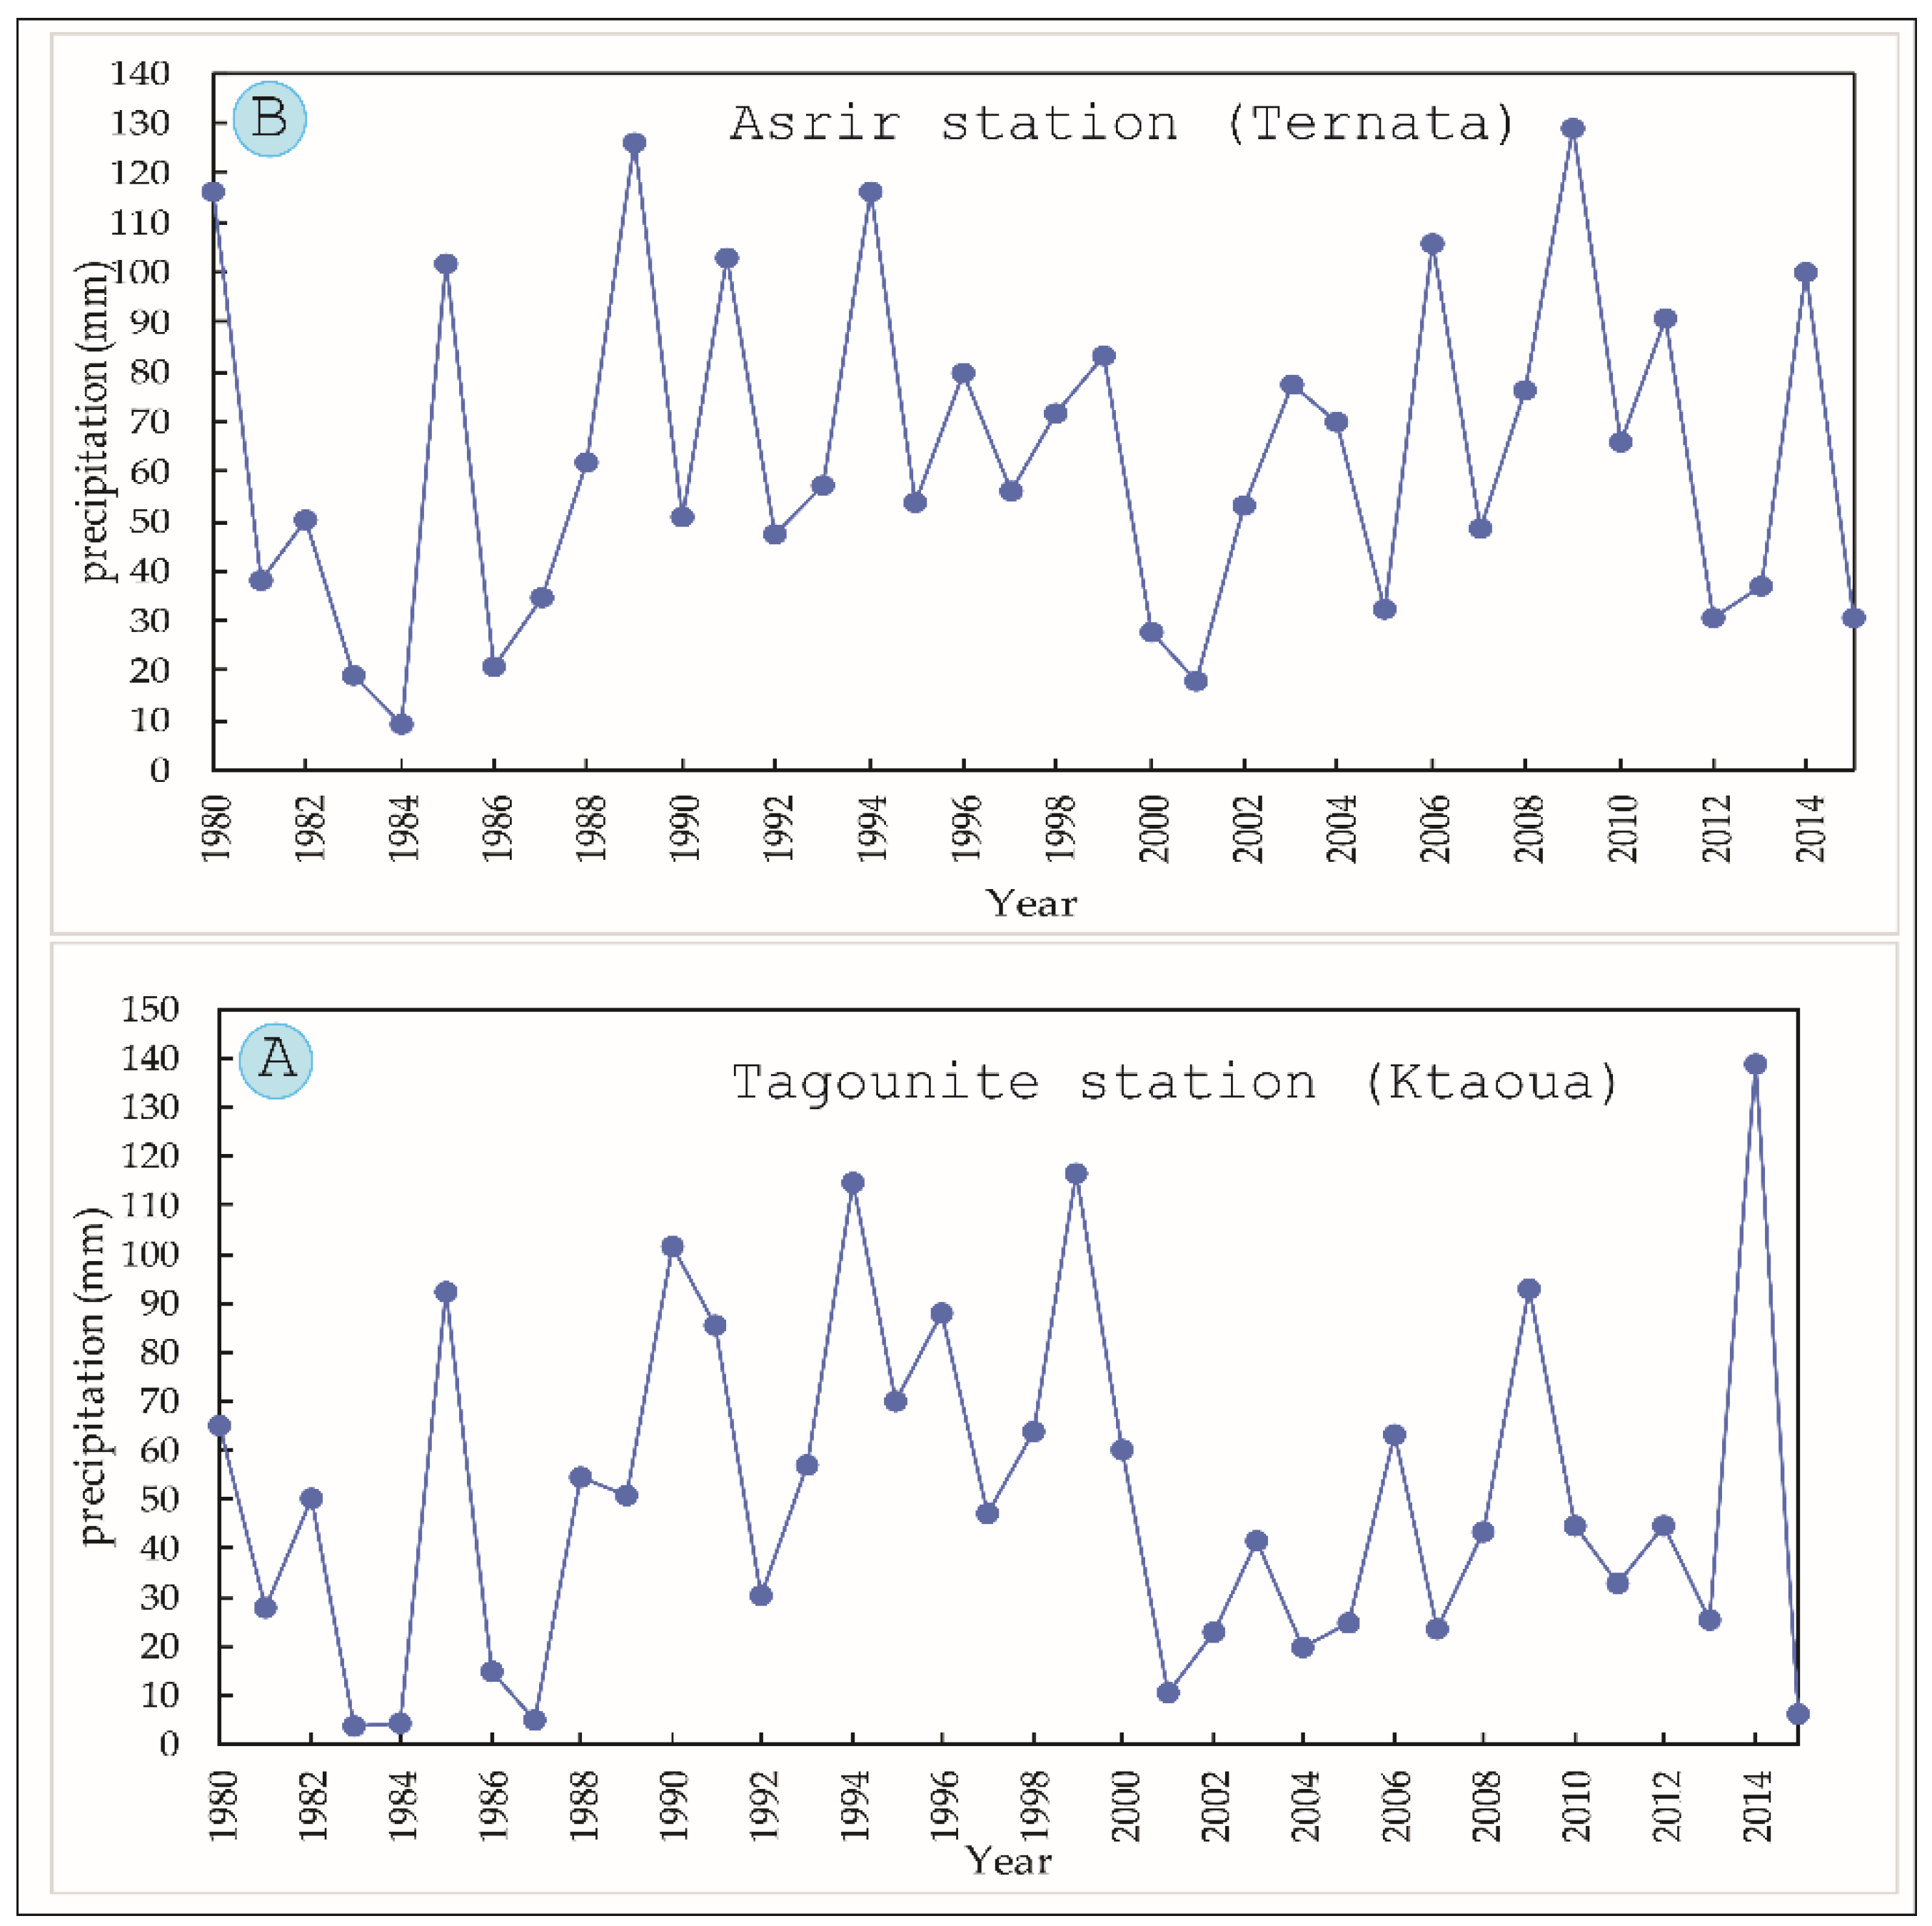
- Historical data of precipitation (1980–2015) were also collected from ORMVAO, which included a time series of the monthly precipitations of Ternata and Ktaoua climatological stations.
- Raster data of precipitation with 1 km2 were also used in this research. This data were an average of the monthly precipitations from 1970 to 2000 [28]. The data are available at http://www.worldClim.org.
- Data related to aridity were collected from the Consortium for Spatial Information (CSI), who provides high-resolution global raster climate data with a 1 km2 spatial resolution. The data are available at http://www.cgiar-csi.org.
- Soil depth data were extracted and reproduced from the “integrated approach to the efficient management of scarce water resources in West Africa” (IMPETUS) project via http://www.impetus.uni-koeln.de.
- A geological map of Hamada Draa, with a scale of 1:200,000, was acquired from the Moroccan Minister of Energies, Mines and Sustainable Development and was used to extract the parental material (lithological formations).
- In this study, a Sentinel-2 (S-2) space-borne satellite image was used to extract vegetation coverage and land use/cover map of the study area. The image was acquired on 3 July 2017. S-2 imagery was captured using a multispectral imaging sensor that uses the push-broom imaging technique to measure the Earth’s top-of-atmosphere reflected radiance. Thirteen bands (443–2190 nm) were present [29]. The level 1C 12-bit encoded S-2 image was freely downloaded from the Copernicus Open Access Hub at https://scihub.copernicus.eu/. The pre-processing of this data included radiometric and geometric correction and orthorectification (ortho-images in UTM/WGS84 projection) using Planet 90 m resolution DEM [30]. The free SNAP tool developed by the European Space Agency was used to convert the level 1C image to level 2A bottom-of-atmosphere reflected values [31], with the association of the Sen2Cor tool [32] for the atmospheric correction. The pre-processing also included resampling of bands to 10 m of spatial resolution using the nearest neighbour algorithm and then clipping of the site of study from the scene.
- Ground truth data were collected from the MDV to validate the land use/cover classification using the S-2 image and the final map of the desertification-sensitive areas. The water samples were also collected from wells in different oases to calculate water salinity.
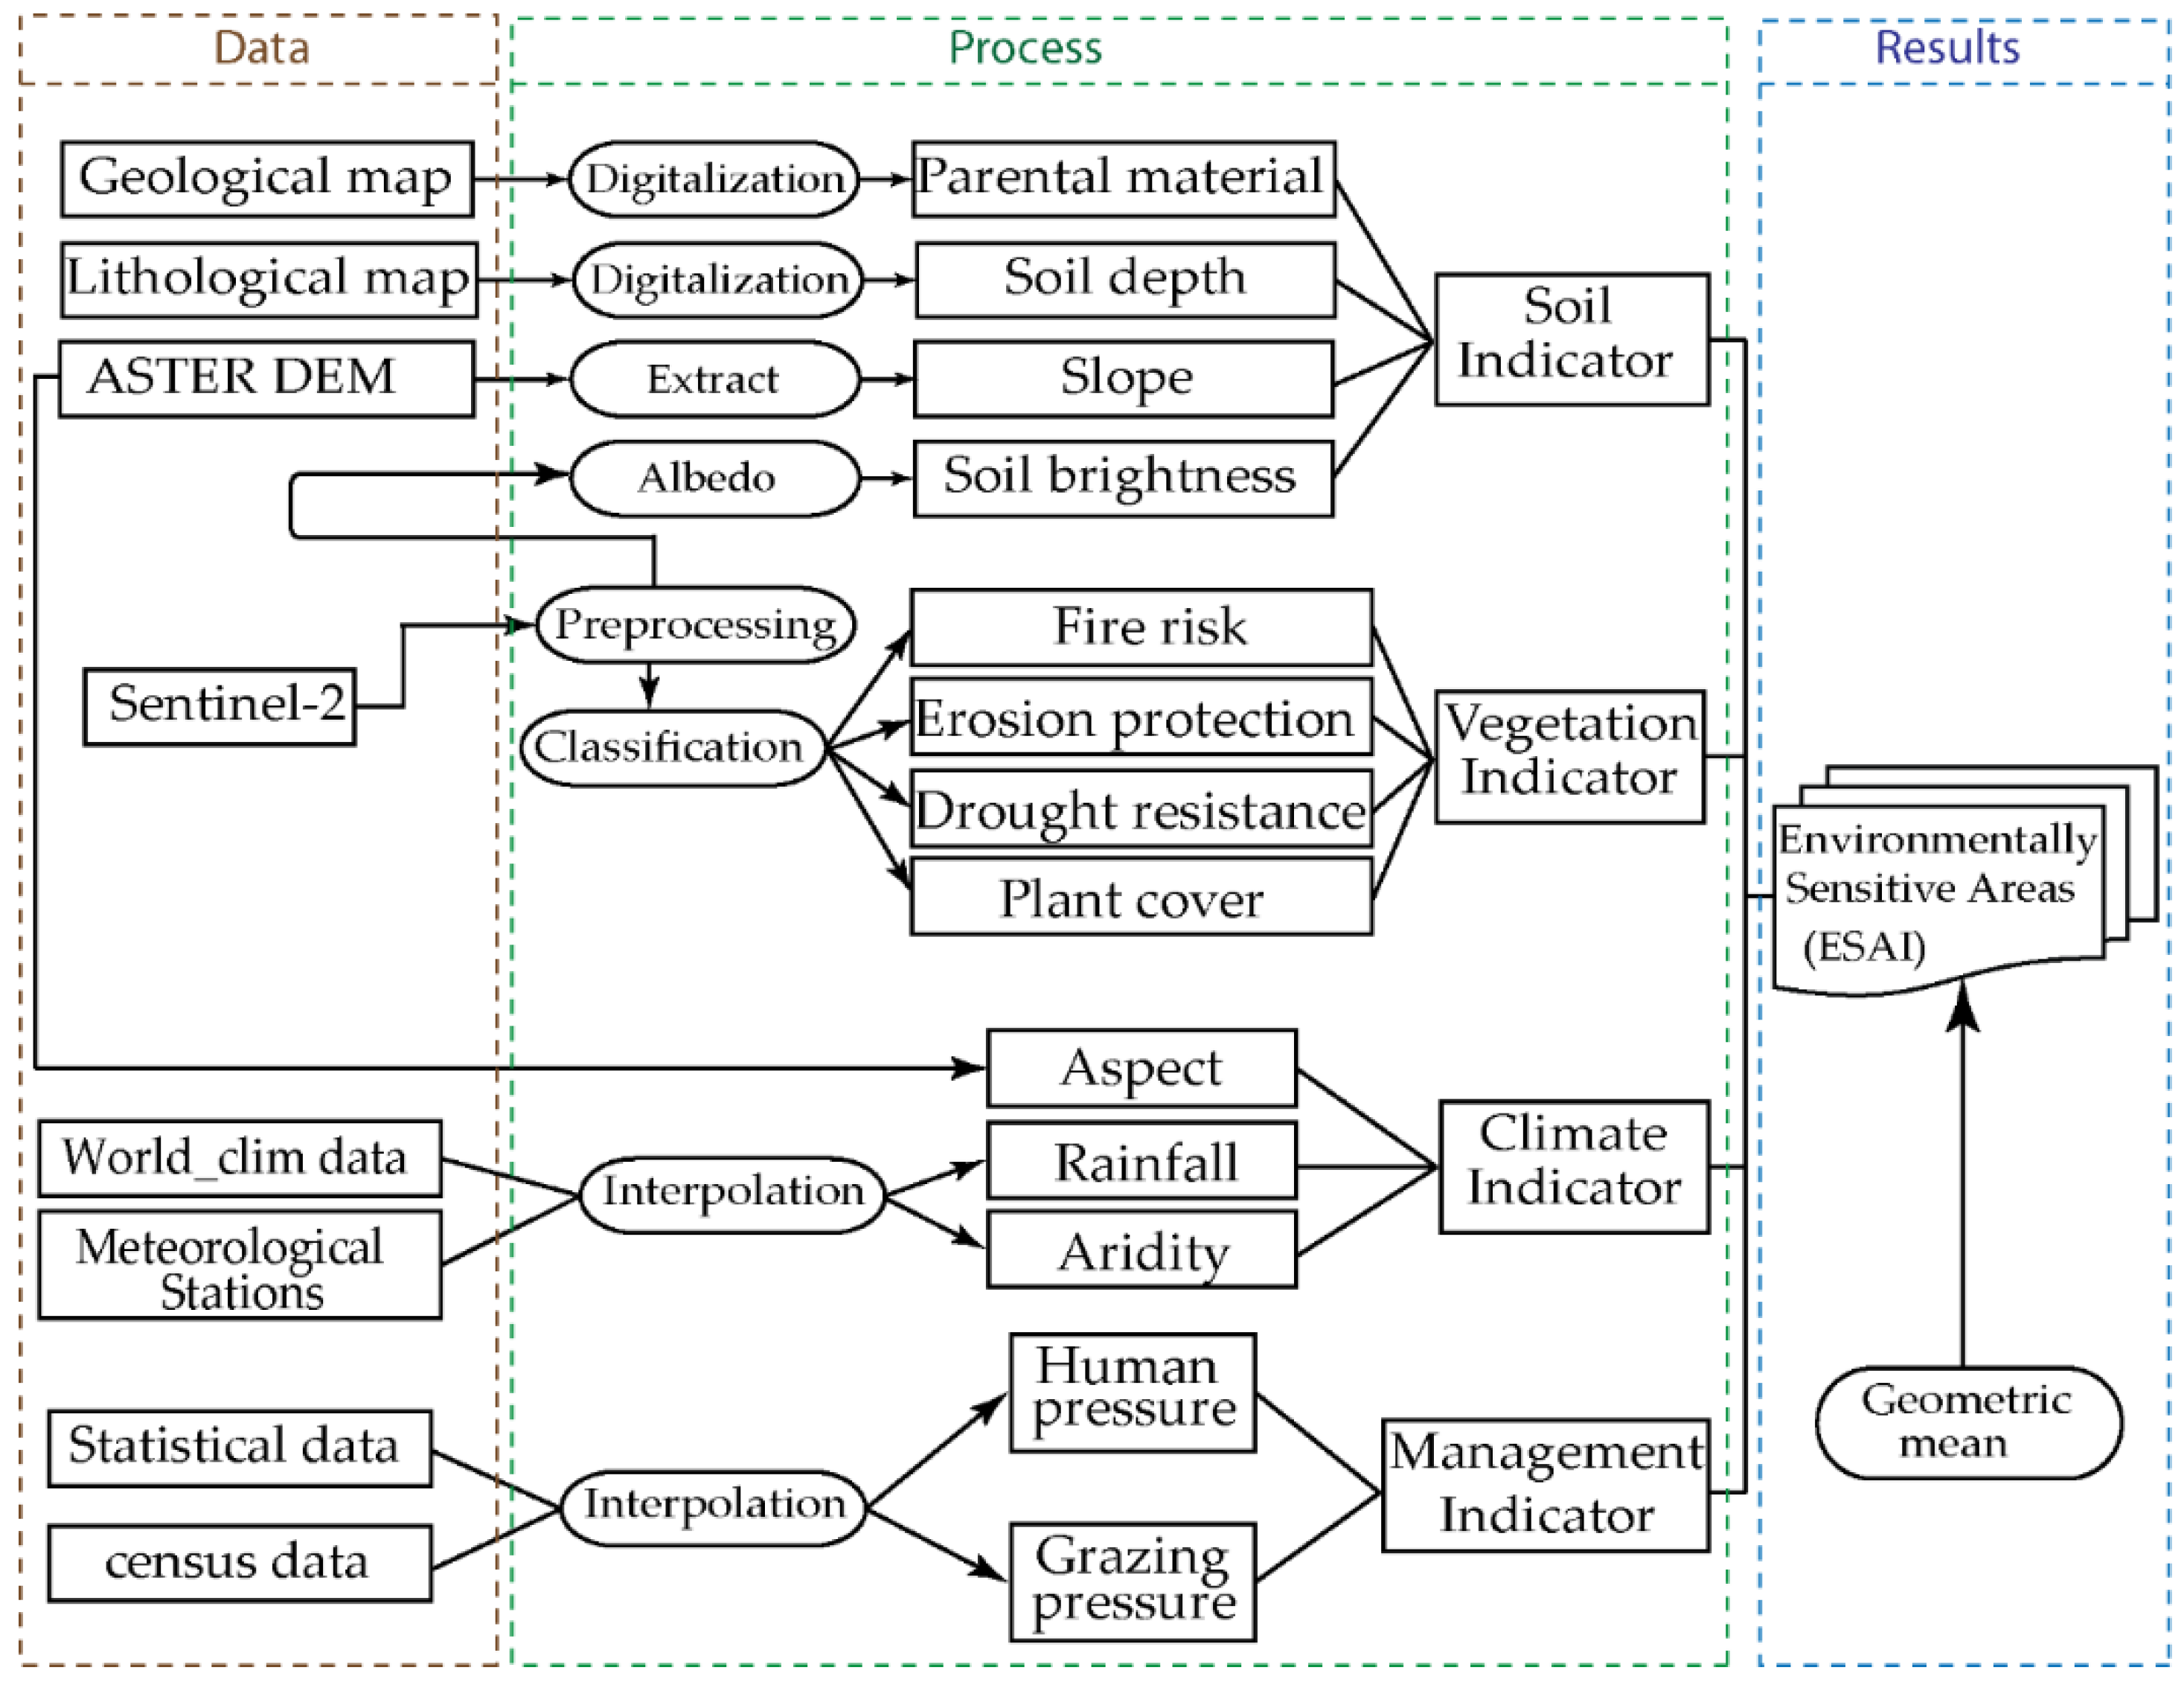
2.3. Methodology
2.3.1. SQI
2.3.2. VQI
2.3.3. CQI
2.3.4. MQI
2.3.5. ESAI
3. Results
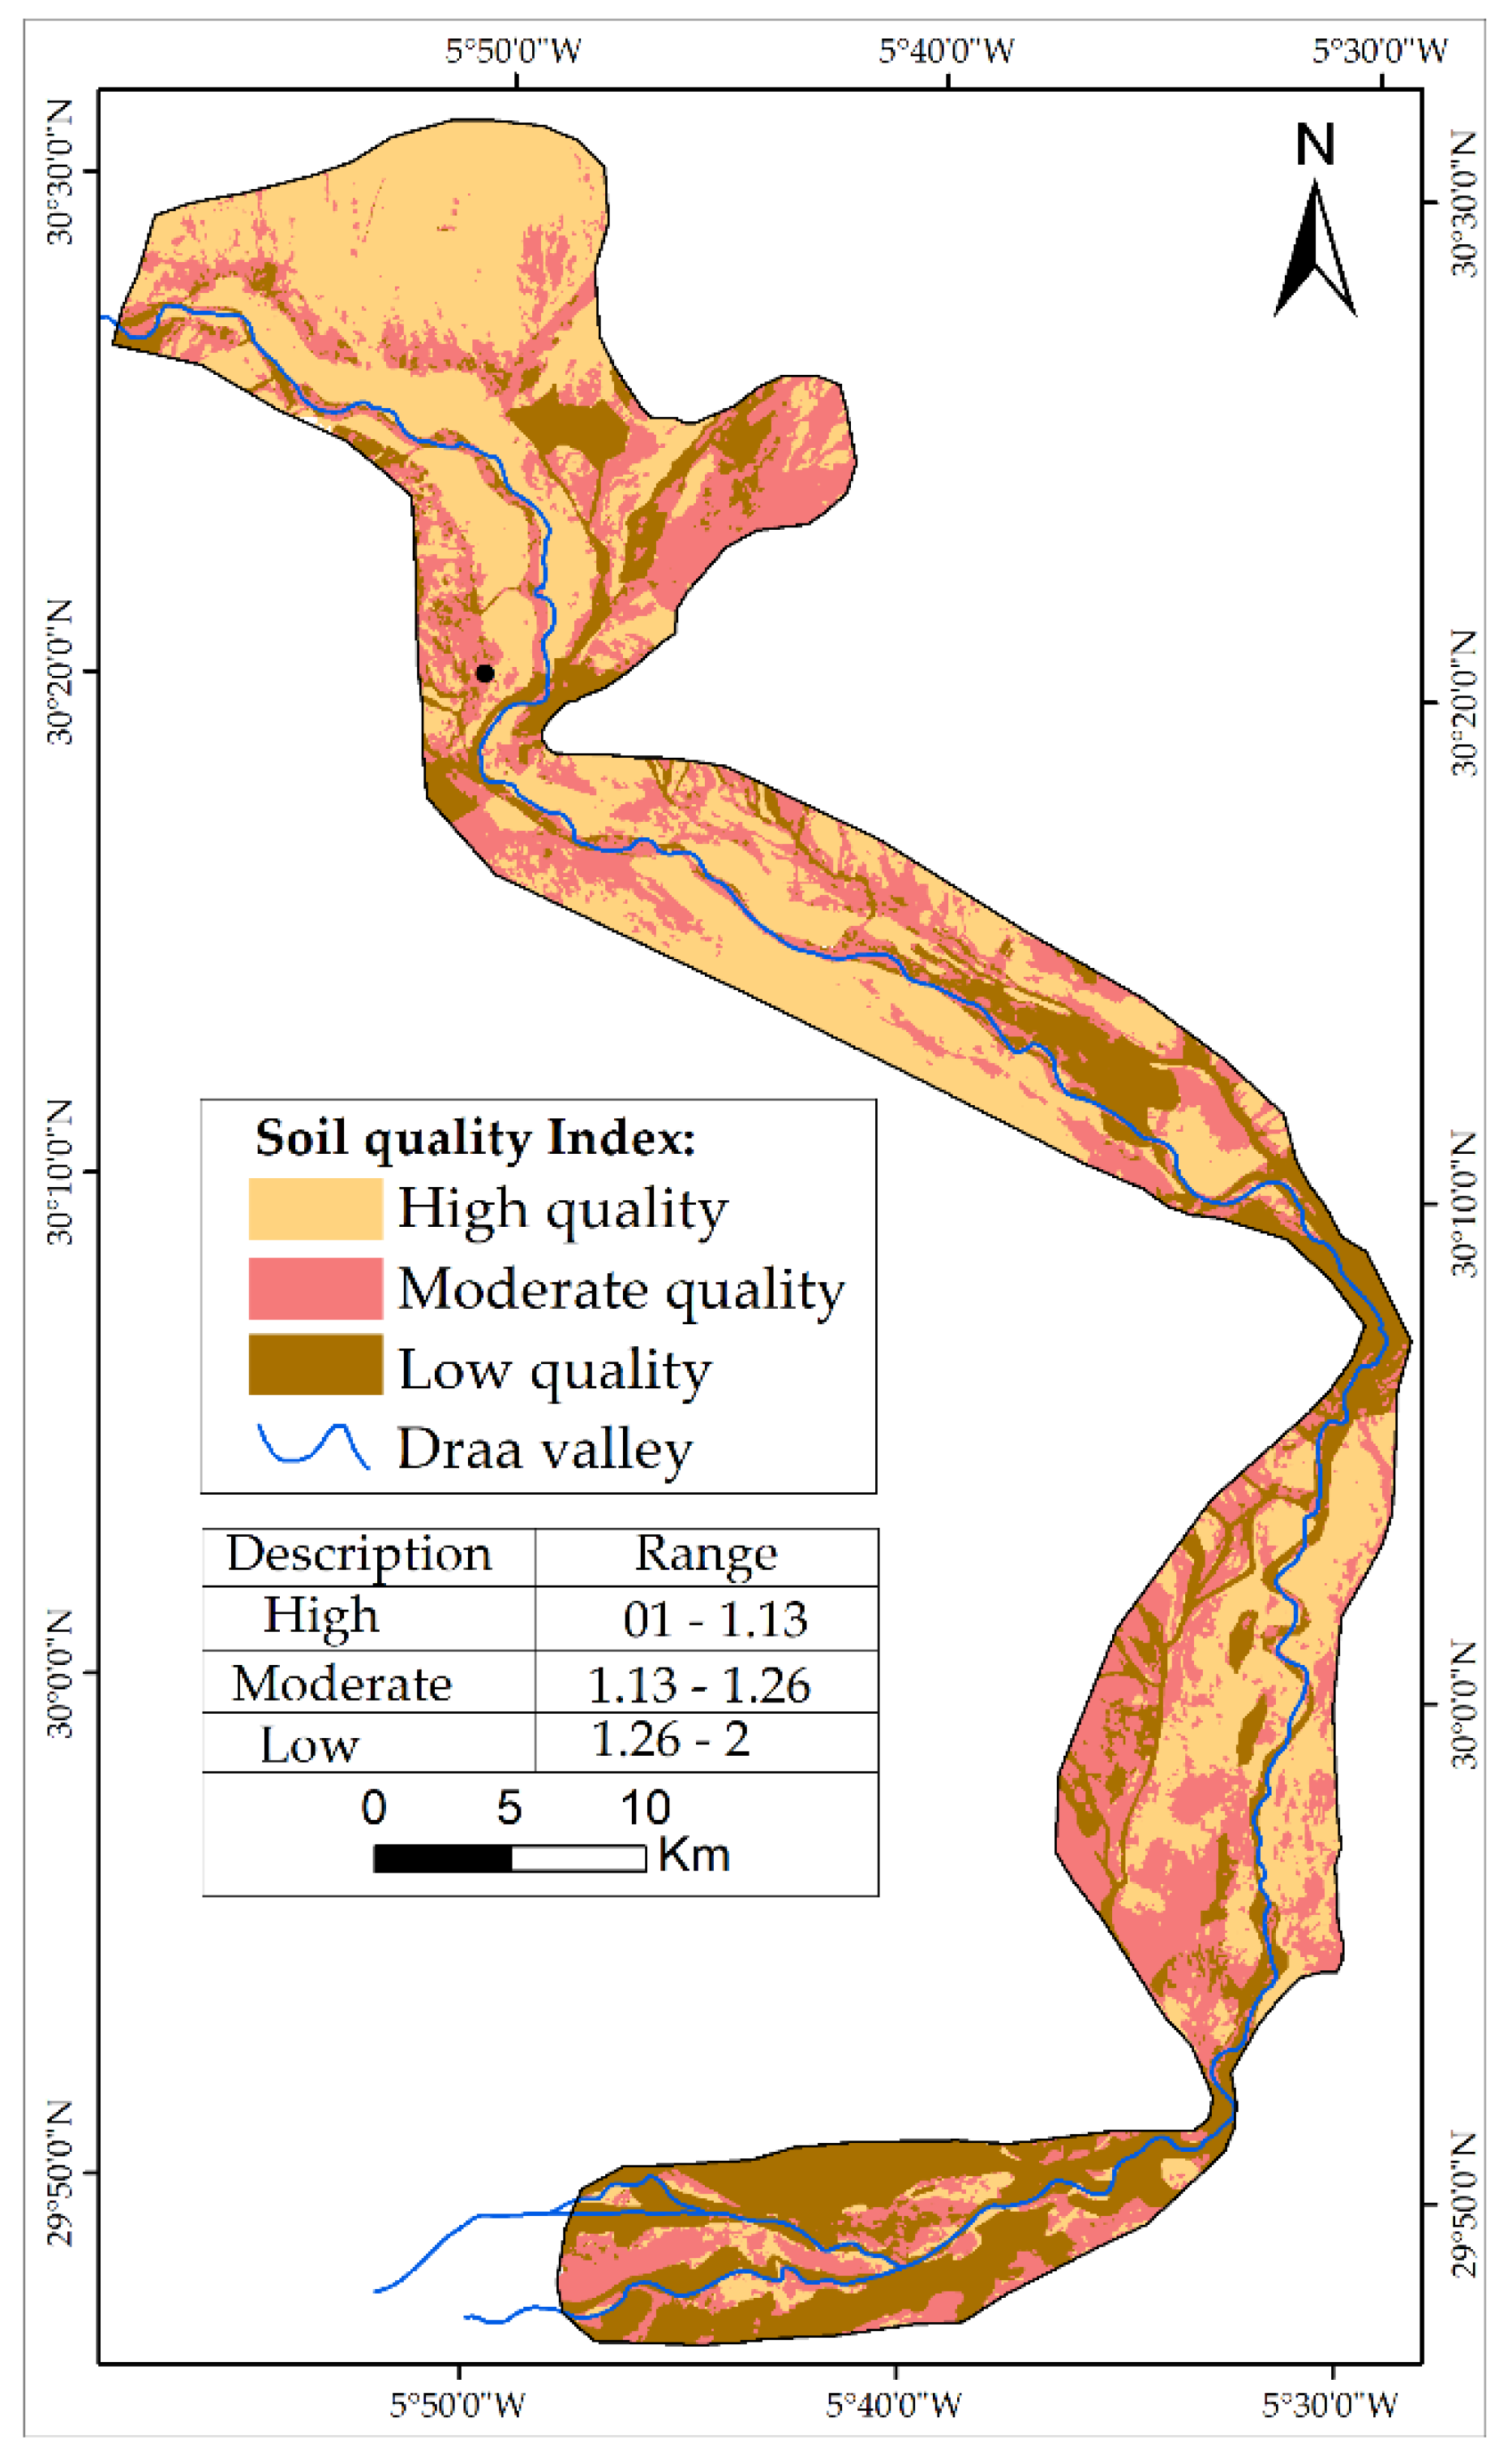
3.1. SQI
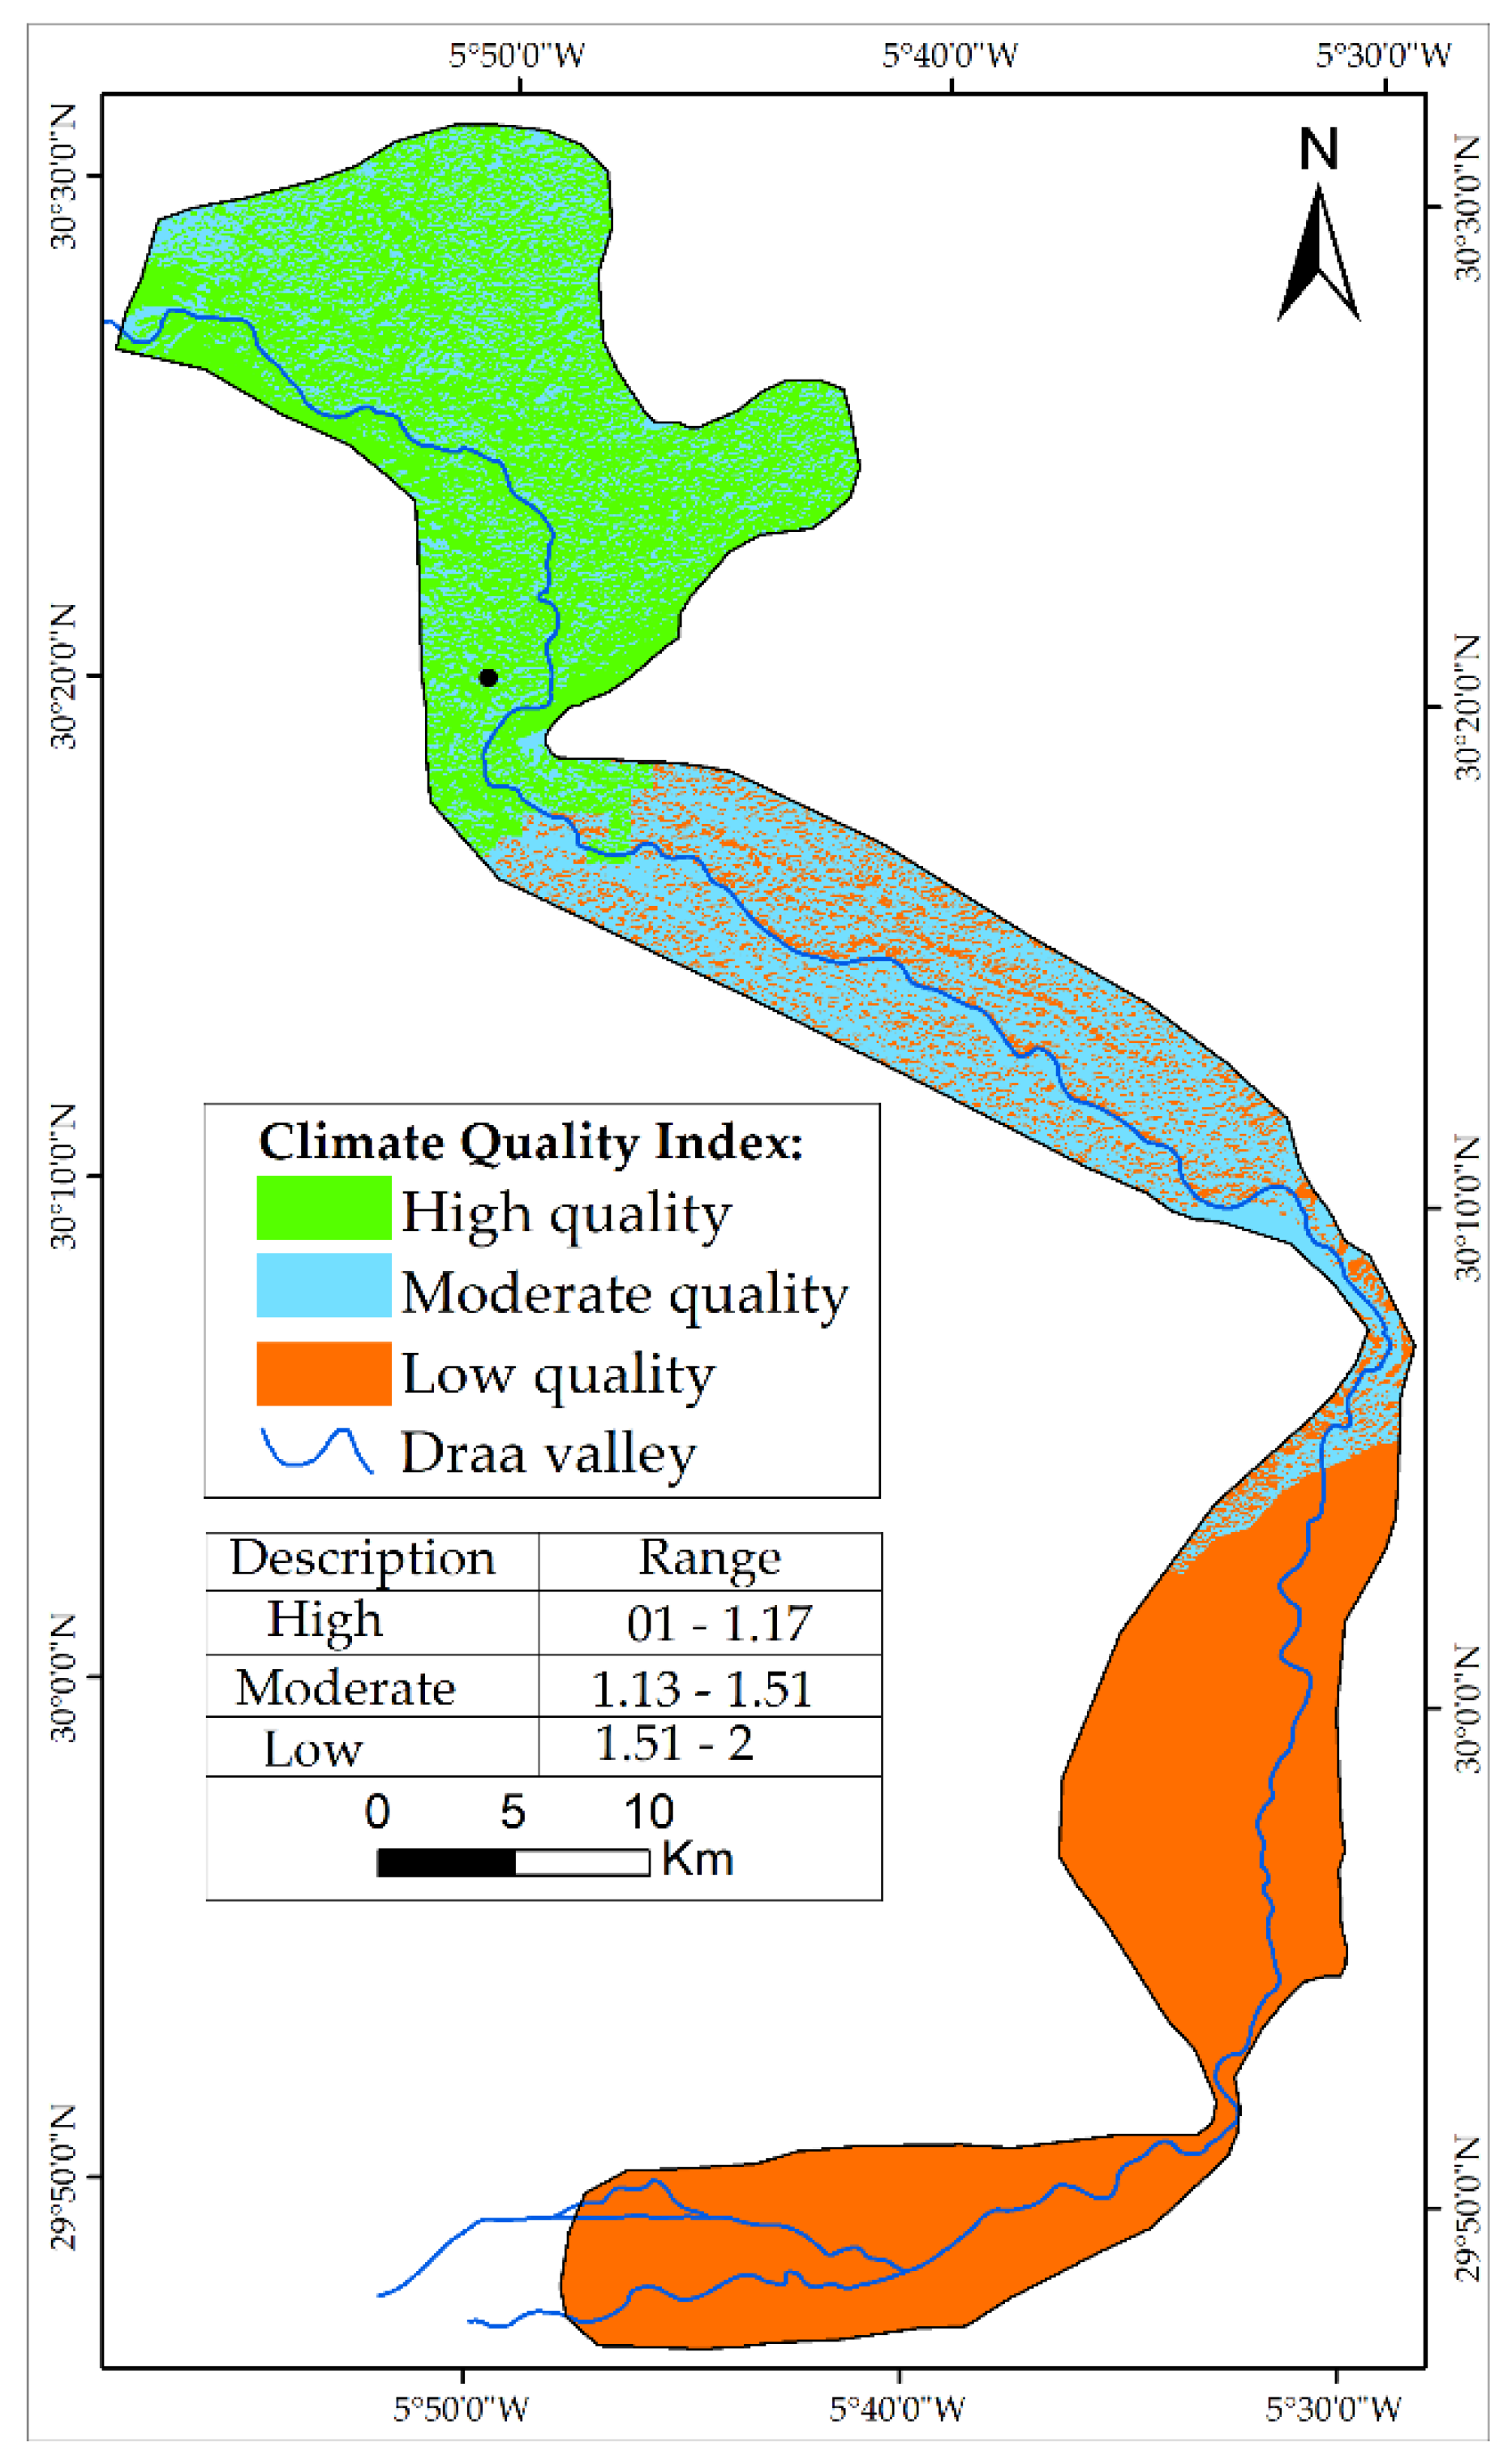
3.2. CQI
3.3. VQI
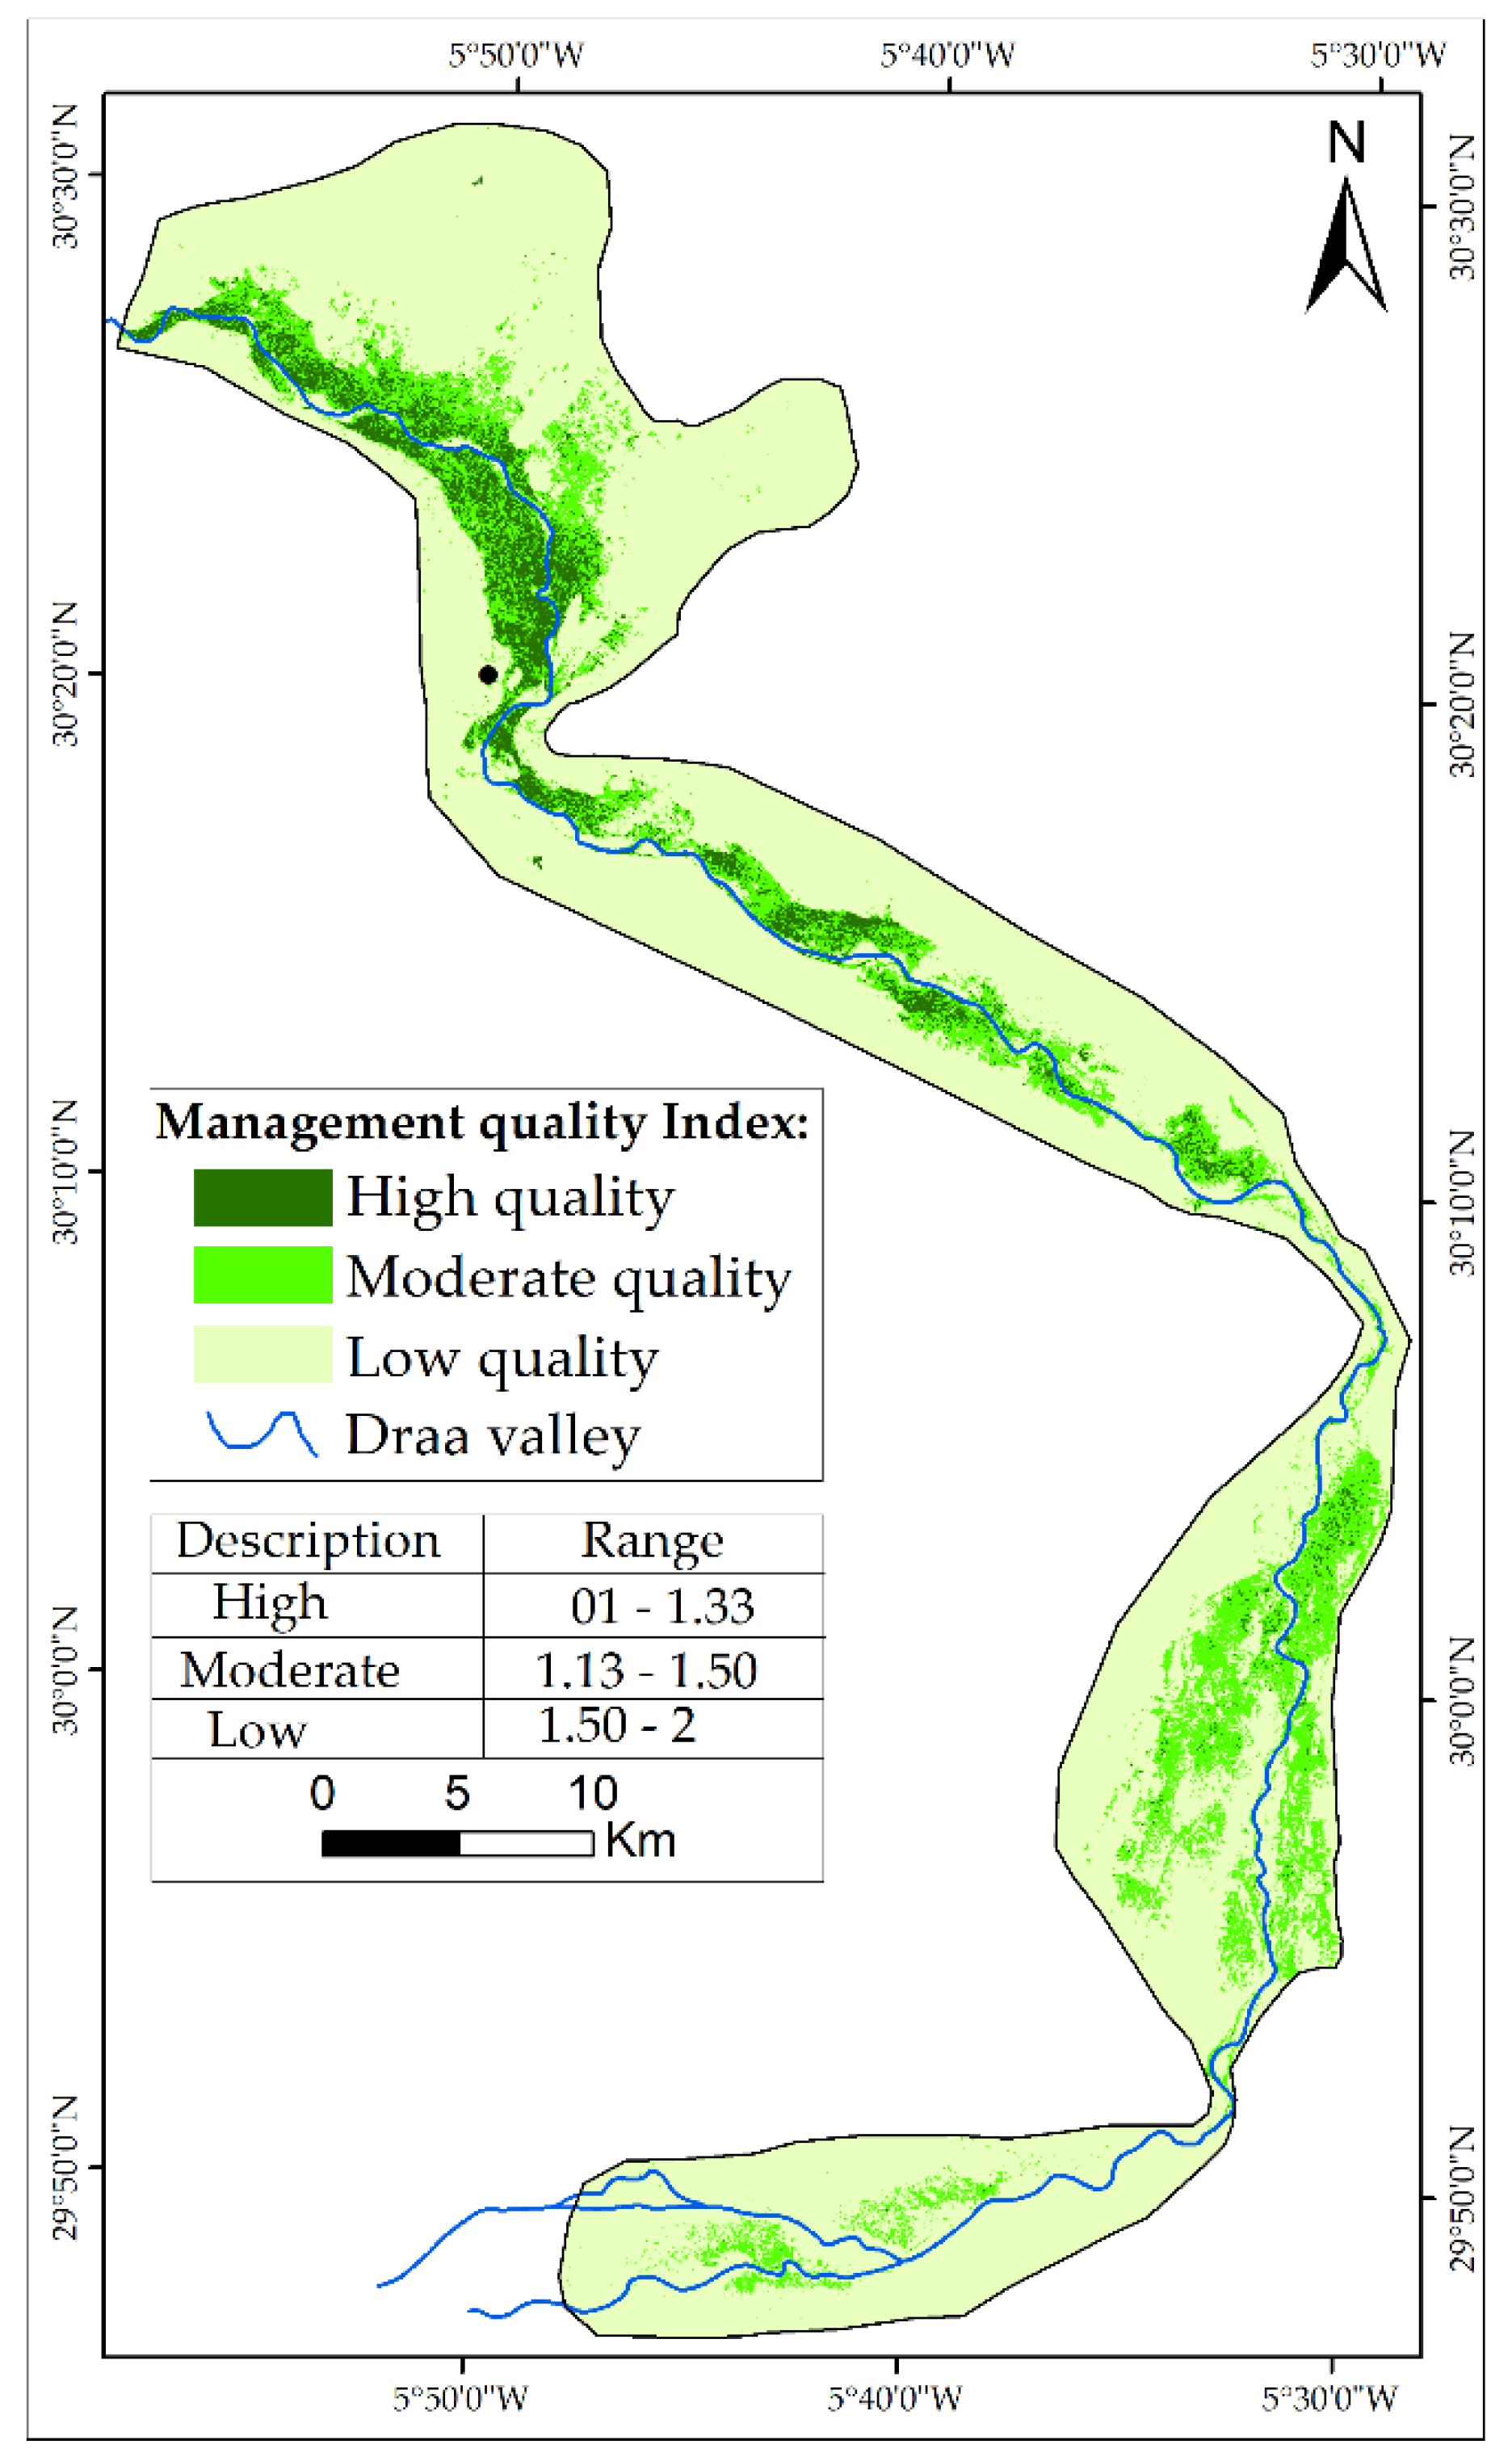
3.4. MQI
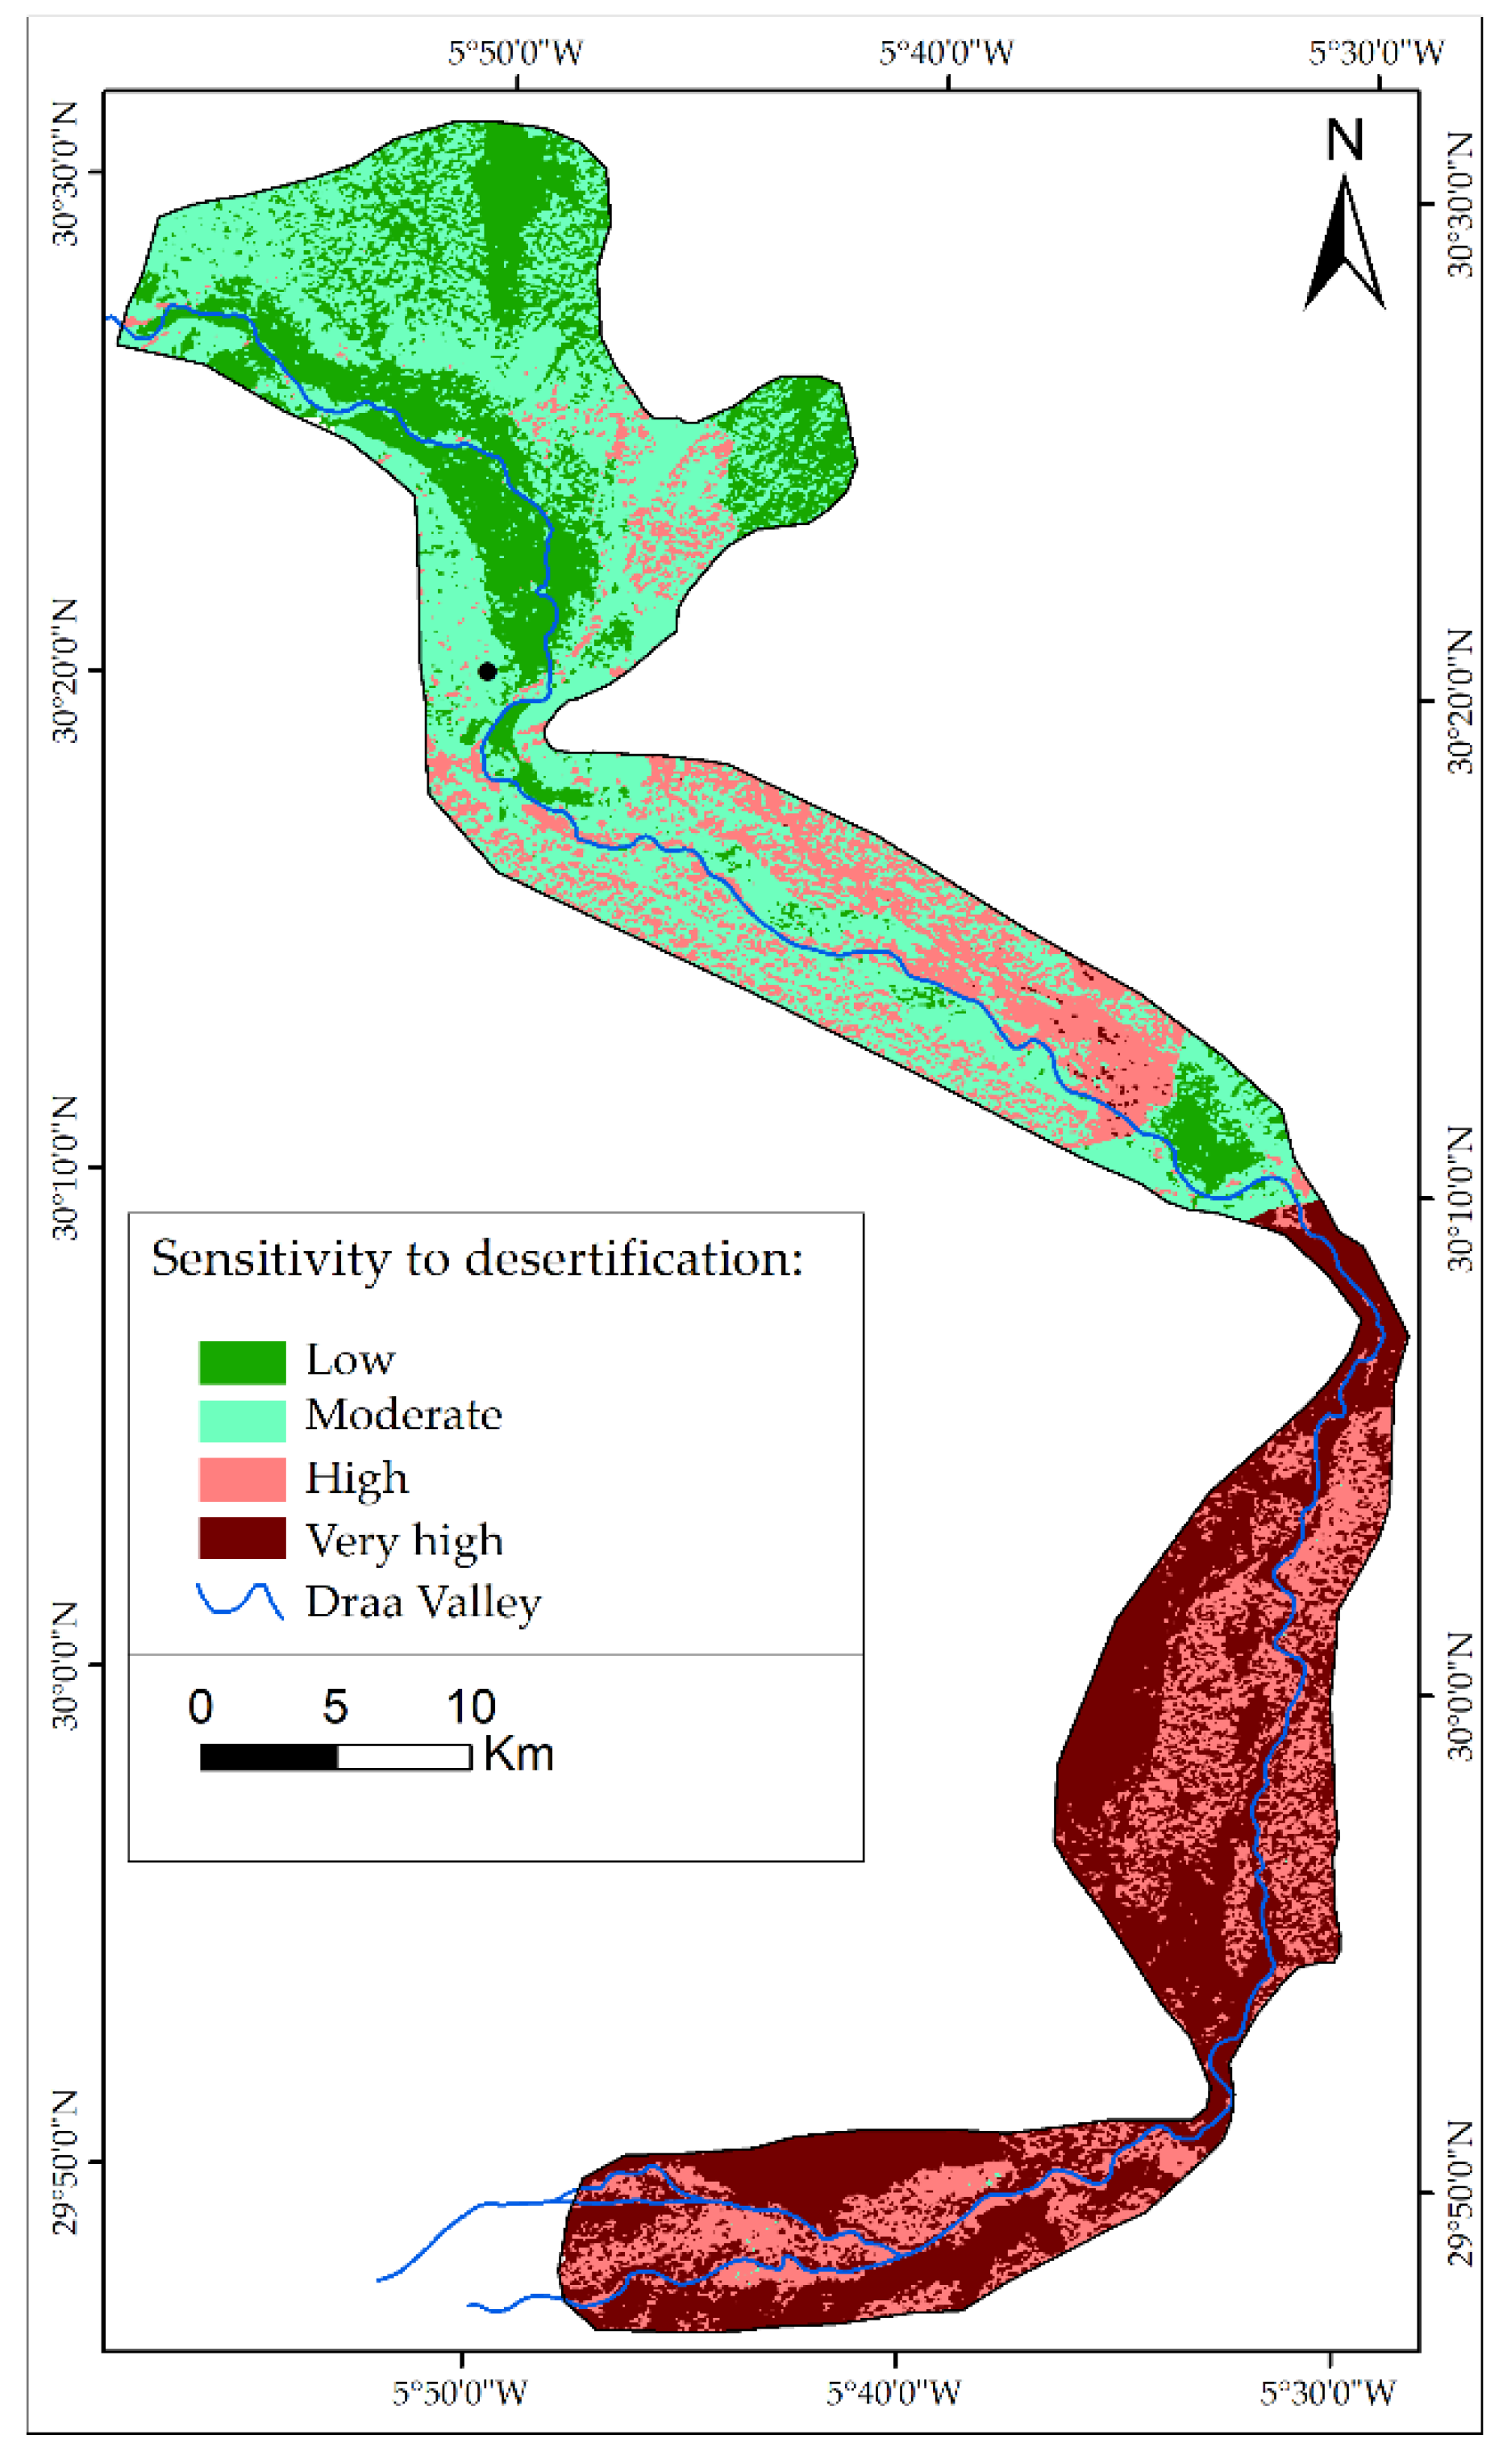
3.5. ESAI
4. Discussion
5. Conclusions
Author Contributions
Funding
Acknowledgments
Conflicts of Interest
References
- Deichmann, U.; Eklundh, L. Global Digital Datasets for Land Degradation Studies: A GIS Approach; Global Environment Monitoring System, United Nations Environment Programme: Nairobi, Kenya, 1991. Available online: https://trove.nla.gov.au/work/21947593?q&versionId=26449303 (accessed on 9 July 2018).
- UNCCD. Desertification: The Invisible Frontline; UNCCD Publications: Bonn, Germany, 2014. [Google Scholar]
- Hammouzaki, Y. Desertification and its control in Morocco. In Combating Desertification in Asia, Africa and the Middle East; Springer Netherlands: Dordrecht, The Netherlands, 2013; pp. 91–111. [Google Scholar]
- Ladisa, G.; Todorovic, M.; Trisorio Liuzzi, G. A GIS-based approach for desertification risk assessment in Apulia region, SE Italy. Phys. Chem. Earth. Parts A/B/C 2012, 49, 103–113. [Google Scholar] [CrossRef]
- Gao, J.; Liu, Y. Mapping of land degradation from space: a comparative study of Landsat ETM+ and ASTER data. Int. J. Remote Sens. 2008, 29, 4029–4043. [Google Scholar] [CrossRef]
- Bakr, N.; Weindorf, D.C.; Bahnassy, M.H.; El-Badawi, M.M. Multi-temporal assessment of land sensitivity to desertification in a fragile agro-ecosystem: Environmental indicators. Ecol. Indic. 2012, 15, 271–280. [Google Scholar] [CrossRef]
- Xu, D.; Kang, X.; Qiu, D.; Zhuang, D.; Pan, J. Quantitative Assessment of Desertification Using Landsat Data on a Regional Scale—A Case Study in the Ordos Plateau, China. Sensors 2009, 9, 1738–1753. [Google Scholar] [CrossRef] [PubMed]
- Ma, Z.; Xie, Y.; Jiao, J.; Li, L.; Wang, X. The Construction and Application of an Aledo-NDVI Based Desertification Monitoring Model. Procedia Environ. Sci. 2011, 10, 2029–2035. [Google Scholar] [CrossRef]
- Lamchin, M.; Lee, J.Y.; Lee, W.K.; Lee, E.J.; Kim, M.; Lim, C.H.; Choi, H.A.; Kim, S.R. Assessment of land cover change and desertification using remote sensing technology in a local region of Mongolia. Adv. Space Res. 2016, 57, 64–77. [Google Scholar] [CrossRef]
- Kosmas, C.; Kirkby, M.J.; Geeson, N. (Eds.) Medalus Project: Mediterranean Desertification and Land Use. Manual on KEY INDICATORS of Desertification and Mapping Environmentally Sensitive Areas; Publication of European Union: Brussels, Beligium, 1999; ISBN 9282863492. [Google Scholar]
- Sommer, S.; Zucca, C.; Grainger, A.; Cherlet, M.; Zougmore, R.; Sokona, Y.; Hill, J.; Della Peruta, R.; Roehrig, J.; Wang, G. Application of indicator systems for monitoring and assessment of desertification from national to global scales. Land Degrad. Dev. 2011, 22, 184–197. [Google Scholar] [CrossRef]
- Rasmussen, K.; Fog, B.; Madsen, J.E. Desertification in reverse? Observations from northern Burkina Faso. Glob. Environ. Chang. 2001, 11, 271–282. [Google Scholar] [CrossRef]
- Kosmas, C.; Tsara, M.; Moustakas, N.; Karavitis, C. Identification of indicators for desertification. Ann. Arid Zone 2003, 42, 393–416. [Google Scholar]
- Karamesouti, M.; Panagos, P.; Kosmas, C. Model-based spatio-temporal analysis of land desertification risk in Greece. CATENA 2018, 167, 266–275. [Google Scholar] [CrossRef]
- Trotta, C.; Menegoni, P.; Manfredi Frattarelli, F.M.; Iannetta, M. Assessing desertification vulnerability on a local scale: the Castelporziano study case (central Italy). Rend. Lincei 2015, 26, 421–450. [Google Scholar] [CrossRef]
- Contador, J.F.L.; Schnabel, S.; Gutiérrez, A.G.; Fernández, M.P. Mapping sensitivity to land degradation in Extremadura. SW Spain. Land Degrad. Dev. 2009, 20, 129–144. [Google Scholar] [CrossRef]
- Symeonakis, E.; Karathanasis, N.; Koukoulas, S.; Panagopoulos, G. Monitoring sensitivity to land degradation and desertification with the environmentally sensitive area index: The case of Lesvos Island. Land Degrad. Dev. 2014, 27, 1562–1573. [Google Scholar] [CrossRef]
- Kamel, A.; Ali, H.; Ghaleb, F.; Mario, M.; Tony, G. GIS-based mapping of areas sensitive to desertification in a semi-arid region in Lebanon. South-Eastern Eur. J. Earth Obs. Geomat. 2015, 4, 91–103. [Google Scholar]
- Boudjemline, F.; Semar, A. Assessment and mapping of desertification sensitivity with MEDALUS model and GIS—Case study: basin of Hodna, Algeria. J. Water Land Dev. 2018, 17–26. [Google Scholar] [CrossRef]
- Bouabid, R.; Rouchdi, M.; Badraoui, M.; Diab, A.; Louafi, S. Assessment of land desertification based on the MEDALUS approach and elaboration of an action plan: The case study of the Souss River Basin, Morocco. In Land Degradation and Desertification: Assessment, Mitigation and Remediation; Springer: Dordrecht, The Netherlands, 2010; pp. 131–145. [Google Scholar]
- Lahlaoi, H.; Rhinane, H.; Hilali, A.; Lahssini, S.; Moukrim, S. Desertification Assessment Using MEDALUS Model in Watershed Oued El Maleh, Morocco. Geosciences 2017, 7, 50. [Google Scholar] [CrossRef]
- Benmessaud, H.; Kalla, M.; Driddi, H. The Use of GIS Data in the Desertification Risk Cartography: Case Study of South Aurès Region in Algeria. In Land Degradation and Desertification: Assessment, Mitigation and Remediation; Springer Netherlands: Dordrecht, The Netherlands, 2010; pp. 81–95. [Google Scholar]
- Benabderrahmane, M.C.; Chenchouni, H. Assessing Environmental Sensitivity Areas to Desertification in Eastern Algeria using Mediterranean Desertification and Land Use “MEDALUS” Model. Int. J. Sustain. Water Environ. Syst. 2010, 1, 5–10. [Google Scholar] [CrossRef]
- Ait Lamqadem, A.; Saber, H.; Rahimi, A. Spatiotemporal Changes of Vegetation in the Middle Draa Valley Oasis: A Study Case o f M’ hamid El Ghizlane Oasis (Morocco). Eur. Sci. J. 2017, 13, 115–132. [Google Scholar] [CrossRef]
- Trabucco, A.; Zomer, R.J.; Bossio, D.A.; van Straaten, O. Climate change mitigation through afforestation/reforestation: A global analysis of hydrologic impacts with four case studies. Agric. Ecosyst. Environ. 2008, 126, 81–97. [Google Scholar] [CrossRef]
- Robert-charrue, C. Géologie structurale de l’Anti-Atlas oriental, Maroc. Ph.D. Thesis, Université de Neuchâtel (Suisse), Neuchatel, Switzerland, 2006. [Google Scholar]
- Aït Hamza, M.; El Faskaoui, B. Les oasis du Drâa au Maroc. Hommes Migr. 2010, 56–69. [Google Scholar] [CrossRef]
- Fick, S.E.; Hijmans, R.J. WorldClim 2: New 1-km spatial resolution climate surfaces for global land areas. Int. J. Climatol. 2017, 37, 4302–4315. [Google Scholar] [CrossRef]
- Puliti, S.; Saarela, S.; Gobakken, T.; Ståhl, G.; Næsset, E. Combining UAV and Sentinel-2 auxiliary data for forest growing stock volume estimation through hierarchical model-based inference. Remote Sens. Environ. 2018, 204, 485–497. [Google Scholar] [CrossRef]
- Hoersch, B. Sentinel-2 Mission: Observation Scenario, Products and Mission Status; ESA Publisher: Brussels, Beligium, 2015. [Google Scholar]
- Wilm, U.M. ESA Sentinel-2 Msi—Level-2a Prototype Processor Installation and User Manual; Telespazio VEGA Deutschland GmbH: Darmstadt, Germany, 2016. [Google Scholar]
- Wilm, U.M. ESA Sen2Cor Software Release Note; European Space Agency: Darmstadt, Germany, 2017. [Google Scholar]
- Sepehr, A.; Hassanli, A.M.; Ekhtesasi, M.R.; Jamali, J.B. Quantitative assessment of desertification in south of Iran using MEDALUS method. Environ. Monit. Assess. 2007, 134, 243–254. [Google Scholar] [CrossRef] [PubMed]
- Basso, F.; Bove, E.; Dumontet, S.; Ferrara, A.; Pisante, M.; Quaranta, G.; Taberner, M. Evaluating environmental sensitivity at the basin scale through the use of geographic information systems and remotely sensed data: an example covering the Agri basin (Southern Italy). CATENA 2000, 40, 19–35. [Google Scholar] [CrossRef]
- Liang, S. Narrowband to broadband conversions of land surface albedo I: Algorithms. Remote Sens. Environ. 2001, 76, 213–238. [Google Scholar] [CrossRef]
- Jackson, R.D.; Idso, S.B.; Otterman, J. Surface albedo and desertification. Science 1975, 189, 1012–1015. [Google Scholar] [CrossRef] [PubMed]
- Otterman, J.; Idso, S.B.; Otterman, J. Baring high-albedo soils by overgrazing: A hypothesized desertification mechanism. Science 1974, 186, 531–533. [Google Scholar] [CrossRef] [PubMed]
- Fuller, D.O.; Ottke, C. Land cover, rainfall and land-surface Albedo in West Africa. Clim. Chang. 2002, 54, 181–204. [Google Scholar] [CrossRef]
- Guo, Q.; Fu, B.; Shi, P.; Cudahy, T.; Zhang, J.; Xu, H. Satellite monitoring the spatial-temporal dynamics of desertification in response to climate change and human activities across the Ordos Plateau, China. Remote Sens. 2017, 9, 525. [Google Scholar] [CrossRef]
- Lingbeek, B.J.; Higgins, C.L.; Muir, J.P.; Kattes, D.H.; Schwertner, T.W. Arthropod diversity and assemblage structure response to deforestation and desertification in the Sahel of western Senegal. Glob. Ecol. Conserv. 2017, 11, 165–176. [Google Scholar] [CrossRef]
- Hou, J.; Fu, B.; Wang, S.; Zhu, H. Comprehensive analysis of relationship between vegetation attributes and soil erosion on hillslopes in the Loess Plateau of China. Environ. Earth Sci. 2014, 72, 1721–1731. [Google Scholar] [CrossRef]
- Hou, J.; Wang, H.; Fu, B.; Zhu, L.; Wang, Y.; Li, Z. Effects of plant diversity on soil erosion for different vegetation patterns. CATENA 2016, 147, 632–637. [Google Scholar] [CrossRef]
- Thakkar, A.K.; Desai, V.R.; Patel, A.; Potdar, M.B. Post-classification corrections in improving the classification of Land Use/Land Cover of arid region using RS and GIS: The case of Arjuni watershed, Gujarat, India. Egypt. J. Remote Sens. Space Sci. 2017, 20, 79–89. [Google Scholar] [CrossRef]
- Stehman, S. V Estimating the Kappa coefficient and its variance under stratified random sampling. Photogramm. Eng. Remote Sens. 1996, 62, 401–407. [Google Scholar]
- Roy, D.P.; Li, J.; Zhang, H.K.; Yan, L. Best practices for the reprojection and resampling of Sentinel-2 Multi Spectral Instrument Level 1C data. Remote Sens. Lett. 2016, 7, 1023–1032. [Google Scholar] [CrossRef]
- Tucker, C.J. Red and photographic infrared linear combinations for monitoring vegetation. Remote Sens. Environ. 1979, 8, 127–150. [Google Scholar] [CrossRef]
- Farajzadeh, M.; Egbal, M.N. Evaluation of MEDALUS model for desertification hazard zonation using GIS; study area: Iyzad Khast plain, Iran. Pak. J. Biol. Sci. 2007, 10, 2622–2630. [Google Scholar] [CrossRef] [PubMed]
- Speth, P.; Christoph, M.; Deikkrüger, B.; Bollig, M. Impacts of Global Change on the Hydrological Cycle in West and Northwest Africa; Springer: Berlin, Germany, 2010; ISBN 9783642129568. [Google Scholar]
- Hargreaves, G.H.; Allen, R.G. History and evaluation of hargreaves evapotranspiration equation. J. Irrig. Drain. Eng. 2003, 129, 53–63. [Google Scholar] [CrossRef]
- Barrow, C.J. UNEP World Atlas of Desertification; Middleton, N., Thomas, D.S.G., Eds.; Edward Arnold: London, UK, 1992; ISBN 0340555122. [Google Scholar]
- Taghipour-javi, S.; Fazeli, A.; Kazemi, B. A case study of desertification hazard mapping using the MEDALUS (ESAs) methodology in southwest Iran. J. Nat. Resour. Dev. 2016, 6, 1–8. [Google Scholar] [CrossRef]
- Bouhata, R.; Kalla, M. Mapping of environmental vulnerability of desertification by adaptation of the MEDALUS method in the endoreic area of gadaine (eastern Algeria). Geogr. Tech. 2014, 09, 1–8. [Google Scholar]
- Benmohammadi, A.; Benmohammadi, L.; Ballais, J.-L.; Riser, J. Analyse des inter-relations anthropiques et naturelles: leur impact sur la recrudescence des phénomènes d’ensablement et de désertification au sud-est du Maroc (vallée de Drâa et vallée de Ziz). Sécheresse 2000, 11, 297–308. [Google Scholar]
- Karmaoui, A.; Ifaadassan, I.; Babqiqi, A.; Messouli, M.; Khebiza, M.Y. Analysis of the water supply-demand relationship in the Middle Draa Valley, Morocco, under climate change and socio-economic scenarios. J. Sci. Res. Rep. 2016, 9, 1–10. [Google Scholar] [CrossRef]
- Sraïri, M.T. New Challenges for the Moroccan Agricultural Sector to Cope with Local and Global Changes; Nova Science Publishers: Neu York, NY, USA, 2017; pp. 165–188. ISBN 9781536124705. [Google Scholar]
- Bentaleb, A. Dynamique de Désertification Dans les Oasis du Draa Moyen; Éditions Universitaires Européennes: Paris, France, 2015; ISBN 3841664431. [Google Scholar]
- Bouaouinate, A. Les Acteurs Locaux du Tourisme de Désert au Maroc Cas de l’Erg Chebbi et de Zagora-M’hamid; Éditions Universitaires Européennes: Paris, France, 2014; ISBN 9783841741806. [Google Scholar]


| Index | Class | Description | Weight |
|---|---|---|---|
| Parent material | Coherent | Limestone granite, quartzite, basalt, conglomerate | 1 |
| Moderately | Unconsolidated scree, granite, rhyolite, gneiss | 1.5 | |
| Soft to friable | Clay, marl, sand, superficial formations | 2 | |
| Slope (%) | <6 | Flat to gentle | 1 |
| 6–18 | Steep | 1.5 | |
| 18–35 | Very gentle | 2 | |
| Soil depth (cm) | 60–100 | Deep | 1 |
| 31–60 | Moderate | 1.5 | |
| <30 | Shallow | 2 | |
| Soil Brightness (Albedo) | 0–0.2 | Somber | 1 |
| 0.2–0.25 | Moderately bright | 1.5 | |
| 0.25–1 | Bright | 2 |
| Index | Class | Description | Weight |
|---|---|---|---|
| Rainfall (mm) | >85 | High | 1 |
| 70–85 | Moderate | 1.5 | |
| 55–70 | Low | 2 | |
| Aridity | 0.03–1 | Low aridity | 1 |
| 0.023–0.03 | Moderate aridity | 1.5 | |
| 0.019–0.023 | High aridity | 2 | |
| Aspect | NW–NE | Wet | 1 |
| SW–SE | Dry | 2 |
| Index | Class | Description | Weight |
|---|---|---|---|
| Fire Risk | Low | Water, bare land | 1 |
| Moderate | Pastoral lands, seasonal Saharan vegetation | 1.5 | |
| High | Palm grove, agricultural lands | 2 | |
| Erosion protection | Low | Palm grove, agricultural lands | 1 |
| Moderate | Pastoral lands, seasonal Saharan vegetation | 1.5 | |
| High | bare land, sand dunes | 2 | |
| Drought resistance | Low | Palm grove, agricultural lands | 1 |
| Moderate | Pastoral lands, seasonal Saharan vegetation | 1.5 | |
| High | Bare land, water body | 2 | |
| Plant cover | Low | >30% | 1 |
| Moderate | 10–30% | 2 | |
| High | <10% | 3 |
| Locality | Demography | Cattle | Sheep D’man | Sheep Rahali | Dairy goat | Rahali goat | Camel |
|---|---|---|---|---|---|---|---|
| Ktaoua | 16,167 | 80 | 5284 | 0 | 252 | 12,108 | 3149 |
| Mhamid | 6871 | 7 | 4963 | 2474 | 1764 | 5888 | 5312 |
| Zagora | 39,987 | 102 | 620 | 0 | 490 | 0 | 173 |
| Ternata | 16,512 | 152 | 6656 | 0 | 314 | 0 | 0 |
| Errouha | 10,511 | 148 | 3490 | 0 | 150 | 804 | 4 |
| Fezouata | 9416 | 216 | 4304 | 0 | 0 | 218 | 12 |
| Tamgroute | 21,574 | 332 | 2340 | 0 | 72 | 0 | 8 |
| Benizoli | 18,941 | 518 | 2730 | 0 | 177 | 606 | 0 |
| Index | Class | Description | Weight |
|---|---|---|---|
| Human pressure (Capeta) | <10,000 | Low | 1 |
| 10,000–20,000 | Moderately dense | 1.5 | |
| >20,000 | Very dense | 2 | |
| Grazing pressure | <5500 units | Low | 1 |
| 5500–7500 units | Moderately dense | 1.5 | |
| >7500 units | Very dense | 2 |
| Indicator | Class | Area (km2) | Proportion (%) |
|---|---|---|---|
| SQI | High | 369.68 | 43.21 |
| Moderate | 266.34 | 31.13 | |
| Low | 219.40 | 25.64 | |
| VQI | High | 49.58 | 5.78 |
| Moderate | 133.38 | 15.55 | |
| Low | 674.32 | 78.65 | |
| CQI | High | 234.75 | 27.43 |
| Moderate | 255.06 | 29.80 | |
| Low | 365.93 | 42.76 | |
| MQI | High | 108.23 | 12.62 |
| Moderate | 548.15 | 63.92 | |
| Low | 201.08 | 23.45 |
| Index | Description | Surface (km2) | Proportion (%) |
|---|---|---|---|
| ESAI | Potentially affected areas | 141.85 | 16.63 |
| Moderately fragile areas | 281.58 | 33.02 | |
| Highly fragile areas | 199.73 | 23.42 | |
| Highly critical areas | 229.56 | 26.92 |
© 2018 by the authors. Licensee MDPI, Basel, Switzerland. This article is an open access article distributed under the terms and conditions of the Creative Commons Attribution (CC BY) license (http://creativecommons.org/licenses/by/4.0/).
Share and Cite
Ait Lamqadem, A.; Pradhan, B.; Saber, H.; Rahimi, A. Desertification Sensitivity Analysis Using MEDALUS Model and GIS: A Case Study of the Oases of Middle Draa Valley, Morocco. Sensors 2018, 18, 2230. https://doi.org/10.3390/s18072230
Ait Lamqadem A, Pradhan B, Saber H, Rahimi A. Desertification Sensitivity Analysis Using MEDALUS Model and GIS: A Case Study of the Oases of Middle Draa Valley, Morocco. Sensors. 2018; 18(7):2230. https://doi.org/10.3390/s18072230
Chicago/Turabian StyleAit Lamqadem, Atman, Biswajeet Pradhan, Hafid Saber, and Abdelmejid Rahimi. 2018. "Desertification Sensitivity Analysis Using MEDALUS Model and GIS: A Case Study of the Oases of Middle Draa Valley, Morocco" Sensors 18, no. 7: 2230. https://doi.org/10.3390/s18072230
APA StyleAit Lamqadem, A., Pradhan, B., Saber, H., & Rahimi, A. (2018). Desertification Sensitivity Analysis Using MEDALUS Model and GIS: A Case Study of the Oases of Middle Draa Valley, Morocco. Sensors, 18(7), 2230. https://doi.org/10.3390/s18072230