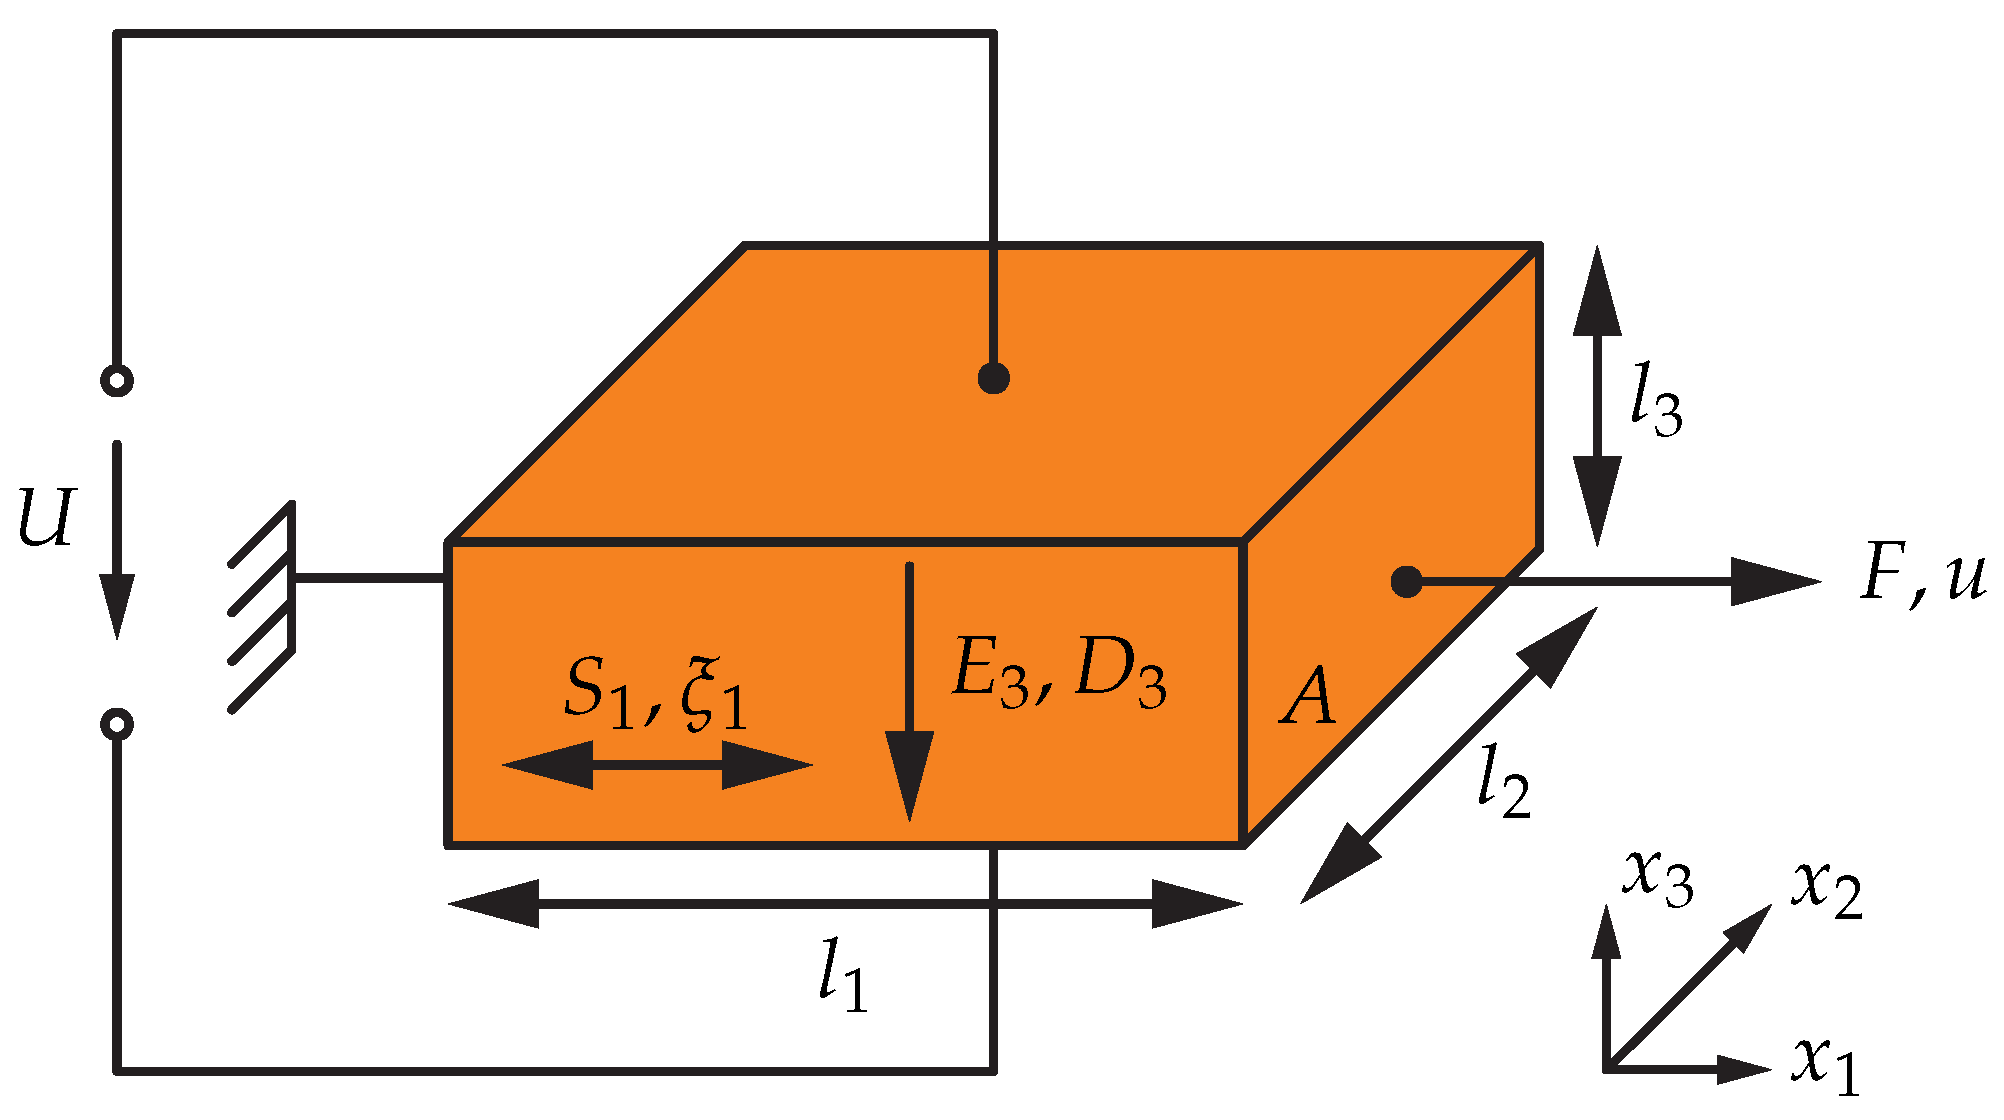
Figure 1.
Cuboid of piezoelectric material with electrical quantities and excited by an applied voltage U in vertical direction, and mechanical quantities and in lateral direction giving rise to the displacement u. , , and denote the geometrical dimensions of the cuboid and A is the cross-sectional area of the force F.
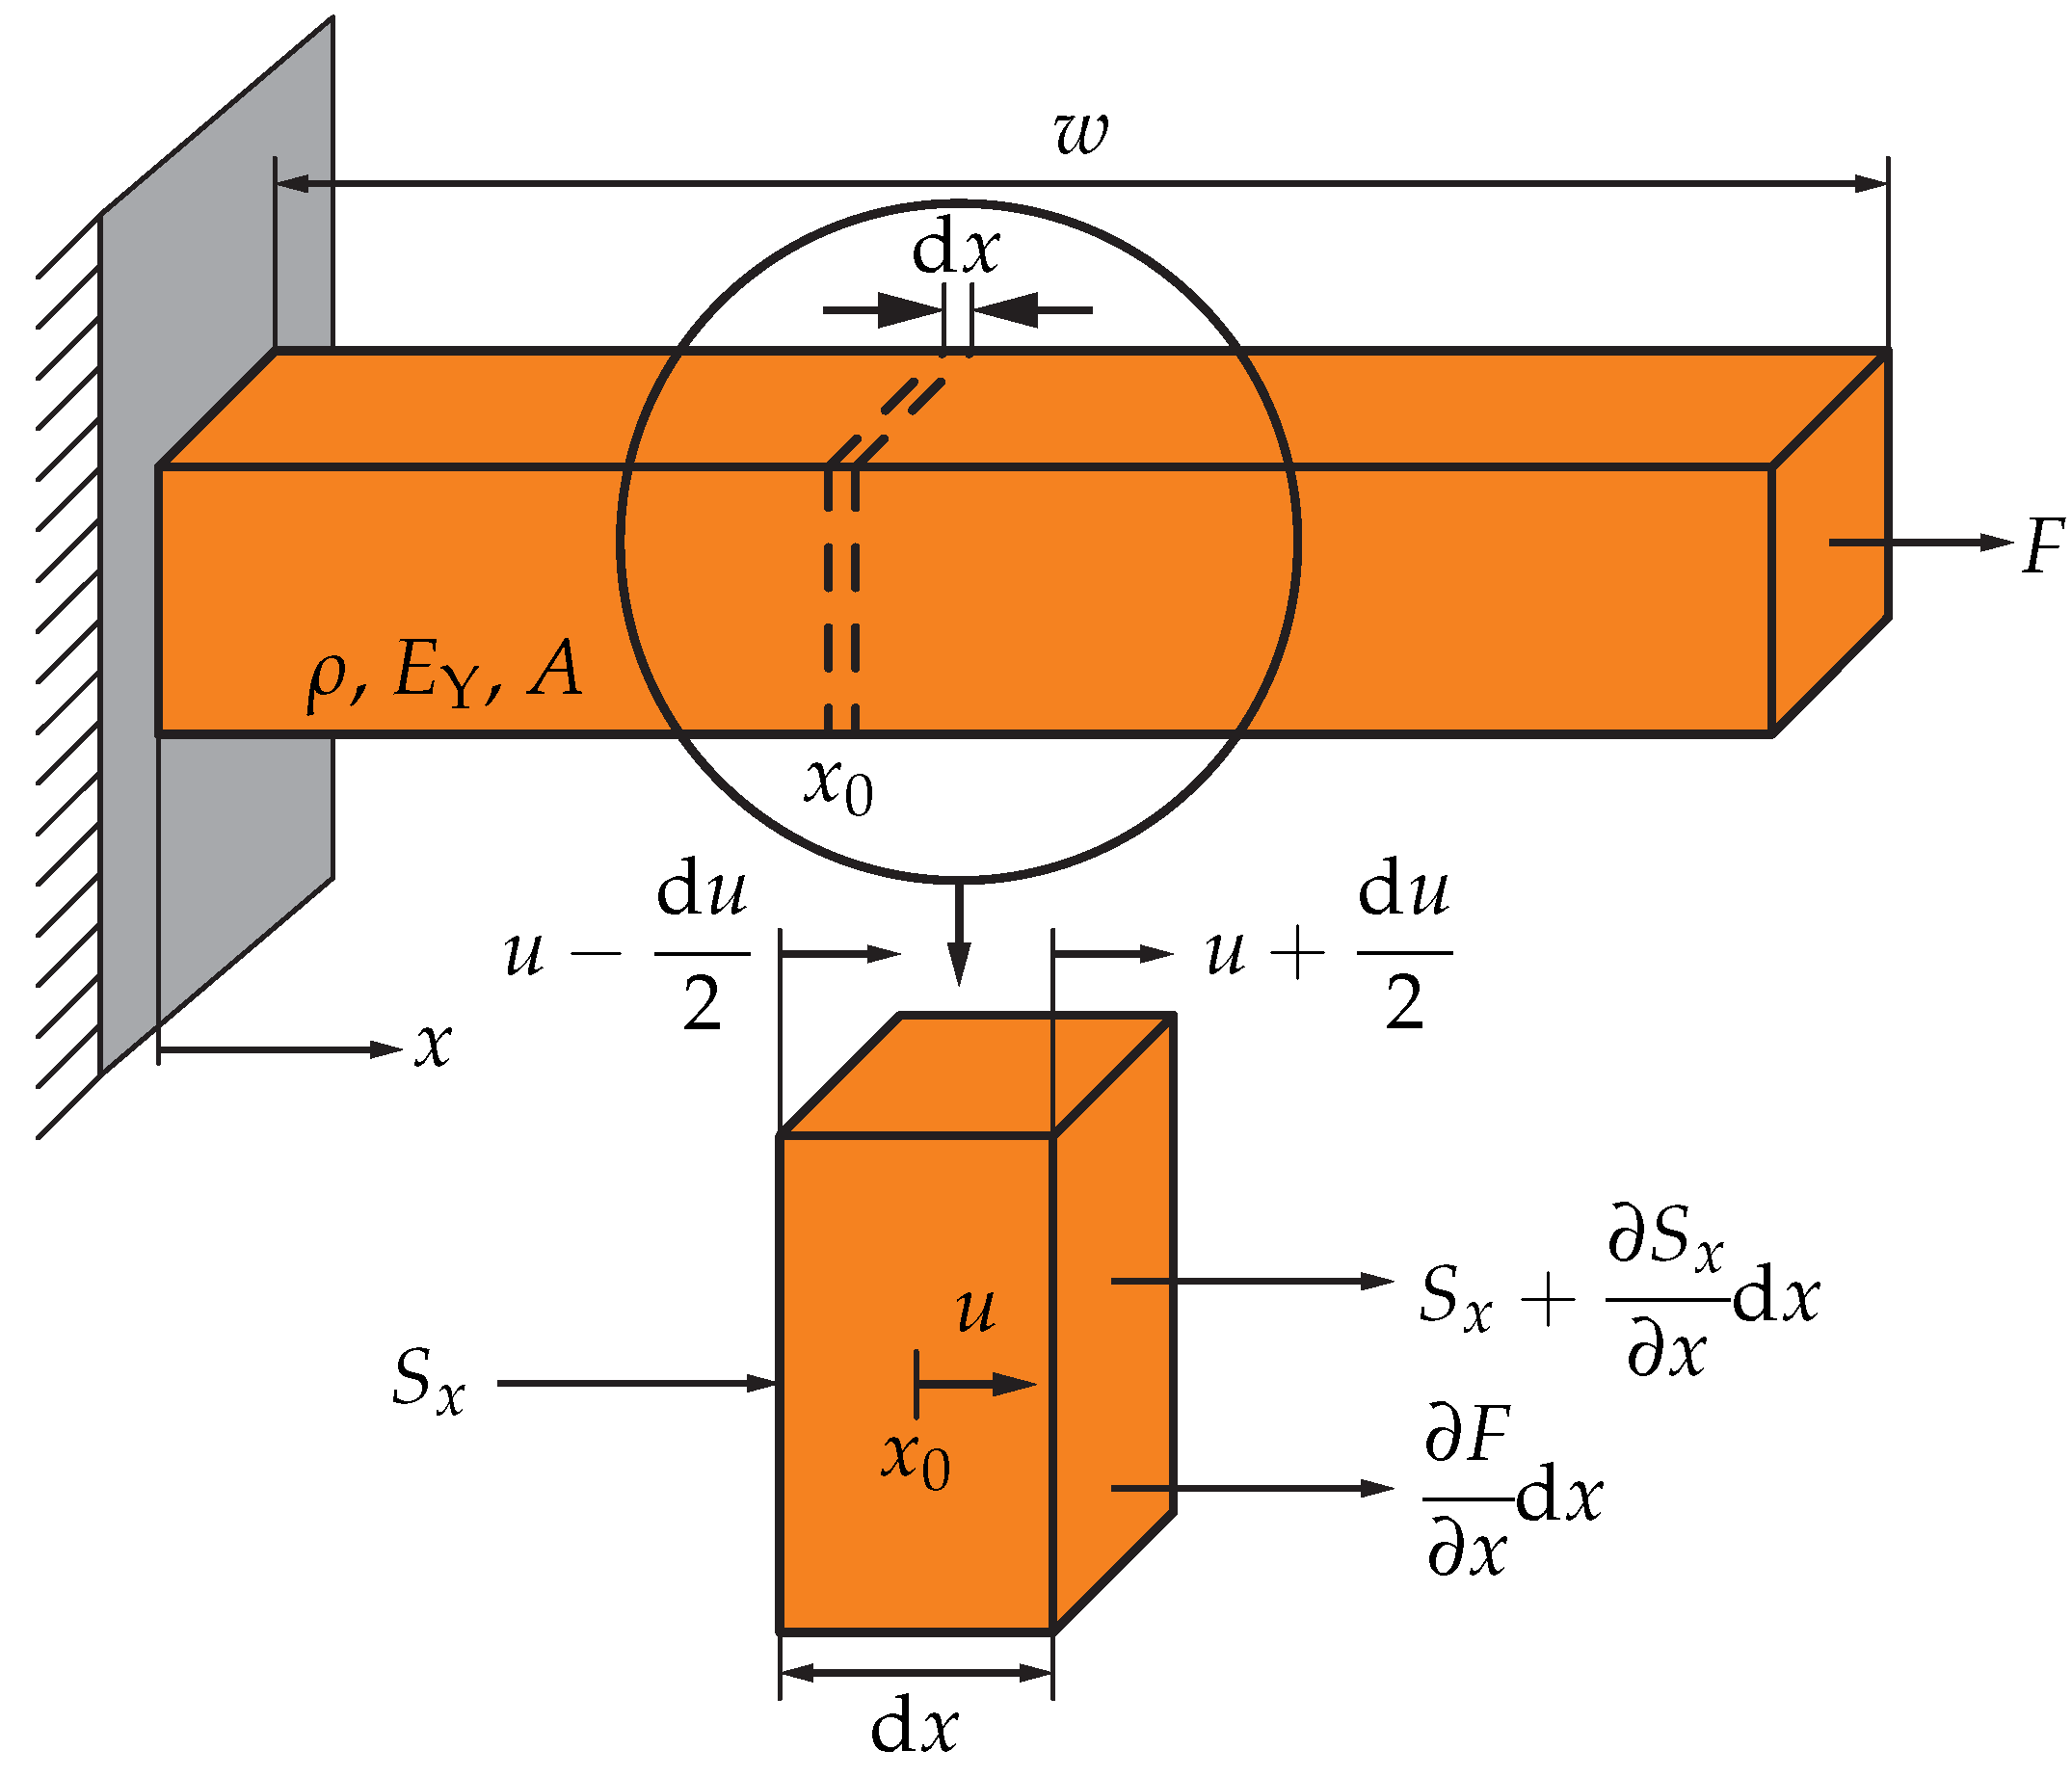
Figure 2.
Model of a laterally vibrating w-wide bar. In the lower part, a -wide slice of the bar at position is shown with the acting force as part of the exciting force F and the mechanical stress difference . The stress difference is caused by a deformation . The absolute displacement of the slice is u.
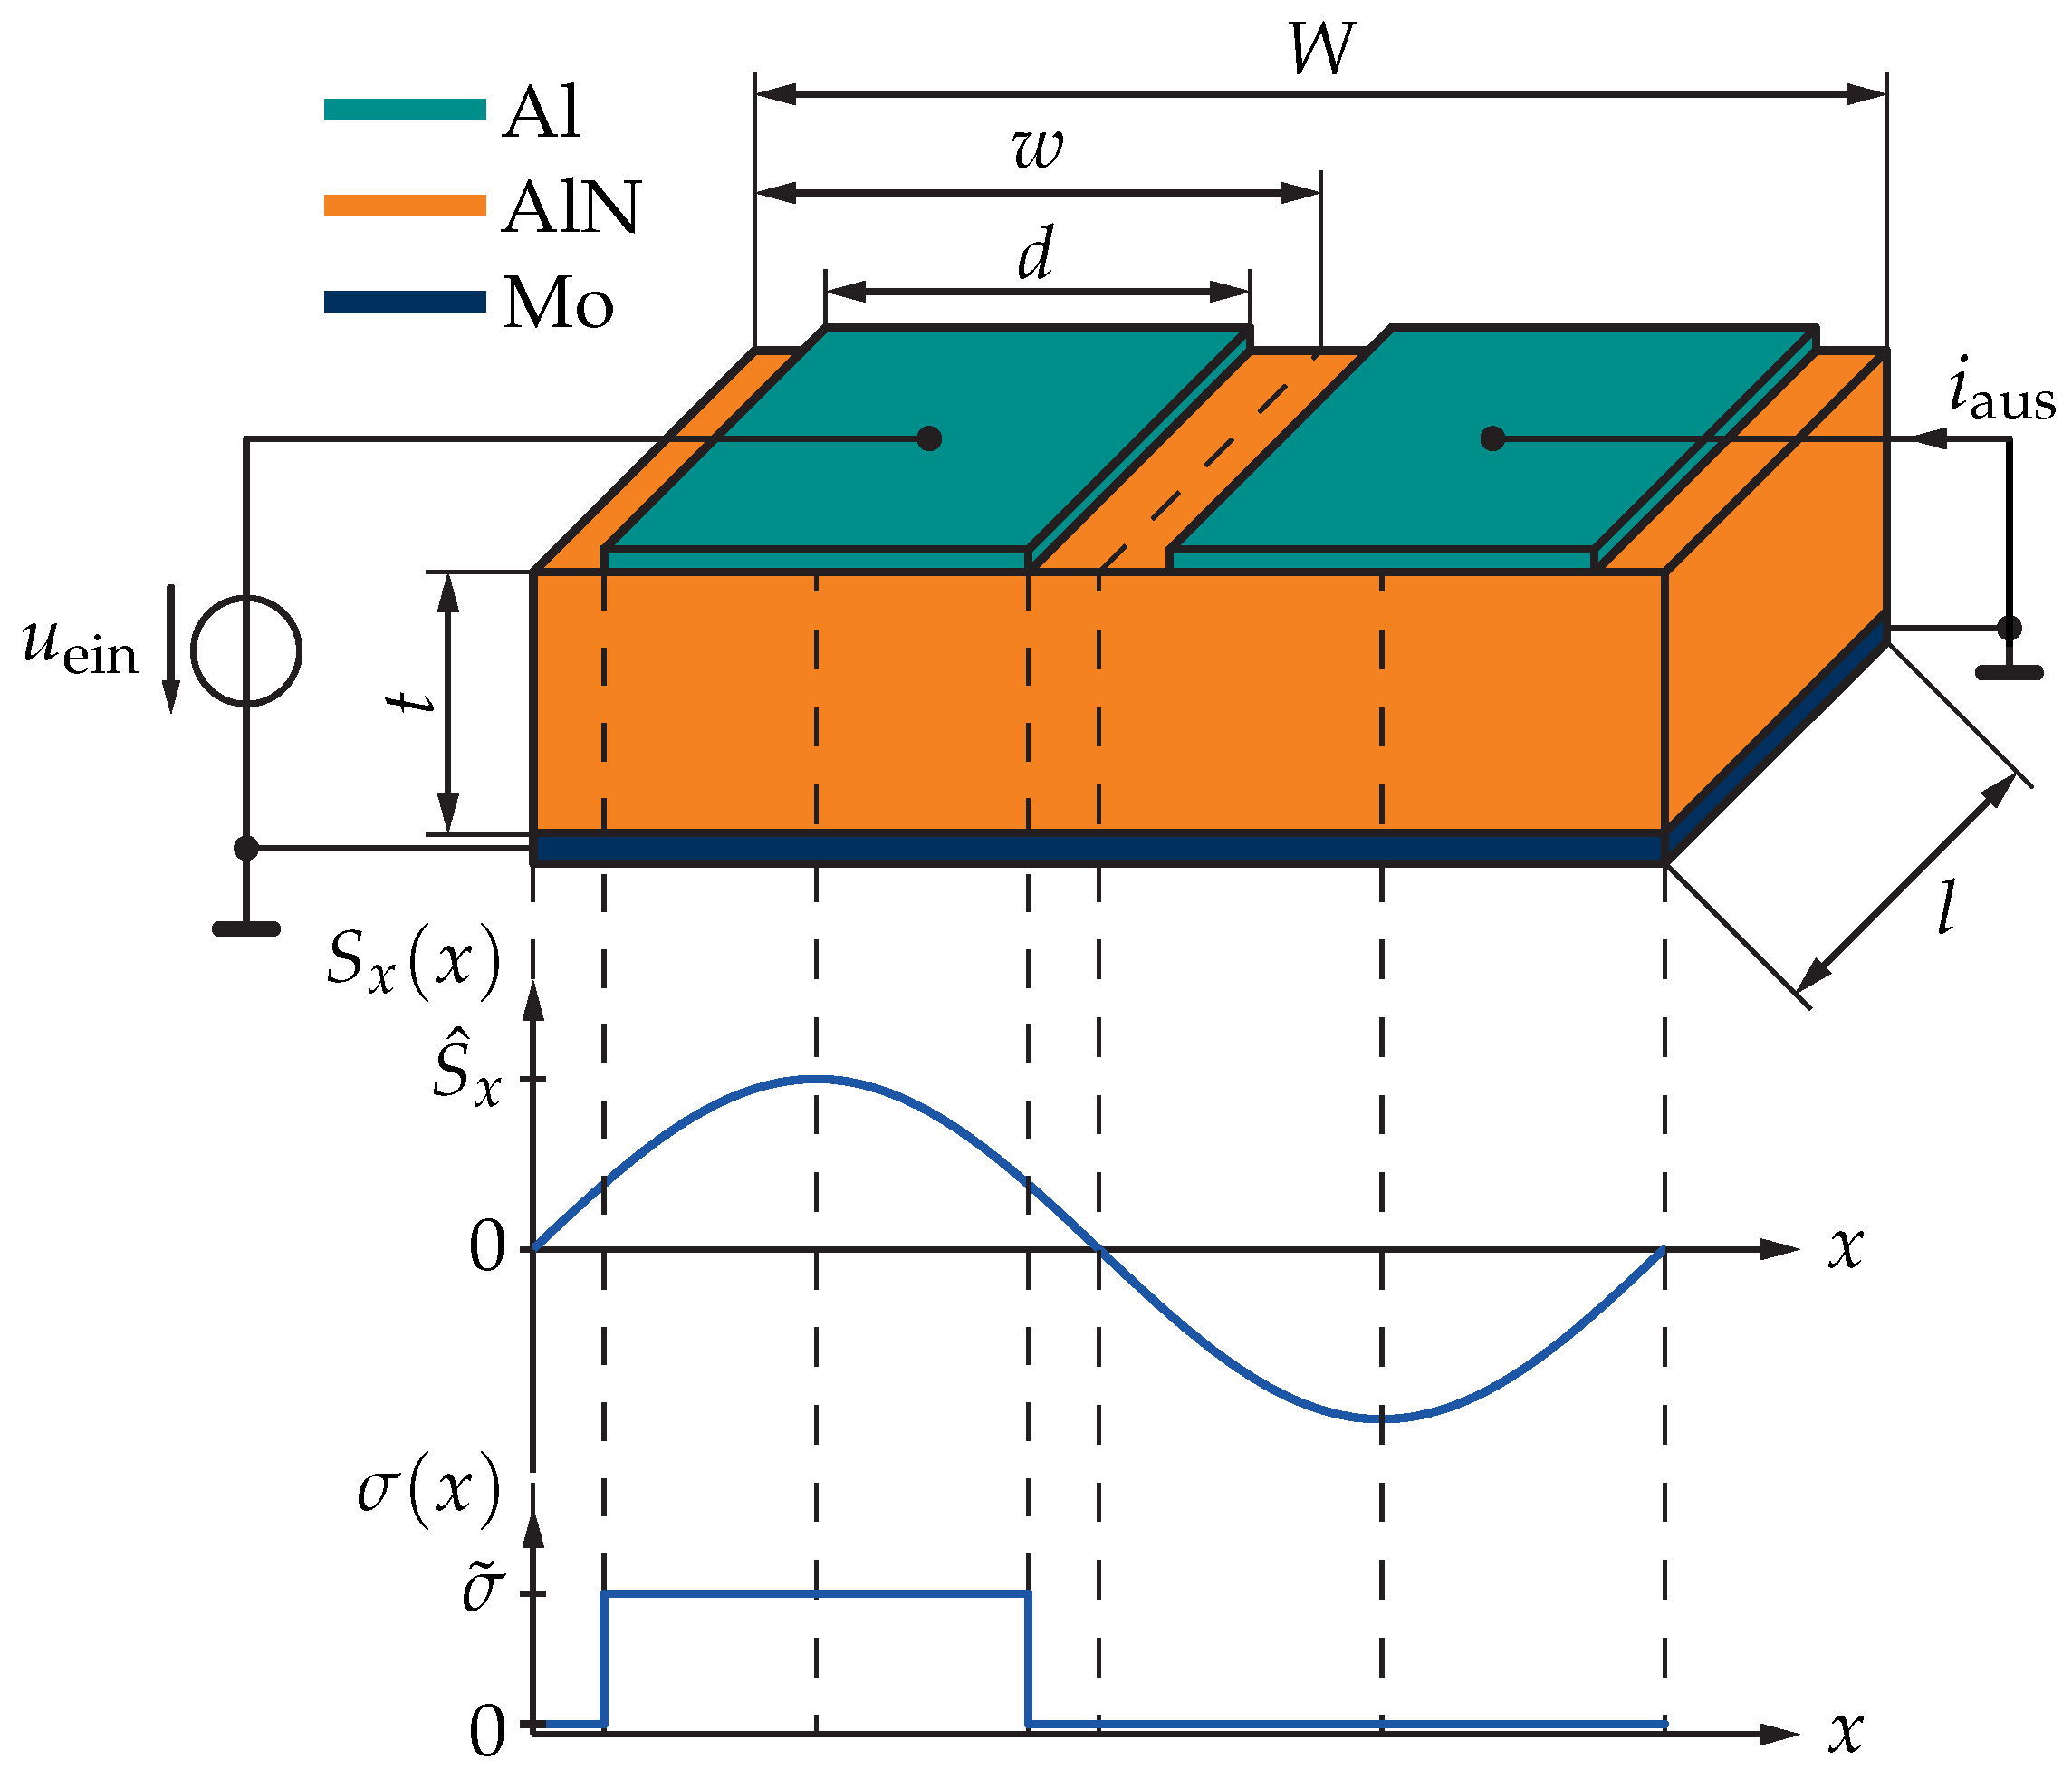
Figure 3.
Principle construction of a contour-mode resonator consisting of a piezoelectric AlN layer, a Mo ground electrode, and Al input and output fingers ( in this example). The finger width d, the element width w, the finger length l, and the AlN layer thickness t are also denoted in the figure. In the lower part of the figure, the fundamental mode of the mechanical stress and the exciting mechanical stress are indicated in terms of their variation along the position .
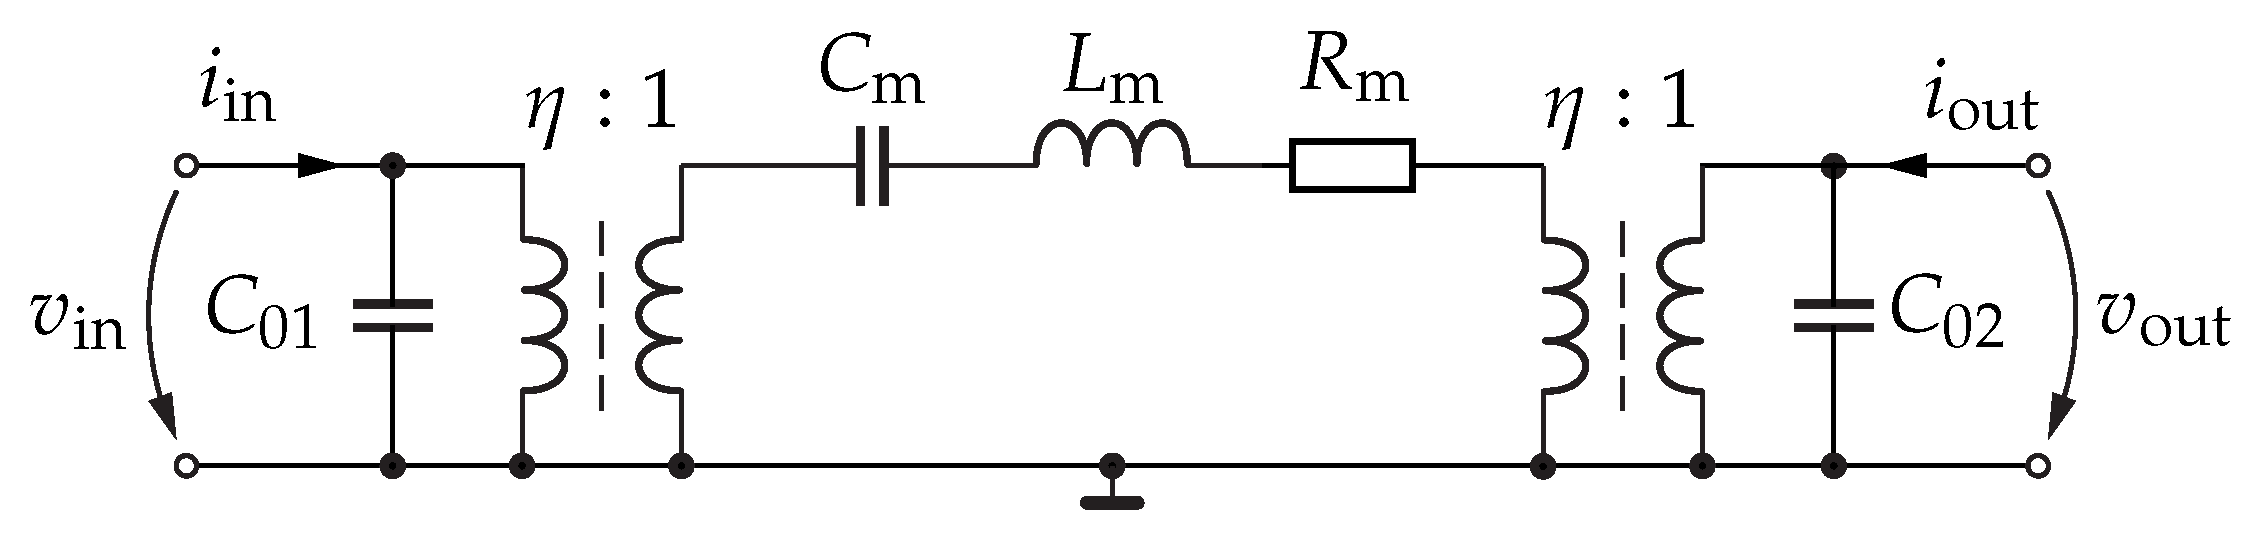
Figure 4.
Butterworth-van-Dyke model adapted to contour-mode resonators. The frequency-selective behaviour is modelled by the RLC circuit , , and . The static capacitances and represent the electrode structure, and the two transformers account for unsymmetric finger geometries.
Figure 4.
Butterworth-van-Dyke model adapted to contour-mode resonators. The frequency-selective behaviour is modelled by the RLC circuit , , and . The static capacitances and represent the electrode structure, and the two transformers account for unsymmetric finger geometries.
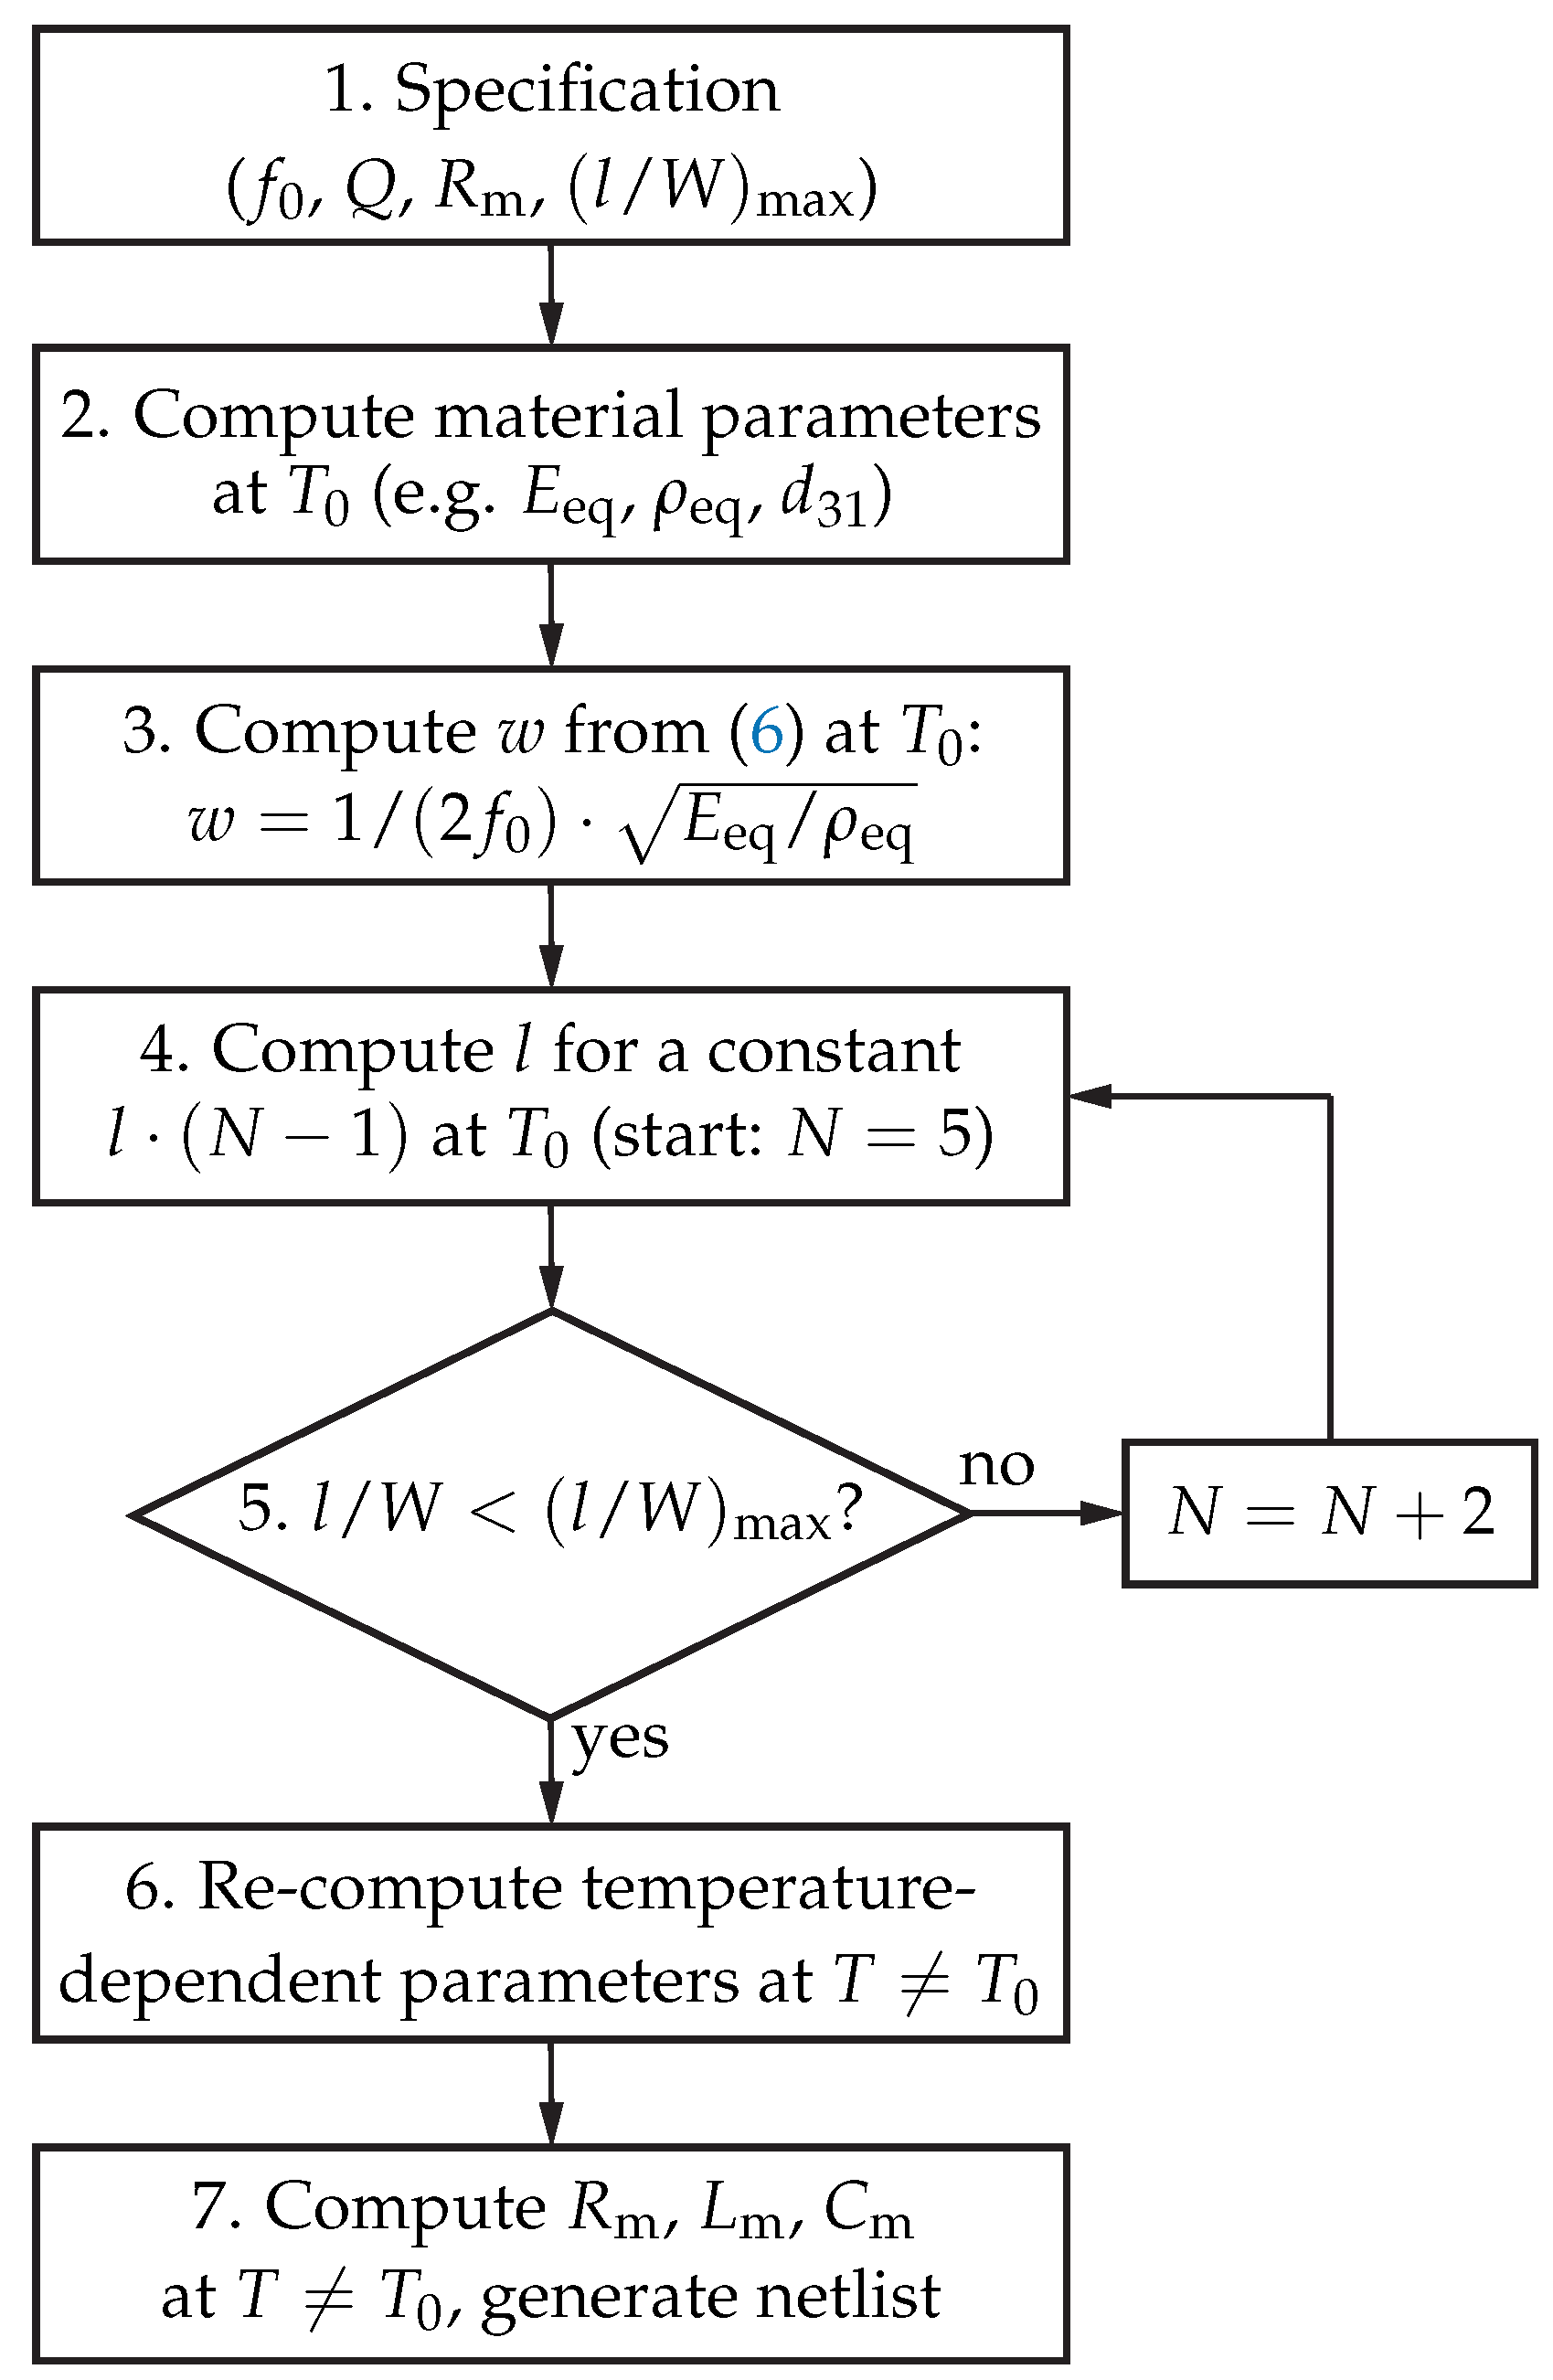
Figure 5.
Top-down design strategy for MEMS resonators. After the specification of , Q, , and the maximum -ratio in Step 1, the equivalent material parameters are computed based on the materials involved and the definition of the layer stack in Step 2. In Step 3, w is computed based on the specified . The resonator geometry is then optimised for a given maximum length-to-width ratio by increasing N by two and decreasing l for a constant in every iteration in the Steps 4 and 5. The result of the design strategy is the temperature dependent equivalent circuit for multi-physical simulations, computed in Steps 6 and 7.
Figure 6.
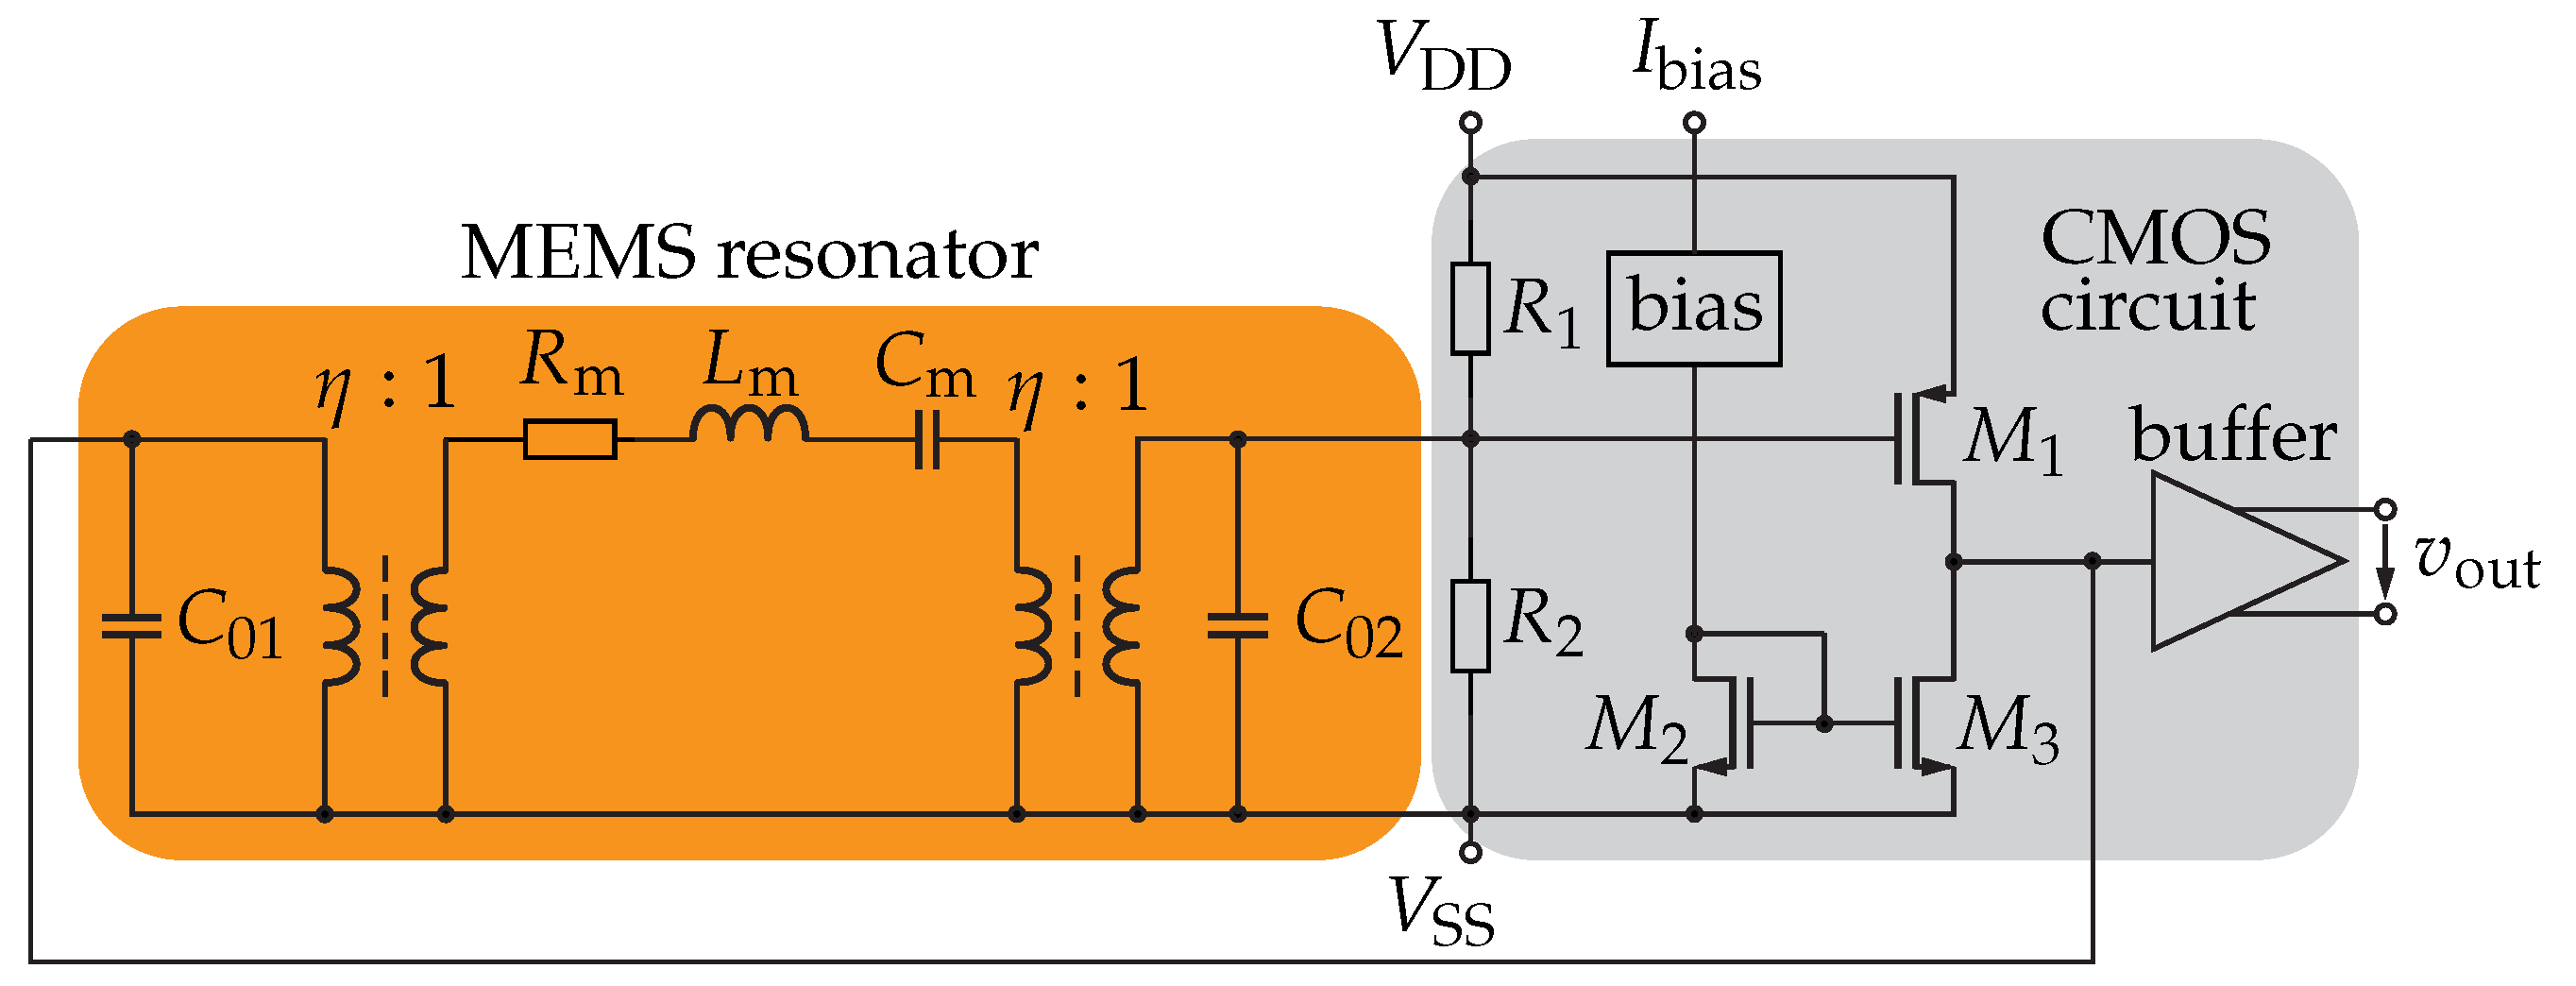
Top-level schematic of the MEMS oscillator including the simulation model for contour-mode MEMS resonators based on the strategy in
Figure 5 (left-hand side, orange-shaded). The CMOS circuit consists of a single-stage amplifier, a differential buffer, and bias circuitry (right-hand side, grey-shaded).
Figure 6.
Top-level schematic of the MEMS oscillator including the simulation model for contour-mode MEMS resonators based on the strategy in
Figure 5 (left-hand side, orange-shaded). The CMOS circuit consists of a single-stage amplifier, a differential buffer, and bias circuitry (right-hand side, grey-shaded).
Figure 7.
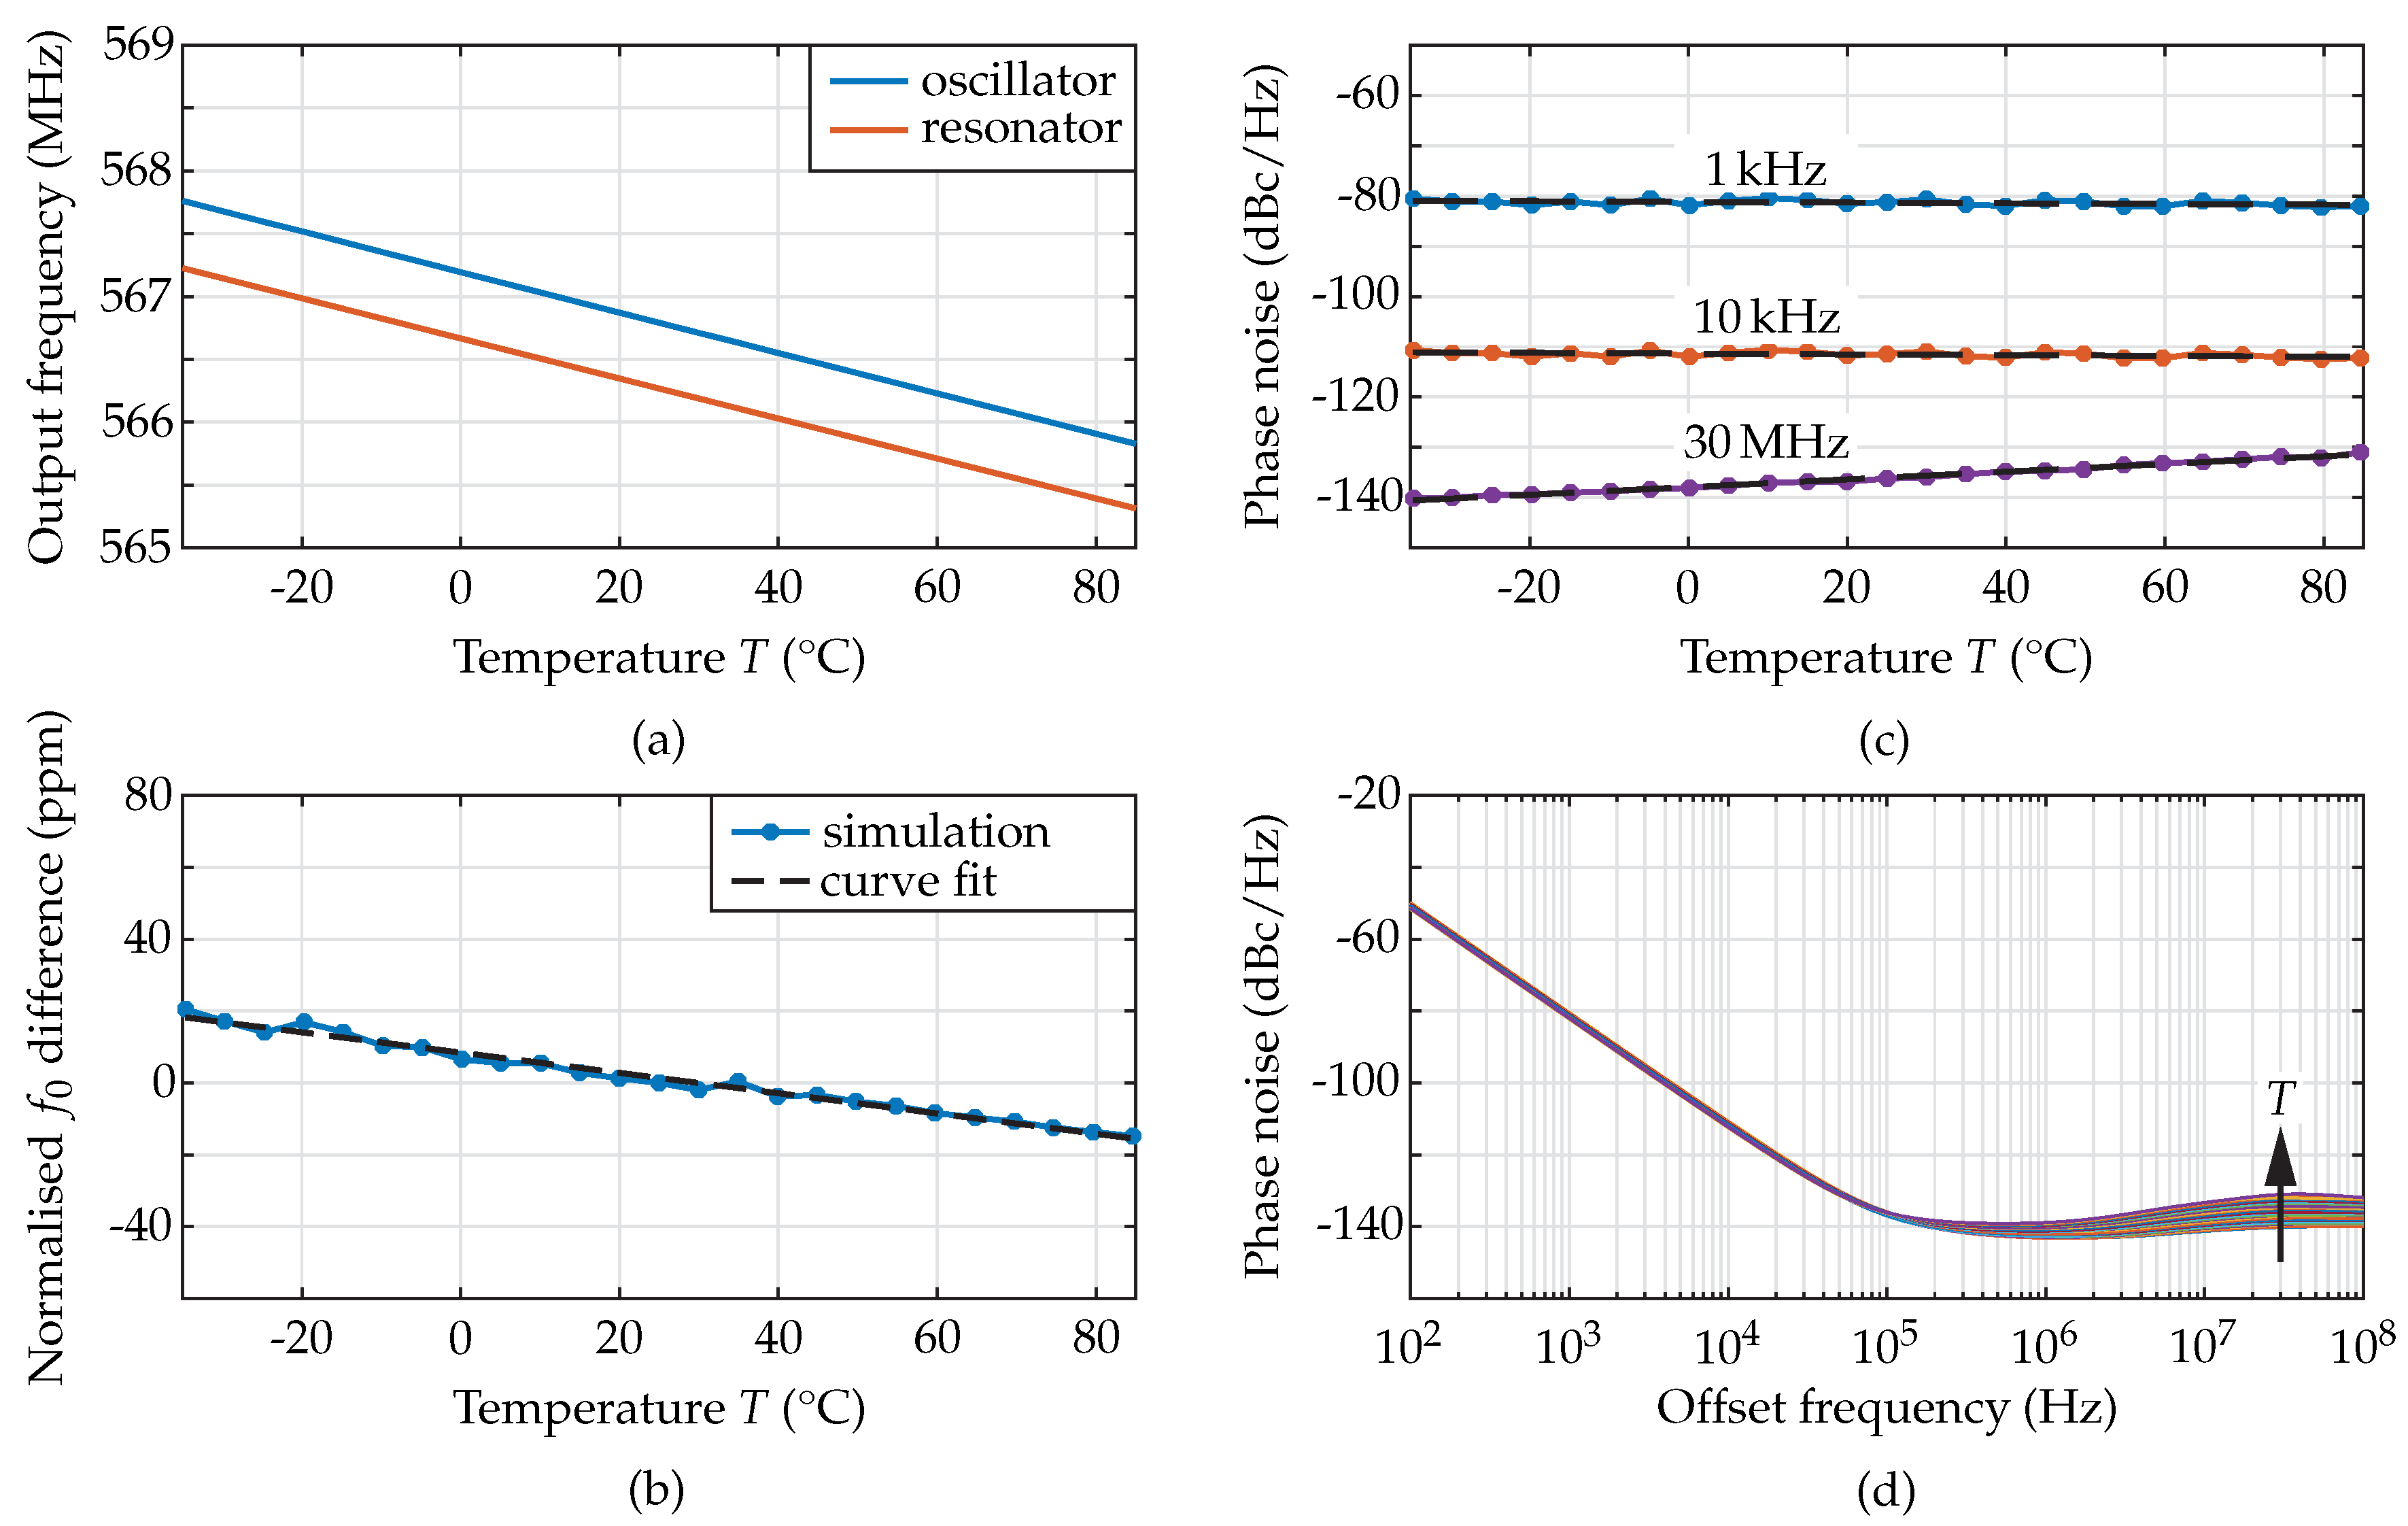
(a) Simulated temperature dependent output frequency of the MEMS oscillator. The resulting is found to be −28.4 ppm/K. (b) Comparison of the simulated and curve fitted difference of normalised to its values at 25 C for oscillator and resonator. The difference of the is −0.28 ppm/K. (c) Temperature-dependent phase noise simulation of the MEMS oscillator at different offsets from the frequency of oscillation. Each curve is fitted using a test function (black-dashed lines). At an offset of 1 kHz from the oscillation frequency, the phase noise shows variations between −82 dBc/Hz and −80 dBc/Hz with no detectable influence from the temperature. The noise floor, taken at an offset of 30 MHz, increases linearly with temperature from −140 dBc/Hz to −131 dBc/Hz. (d) Complete phase–noise curves having the temperature as curve parameter. For every temperature simulated, one differently coloured curve is shown.
Figure 7.
(a) Simulated temperature dependent output frequency of the MEMS oscillator. The resulting is found to be −28.4 ppm/K. (b) Comparison of the simulated and curve fitted difference of normalised to its values at 25 C for oscillator and resonator. The difference of the is −0.28 ppm/K. (c) Temperature-dependent phase noise simulation of the MEMS oscillator at different offsets from the frequency of oscillation. Each curve is fitted using a test function (black-dashed lines). At an offset of 1 kHz from the oscillation frequency, the phase noise shows variations between −82 dBc/Hz and −80 dBc/Hz with no detectable influence from the temperature. The noise floor, taken at an offset of 30 MHz, increases linearly with temperature from −140 dBc/Hz to −131 dBc/Hz. (d) Complete phase–noise curves having the temperature as curve parameter. For every temperature simulated, one differently coloured curve is shown.
Figure 8.
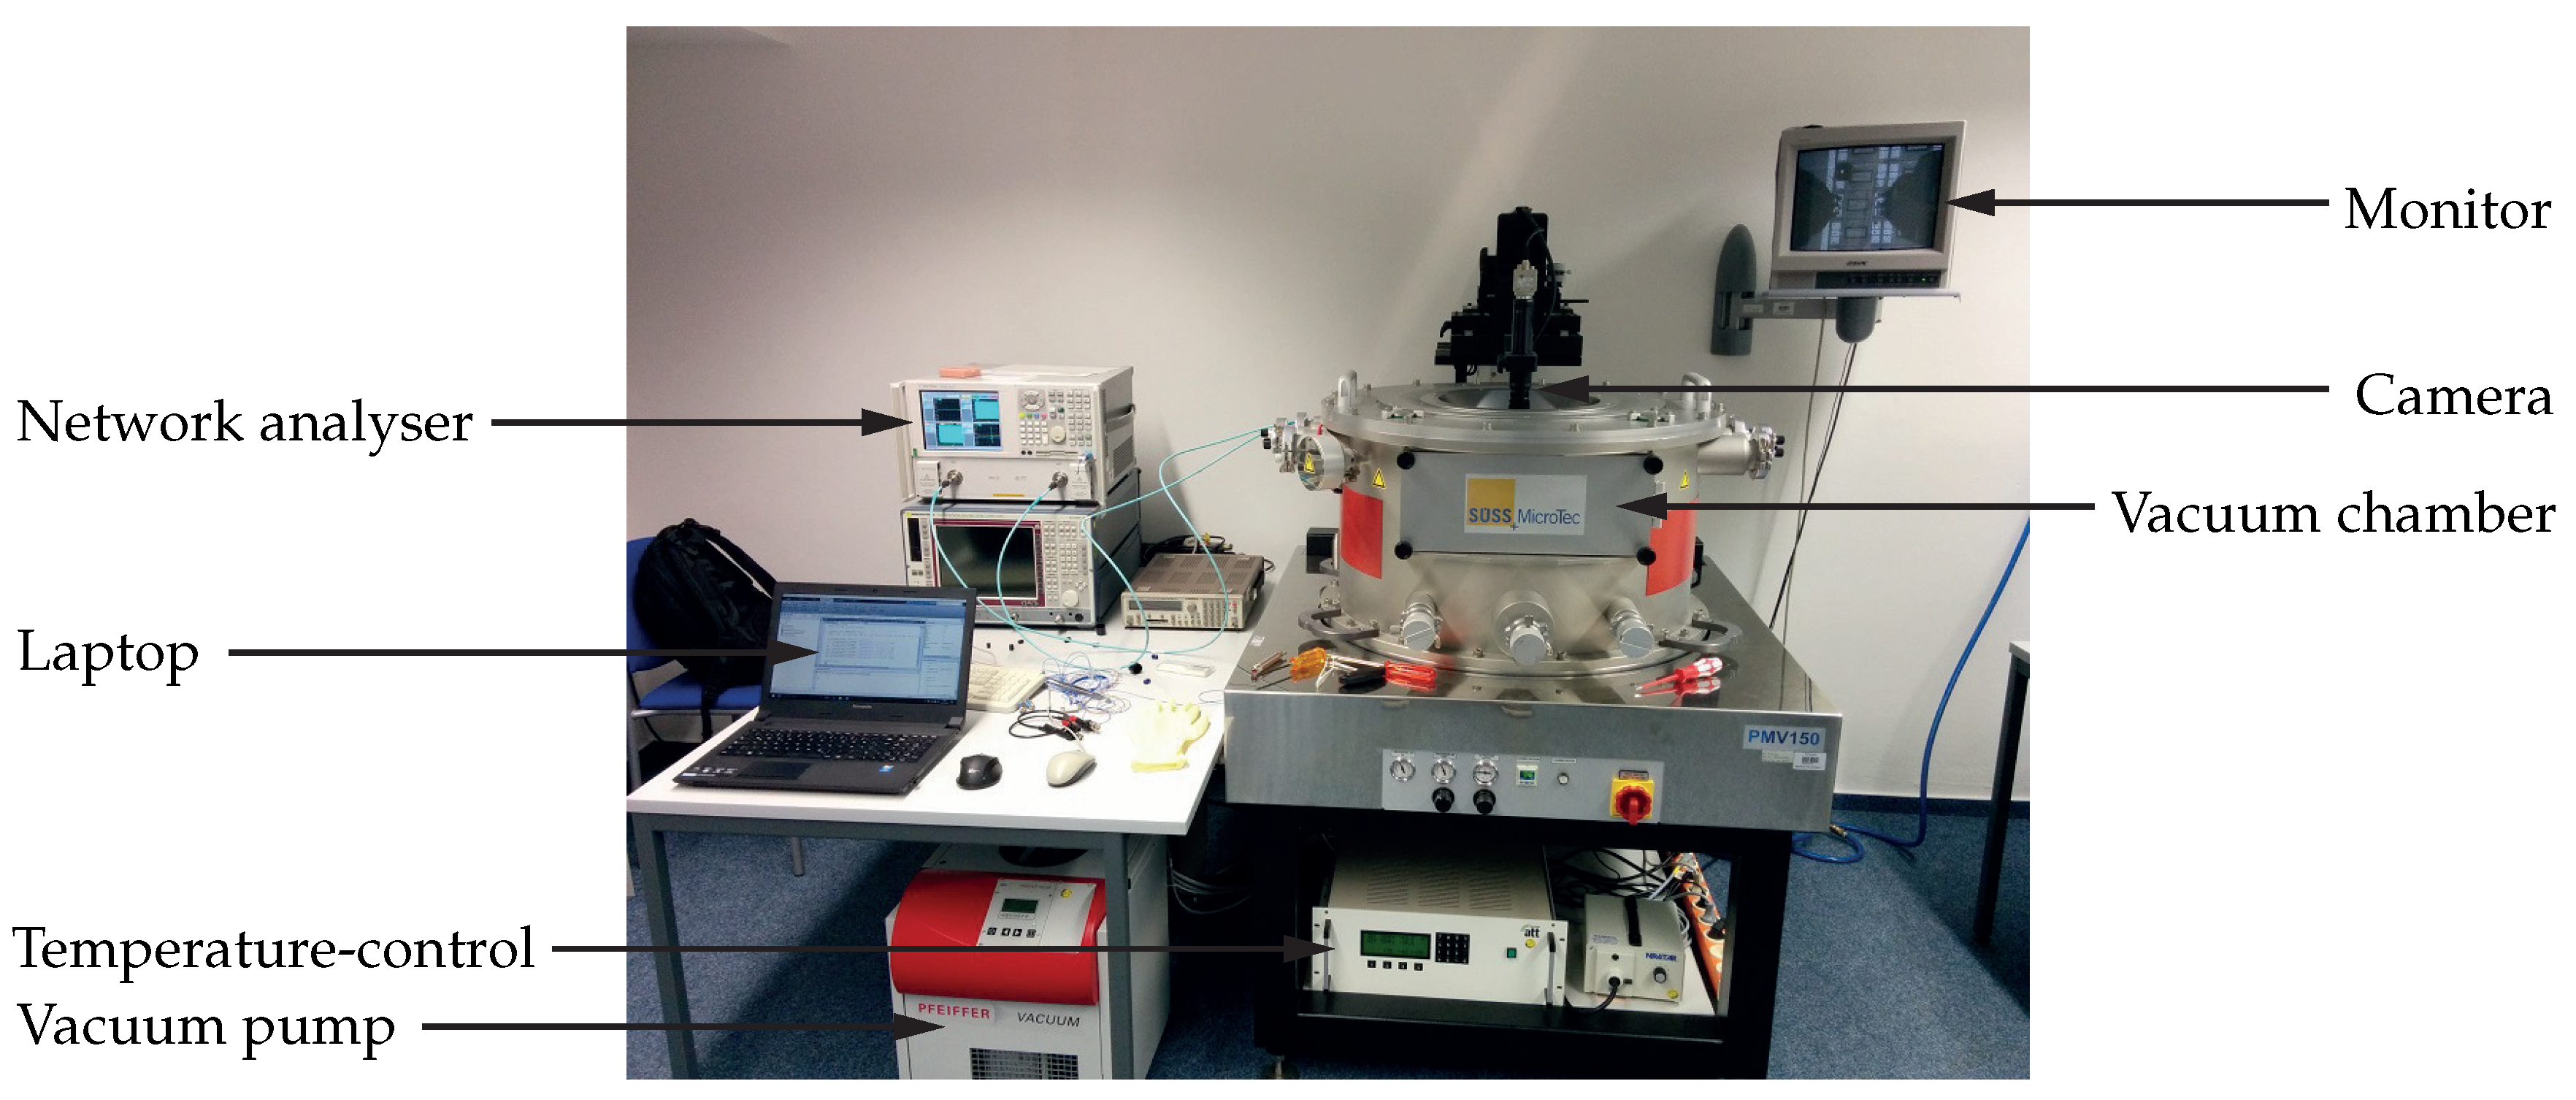
Measurement setup for the investigation of the temperature dependent RF behaviour of MEMS resonators. The setup consists of the vacuum chamber PMV150 (Süss MicroTec), the vacuum-pump station TSH 261 (Pfeiffer Vacuum) providing a chamber pressure of approximately 100 Pa, the temperature-control unit P150 (Advanced Temperature Test Systems) covering a temperature range from −40 C to 150 C, a camera with microscope and monitor, the network analyser PNA-L N5230A (Keysight Technologie, Santa Rosa, CA, USA), and a laptop for the evaluation with MATLAB.
Figure 8.
Measurement setup for the investigation of the temperature dependent RF behaviour of MEMS resonators. The setup consists of the vacuum chamber PMV150 (Süss MicroTec), the vacuum-pump station TSH 261 (Pfeiffer Vacuum) providing a chamber pressure of approximately 100 Pa, the temperature-control unit P150 (Advanced Temperature Test Systems) covering a temperature range from −40 C to 150 C, a camera with microscope and monitor, the network analyser PNA-L N5230A (Keysight Technologie, Santa Rosa, CA, USA), and a laptop for the evaluation with MATLAB.
Figure 9.
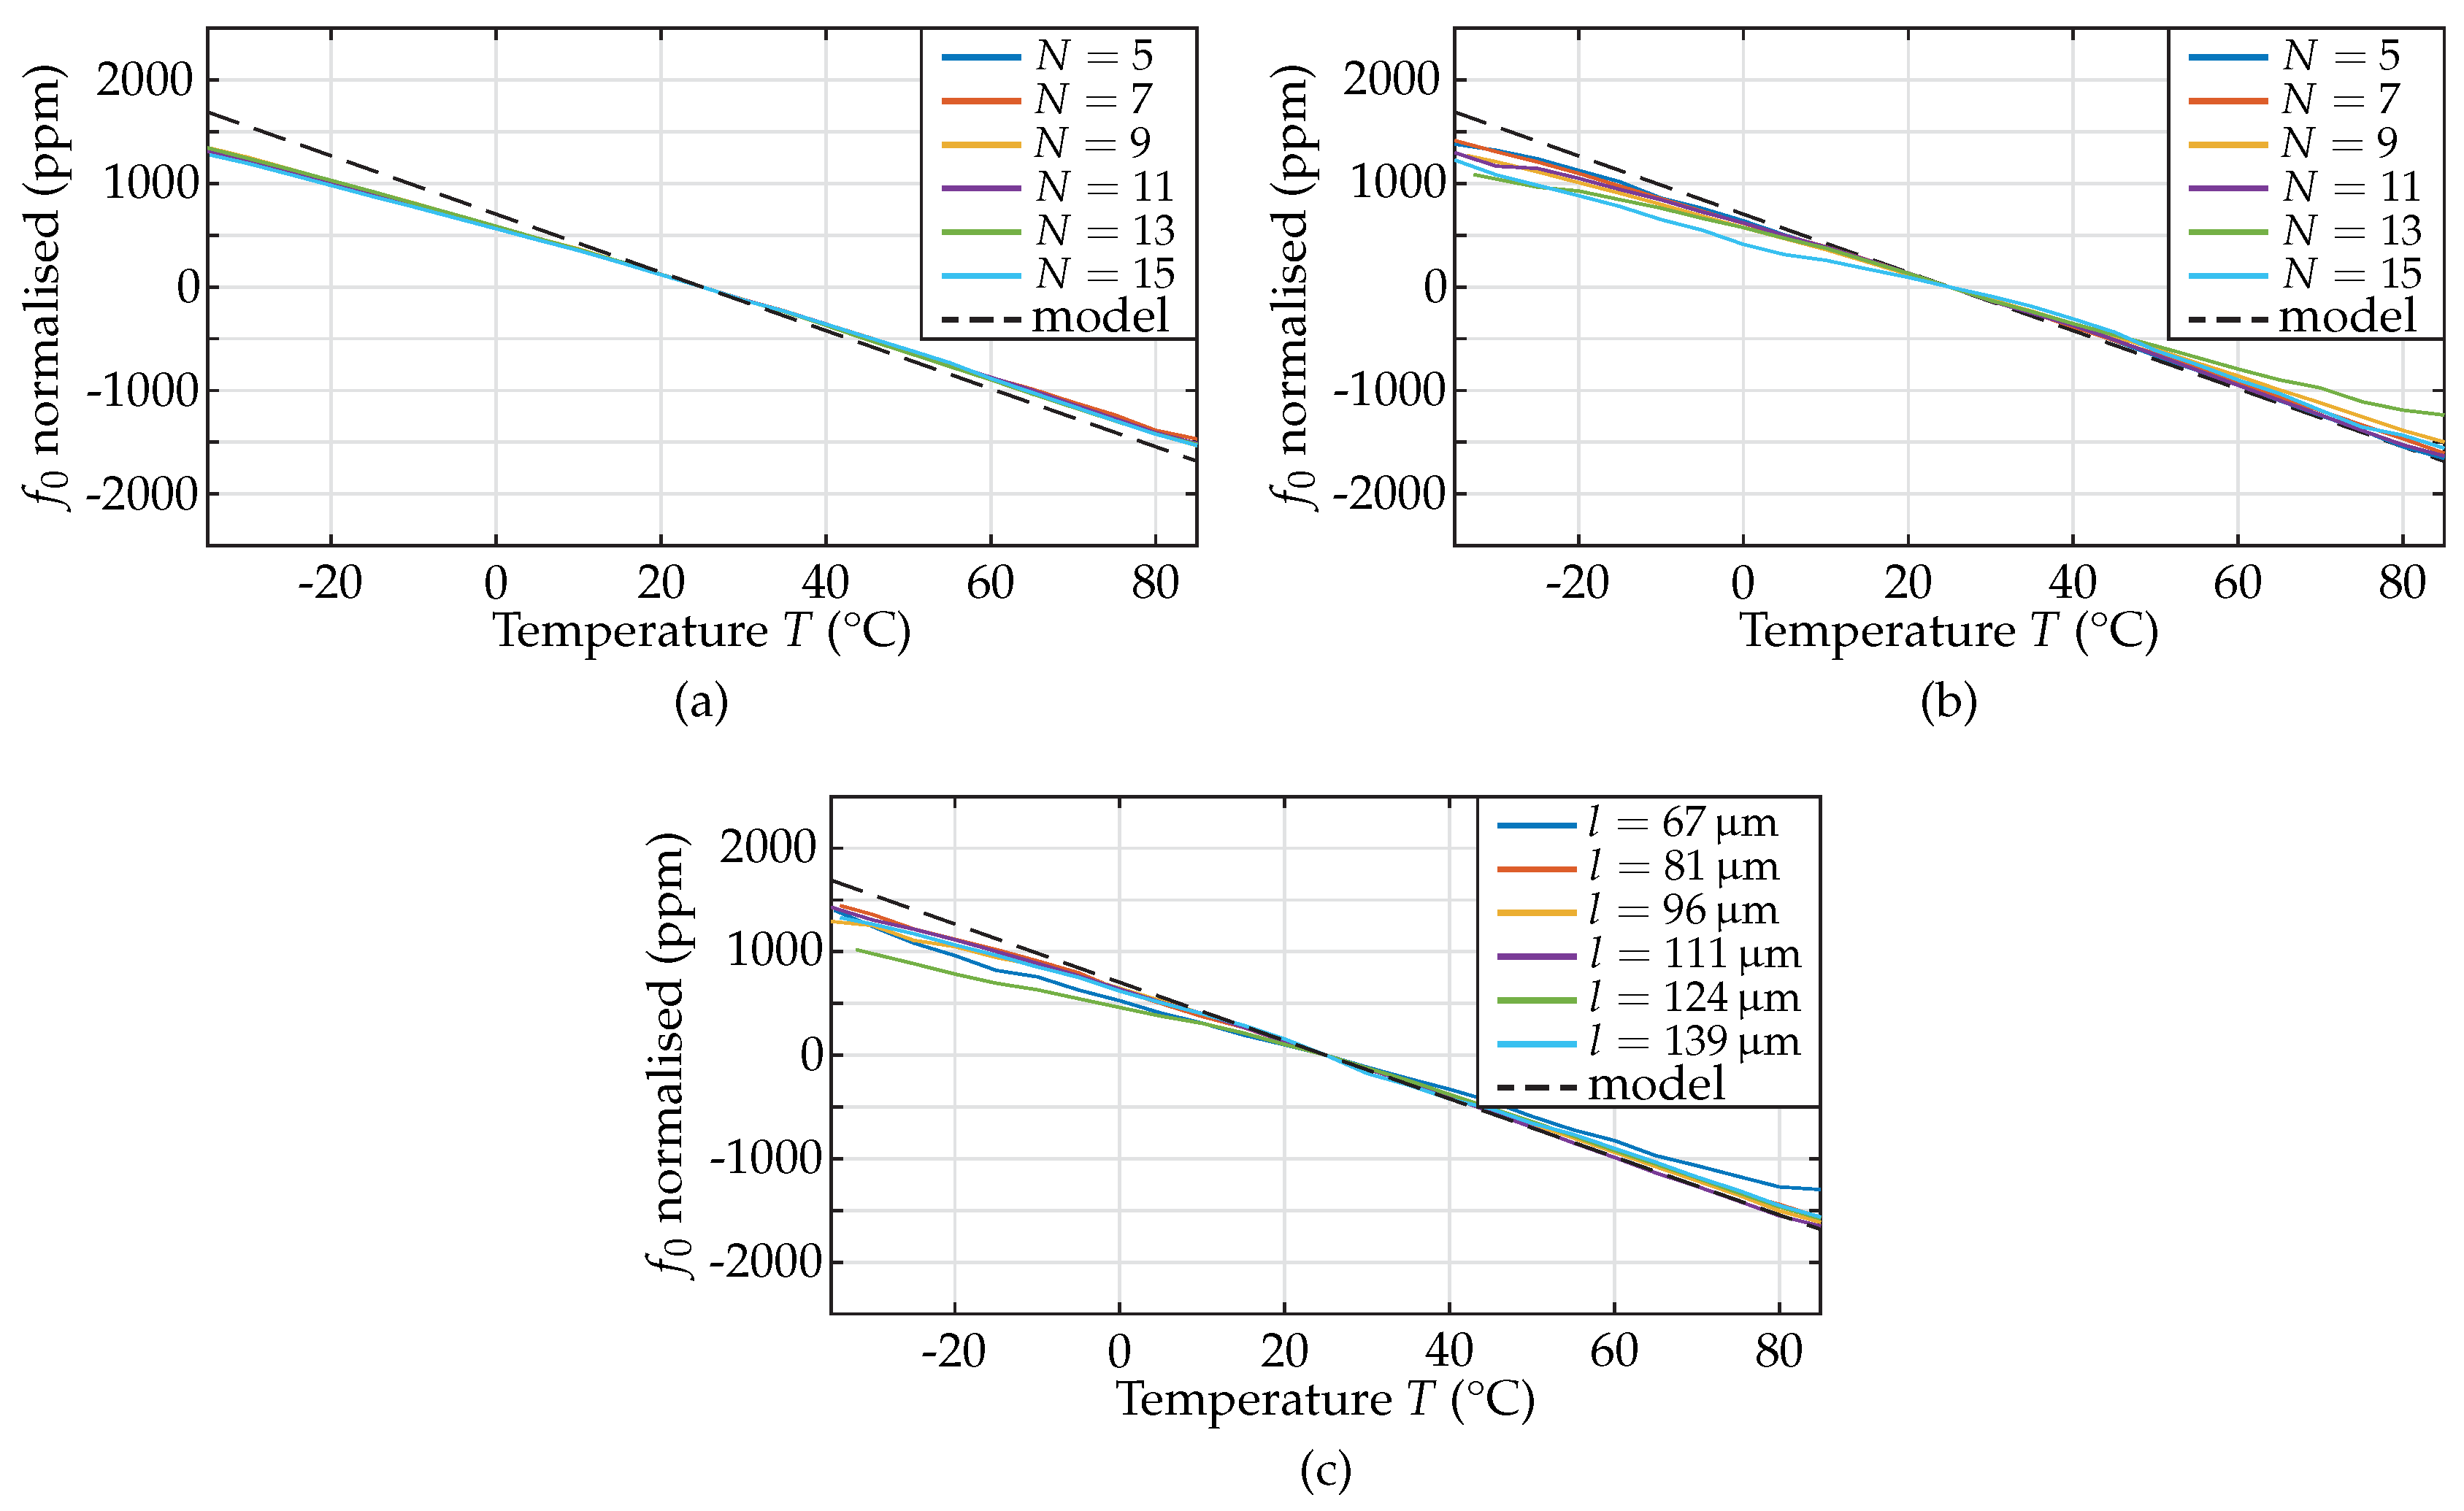
Resonant frequency normalised versus temperature for the: (a) 1000 MHz-resonators; (b) 800 MHz-resonators; and (c) 600 MHz-resonators. The absolute deviation for all geometries is less than ±2000 ppm across the temperature range studied, revealing values are varying between −26 ppm/K and −20 ppm/K. The computed was −28.1 ppm/K for all resonators.
Figure 9.
Resonant frequency normalised versus temperature for the: (a) 1000 MHz-resonators; (b) 800 MHz-resonators; and (c) 600 MHz-resonators. The absolute deviation for all geometries is less than ±2000 ppm across the temperature range studied, revealing values are varying between −26 ppm/K and −20 ppm/K. The computed was −28.1 ppm/K for all resonators.
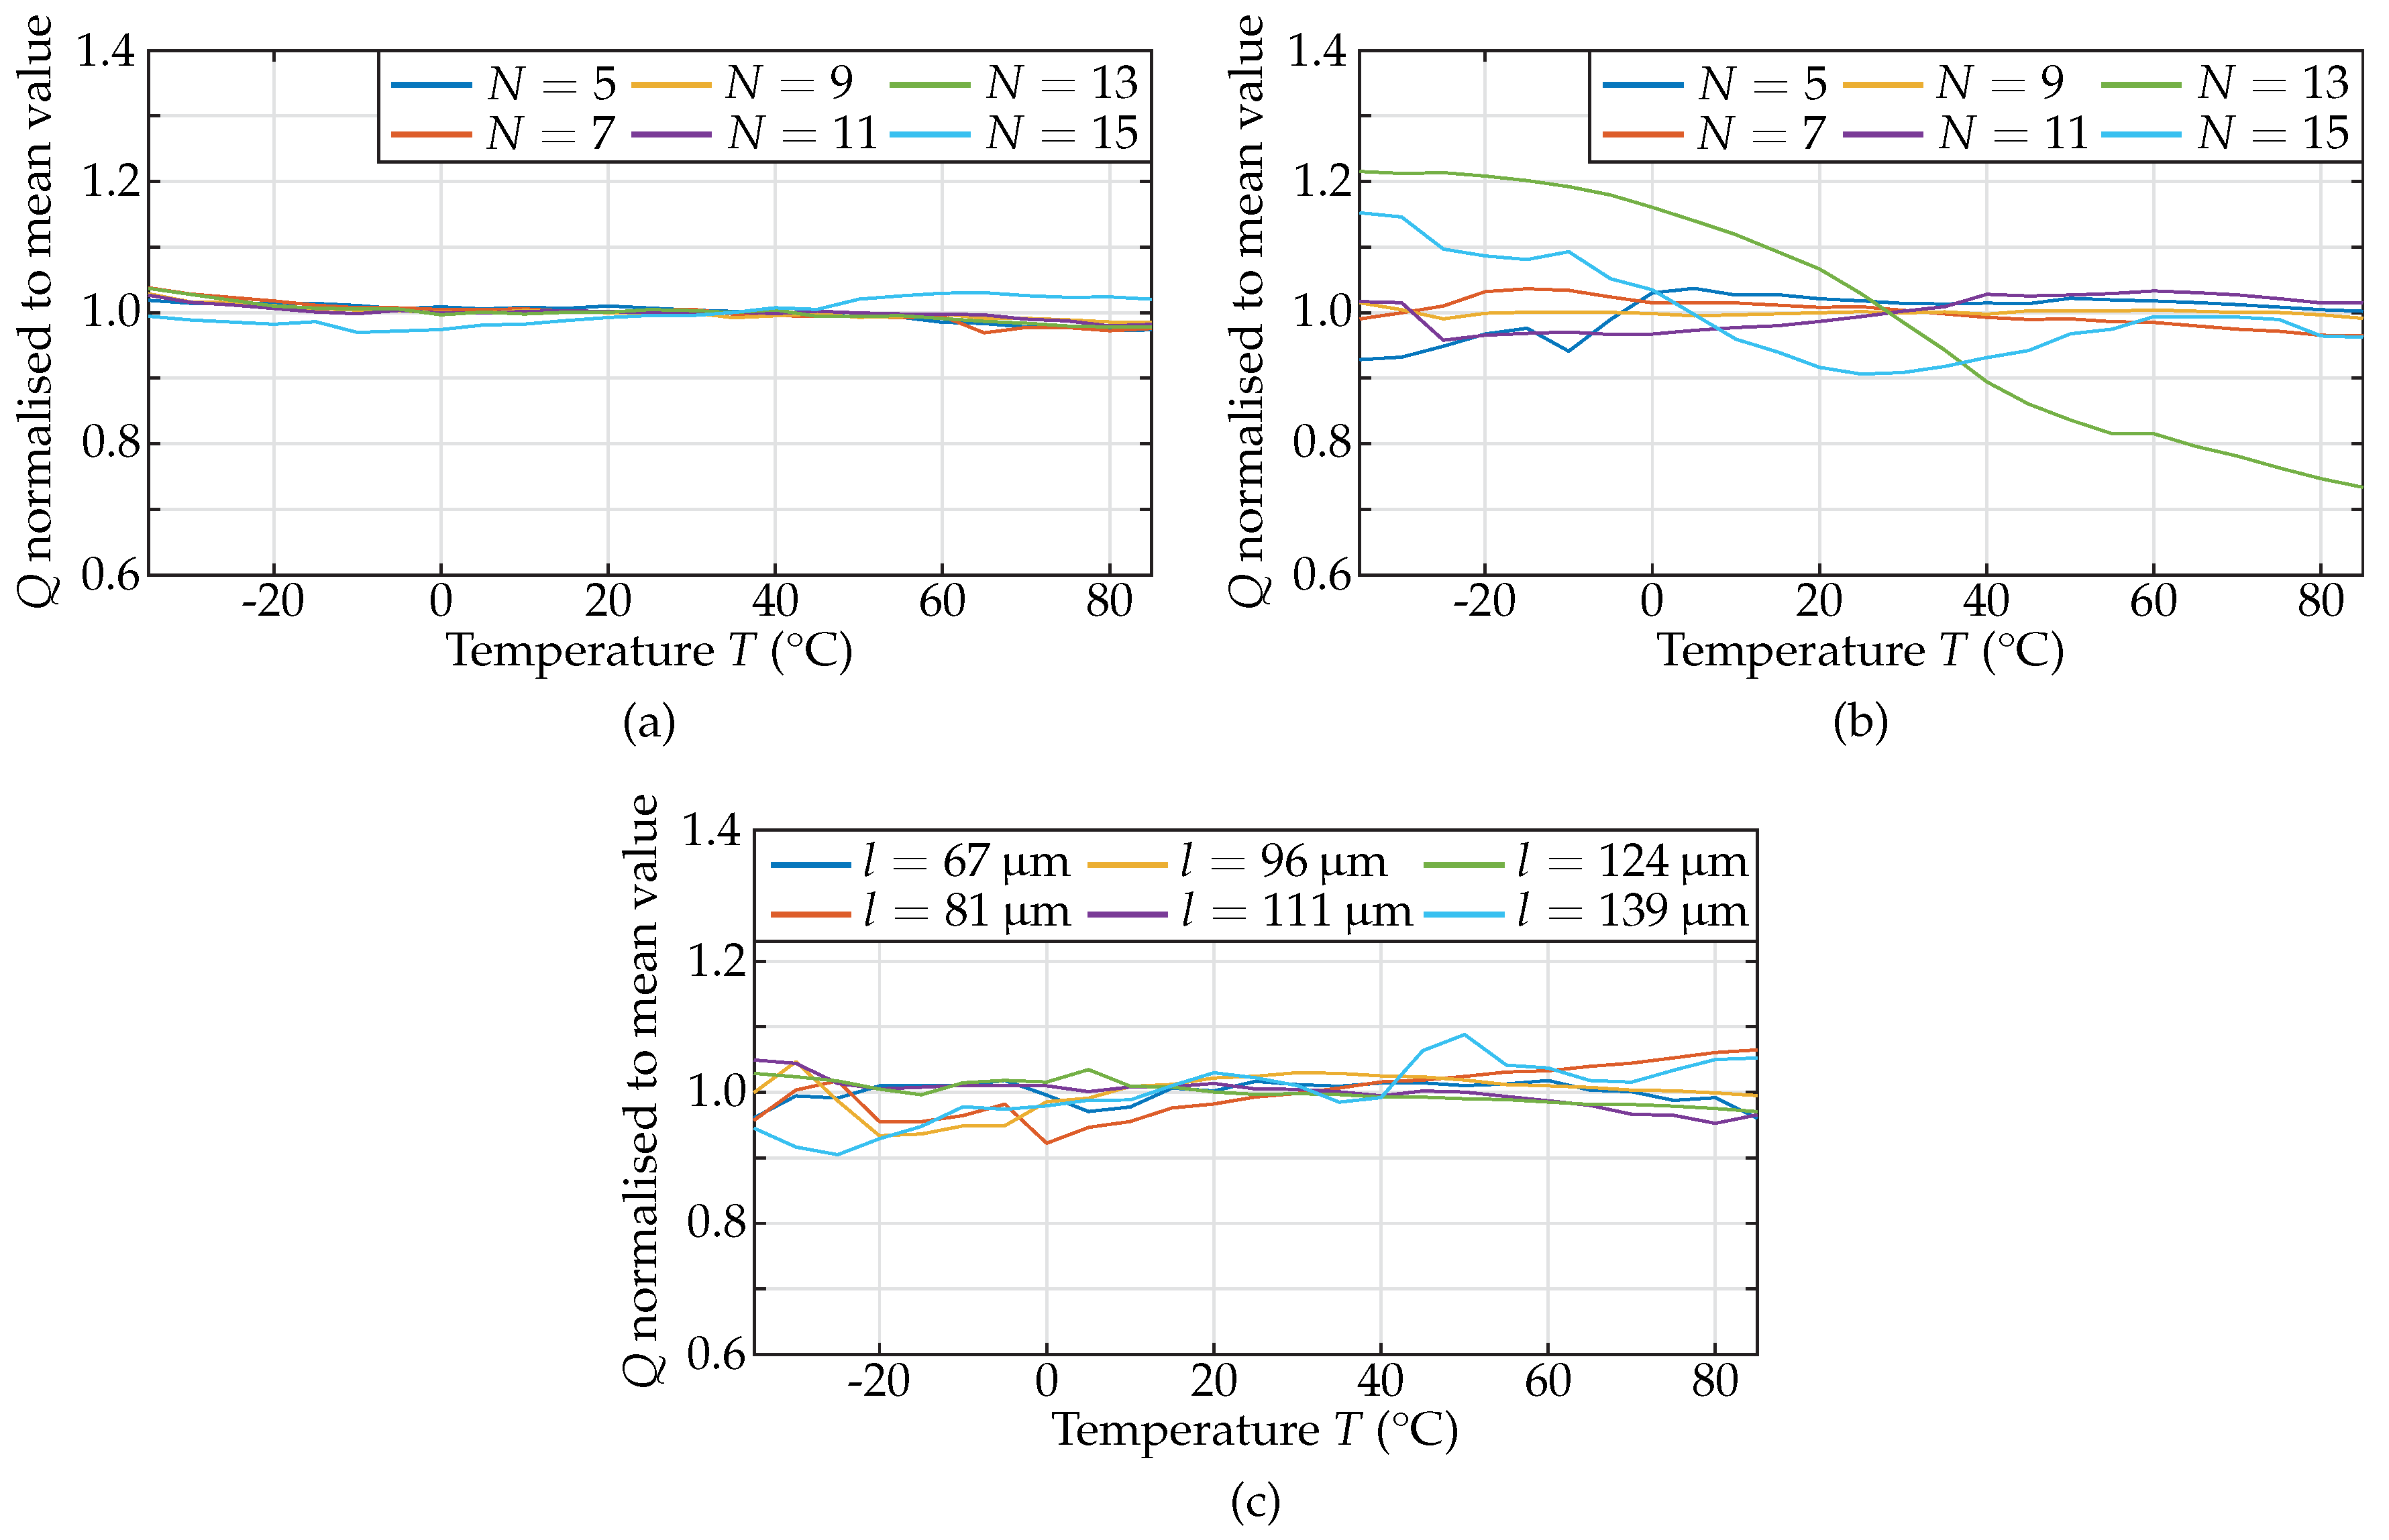
Figure 10.
Quality factor Q normalised to its mean value versus temperature for the different resonator groups: (a) 1000 MHz; (b) 800 MHz; and (c) 600 MHz. For most of the geometries, the variations with respect to temperature remain below 10%. Only two resonators with resonant frequencies designed for 800 MHz displayed deviations of up to 27% due to low quality factors at room temperature, which are more strongly affected by measurement uncertainties.
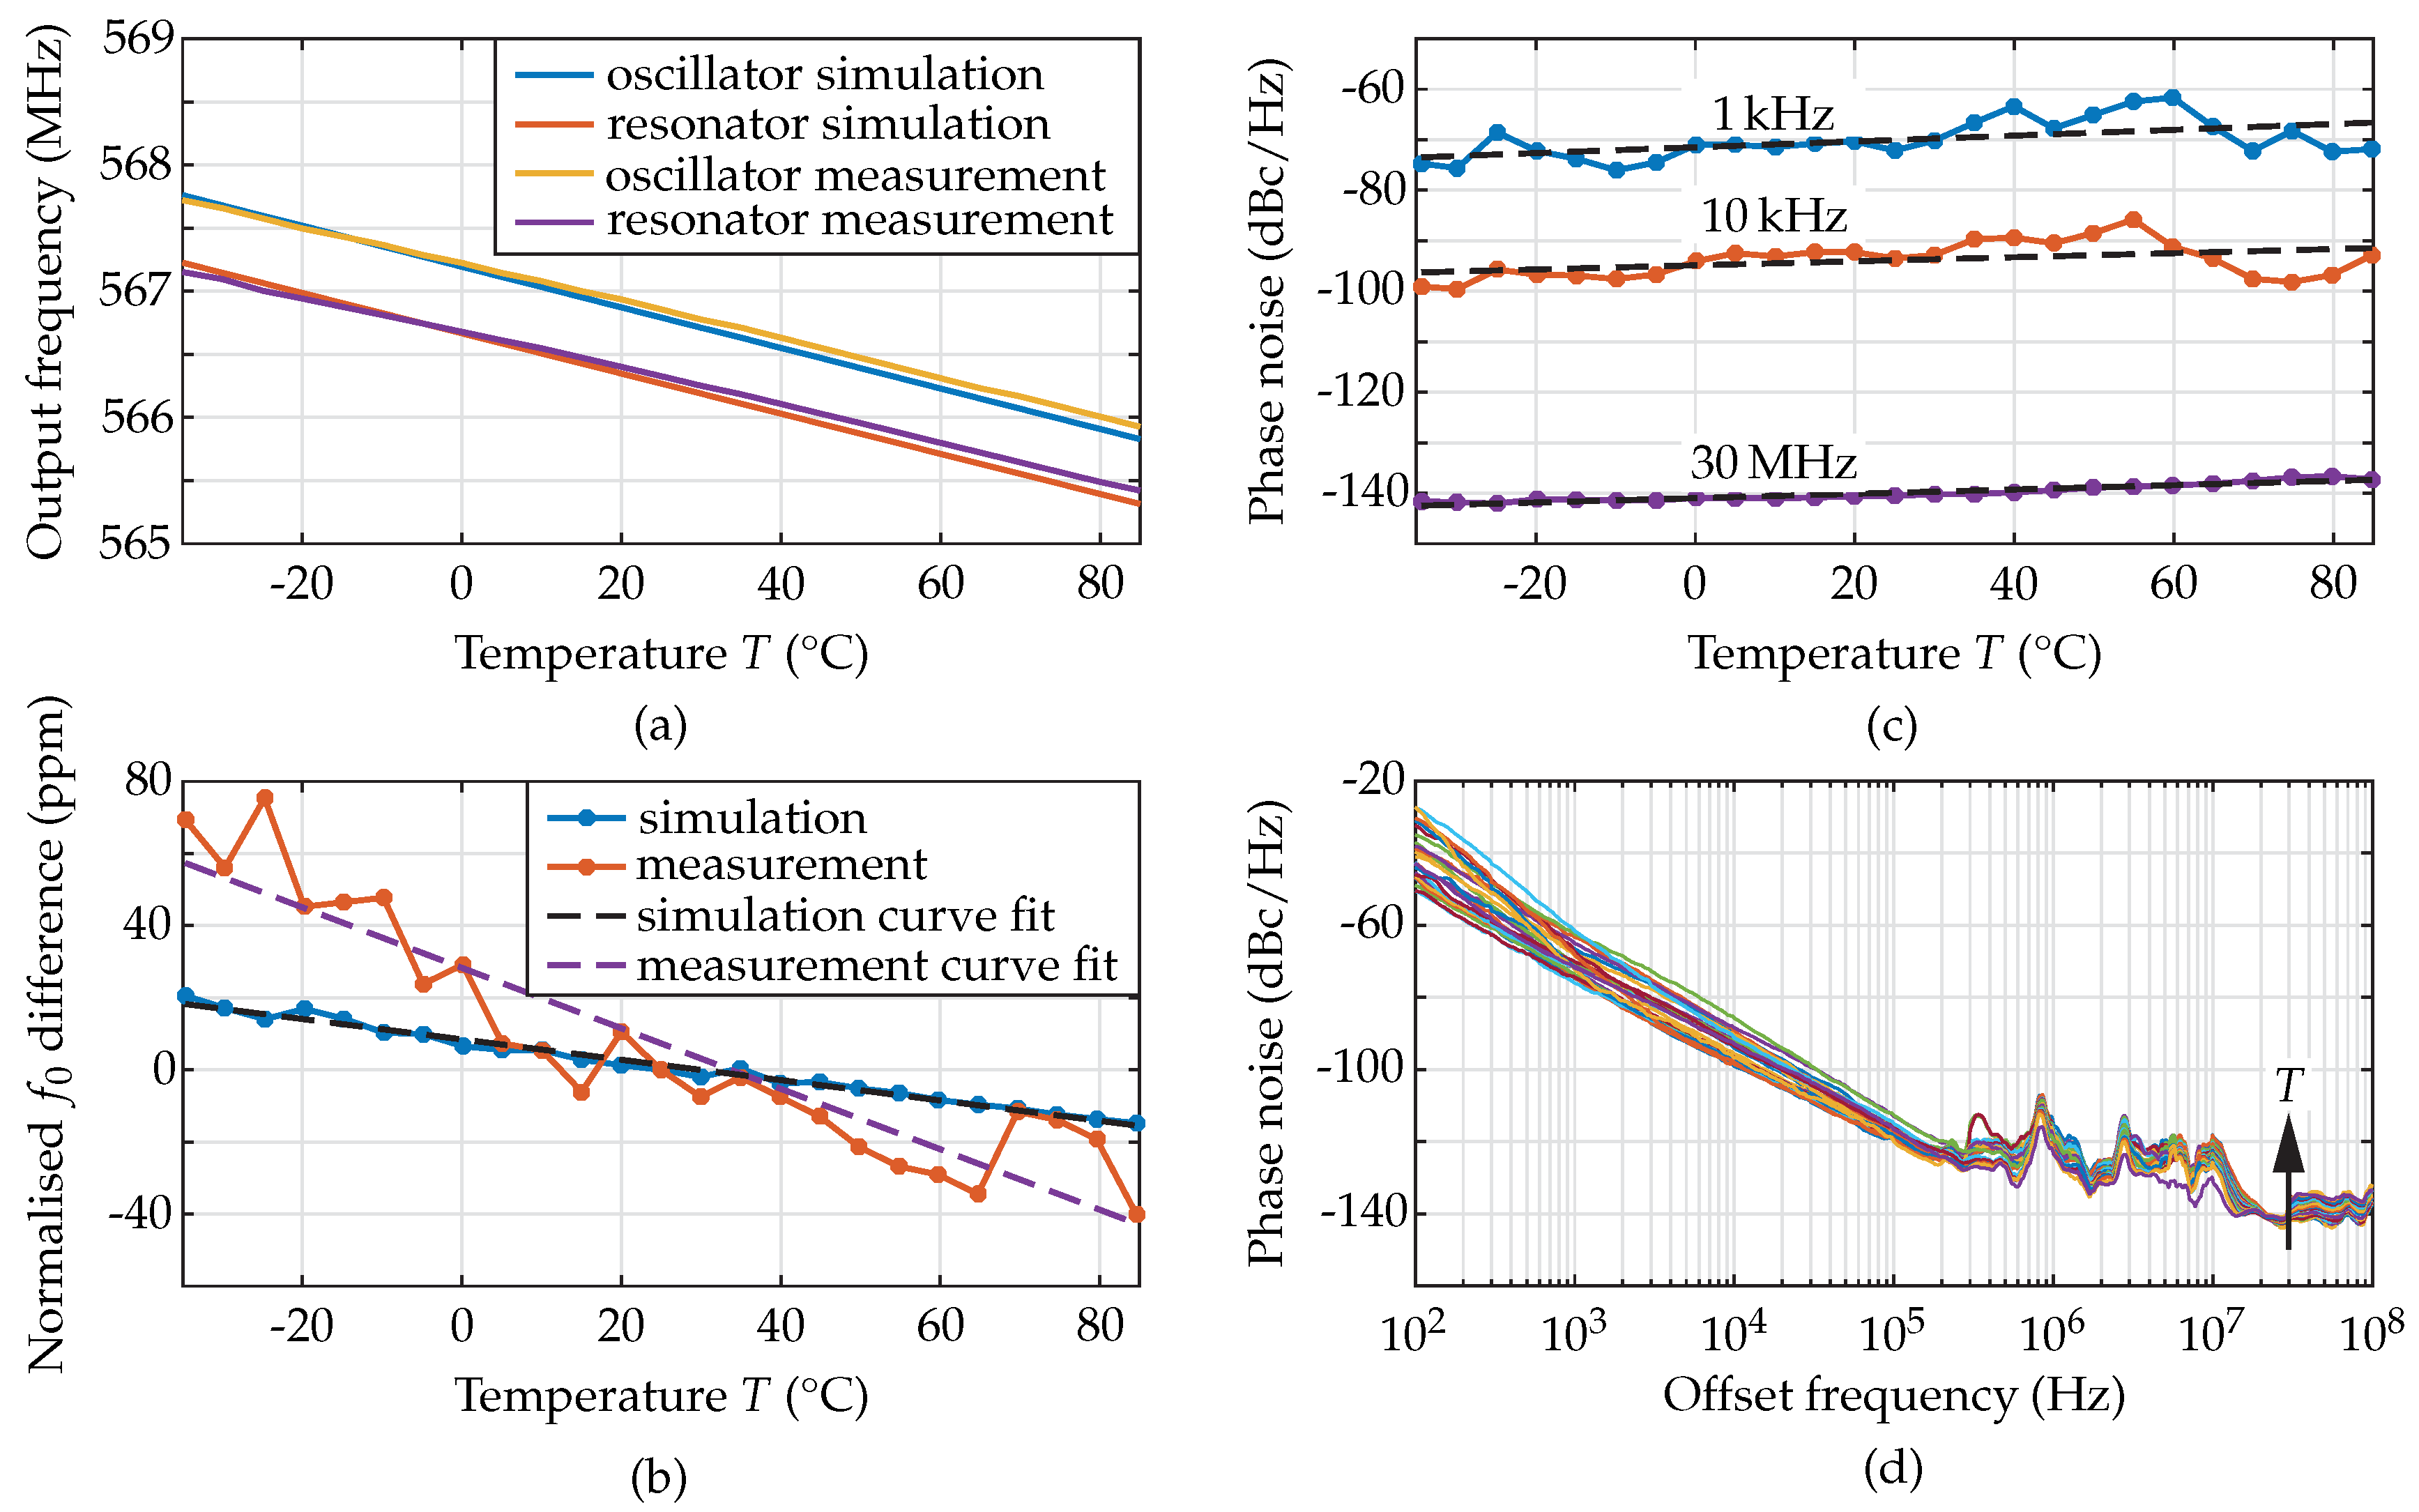
Figure 11.
(a) Measured and simulated temperature dependent output frequency of the MEMS oscillator and measured of the resonator. The measured frequency of oscillation decreases for increasing temperature from 567.7 MHz to 565.9 MHz. The resulting is −26.3 ppm/K. The resonator reveals a of −25.4 ppm/K at a variation from 567.1 MHz to 565.4 MHz over the temperature range investigated. (b) Difference of normalised to its value at 25 C for the oscillator and the resonator in simulation and measurement. The measured difference is 0.55 ppm/K lower than the simulated value, i.e., −0.83 ppm/K. (c) Phase-noise measurement of the MEMS oscillator at different offsets from the frequency of oscillation represented in different colours. The dashed curves represent curve fits. In the −30 dB/decade slope, the phase noise shows variations with no detectable influence of the temperature, resulting from a mean error of minimum 2.51 dB, i.e., higher than the variations. The noise floor, taken at an offset of 30 MHz increases linearly with temperature from −142 dBc/Hz to −137 dBc/Hz, revealing a mean error of only 0.40 dB. (d) Complete phase-noise curves with the temperature as curve parameter. For every temperature measured, one differently coloured curve is shown.
![Sensors 18 02159 g011]()
Table 1.
Elastic moduli and mass densities for AlN, Al, Mo, and the equivalent resonator.
Table 1.
Elastic moduli and mass densities for AlN, Al, Mo, and the equivalent resonator.
| Parameter | Value for AlN [2] | Value for Al [2] | Value for Mo [21] | Equivalent Value | Unit |
|---|
| 344 | 70 | 330 | 330 | GPa |
| 3260 | 2700 | 10,220 | 3533 | kg/m |
Table 2.
Coefficients of thermal expansion for AlN, Al, Mo, and the equivalent resonator.
Table 2.
Coefficients of thermal expansion for AlN, Al, Mo, and the equivalent resonator.
| Parameter | Value for AlN [21] | Value for Al [21] | Value for Mo [21] | Equivalent Value | Unit |
|---|
| 5.27 | 23.9 | 5.2 | 5.77 | ppm/K |
| 5.27 | 23.9 | 5.2 | 5.77 | ppm/K |
| 4.15 | 23.9 | 5.2 | 5.14 | ppm/K |
| 14.69 | 71.7 | 15.6 | 16.68 | ppm/K |
Table 3.
Temperature coefficients of for AlN, Al, Mo, and the equivalent resonator.
Table 3.
Temperature coefficients of for AlN, Al, Mo, and the equivalent resonator.
| Parameter | Value for AlN [2] | Value for Al [2] | Value for Mo [22] | Equivalent Value | Unit |
|---|
| −52 | −1082 | −134 | −61.4 | ppm/K |
Table 4.
Specification, geometrical, and electrical parameters of the MEMS resonator.
Table 4.
Specification, geometrical, and electrical parameters of the MEMS resonator.
| Type | Parameter | Value | Unit |
|---|
| Specified | Resonant frequency | 570 | MHz |
| electrical | Quality factor Q | 2000 | – |
| parameters | Resonant resistance | 50 | |
| Resulting | Fingerlength l | 139 | m |
| geometrical | Element width w | 8.53 | m |
| parameters | Number of fingers N | 9 | – |
| Resonant frequency | 567 | MHz |
| Measured | Quality factor Q | 1400 | – |
| electrical | Resonant resistance | 68.9 | |
| parameters | Resonant inductance | 27.4 | H |
| Resonant capacitance | 2.88 | fF |
Table 5.
Evaluation of the phase-noise simulation at different offsets from the frequency of oscillation.
Table 5.
Evaluation of the phase-noise simulation at different offsets from the frequency of oscillation.
| Parameter | 1 kHz | 10 kHz | 30 MHz | Unit |
|---|
| Lowest phase noise | −82 | −112 | −140 | dBc/Hz |
| Highest phase noise | −80 | −111 | −131 | dBc/Hz |
| Curve fit absolute value at 25 C | −81.4 | −111.5 | −136.0 | dBc/Hz |
| Curve fit gradient | −0.007 | −0.008 | 0.076 | dB/K |
| Curve fit mean error | 0.434 | 0.415 | 0.191 | dB |
Table 6.
Geometry definitions of MEMS resonators investigated in this study.
Table 6.
Geometry definitions of MEMS resonators investigated in this study.
| Resonator Group | Resonant Frequency | Length | Number of Fingers | Total Width |
|---|
| (MHz) | l (m) | N | (m) |
|---|
| 1 | 1000 | 73 | 5 | 25.6 |
| 1000 | 73 | 7 | 35.9 |
| 1000 | 73 | 9 | 46.1 |
| 1000 | 73 | 11 | 56.3 |
| 1000 | 73 | 13 | 66.6 |
| 1000 | 73 | 15 | 76.8 |
| 2 | 800 | 92 | 5 | 32.0 |
| 800 | 92 | 7 | 44.8 |
| 800 | 92 | 9 | 57.6 |
| 800 | 92 | 11 | 70.4 |
| 800 | 92 | 13 | 83.2 |
| 800 | 92 | 15 | 96.0 |
| 3 | 600 | 67 | 5 | 42.7 |
| 600 | 81 | 5 | 42.7 |
| 600 | 96 | 5 | 42.7 |
| 600 | 111 | 5 | 42.7 |
| 600 | 124 | 5 | 42.7 |
| 600 | 139 | 5 | 42.7 |
Table 7.
Evaluation of the phase-noise measurement at different offsets from the frequency of oscillation, .
Table 7.
Evaluation of the phase-noise measurement at different offsets from the frequency of oscillation, .
| Parameter | 1 kHz | 10 kHz | 30 MHz | Unit |
|---|
| Lowest phase noise | −76 | −100 | −142 | dBc/Hz |
| Highest phase noise | −62 | −86 | −137 | dBc/Hz |
| Curve fit absolute value at 25 C | −70.1 | −93.9 | −139.9 | dBc/Hz |
| Curve fit gradient | 0.057 | 0.040 | 0.043 | dB/K |
| Curve fit mean error | 2.51 | 2.58 | 0.39 | dB |
Table 8.
values for contour-mode resonators and other MEMS resonator topologies from literature.
Table 8.
values for contour-mode resonators and other MEMS resonator topologies from literature.
| Reference | Resonator Topology | | Unit |
|---|
| [2] | AlN thin-film bulk acoustic resonator | −25 | ppm/K |
| [3] | AlN contour-mode resonator | −30 | ppm/K |
| [4] | AlN contour-mode resonator | −32.5 | ppm/K |
| [5] | AlN contour-mode resonator | −28 | ppm/K |
| [6] | AlN-on-Si contour-mode resonator | −31.1 | ppm/K |
| [7] | AlN surface-acoustic wave resonator | −26.7 | ppm/K |
| [8] | Plate-shaped AlN dual mode resonator | −30 … −23 | ppm/K |
| This work (modelled) | AlN contour-mode resonator | −28.1 | ppm/K |
| This work (measured) | AlN contour-mode resonator | −26 … −20 | ppm/K |


