Quantitative Comparison of Protein Adsorption and Conformational Changes on Dielectric-Coated Nanoplasmonic Sensing Arrays


Abstract
1. Introduction
2. Materials and Methods
2.1. HSA Preparation
2.2. LSPR Measurements
2.3. QCM-D Measurements
3. Results and Discussion
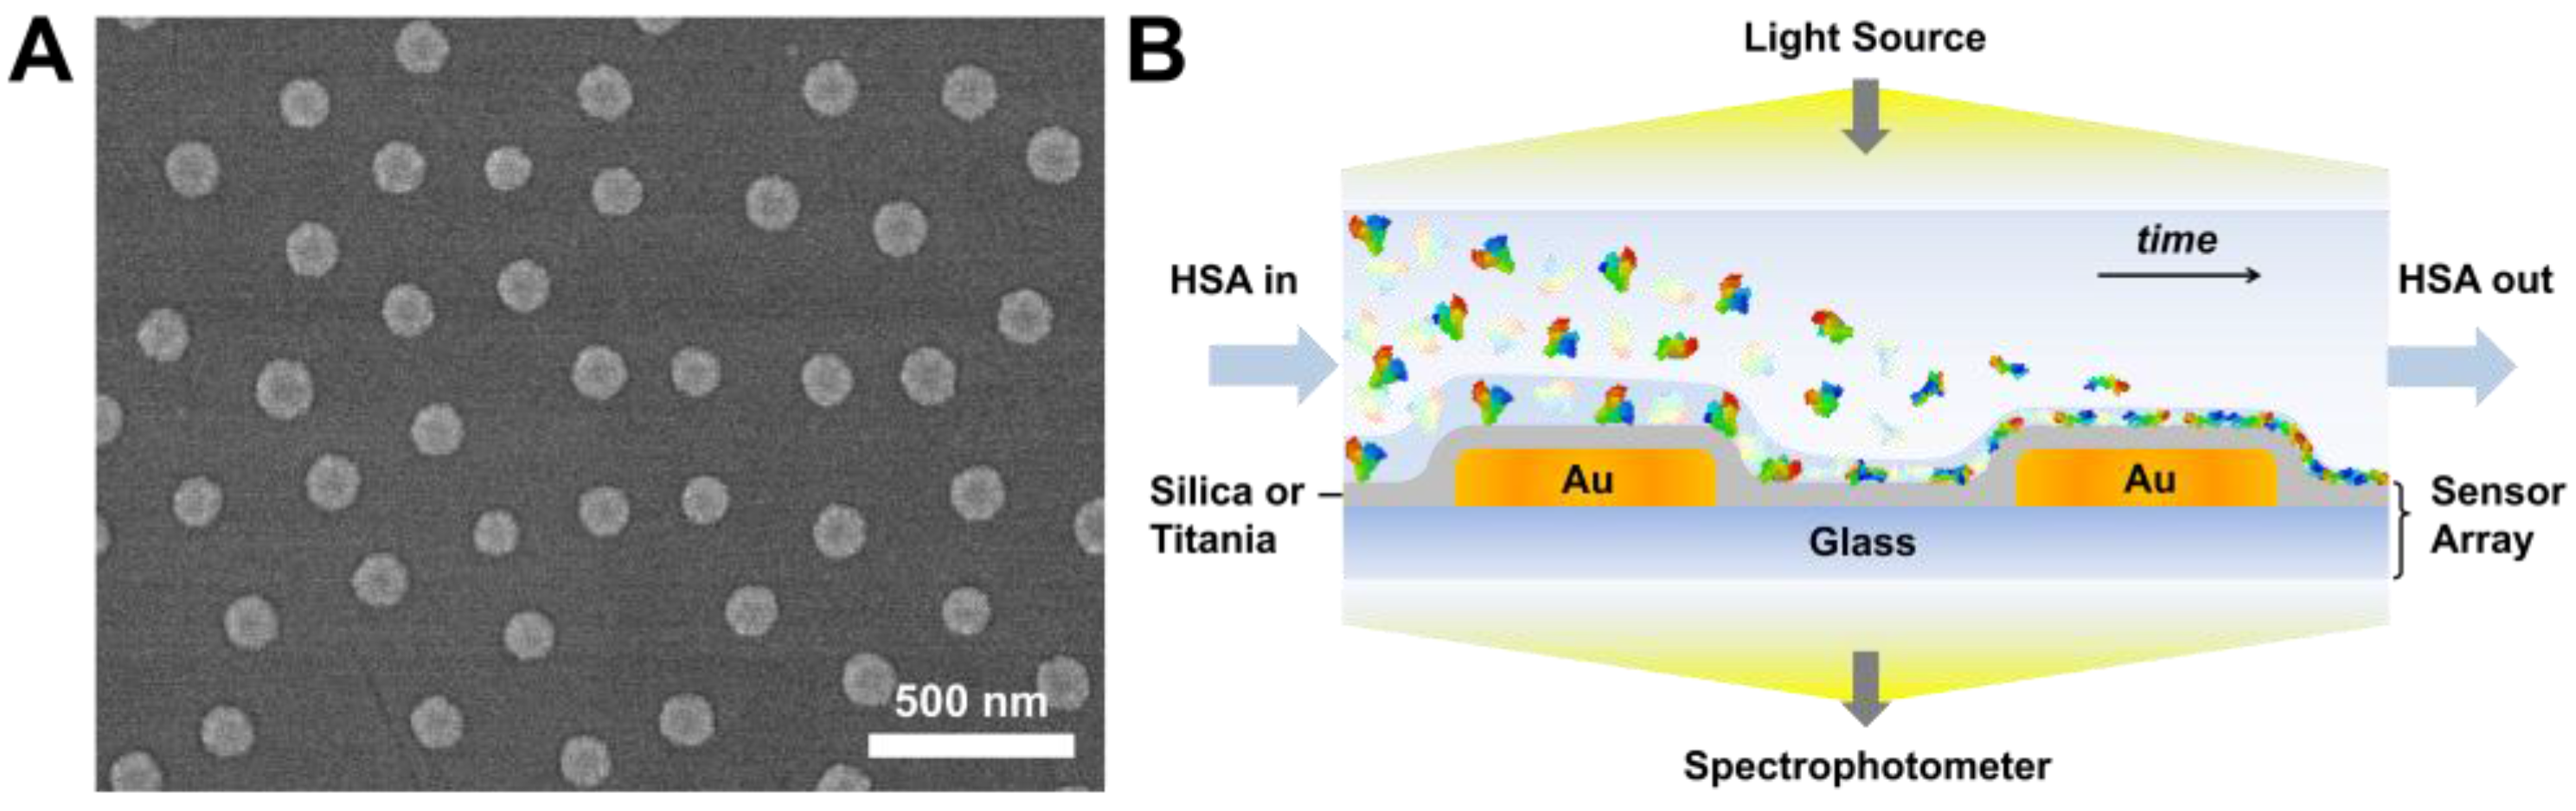
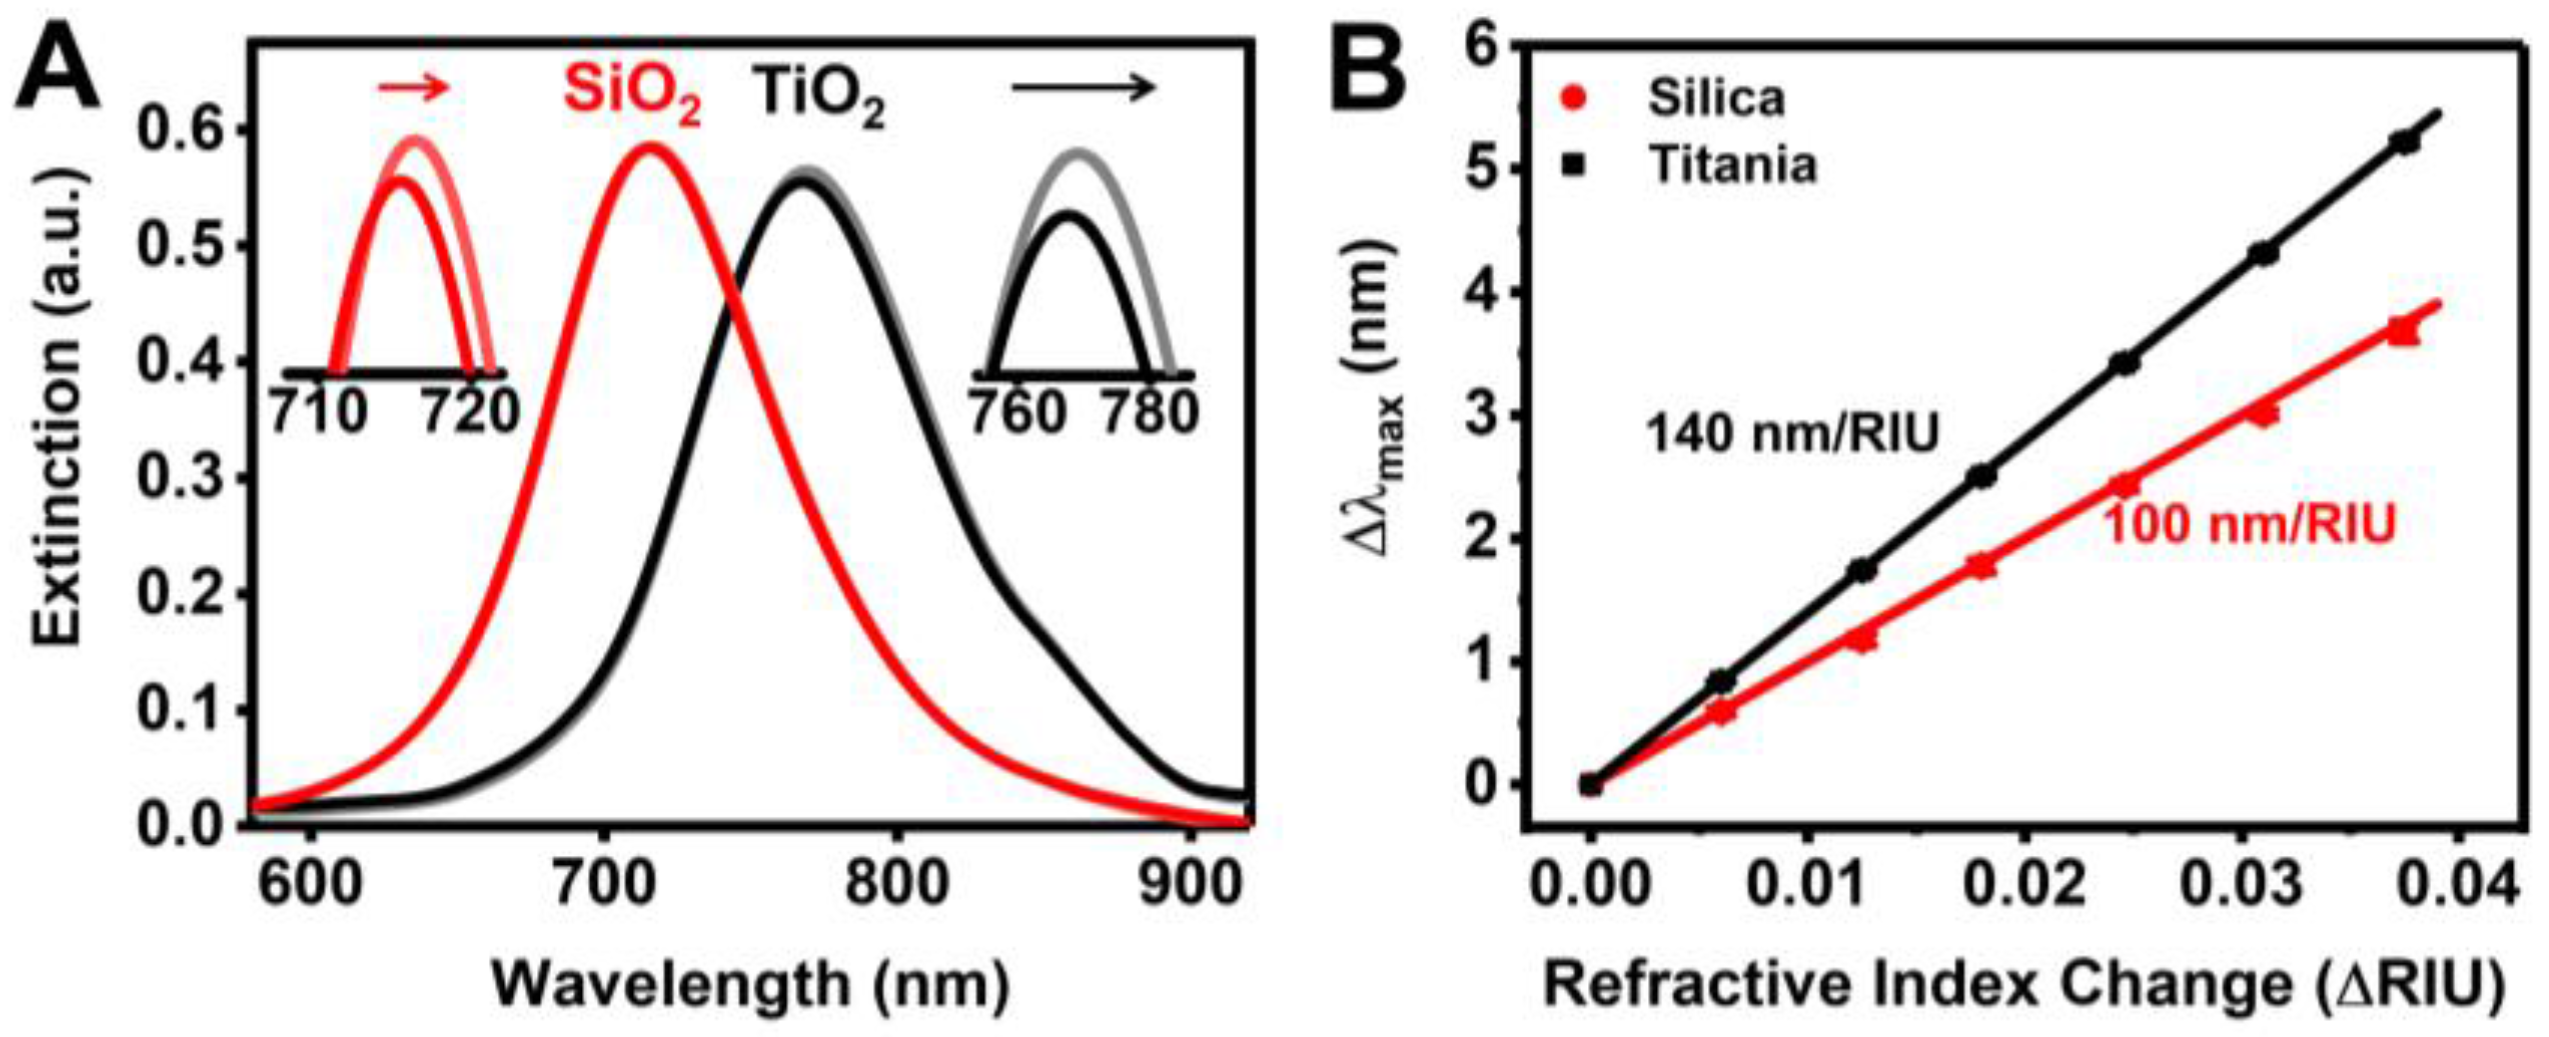
3.1. Sensor Characterization
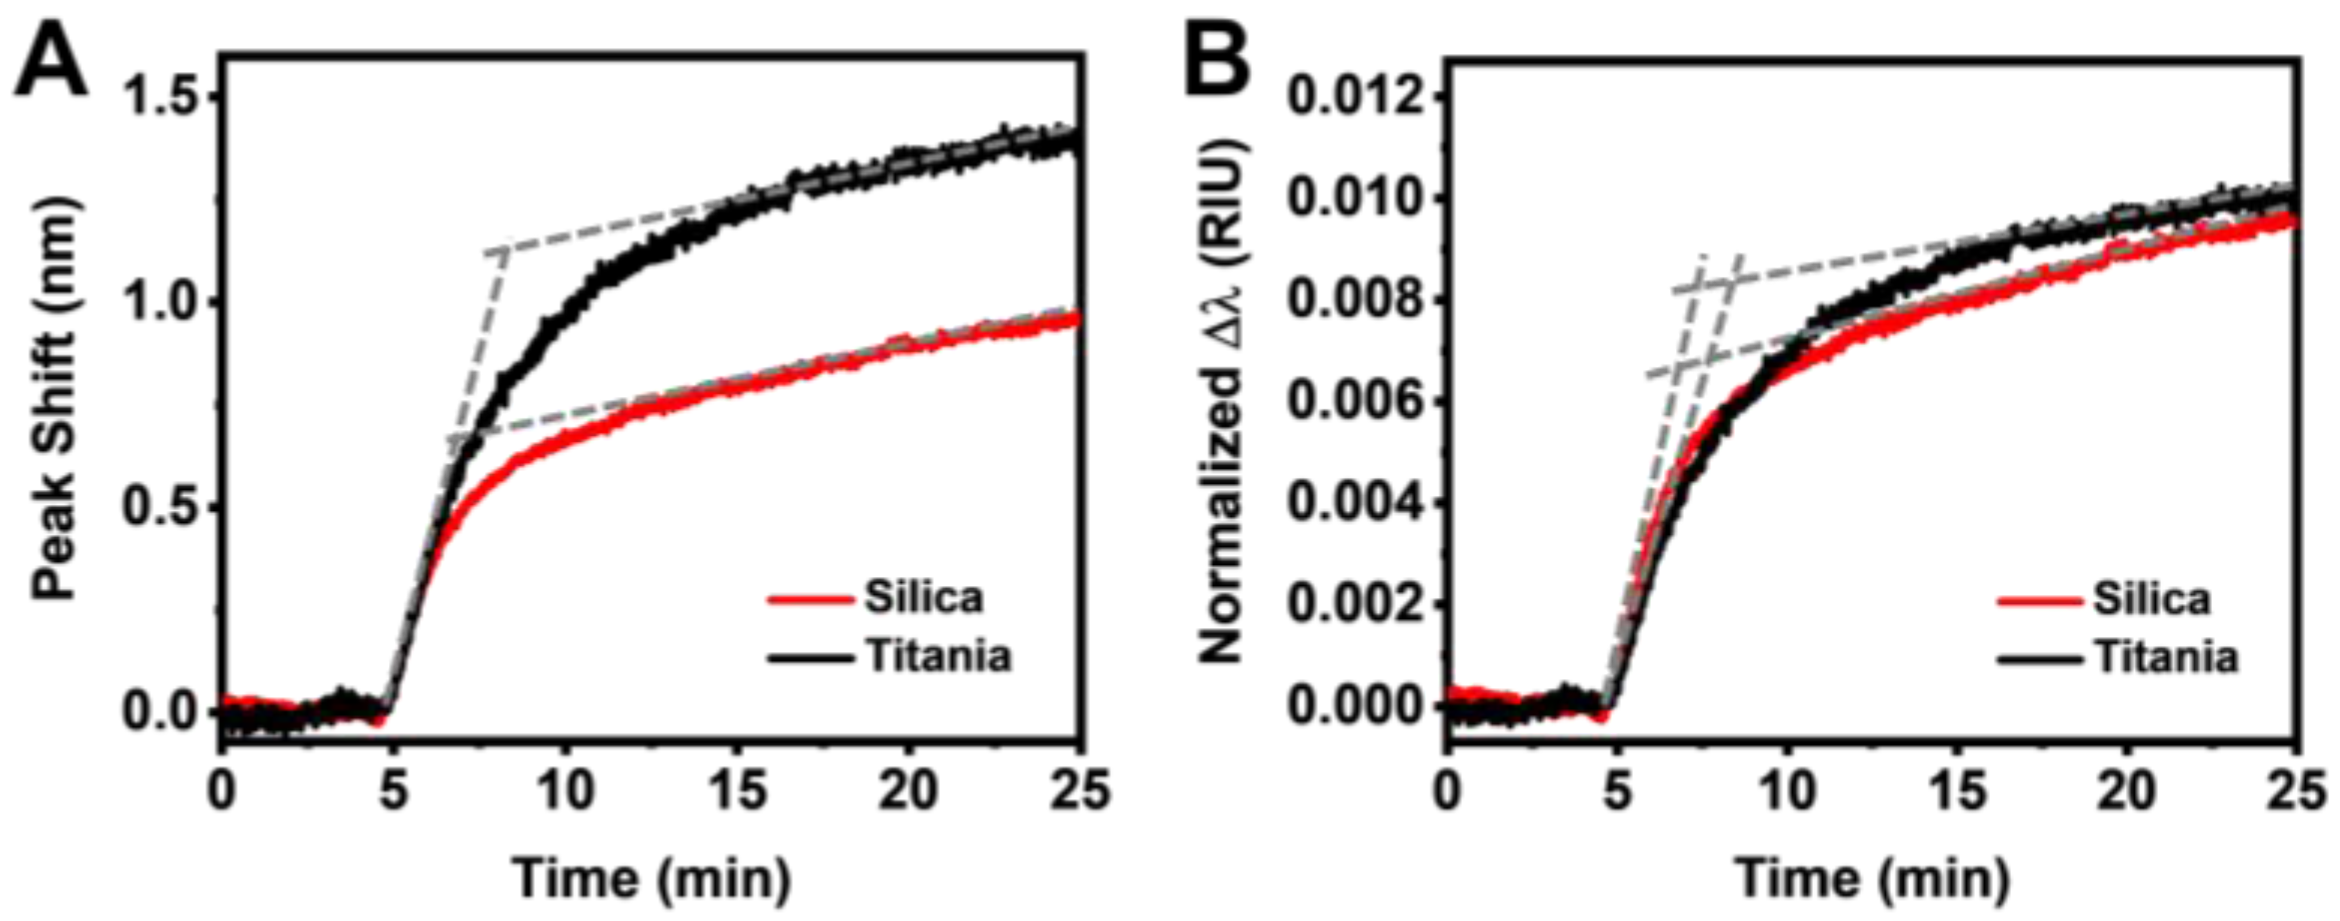
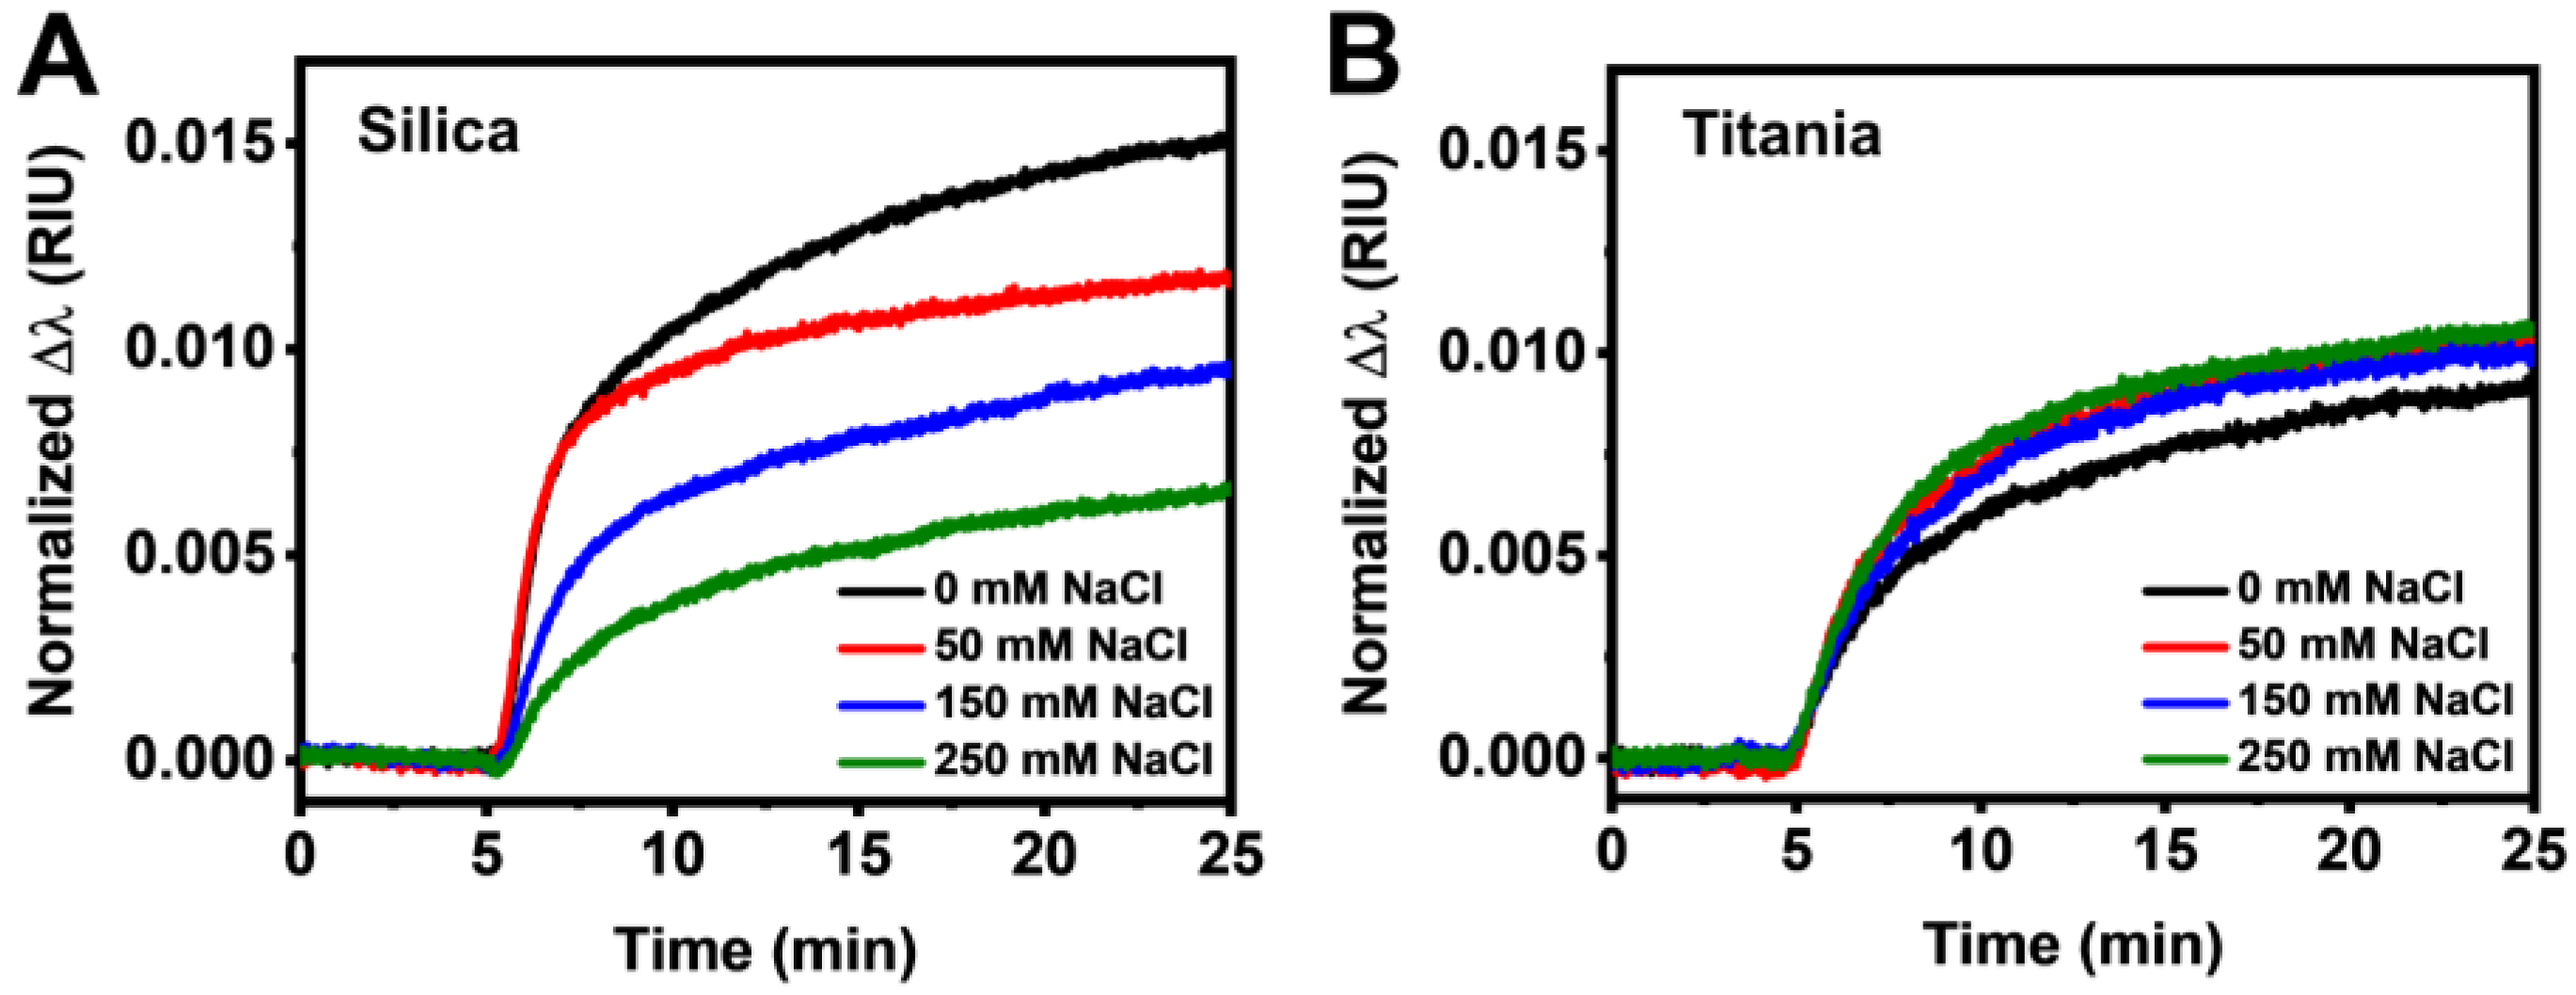
3.2. Real-Time Monitoring of HSA Adsorption Kinetics
3.3. Data Analysis
4. Conclusions
Supplementary Materials
Acknowledgments
Author Contributions
Conflicts of Interest
References
- Anker, J.N.; Hall, W.P.; Lyandres, O.; Shah, N.C.; Zhao, J.; Van Duyne, R.P. Biosensing with plasmonic nanosensors. Nat. Mater. 2008, 7, 442–453. [Google Scholar] [CrossRef] [PubMed]
- Jackman, J.A.; Rahim Ferhan, A.; Cho, N.-J. Nanoplasmonic sensors for biointerfacial science. Chem. Soc. Rev. 2017, 46, 3615–3660. [Google Scholar] [CrossRef] [PubMed]
- Spackova, B.; Wrobel, P.; Bockova, M.; Homola, J. Optical biosensors based on plasmonic nanostructures: A review. Proc. IEEE 2016, 104, 2380–2408. [Google Scholar] [CrossRef]
- Willets, K.A.; Duyne, R.P.V. Localized surface plasmon resonance spectroscopy and sensing. Annu. Rev. Phys. Chem. 2007, 58, 267–297. [Google Scholar] [CrossRef] [PubMed]
- Haes, A.J.; Zou, S.; Schatz, G.C.; Van Duyne, R.P. A nanoscale optical biosensor: The long range distance dependence of the localized surface plasmon resonance of noble metal nanoparticles. J. Phys. Chem. B 2004, 108, 109–116. [Google Scholar] [CrossRef]
- Whitney, A.V.; Elam, J.W.; Zou, S.; Zinovev, A.V.; Stair, P.C.; Schatz, G.C.; Van Duyne, R.P. Localized surface plasmon resonance nanosensor: A high-resolution distance-dependence study using atomic layer deposition. J. Phys. Chem. B 2005, 109, 20522–20528. [Google Scholar] [CrossRef] [PubMed]
- Chah, S.; Hammond, M.R.; Zare, R.N. Gold nanoparticles as a colorimetric sensor for protein conformational changes. Chem. Biol. 2005, 12, 323–328. [Google Scholar] [CrossRef] [PubMed]
- Ferhan, A.R.; Jackman, J.A.; Cho, N.-J. Integration of quartz crystal microbalance-dissipation and reflection-mode localized surface plasmon resonance sensors for biomacromolecular interaction analysis. Anal. Chem. 2016, 88, 12524–12531. [Google Scholar] [CrossRef] [PubMed]
- Hall, W.P.; Modica, J.; Anker, J.; Lin, Y.; Mrksich, M.; Van Duyne, R.P. A conformation- and ion-sensitive plasmonic biosensor. Nano Lett. 2011, 11, 1098–1105. [Google Scholar] [CrossRef] [PubMed]
- Ferhan, A.R.; Jackman, J.A.; Cho, N.-J. Investigating how vesicle size influences vesicle adsorption on titanium oxide: A competition between steric packing and shape deformation. Phys. Chem. Chem. Phys. 2017, 19, 2131–2139. [Google Scholar] [CrossRef] [PubMed]
- Jackman, J.A.; Spackova, B.; Linardy, E.; Kim, M.C.; Yoon, B.K.; Homola, J.; Cho, N.-J. Nanoplasmonic ruler to measure lipid vesicle deformation. Chem. Commun. 2016, 52, 76–79. [Google Scholar] [CrossRef] [PubMed]
- Jackman, J.A.; Yorulmaz Avsar, S.; Ferhan, A.R.; Li, D.; Park, J.H.; Zhdanov, V.P.; Cho, N.-J. Quantitative profiling of nanoscale liposome deformation by a localized surface plasmon resonance sensor. Anal. Chem. 2017, 89, 1102–1109. [Google Scholar] [CrossRef] [PubMed]
- Jackman, J.A.; Zhdanov, V.P.; Cho, N.-J. Nanoplasmonic biosensing for soft matter adsorption: Kinetics of lipid vesicle attachment and shape deformation. Langmuir 2014, 30, 9494–9503. [Google Scholar] [CrossRef] [PubMed]
- Oh, E.; Jackman, J.A.; Yorulmaz, S.; Zhdanov, V.P.; Lee, H.; Cho, N.-J. Contribution of temperature to deformation of adsorbed vesicles studied by nanoplasmonic biosensing. Langmuir 2015, 31, 771–781. [Google Scholar] [CrossRef] [PubMed]
- Ferhan, A.R.; Jackman, J.A.; Cho, N.-J. Probing spatial proximity of supported lipid bilayers to silica surfaces by localized surface plasmon resonance sensing. Anal. Chem. 2017, 89, 4301–4308. [Google Scholar] [CrossRef] [PubMed]
- Ferhan, A.; Ma, G.; Jackman, J.; Sut, T.; Park, J.; Cho, N.-J. Probing the interaction of dielectric nanoparticles with supported lipid membrane coatings on nanoplasmonic arrays. Sensors 2017, 17, 1484. [Google Scholar] [CrossRef] [PubMed]
- Larsson, E.M.; Edvardsson, M.E.M.; Langhammer, C.; Zorić, I.; Kasemo, B. A combined nanoplasmonic and electrodeless quartz crystal microbalance setup. Rev. Sci. Instrum. 2009, 80, 125105. [Google Scholar] [CrossRef] [PubMed]
- Zan, G.H.; Jackman, J.A.; Kim, S.-O.; Cho, N.-J. Controlling lipid membrane architecture for tunable nanoplasmonic biosensing. Small 2014, 10, 4828–4832. [Google Scholar] [CrossRef] [PubMed]
- Guo, L.; Jackman, J.A.; Yang, H.-H.; Chen, P.; Cho, N.-J.; Kim, D.-H. Strategies for enhancing the sensitivity of plasmonic nanosensors. Nano Today 2015, 10, 213–239. [Google Scholar] [CrossRef]
- Unser, S.; Bruzas, I.; He, J.; Sagle, L. Localized surface plasmon resonance biosensing: Current challenges and approaches. Sensors 2015, 15, 15684–15716. [Google Scholar] [CrossRef] [PubMed]
- Bhagawati, M.; You, C.; Piehler, J. Quantitative real-time imaging of protein-protein interactions by LSPR detection with micropatterned gold nanoparticles. Anal. Chem. 2013, 85, 9564–9571. [Google Scholar] [CrossRef] [PubMed]
- Ferreira, J.; Santos, M.J.L.; Rahman, M.M.; Brolo, A.G.; Gordon, R.; Sinton, D.; Girotto, E.M. Attomolar protein detection using in-hole surface plasmon resonance. J. Am. Chem. Soc. 2009, 131, 436–437. [Google Scholar] [CrossRef] [PubMed]
- Haes, A.J.; Van Duyne, R.P. A nanoscale optical biosensor: Sensitivity and selectivity of an approach based on the localized surface plasmon resonance spectroscopy of triangular silver nanoparticles. J. Am. Chem. Soc. 2002, 124, 10596–10604. [Google Scholar] [CrossRef] [PubMed]
- Hall, W.P.; Ngatia, S.N.; Van Duyne, R.P. LSPR biosensor signal enhancement using nanoparticle-antibody conjugates. J. Phys. Chem. C 2011, 115, 1410–1414. [Google Scholar] [CrossRef] [PubMed]
- Ruemmele, J.A.; Hall, W.P.; Ruvuna, L.K.; Van Duyne, R.P. A localized surface plasmon resonance imaging instrument for multiplexed biosensing. Anal. Chem. 2013, 85, 4560–4566. [Google Scholar] [CrossRef] [PubMed]
- Cheng, X.R.; Wallace, G.Q.; Lagugné-Labarthet, F.; Kerman, K. Au nanostructured surfaces for electrochemical and localized surface plasmon resonance-based monitoring of α-synuclein-small molecule interactions. ACS Appl. Mater. Interfaces 2015, 7, 4081–4088. [Google Scholar] [CrossRef] [PubMed]
- Guerreiro, J.R.L.; Bochenkov, V.E.; Runager, K.; Aslan, H.; Dong, M.; Enghild, J.J.; De Freitas, V.; Ferreira Sales, M.G.; Sutherland, D.S. Molecular imprinting of complex matrices at localized surface plasmon resonance biosensors for screening of global interactions of polyphenols and proteins. ACS Sens. 2016, 1, 258–264. [Google Scholar] [CrossRef]
- Guerreiro, J.R.L.; Frederiksen, M.; Bochenkov, V.E.; De Freitas, V.; Ferreira Sales, M.G.; Sutherland, D.S. Multifunctional biosensor based on localized surface plasmon resonance for monitoring small molecule-protein interaction. ACS Nano 2014, 8, 7958–7967. [Google Scholar] [CrossRef] [PubMed]
- Zhang, D.; Lu, Y.; Zhang, Q.; Yao, Y.; Li, S.; Li, H.; Zhuang, S.; Jiang, J.; Liu, G.L.; Liu, Q. Nanoplasmonic monitoring of odorants binding to olfactory proteins from honeybee as biosensor for chemical detection. Sens. Actuators B 2015, 221, 341–349. [Google Scholar] [CrossRef]
- Bellapadrona, G.; Tesler, A.B.; Grünstein, D.; Hossain, L.H.; Kikkeri, R.; Seeberger, P.H.; Vaskevich, A.; Rubinstein, I. Optimization of localized surface plasmon resonance transducers for studying carbohydrate-protein interactions. Anal. Chem. 2012, 84, 232–240. [Google Scholar] [CrossRef] [PubMed]
- Kitano, H.; Takahashi, Y.; Mizukami, K.; Matsuura, K. Kinetic study on the binding of lectin to mannose residues in a polymer brush. Colloids Surf. B 2009, 70, 91–97. [Google Scholar] [CrossRef] [PubMed]
- Nagatsuka, T.; Uzawa, H.; Sato, K.; Kondo, S.; Izumi, M.; Yokoyama, K.; Ohsawa, I.; Seto, Y.; Neri, P.; Mori, H.; et al. Localized surface plasmon resonance detection of biological toxins using cell surface oligosaccharides on glyco chips. ACS Appl. Mater. Interfaces 2013, 5, 4173–4180. [Google Scholar] [CrossRef] [PubMed]
- Couture, M.; Ray, K.K.; Poirier-Richard, H.-P.; Crofton, A.; Masson, J.-F. 96-well plasmonic sensing with nanohole arrays. ACS Sens. 2016, 1, 287–294. [Google Scholar] [CrossRef]
- Das, A.; Zhao, J.; Schatz, G.C.; Sligar, S.G.; Van Duyne, R.P. Screening of type I and II drug binding to human cytochrome P450-3A4 in nanodiscs by localized surface plasmon resonance spectroscopy. Anal. Chem. 2009, 81, 3754–3759. [Google Scholar] [CrossRef] [PubMed]
- Langhammer, C.; Larsson, E.M.; Kasemo, B.; Zorić, I. Indirect nanoplasmonic sensing: Ultrasensitive experimental platform for nanomaterials science and optical nanocalorimetry. Nano Lett. 2010, 10, 3529–3538. [Google Scholar] [CrossRef] [PubMed]
- Li, J.; Ye, J.; Chen, C.; Li, Y.; Verellen, N.; Moshchalkov, V.V.; Lagae, L.; Van Dorpe, P. Revisiting the surface sensitivity of nanoplasmonic biosensors. ACS Photonics 2015, 2, 425–431. [Google Scholar] [CrossRef]
- Frost, R.; Langhammer, C.; Cedervall, T. Real-time in situ analysis of biocorona formation and evolution on silica nanoparticles in defined and complex biological environments. Nanoscale 2017, 9, 3620–3628. [Google Scholar] [CrossRef] [PubMed]
- Frost, R.; Wadell, C.; Hellman, A.; Molander, S.; Svedhem, S.; Persson, M.; Langhammer, C. Core-shell nanoplasmonic sensing for characterization of biocorona formation and nanoparticle surface interactions. ACS Sens. 2016, 1, 798–806. [Google Scholar] [CrossRef]
- Zen, F.; Karanikolas, V.D.; Behan, J.A.; Andersson, J.; Ciapetti, G.; Bradley, A.L.; Colavita, P.E. Nanoplasmonic sensing at the carbon-bio interface: Study of protein adsorption at graphitic and hydrogenated carbon surfaces. Langmuir 2017, 33, 4198–4206. [Google Scholar] [CrossRef] [PubMed]
- Nakanishi, K.; Sakiyama, T.; Imamura, K. On the adsorption of proteins on solid surfaces, a common but very complicated phenomenon. J. Biosci. Bioeng. 2001, 91, 233–244. [Google Scholar] [CrossRef]
- Rabe, M.; Verdes, D.; Seeger, S. Understanding protein adsorption phenomena at solid surfaces. Adv. Colloid Interface Sci. 2011, 162, 87–106. [Google Scholar] [CrossRef] [PubMed]
- Vogler, E.A. Protein adsorption in three dimensions. Biomaterials 2012, 33, 1201–1237. [Google Scholar] [CrossRef] [PubMed]
- Jackman, J.A.; Ferhan, A.R.; Yoon, B.K.; Park, J.H.; Zhdanov, V.P.; Cho, N.-J. Indirect nanoplasmonic sensing platform for monitoring temperature-dependent protein adsorption. Anal. Chem. 2017, 89, 12976–12983. [Google Scholar] [CrossRef] [PubMed]
- Li, Z.; Barnes, J.C.; Bosoy, A.; Stoddart, J.F.; Zink, J.I. Mesoporous silica nanoparticles in biomedical applications. Chem. Soc. Rev. 2012, 41, 2590–2605. [Google Scholar] [CrossRef] [PubMed]
- Yin, Z.F.; Wu, L.; Yang, H.G.; Su, Y.H. Recent progress in biomedical applications of titanium dioxide. Phys. Chem. Chem. Phys. 2013, 15, 4844–4858. [Google Scholar] [CrossRef] [PubMed]
- Dąbkowska, M.; Adamczyk, Z. Ionic strength effect in HSA adsorption on mica determined by streaming potential measurements. J. Colloid Interface Sci. 2012, 366, 105–113. [Google Scholar] [CrossRef] [PubMed]
- Hlady, V.; Füredi-Milhofer, H. Adsorption of human serum albumin on precipitated hydroxyapatite. J. Colloid Interface Sci. 1979, 69, 460–468. [Google Scholar] [CrossRef]
- Kempson, I.M.; Martin, A.L.; Denman, J.A.; French, P.W.; Prestidge, C.A.; Barnes, T.J. Detecting the presence of denatured human serum albumin in an adsorbed protein monolayer using TOF − SIMS. Langmuir 2010, 26, 12075–12080. [Google Scholar] [CrossRef] [PubMed]
- Mao, Y.; Wei, W.; Peng, H.; Zhang, J. Monitoring for adsorption of human serum albumin and bovine serum albumin onto bare and polystyrene-modified silver electrodes by quartz crystal impedance analysis. J. Biotechnol. 2001, 89, 1–10. [Google Scholar] [CrossRef]
- Ramezani, F.; Rafii-Tabar, H. An in-depth view of human serum albumin corona on gold nanoparticles. Mol. BioSyst. 2015, 11, 454–462. [Google Scholar] [CrossRef] [PubMed]
- Bujacz, A. Structures of bovine, equine and leporine serum albumin. Acta Crystallogr. Sect. D Biol. Crystallogr. 2012, 68, 1278–1289. [Google Scholar] [CrossRef] [PubMed]
- Kurrat, R.; Prenosil, J.E.; Ramsden, J.J. Kinetics of human and bovine serum albumin adsorption at silica–titania surfaces. J. Colloid Interface Sci. 1997, 185, 1–8. [Google Scholar] [CrossRef] [PubMed]
- Hartvig, R.A.; van de Weert, M.; Østergaard, J.; Jorgensen, L.; Jensen, H. Protein adsorption at charged surfaces: The role of electrostatic interactions and interfacial charge regulation. Langmuir 2011, 27, 2634–2643. [Google Scholar] [CrossRef] [PubMed]
- Jackman, J.A.; Tabaei, S.R.; Zhao, Z.; Yorulmaz, S.; Cho, N.-J. Self-assembly formation of lipid bilayer coatings on bare aluminum oxide: Overcoming the force of interfacial water. ACS Appl. Mater. Interfaces 2015, 7, 959–968. [Google Scholar] [CrossRef] [PubMed]
- McUmber, A.C.; Randolph, T.W.; Schwartz, D.K. Electrostatic interactions influence protein adsorption (but not desorption) at the silica–aqueous interface. J. Phys. Chem. Lett. 2015, 6, 2583–2587. [Google Scholar] [CrossRef] [PubMed]
- Mulheran, P.A.; Connell, D.J.; Kubiak-Ossowska, K. Steering protein adsorption at charged surfaces: Electric fields and ionic screening. RSC Adv. 2016, 6, 73709–73716. [Google Scholar] [CrossRef]
- Oleson, T.A.; Sahai, N. Interaction energies between oxide surfaces and multiple phosphatidylcholine bilayers from extended-DLVO theory. J. Colloid Interface Sci. 2010, 352, 316–326. [Google Scholar] [CrossRef] [PubMed]
- Sancataldo, G.; Vetri, V.; Foderà, V.; Di Cara, G.; Militello, V.; Leone, M. Oxidation enhances human serum albumin thermal stability and changes the routes of amyloid fibril formation. PLoS ONE 2014, 9, e84552. [Google Scholar] [CrossRef] [PubMed]
- Sengupta, A.; Koninti, R.K.; Gavvala, K.; Ballav, N.; Hazra, P. An anticancer drug to probe non-specific protein-DNA interactions. Phys. Chem. Chem. Phys. 2014, 16, 3914–3917. [Google Scholar] [CrossRef] [PubMed]
- Fredriksson, H.; Alaverdyan, Y.; Dmitriev, A.; Langhammer, C.; Sutherland, D.S.; Zäch, M.; Kasemo, B. Hole–mask colloidal lithography. Adv. Mater. 2007, 19, 4297–4302. [Google Scholar] [CrossRef]
- Jime´nez, C.; Perrie`re, J.; Vickridge, I.; Enard, J.P.; Albella, J.M. Transformation of silicon nitride in oxygen plasma. Surf. Coat. Technol. 1991, 45, 147–154. [Google Scholar] [CrossRef]
- Dahlin, A.B.; Tegenfeldt, J.O.; Höök, F. Improving the instrumental resolution of sensors based on localized surface plasmon resonance. Anal. Chem. 2006, 78, 4416–4423. [Google Scholar] [CrossRef] [PubMed]
- Cho, N.-J.; Jackman, J.A.; Liu, M.; Frank, C.W. pH-driven assembly of various supported lipid platforms: A comparative study on silicon oxide and titanium oxide. Langmuir 2011, 27, 3739–3748. [Google Scholar] [CrossRef] [PubMed]
- Szunerits, S.; Das, M.R.; Boukherroub, R. Short- and long-range sensing on gold nanostructures, deposited on glass, coated with silicon oxide films of different thicknesses. J. Phys. Chem. C 2008, 112, 8239–8243. [Google Scholar] [CrossRef]
- Galopin, E.; Noual, A.; Niedziółka-Jönsson, J.; Jönsson-Niedziółka, M.; Akjouj, A.; Pennec, Y.; Djafari-Rouhani, B.; Boukherroub, R.; Szunerits, S. Short- and long-range sensing using plasmonic nanostructures: Experimental and theoretical studies. J. Phys. Chem. C 2009, 113, 15921–15927. [Google Scholar] [CrossRef]
- Niedziółka-Jönsson, J.; Barka, F.; Castel, X.; Pisarek, M.; Bezzi, N.; Boukherroub, R.; Szunerits, S. Development of new localized surface plasmon resonance interfaces based on gold nanostructures sandwiched between tin-doped indium oxide films. Langmuir 2010, 26, 4266–4273. [Google Scholar] [CrossRef] [PubMed]
- Lee, K.-S.; El-Sayed, M.A. Gold and silver nanoparticles in sensing and imaging: sensitivity of plasmon response to size, shape, and metal composition. J. Phys. Chem. B 2006, 110, 19220–19225. [Google Scholar] [CrossRef] [PubMed]
- Miller, M.M.; Lazarides, A.A. Sensitivity of metal nanoparticle surface plasmon resonance to the dielectric environment. J. Phys. Chem. B 2005, 109, 21556–21565. [Google Scholar] [CrossRef] [PubMed]
- Joshi, G.K.; McClory, P.J.; Muhoberac, B.B.; Kumbhar, A.; Smith, K.A.; Sardar, R. Designing efficient localized surface plasmon resonance-based sensing platforms: Optimization of sensor response by controlling the edge length of gold nanoprisms. J. Phys. Chem. C 2012, 116, 20990–21000. [Google Scholar] [CrossRef]
- Hao, E.; Schatz, G.C. Electromagnetic fields around silver nanoparticles and dimers. J. Chem. Phys. 2004, 120, 357–366. [Google Scholar] [CrossRef] [PubMed]
- Sherry, L.J.; Jin, R.; Mirkin, C.A.; Schatz, G.C.; Van Duyne, R.P. Localized surface plasmon resonance spectroscopy of single silver triangular nanoprisms. Nano Lett. 2006, 6, 2060–2065. [Google Scholar] [CrossRef] [PubMed]
- Homola, J. Surface plasmon resonance sensors for detection of chemical and biological species. Chem. Rev. 2008, 108, 462–493. [Google Scholar] [CrossRef] [PubMed]
- Nelson, N.; Schwartz, D.K. Specific ion (Hofmeister) effects on adsorption, desorption, and diffusion at the solid–aqueous interface. J. Phys. Chem. Lett. 2013, 4, 4064–4068. [Google Scholar] [CrossRef]
- Dias-Cabral, A.C.; Queiroz, J.A.; Pinto, N.G. Effect of salts and temperature on the adsorption of bovine serum albumin on polypropylene glycol-sepharose under linear and overloaded chromatographic conditions. J. Chromatogr. A 2003, 1018, 137–153. [Google Scholar] [CrossRef] [PubMed]
- Hlady, V.V.; Buijs, J. Protein adsorption on solid surfaces. Curr. Opin. Biotechnol. 1996, 7, 72–77. [Google Scholar] [CrossRef]
- Mizutani, T. Adsorption of proteins on silicone-coated glass surfaces. J. Colloid Interface Sci. 1981, 82, 162–166. [Google Scholar] [CrossRef]
- Pace, C.N. Conformational stability of globular proteins. Trends Biochem. Sci. 1990, 15, 14–17. [Google Scholar] [CrossRef]
- Dee, K.C.; Puleo, D.A.; Bizios, R. (Eds.) Protein-surface interactions. In An Introduction to Tissue-Biomaterial Interactions; Wiley: Hoboken, NJ, USA, 2002. [Google Scholar]
- Norde, W. Driving forces for protein adsorption at solid surfaces. Macromol. Symp. 1996, 103, 5–18. [Google Scholar] [CrossRef]
- Ouberai, M.M.; Xu, K.; Welland, M.E. Effect of the interplay between protein and surface on the properties of adsorbed protein layers. Biomaterials 2014, 35, 6157–6163. [Google Scholar] [CrossRef] [PubMed]
- Santore, M.M.; Wertz, C.F. Protein spreading kinetics at liquid−solid interfaces via an adsorption probe method. Langmuir 2005, 21, 10172–10178. [Google Scholar] [CrossRef] [PubMed]
- van der Veen, M.; Stuart, M.C.; Norde, W. Spreading of proteins and its effect on adsorption and desorption kinetics. Colloids Surf. B 2007, 54, 136–142. [Google Scholar] [CrossRef] [PubMed]
- Calonder, C.; Tie, Y.; Van Tassel, P.R. History dependence of protein adsorption kinetics. Proc. Natl. Acad. Sci. USA 2001, 98, 10664–10669. [Google Scholar] [CrossRef] [PubMed]
- Larsericsdotter, H.; Oscarsson, S.; Buijs, J. Structure, stability, and orientation of BSA adsorbed to silica. J. Colloid Interface Sci. 2005, 289, 26–35. [Google Scholar] [CrossRef] [PubMed]
- Norde, W.; Giacomelli, C.E. BSA structural changes during homomolecular exchange between the adsorbed and the dissolved states. J. Biotechnol. 2000, 79, 259–268. [Google Scholar] [CrossRef]
- Tassel, P.R.V.; Viot, P.; Tarjus, G. A kinetic model of partially reversible protein adsorption. J. Chem. Phys. 1997, 106, 761–770. [Google Scholar] [CrossRef]
- Fischer, H.; Polikarpov, I.; Craievich, A.F. Average protein density is a molecular-weight-dependent function. Protein Sci. 2004, 13, 2825–2828. [Google Scholar] [CrossRef] [PubMed]
- Vörös, J. The density and refractive index of adsorbing protein layers. Biophys. J. 2004, 87, 553–561. [Google Scholar] [CrossRef] [PubMed]
- Park, J.H.; Sut, T.N.; Jackman, J.A.; Ferhan, A.R.; Yoon, B.K.; Cho, N.-J. Controlling adsorption and passivation properties of bovine serum albumin on silica surfaces by ionic strength modulation and cross-linking. Phys. Chem. Chem. Phys. 2017, 19, 8854–8865. [Google Scholar] [CrossRef] [PubMed]
- Kwok, K.C.; Yeung, K.M.; Cheung, N.H. Adsorption kinetics of bovine serum albumin on fused silica: population heterogeneities revealed by single-molecule fluorescence microscopy. Langmuir 2007, 23, 1948–1952. [Google Scholar] [CrossRef] [PubMed]
- Mathé, C.; Devineau, S.; Aude, J.-C.; Lagniel, G.; Chédin, S.; Legros, V.; Mathon, M.-H.; Renault, J.-P.; Pin, S.; Boulard, Y.; et al. Structural Determinants for Protein adsorption/non-adsorption to Silica Surface. PLoS ONE 2013, 8, e81346. [Google Scholar] [CrossRef] [PubMed]
- Kubiak-Ossowska, K.; Tokarczyk, K.; Jachimska, B.; Mulheran, P.A. Bovine Serum Albumin Adsorption at a Silica Surface Explored by Simulation and Experiment. J. Phys. Chem. B 2017, 121, 3975–3986. [Google Scholar] [CrossRef] [PubMed]
- Kang, Y.; Li, X.; Tu, Y.; Wang, Q.; Ågren, H. On the Mechanism of Protein Adsorption onto Hydroxylated and Nonhydroxylated TiO2 Surfaces. J. Phys. Chem. C 2010, 114, 14496–14502. [Google Scholar] [CrossRef]
- Brandt, E.G.; Lyubartsev, A.P. Molecular Dynamics Simulations of Adsorption of Amino Acid Side Chain Analogues and a Titanium Binding Peptide on the TiO2 (100) Surface. J. Phys. Chem. C 2015, 119, 18126–18139. [Google Scholar] [CrossRef]
- Givens, B.E.; Xu, Z.; Fiegel, J.; Grassian, V.H. Bovine serum albumin adsorption on SiO2 and TiO2 nanoparticle surfaces at circumneutral and acidic pH: A tale of two nano-bio surface interactions. J. Colloid Interface Sci. 2017, 493, 334–341. [Google Scholar] [CrossRef] [PubMed]
- Lassen, B.; Malmsten, M. Structure of protein layers during competitive adsorption. J. Colloid Interface Sci. 1996, 180, 339–349. [Google Scholar] [CrossRef]
- Jackman, J.A.; Zan, G.H.; Zhao, Z.; Cho, N.-J. Contribution of the hydration force to vesicle adhesion on titanium oxide. Langmuir 2014, 30, 5368–5372. [Google Scholar] [CrossRef] [PubMed]


| Silica | Titania | |
|---|---|---|
| Surface charge (influenced by hydroxyl groups) | Highly negative | Slightly negative |
| Force governing protein-surface interaction | Electrostatic | Non-electrostatic/van der Waals |
| Degree of surface hydration | Low | High |
| Dependency of protein adsorption on ionic strength based on QCM-D responses | Weak | Weak |
| Dependency of protein adsorption on ionic strength based on LSPR responses | Strong | Negligible |
© 2018 by the authors. Licensee MDPI, Basel, Switzerland. This article is an open access article distributed under the terms and conditions of the Creative Commons Attribution (CC BY) license (http://creativecommons.org/licenses/by/4.0/).
Share and Cite
Ferhan, A.R.; Jackman, J.A.; Sut, T.N.; Cho, N.-J. Quantitative Comparison of Protein Adsorption and Conformational Changes on Dielectric-Coated Nanoplasmonic Sensing Arrays. Sensors 2018, 18, 1283. https://doi.org/10.3390/s18041283
Ferhan AR, Jackman JA, Sut TN, Cho N-J. Quantitative Comparison of Protein Adsorption and Conformational Changes on Dielectric-Coated Nanoplasmonic Sensing Arrays. Sensors. 2018; 18(4):1283. https://doi.org/10.3390/s18041283
Chicago/Turabian StyleFerhan, Abdul Rahim, Joshua A. Jackman, Tun Naw Sut, and Nam-Joon Cho. 2018. "Quantitative Comparison of Protein Adsorption and Conformational Changes on Dielectric-Coated Nanoplasmonic Sensing Arrays" Sensors 18, no. 4: 1283. https://doi.org/10.3390/s18041283
APA StyleFerhan, A. R., Jackman, J. A., Sut, T. N., & Cho, N.-J. (2018). Quantitative Comparison of Protein Adsorption and Conformational Changes on Dielectric-Coated Nanoplasmonic Sensing Arrays. Sensors, 18(4), 1283. https://doi.org/10.3390/s18041283