Abstract
We present a continuous-wave fiber cavity ringdown (FCRD) pressure-sensing method based on frequency-shifted interferometry (FSI). Compared with traditional CRD or FCRD techniques, this FSI-FCRD scheme deduces pressure by measuring the decay rate of continuous light exiting the fiber ringdown cavity (RDC) in the spatial domain (i.e., the CRD distance), without the requirement for optical pulsation and fast electronics. By using a section of fiber with the buffer layer stripped in the fiber RDC as the sensor head, pressures were measured within the range from 0 to 10.4 MPa. The sensitivity of 0.02356/(km∙MPa) was obtained with a measurement error of 0.1%, and the corresponding pressure resolution was 0.05 MPa. It was found that the measurement sensitivity can be improved by enlarging the interaction length of the sensor head. The results show the proposed sensor has the advantages of simple structure, low cost, high sensitivity, and high stability in pressure detection.
1. Introduction
The role of pressure sensors is becoming increasingly prominent in the fields of energy, chemical industry, aerospace, transportation, large civil engineering, etc. Compared with traditional electrical or mechanical pressure sensors, fiber-optic pressure sensors have many outstanding advantages, such as light weight, high sensitivity, high resolution, fast response, and anti-electromagnetic disturbance [1,2,3,4,5].The most popular sensors are based on fiber Bragg gratings (FBGs) and Fabry–Perot interference (FPI). FPI-based sensors measure pressures by monitoring the variation of cavity length, resonant wavelength, or phase shift from the interference spectra caused by external pressures. Many efforts have been devoted to improving the sensitivity of FPI-based pressure sensors by electrical arc discharging, femtosecond laser micromachining, or polymer coating on a bare fiber [6,7,8,9], but the fabrication processes are usually complex, expensive, or poorly reproducible, which hinder their mass production and applications in engineering. The principle of FBG-based pressure sensors is the fact that the Bragg wavelength changes with the variation of pressure. But due to cross sensitivity to other parameters (such as temperature, strain, and vibration) and low sensitivity pressure, FBG-based pressure sensors also require specific mechanical devices and sensitization measures [10,11,12,13]. Therefore, it is crucial to explore new methods for developing fiber pressure sensors that are simple, inexpensive, and highly sensitive.
As a sensitive technique, powerful in measuring weak optical losses, the cavity ringdown (CRD) technique has attracted considerable attention during the past three decades [14]. The CRD technique measures the intensity of the decay rate of an optical pulse exiting the ringdown cavity, rather than the intensity decay of the light transmitted through the test sample like conventional direct or multi-pass optical spectroscopic techniques. The small absorption loss induced by the sample can be monitored by measuring the change of 1/e intensity decay time (i.e., the CRD time). The CRD technique has a long light–sample interaction length and immunity to light source fluctuations, which makes it offer superior sensitivity. However, traditional CRD techniques suffer from the disturbances of inconvenient mirror alignments and delicate coating or polishing of high-finesse ringdown cavities [15,16,17]. In order to overcome these obstacles, a fiber cavity ringdown (FCRD) technique, which employs a fiber loop formed by two fiber couplers as the ringdown cavity(RDC), was first proposed in 2001 [18], and it has rapidly aroused the interest of researchers. In 2004, Wang explored FCRD for pressure measurement and obtained a sensitivity of 0.0432/(s∙Mpa) [19]. More recently, Yang et al. developed this technique for weight-in-motion detection and measured the velocity of vehicles by applying sensing forces on a micro-bending sensor head [20]. Also, Yang et al. reported static ice pressure detection of hydraulic structures based on FCRD technique, and a high sensitivity of 0.0098/(s∙KPa) was attained [21]. Despite these successes, pulsed light is still needed in the fiber RDC for an observable CRD event in FCRD, as well as in CRD. Consequently, an expensive pulsed light source (or a pulse modulator), a fast photoelectric detector, and a high-speed data acquisition card (DAQ, or oscilloscope) are still necessary [22].
Here, we propose to utilize frequency-shifted interferometry fiber cavity ringdown (FSI-FCRD) technique for pressure sensing. FSI-FCRD combines the highly-sensitive virtues of both FSI and FCRD, and thus, it has a highly-sensitive nature to pressure without the request for specific sensitization, unlike FBG-based sensors. In contrast with CRD and FCRD schemes, FSI-FCRD uses continuous light without the need for any optical pulses and fast electronics. Furthermore, FSI-FCRD obtains a CRD transient as a function of the distance traveled by the continuous light in the fiber RDC by operating Fourier transform on the interference signal. Therefore, FSI-FCRD is a continuous-wave (CW) spatial-domain FCRD technique. It measures the decay rate of continuous light in the spatial domain instead of measuring the decay rate of an optical pulse in the time domain as in CRD and FCRD. Additionally, due to the nature of same-path interference and the differential detection utilized to offset direct current (DC) noise of the interference signal, the FSI-FCRD scheme has high signal-to-noise ratio and high stability. FSI-FCRD has been successfully applied in monitoring fiber bend loss, solution refractive index, magnetic field, and gas concentration [22,23,24,25]. However, to the best of our knowledge, there are no publications that have reported the application of this technique in pressure detection.
We fabricated a continuous-wave (CW) fiber cavity ringdown pressure sensor by using a FSI-FCRD scheme. In the scheme, a CW light source, a slow detector, and a slow DAQ were used to monitor the CRD transient of continuous light in the spatial domain. The sensor head was formed by a fraction of single-mode fiber (SMF) in the fiber RDC, which is easy to fabricate, low-cost and repeatable, unlike most FPI-based sensors. By applying different weights on a section of fiber in the fiber ringdown cavity, pressures were successfully measured in the range of 0–10.4 Mpa. The obtained sensitivity was 0.02356/(km∙MPa) with a baseline stability of 0.1% and a resolution of 0.05 MPa, which is better than some results reported by traditional FCRD techniques. This is the first time FSI-FCRD has been used to detect pressure, and the results show that the new type of pressure sensor explored in this work would be a superior alternative to pressure measurement in the aspects of low cost, simple structure, high sensitivity, and high stability.
2. Operating Principle
The schematic of the proposed FSI-FCRD system for pressure measurement is shown in Figure 1. It is essentially an asymmetric frequency-shifted fiber Sagnac interferometer, whose principle has been elaborated in [26]. By connecting the two ports of a fiber coupler (C1 in Figure 1), the interferometer is formed with an asymmetrically-inserted frequency shifter (here, an acousto-optic modulator (AOM) is used) and a fiber RDC. The fiber RDC consists of two fiber couplers (C2 and C3) and two sections of single-mode fiber. After the CW light from a broadband light source is launched into the interferometer loop, two counter-propagating lightwaves will circulate in the fiber RDC. After each roundtrip in the cavity, small fractions of the two lightwaves leak out from the cavity and return to the coupler C1. If the coherence length of the light source is shorter than the cavity length, the two lightwaves will interfere at the coupler C1 after completing the same number of roundtrips. The differential interference signal between the two output ports of the interferometer can be expressed as [23,24]
where L = l2 + l3 is the ringdown cavity length, L0= l1 + l2 + l4−l5 is a constant with li (I = 1, 2, 4, 5) being the fiber lengths defined in Figure 1, n is the effective refractive index of the mode of the single-mode fiber, f is the frequency shift caused by the AOM, and c is the light speed in vacuum. Fm = n(mL + L0)/c is the oscillation frequency, which has a linear relationship with the roundtrip number m. Im is the intensity of the interferential light after m roundtrips in the RDC [23]:
where I0 is a constant, l = mL is the distance circulated by the light in the cavity, and αc is the background cavity loss per roundtrip, including the fiber couplers’ insertion loss, fiber transmission loss, and fiber splicing loss.
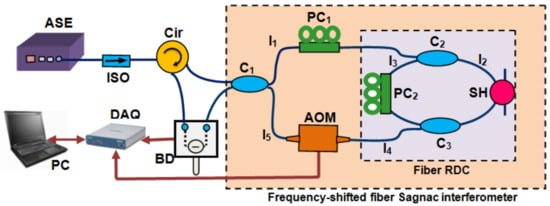
Figure 1.
Schematic of the frequency-shifted interferometry fiber cavity ringdown (FSI-FCRD) pressure-sensing system. ASE: amplified spontaneous emission source; ISO: isolator; Cir: circulator; C1: 3 dB fiber coupler; C2 and C3: 99.5/0.5 fiber couplers; PC1 and PC2: polarization control; SH: sensor head; AOM: acousto-optic modulator; BD: balanced detector; DAQ: data acquisition card; and PC: personal computer.
From Equations (1) and (2) ΔI is a summation of sinusoids, and Im is an exponential decay function of the distance l. If we linearly sweep the frequency shift f and perform fast Fourier transform (FFT) on ΔI, the Fourier spectrum of ΔI will include many exponential decay Fourier peaks located at Fm. When frequency Fm is converted to distance ld using the equation ld = l + L0 = cFm/n, the Fourier spectrum of ΔI is essentially a CRD transient in the spatial domain [23]. That is, the spatial-domain CRD decay transient is obtained by performing FFT on ΔI. When the intensity Im decreases to 1/e of the initial intensity (I0) observed by the detector, the distance traveled by light in the RDC can be termed as the ringdown distance Λ0, which is similar to the ringdown time in the traditional CRD and FCRD techniques, and it can be described as [23]:
When an external force F is applied vertically on a section of the fiber in the RDC, the pressure P equals the force F divided by the area of contact S (i.e., P = F/S). Furthermore, a pressure-induced loss αs occurs and leads to a change in the ringdown distance Λ:
where αs = ξSdP, ξ is the pressure-induced attenuation coefficient, and d is the length of the fiber that has direct interaction with the applied pressure [19], which represents the actual length of the sensor head. Combining Equation (3) with Equation (4), we have
where k = ξSd/L is a constant. Thus, one can deduce the applied pressure by observing the change between the ringdown distance with the pressure applied (Λ) and the ringdown distance without pressure applied (Λ0), for a given FSI-FCRD pressure sensor. There is a linear relationship between the variation (1/Λ − 1/Λ0) and the applied pressure. From Equation (5), the minimum detectable pressure, that is, the pressure resolution of the system Pmin, can be estimated from the following equations:
where δΛ and are one standard deviation of the CRD distances measured repeatedly and the average CRD distance under a given pressure, respectively. Because the constant k = ξSd/L can represent the sensitivity of the pressure-sensing system, one can tailor the sensitivity by adjusting the interaction length of d. Obviously, the resolution is proportional to the pressure sensitivity. In addition, the two counter-propagating lightwaves in the Sagnac loop travel along the same path, and the two interference signals are detected and subtracted by the balanced detector (BD).Thus, it removes the influences of external disturbances, such as draw, pressure, or twist [22,27] and makes the FSI-based sensing system very steady [28]. Moreover, compared to traditional CRD or FCRD pressure sensors, this system employs continuous light, requiring no pulsation or high-speed detection/data acquisition.
3. Experiments and Results
The FSI-FCRD pressure detection system in our laboratory is demonstrated in Figure 2. The fiber RDC constructed by a pair of 99.5:0.5 fiber couplers, had a length of ~ 60 m. An amplified spontaneous emission (ASE) source (Connet Fiber Optics Co., Ltd., Shanghai, China, AS3210-BB2) was used as a broadband light source, with the output power set to 8 mW. The light from the ASE was launched into the Sagnac interferometer formed by a 50/50 fiber coupler C1 after passing through an isolator (ISO). The AOM (Brimrose, Maryland, MD, USA, AMM-100-20-25-1550-2FP)was swept from 90 to 110 MHz at a step size of 0.02 MHz, providing a spatial resolution of ~10 m and a sensing range of ~5200 m (>70 roundtrips). The two interference signals of the Sagnac interferometer were converted into electrical signals and subtracted by a BD (New Focus) to eliminate the DC noise, and then, the output of the BD was recorded by a DAQ (NI USB-6361). The maximum sampling rate of the DAQ was set to only 100 kS/s, which was much lower than that used in many traditional CRD or FCRD techniques [23,27,29]. A Labview program was developed for data processing, real-time display, and controlling the synchronization between the AOM and DAQ. Two polarization controllers (PC1 and PC2) were used to adjust the polarization state and improve the visibility of the interference fringes.
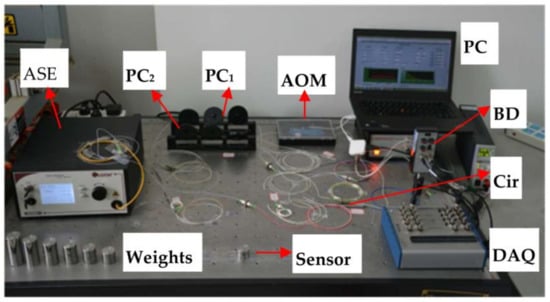
Figure 2.
The experimental setup of the fiber pressure detection.
The pressure sensor head was fabricated by two sections of single-mode fiber with the buffer layer stripped, one of which was from the fiber in the RDC, and the other of which was from an individual piece of SMF. The two sections of fiber were fixed on the optical platform and kept parallel to each other. The pressure force F was provided by a series of customized cylindrical weights with a diameter of 3 cm and a standard weight. Each cylindrical weight was placed across the top of the sensor head in turn. The interaction length between the sensor head and the weight was set to ~15 mm, and the pressure was varied using the precision weights. Because the contact area could be considered to be a rectangular shape with the width w of one-tenth of the fiber cladding diameter (125 m) [19] and the length d of 15 mm, this area was estimated to be 1.875 × 10⁻⁷ m2. As a result, the pressure P applied to the sensor head was obtained by conversion from half of the weight gravity (F) through the equation P = F/S, where S = wd was the estimated contact area, assumed to be invariable in the range of detected pressures.
When no pressure was applied on the sensor head, a typical time-domain differential interference signal ΔI sampled by the DAQ is demonstrated in Figure 3a, and throughthe simple transform of the FFT algorithm, the obtained CRD decay transient in the spatial domain is shown in Figure 3b. In order to eliminate the influence of the residual DC component caused by the incomplete cancellation of the BD, the CRD signal had been set to zero in the initial distance, which ranged from 0 to 50 m. The ringdown pulses could clearly be observed with a round-trip distance (i.e., the cavity length) of ~65.7 m. By extracting the peaks of the ringdown signal and then fitting these peaks with an exponential (EXP) function, the ringdown distance without pressure applied can be calculated as 955.11 m with an R-squared of 0.9999. It reveals that the signal intensity has an excellent exponential decay relationship with the distance traveled by the continuous light in the RDC.
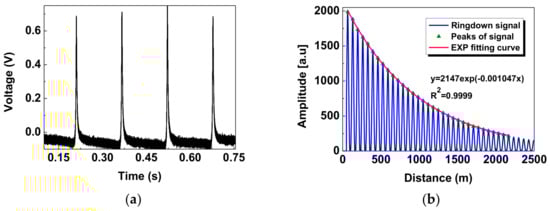
Figure 3.
Typical differential interference signal ΔI without pressure applied: (a) the time-domain signal sampled by the DAQ; (b) the obtained spatial-domain cavity ringdown(CRD) signal after performing fast Fourier transform (FFT) on (a).
We further measured spatial-domain ringdown signals with the pressures applied on the sensor head, when the quality of the applied weights was increased from 0 to 400 g at increments of 50 g. This means that the corresponding pressure applied ranged from 0 to 10.4 MPa at steps of 1.3 MPa. Through nearly the same processing method as described in Figure 3, the obtained exponential decay curves are shown in Figure 4. Each decay curve represents an average of 20 ringdown events, which is distinguishable, especially in the inset of Figure 4. We can observe that the ringdown signal decays faster as the pressure increases. This also can be confirmed by the on-line responses of the ringdown distances to the pressures applied on the sensor head, as shown in Figure 5. Each distinctive step corresponds to a different applied pressure. The averaged ringdown distance measured by FSI-FCRD decreased from 955.50 m at 0 MPa to 776.81 m at 10.4 MPa. The linearity of the sensor response was examined by use of the data in Figure 5. Figure 6 clearly illustrates the relationship between the term (1/Λ – 1/Λ0) and the pressure applied. The variation (1/Λ – 1/Λ0) increases with the increase of the applied pressure. By linear fitting, the R-squared of 0.98342 indicates that the variation of ringdown distance is a linear function of the pressure, which agrees with the analysis result of Equation (5). The slope of the fitted straight line suggests that the measurement sensitivity is 0.02356/(km∙MPa) with a standard error of 0.00108/(km∙MPa). However, one must notice that, according to Equation (5) and the contact area S = wd, the sensitivity of the sensor is proportional to the interaction length squared (d2), and thus, it can be improved by increasing the interaction length d of the sensor head. For instance, in our experiments, when the interaction length of the sensor was lengthened to 25 mm, the measured sensitivity increased to 0.07087/(km∙MPa), which was consistent with the theoretical value of 0.06544/(km∙MPa). The small deviation was caused by the fact that the gravity centers of the applied weights deviated from the geometric center of the contact area.
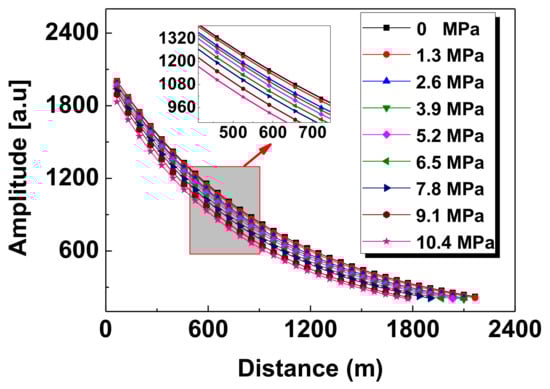
Figure 4.
Fitted exponential decay curves under different pressures.
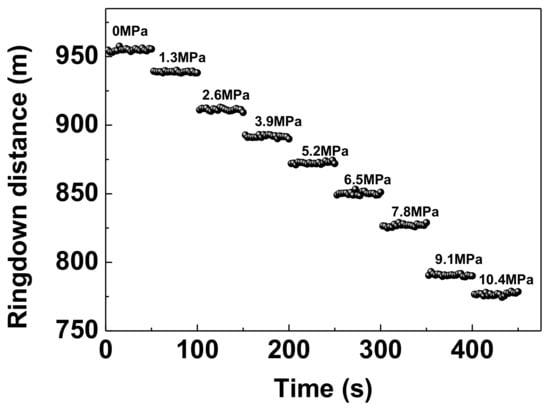
Figure 5.
The ringdown distance responses to pressures applied on the sensor.
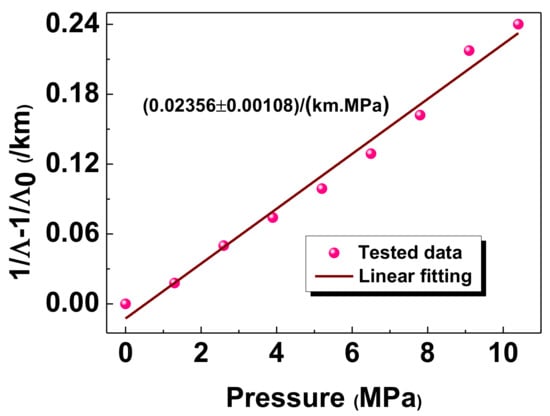
Figure 6.
The relationship between the ringdown distance and the pressure.
Figure 7 demonstrates the ringdown response to 2.6-Mpa pressure unloaded and loaded on the pressure sensor head. The up and down steps show that the sensor has a good repeatability. Additionally, each data point in Figure 7 came from one measurement of the ringdown event, which took ~2.5 s. By dividing the experimental time by the number of all the data points in [21,30] respectively, the time taken can be calculated as ~4.2 s and ~8.6 s. Therefore, the proposed sensor also has a faster pressure response.
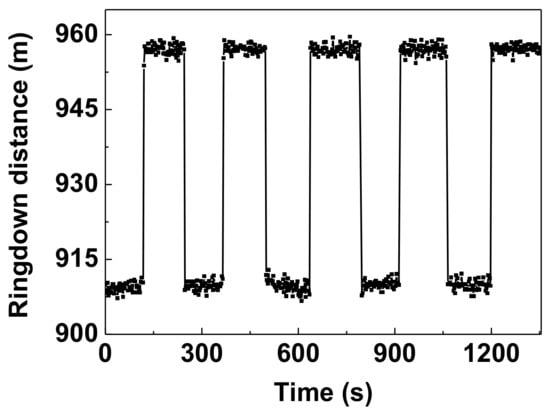
Figure 7.
The repeated measurement results with 2.6-MPa pressure unloaded and loaded.
In order to evaluate the stability of the system, the ringdown baseline stability, , where δΛ is the standard deviation and is the averaged ringdown distance, was defined as similar to that of the literature [19]. The measurement of the ringdown distance was repeated 100 times under the same constraints (e.g., the pressure of 2.6 MPa) and the results were shown in Figure 8. The averaged ringdown distance was 909.99 m, and the obtained standard deviation was 1.02 m, much smaller than the spatial resolution of the FSI system. Therefore, the ringdown baseline stability of the FSI-FCRD system was 0.1%, which was as good as the stability reported in [19]. Compared with the baseline stabilities of ~1% reported in the literature [21,31,32], the better stability of the system is mainly due to the fact that the FSI-FCRD scheme has the nature of same-path interference, and it employs differential detection to eliminate DC components of the two interference lightbeams. The better stability of the systemis also due to the unwarped status or noninstrinsic fiber interaction in the system, neither a micro-bend fiber [21] nor a fiber endgap/taper fabricated as the sensor head in the RDC [31,32]. According to the pressure sensitivity mentioned above and Equation (7), the pressure resolution of the system for pressure measurement was determined to be 0.05 MPa.This is better than those reported in [19,30], because the pressure detection limits can be calculated as ~0.07 MPa by using the equation , similar to Equation (7), where is the averaged value of the CRD times, is the corresponding one standard deviation, and k is the pressure sensitivity obtained on the basis of the parameters measured in the texts. Moreover, the detection limit of our proposed sensor can be further improved by increasing the pressure sensitivity.
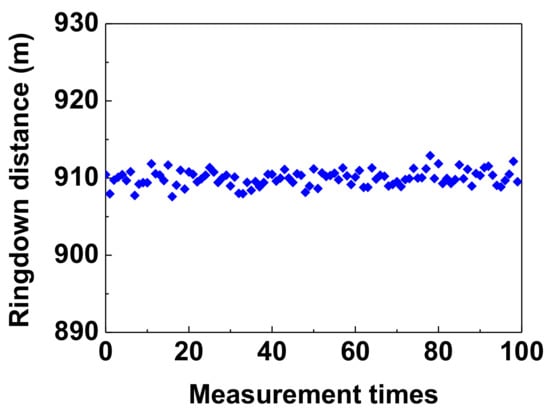
Figure 8.
Typical testing result of the ringdown baseline stability of the pressure system.
4. Conclusions
A novel method of developing optical fiber pressure sensors by use of a continuous-wave FCRD scheme based on FSI is demonstrated. With this FSI-FCRD technique, pressure measurements were achieved in a spatial domain by measuring ringdown distances. The sensing system consists of a continuous-wave broadband light source, an acousto-optic modulator, four fiber couplers, a fraction of single-mode fiber, and a slow detector. The sensor’s performance in the issues of linear response, sensitivity, repeatability, and stability was investigated experimentally by applying weights to the sensor head. A sensitivity of 0.02356/(km∙MPa) was attained in the range of 0–10.4 MPa. Furthermore, through adjusting the interaction length of the sensor head in the fiber RDC, the sensing system allows for tailoring of sensitivity. In the repetitive test, the obtained measurement error was 0.1%, corresponding to the minimum detectable pressure of 0.05 MPa, which is better than the detection limits reported in [19,30]. Additionally, the FSI-FCRD pressure sensor has a rapid response time, typically of less than 3 s. The results indicate that the proposed sensor is low-cost, highly sensitive, and highly stable, and it exhibits the application potential for pressure measurements in aerospace, petrochemical industries, ice loading on bridge piers, smart materials, etc.
Acknowledgments
This work was supported by the National Natural Science Foundation of China (Grant Nos. 61475044, 51405143), the International Science & Technology Cooperation Program of China (No. 2016YFE0124300), the Doctoral Scientific Research Foundation of Hubei University of Technology (No. BSQD2016047), and the Open Foundation of Hubei Collaborative Innovation Center for High-efficiency Utilization of Solar Energy (No. HBSKFZD2017003).
Author Contributions
Yiwen Ou and Chunfu Cheng designed the experiments and analyzed the data; Zehao Chen and Zhangyong Yang performed the experiments; Yiwen Ou wrote the paper; Hui Lv contributed materials; and Li Qian revised the paper and gave useful suggestions.
Conflicts of Interest
The authors declare no conflict of interest.
References
- Lee, B. Review of the present status of optical fiber sensors. Opt. Fiber Technol. 2003, 9, 57–79. [Google Scholar] [CrossRef]
- Razak, A.H.A.; Zayegh, A.; Begg, R.K.; Wahab, Y. Foot plantar pressure measurement system: A review. Sensors 2012, 12, 9884–9912. [Google Scholar] [CrossRef] [PubMed]
- Sikarwar, S.; Singh, S.; Yadav, B.C. Review on pressure sensors for structural health monitoring. Photonic Sens. 2017, 7, 294–304. [Google Scholar] [CrossRef]
- Kim, M.; Kim, H.; Park, J.; Jee, K.K.; Lim, J.A.; Park, M.C. Real-time sitting posture correction system based on highly durable and washable electronic textile pressure sensors. Sens. Actuators A Phys. 2018, 269, 394–400. [Google Scholar] [CrossRef]
- Urrutia, A.; Goicoechea, J.; Rivero, P.J.; Pildain, A.; Arregui, F.J. Optical fiber sensors based on gold nanorods embedded in polymeric thin films. Sensor Actuators B-Chem. 2018, 255, 2105–2112. [Google Scholar] [CrossRef]
- Donlagic, D.; Cibula, E. All-fiber high-sensitivity pressure sensor with SiO2 diaphragm. Opt. Lett. 2005, 30, 2071–2073. [Google Scholar] [CrossRef] [PubMed]
- Wang, Y.P.; Li, Z.; Wang, Q.; Wang, D.N. Sub-micron silica diaphragm-based fiber-tip Fabry–Perot interferometer for pressure measurement. Opt. Lett. 2014, 39, 2827–2830. [Google Scholar] [CrossRef]
- Wang, Y.; Wang, D.N.; Wang, C.; Hu, T.Y. Compressible fiber optic micro-Fabry-Pérot cavity with ultra-high pressure sensitivity. Opt. Express 2013, 21, 14084–14089. [Google Scholar] [CrossRef] [PubMed]
- Sun, B.; Wang, Y.; Qu, J.; Liao, C.R.; Yin, G.L.; He, Y.; Zhou, J.T.; Tang, J.; Liu, S.; Li, Z.Y.; et al. Simultaneous measurement of pressure and temperature by employing Fabry-Perot interferometer based on pendant polymer droplet. Opt. Express 2015, 23, 1906–1911. [Google Scholar] [CrossRef] [PubMed]
- Bhowmik, K.; Peng, G.D.; Luo, Y.H.; Ambikairajah, E.; Lovric, V.; Walsh, W.R.; Rajan, G. Experimental study and analysis of hydrostatic pressure sensitivity of polymer fibre Bragg gratings. J. Lightwave Technol. 2015, 33, 2456–2462. [Google Scholar] [CrossRef]
- Allwood, G.; Wild, G.; Lubansky, A.; Hinckley, S. A highly sensitive fiber Bragg grating diaphragm pressure transducer. Opt. Fiber Technol. 2015, 25, 25–32. [Google Scholar] [CrossRef]
- Song, D.C.; Wei, Z.X.; Zou, J.L.; Yang, S.M.; Du, E.; Cui, H.L. Pressure sensor based on fiber Bragg grating and carbon fiber ribbon-wound composite cylindrical shell. IEEE Sens. J. 2009, 9, 828–831. [Google Scholar] [CrossRef]
- Descamps, F.; Caucheteur, C.; Mégret, P.; Bette, S. Distribution profiling of a transverse load using the DGD spectrum of chirped FBGs. Opt. Express 2015, 23, 18203–18217. [Google Scholar] [CrossRef] [PubMed]
- Anderson, D.Z.; Frisch, J.C.; Masser, C.S. Mirror reflectometer based on optical cavity decay time. Appl. Opt. 1984, 23, 1238–1245. [Google Scholar] [CrossRef]
- Bae, T.; Atkins, R.A.; Taylor, H.F.; Gibler, W.N. Interferometric fiber-optic sensor embedded in a spark plug for n-cylinder pressure measurement in engines. Appl. Opt. 2003, 42, 1003–1007. [Google Scholar] [CrossRef]
- Lehmann, K.K.; Rabinowitz, P. High-Finesse Optical Resonator for Cavity Ring-down Spectroscopy Based upon Brewster’s Angle Prism Retroreflectors. U.S. Patent 5,973,864, 26 October 1999. [Google Scholar]
- Vogler, D.E.; Müller, M.G.; Sigrist, M.W. Fiber-optic cavity sensing of hydrogen diffusion. Appl. Opt. 2003, 42, 5413–5417. [Google Scholar] [CrossRef]
- Stewart, G.; Atherton, K.; Yu, H.; Culshaw, B. An investigation of an optical fibre amplifier loop for intra-cavity and ring-down cavity loss measurements. Meas. Sci. Technol. 2001, 12, 843. [Google Scholar] [CrossRef]
- Wang, C.; Scherrer, S.T. Fiber loop ringdown for physical sensor development: Pressure sensor. Appl. Opt. 2004, 43, 6458–6464. [Google Scholar] [CrossRef]
- Yang, S.; Ruan, C.; Wang, Y. Pressure sensor for Weight-In-Motion measurement based on fiber loop ring-down spectroscopy. Proc. SPIE 2016, 10158, 101580U-1–101580U-6. [Google Scholar]
- Yang, Y.; Yang, L.; Zhang, Z.; Yang, J.J.; Wang, J.F.; Zhang, L.; Deng, X.; Zhang, Z.X. Fiber loop ring down for static ice pressure detection. Opt. Fiber Technol. 2017, 36, 312–316. [Google Scholar] [CrossRef]
- Tian, H.; Zhou, C.M.; Fan, D.; Ou, Y.W.; Tian, T.; Liang, W.L.; Li, M.M. Continuous-wave frequency-shifted interferometry cavity ring-down gas sensing with differential optical absorption. IEEE Photonics J. 2015, 7, 1–10. [Google Scholar] [CrossRef]
- Ye, F.; Qi, B.; Qian, L. Continuous-wave fiber cavity ring-down measurements using frequency-shifted interferometry. Opt. Lett. 2011, 36, 2080–2082. [Google Scholar] [CrossRef] [PubMed]
- Ye, F.; Zhou, C.M.; Qi, B.; Qian, L. Continuous-wave cavity ring-down evanescent-field sensing with a broadband source based on frequency-shifted interferometry. Sensor Actuators B Chem. 2013, 184, 150–155. [Google Scholar] [CrossRef]
- Tian, H.; Zhou, C.M.; Fan, D.; Ou, Y.W.; Yin, J.D. Continuous-wave fiber cavity ring-down magnetic field sensing method based on frequency-shifted interferometry. Chin. Opt. Lett. 2014, 12, 120604. [Google Scholar] [CrossRef]
- Ye, F.; Qian, L.; Qi, B. Multipoint chemical gas sensing using frequency-shifted interferometry. J. Lightwave Technol. 2009, 27, 5356–5364. [Google Scholar]
- Zhao, Y.J.; Chang, J.; Ni, J.S.; Wang, Q.P.; Liu, T.Y.; Wang, C.; Wang, P.P.; Lv, G.P.; Peng, G.D. Novel gas sensor combined active fiber loop ring-down and dual wavelengths differential absorption method. Opt. Express 2014, 22, 11244–11253. [Google Scholar] [CrossRef] [PubMed]
- Zhou, C.M.; Tian, T.; Qian, L.; Fan, D.; Liang, W.L.; Ou, Y.W. Doppler Effect-Based Optical Fiber Vibration Sensor Using Frequency-Shifted Interferometry Demodulation. J. Lightwave Technol. 2017, 35, 3483–3488. [Google Scholar] [CrossRef]
- Tong, Z.G.; Wright, A.; McCormick, T.; Li, R.; Oleschuk, R.D.; Loock, H.P. Phase-shift fiber-loop ring-down spectroscopy. Anal. Chem. 2004, 76, 6594–6599. [Google Scholar] [CrossRef] [PubMed]
- Wang, C.; Scherrer, S.T. Fiber ringdown pressure sensors. Opt. Lett. 2004, 29, 352–354. [Google Scholar] [CrossRef] [PubMed]
- Tong, Z.G.; Jakubinek, M.; Wright, A.; Gillies, A.; Loock, H.P. Fiber-loop ring-down spectroscopy: A sensitive absorption technique for small liquid samples. Rev. Sci. Instrum. 2003, 74, 4818–4826. [Google Scholar] [CrossRef]
- Tarsa, P.B.; Rabinowitz, P.; Lehmann, K.K. Evanescent field absorption in a passive optical fiber resonator using continuous-wave cavity ring-down spectroscopy. Chem. Phys. Lett. 2004, 38, 297–303. [Google Scholar] [CrossRef]
© 2018 by the authors. Licensee MDPI, Basel, Switzerland. This article is an open access article distributed under the terms and conditions of the Creative Commons Attribution (CC BY) license (http://creativecommons.org/licenses/by/4.0/).