Article

Comparison of CO2 Vertical Profiles in the Lower Troposphere between 1.6 µm Differential Absorption Lidar and Aircraft Measurements Over Tsukuba

1
Faculty of System Design, Tokyo Metropolitan University, Tokyo 1910065, Japan
2
Department of Biological Environment, Akita Prefectural University, Akita 0100195, Japan
3
National Institute for Environmental Studies, Ibaraki 3058506, Japan
*
Author to whom correspondence should be addressed.
Sensors 2018, 18(11), 4064; https://doi.org/10.3390/s18114064
Submission received: 19 October 2018 / Revised: 11 November 2018 / Accepted: 17 November 2018 / Published: 21 November 2018

Abstract

:
A 1.6 μm differential absorption Lidar (DIAL) system for measurement of vertical CO2 mixing ratio profiles has been developed. A comparison of CO2 vertical profiles measured by the DIAL system and an aircraft in situ sensor in January 2014 over the National Institute for Environmental Studies (NIES) in Tsukuba, Japan, is presented. The DIAL measurement was obtained at an altitude range of between 1.56 and 3.60 km with a vertical resolution of 236 m (below 3 km) and 590 m (above 3 km) at an average error of 1.93 ppm. An in situ sensor for cavity ring-down spectroscopy of CO2 was installed in an aircraft. CO2 mixing ratio measured by DIAL and the aircraft sensor ranged from 398.73 to 401.36 ppm and from 399.08 to 401.83 ppm, respectively, with an average difference of −0.94 ± 1.91 ppm below 3 km and −0.70 ± 1.98 ppm above 3 km between the two measurements.

1. Introduction

Before the Industrial Revolution, the atmospheric levels of carbon dioxide (CO2) were around 280 ppm [1]. On May 9 2013, the daily average concentration of CO2 in the atmosphere surpassed 400 ppm for the first time at the Mauna Loa Observatory in Hawaii, where the modern record of observations began back in 1958 [2]. IPCC 2013 has reported that the concentration will reach at least 440 ppm—more than 1.5 times the preindustrial level—by 2050 [1].
Highly accurate vertical CO2 profiles are desirable to improve quantification and understanding of the global sink and source of CO2 and of global climate change [3]. Validating and improving the global atmospheric transport model requires precise measurement of CO2 profile. Atmospheric CO2 concentrations have been measured with high accuracy at ground stations and tall towers as well as on ships, aircraft, and balloons using flask sampling or continuous measurement equipment. In comparison with the ground-based measurements, measurements of CO2 vertical profiles in the troposphere have been limited as the measurements conducted using campaign-style aircrafts and commercial airlines have limited spatial and temporal coverage [4,5,6,7,8].
Light detection and ranging (Lidar) is one of the best methods for observing the vertical distribution of greenhouse gases. The differential absorption Lidar (DIAL) method with its high range resolution is expected to bring several advantages over passive measurements, for example, daytime and nighttime coverage and negligible influences of aerosol and cirrus layers [9,10,11]. DIAL operates at two wavelengths, one on resonance and one off resonance of the molecular absorption of the gas of interest. Because the on resonance wavelength is more strongly absorbed by the gas, measurement of the ratio of the backscatter at the two wavelengths as a function of range can be used to calculate the gas concentration profile. Many CO2 absorption bands exist between 0.7 and 10 µm wavelengths, and each band contains many absorption lines. Two bands, particularly 1.6 and 2.0 μm, are suitable for DIAL measurements and the 1.6 μm band is the very interesting. It avoids contamination from other atmospheric constituents such as water vapor. Furthermore, the peak absorption intensity of the 1.6 μm absorption spectrum is suitable for DIAL measurements of vertical profiles in the troposphere. Some studies have suggested using the 2.0 μm band where an absorption peak line, they are limited to measure the distribution or the column amount in the range of several hundred meters due to strong absorption [12,13,14,15]. Moreover, although some studies have suggested using the 2.0 μm band where an off-center absorption line is usually possible to have an adaptive absorption for measurements in the troposphere [16,17], a 1.6 μm system benefits from a relatively lower magnitude of the absorption cross section at the center absorption line. Using 1.6 μm DIAL systems, the system error due to the fluctuation of the laser frequency is small, because tuning the laser wavelength to the center absorption line is easier than tuning to the off-center absorption line.
We have developed a 1.6 μm optical parametric generator (OPG)/optical parametric amplifier (OPA) transmitter and used it in a direct-detection DIAL system to measure CO2 mixing ratio profiles [18]. The 1.6 μm OPG/OPA transmitter system for the CO2 DIAL system is pumped by an iodine-based Q-switched Nd:YAG laser with a 500 Hz repetition rate. The optical receiver includes a near-infrared photomultiplier tube (PMT) with high quantum efficiency operating in the photon counting mode and a narrowband interference filter with a 1.0 nm full width at half maximum (FWHM) for daytime measurements. We conducted a field experiment at the Hino campus of Tokyo Metropolitan University to compare CO2 DIAL measurements with surface in situ sensor measurements to validate the DIAL measurements. An open-path CO2 gas analyzer (LICOR. Inc., LI-7500, Lincoln, NE, USA) is installed at the top of building at a height of 42 m. The CO2 DIAL is installed on the first floor of another building 110 m away from that building. The laser beam is irradiated directly over the gas analyzer. Data from the CO2 DIAL are acquired with a range resolution of 60 m and an integration time of five minutes. Data on the CO2 mixing ratio of the gas analyzer are acquired every one second. We found the difference between the CO2 mixing ratio measurements to be 0.06 ppm at 10 min average intervals [18]. As a next step, we conducted a field experiment to compare CO2 DIAL measurements with in situ sensor measurements on an aircraft to validate the vertical DIAL measurements. In this paper, we report a comparison of measurements of vertical distributions of CO2 mixing ratio by DIAL and the aircraft sensor.

2. Experimental Setup
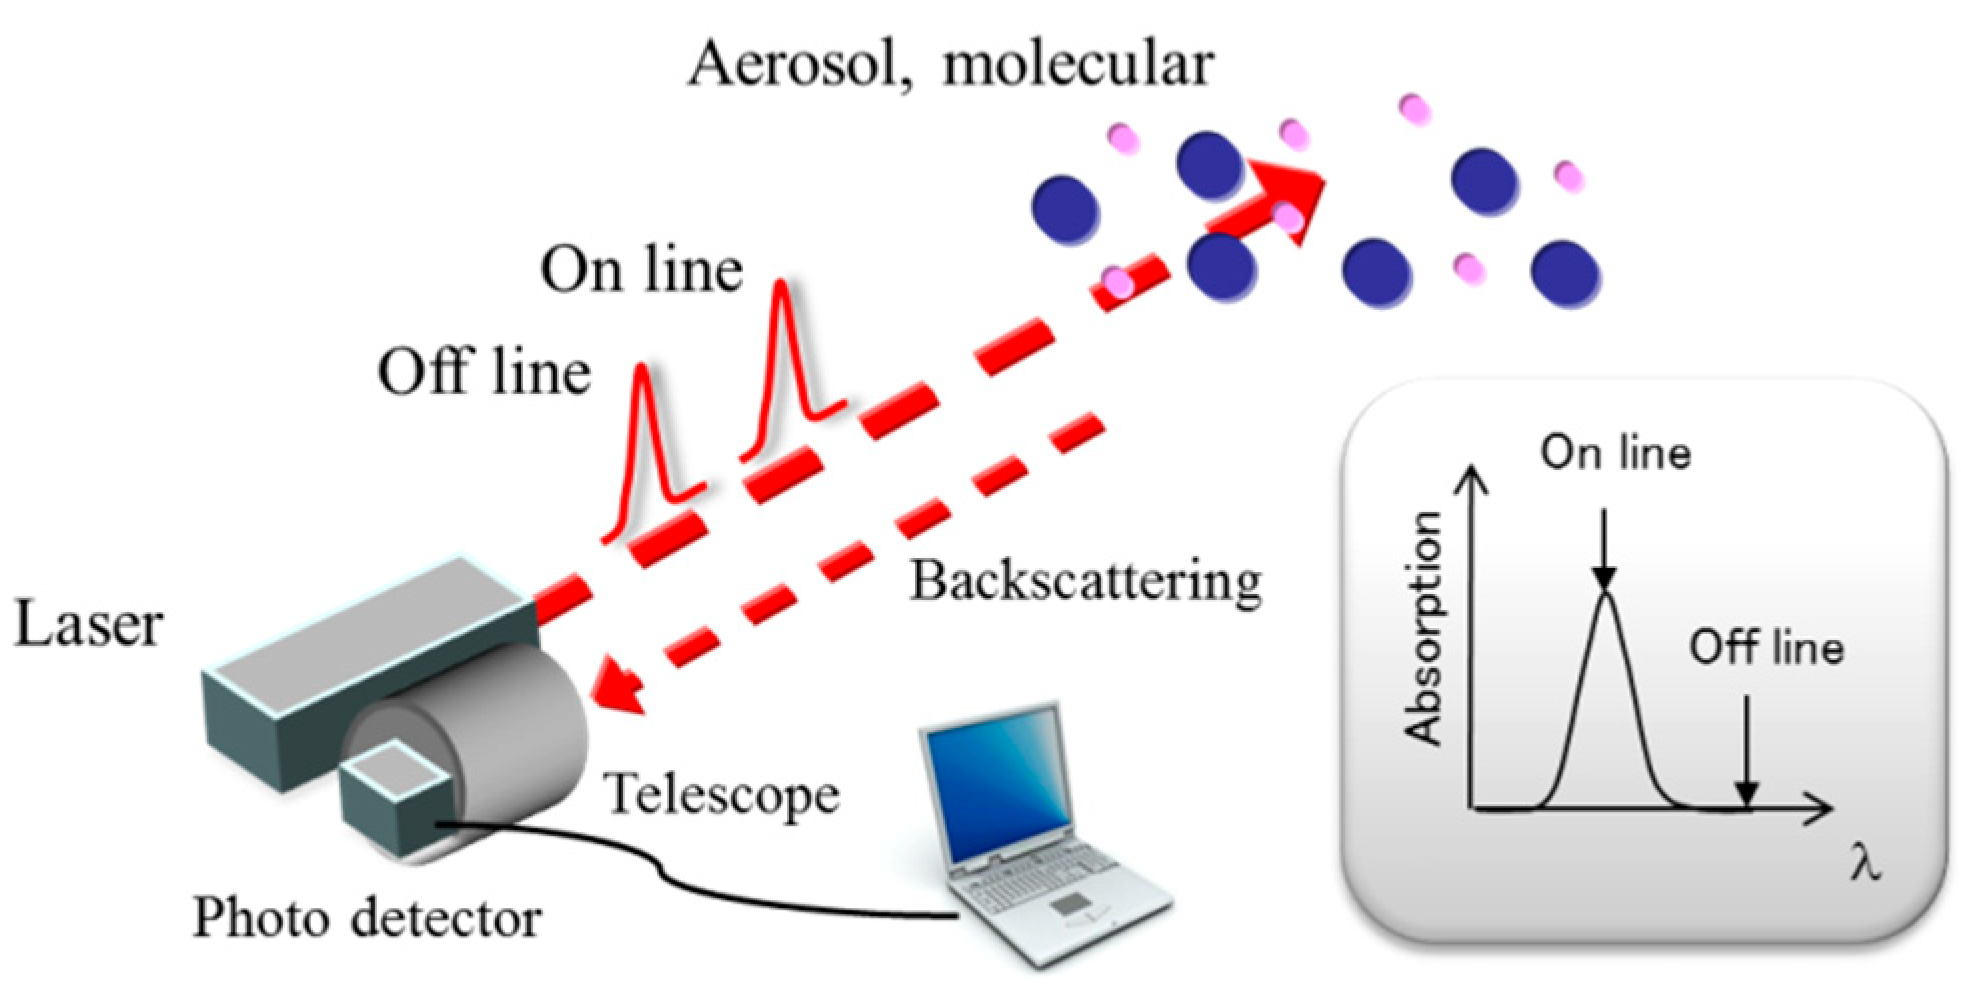
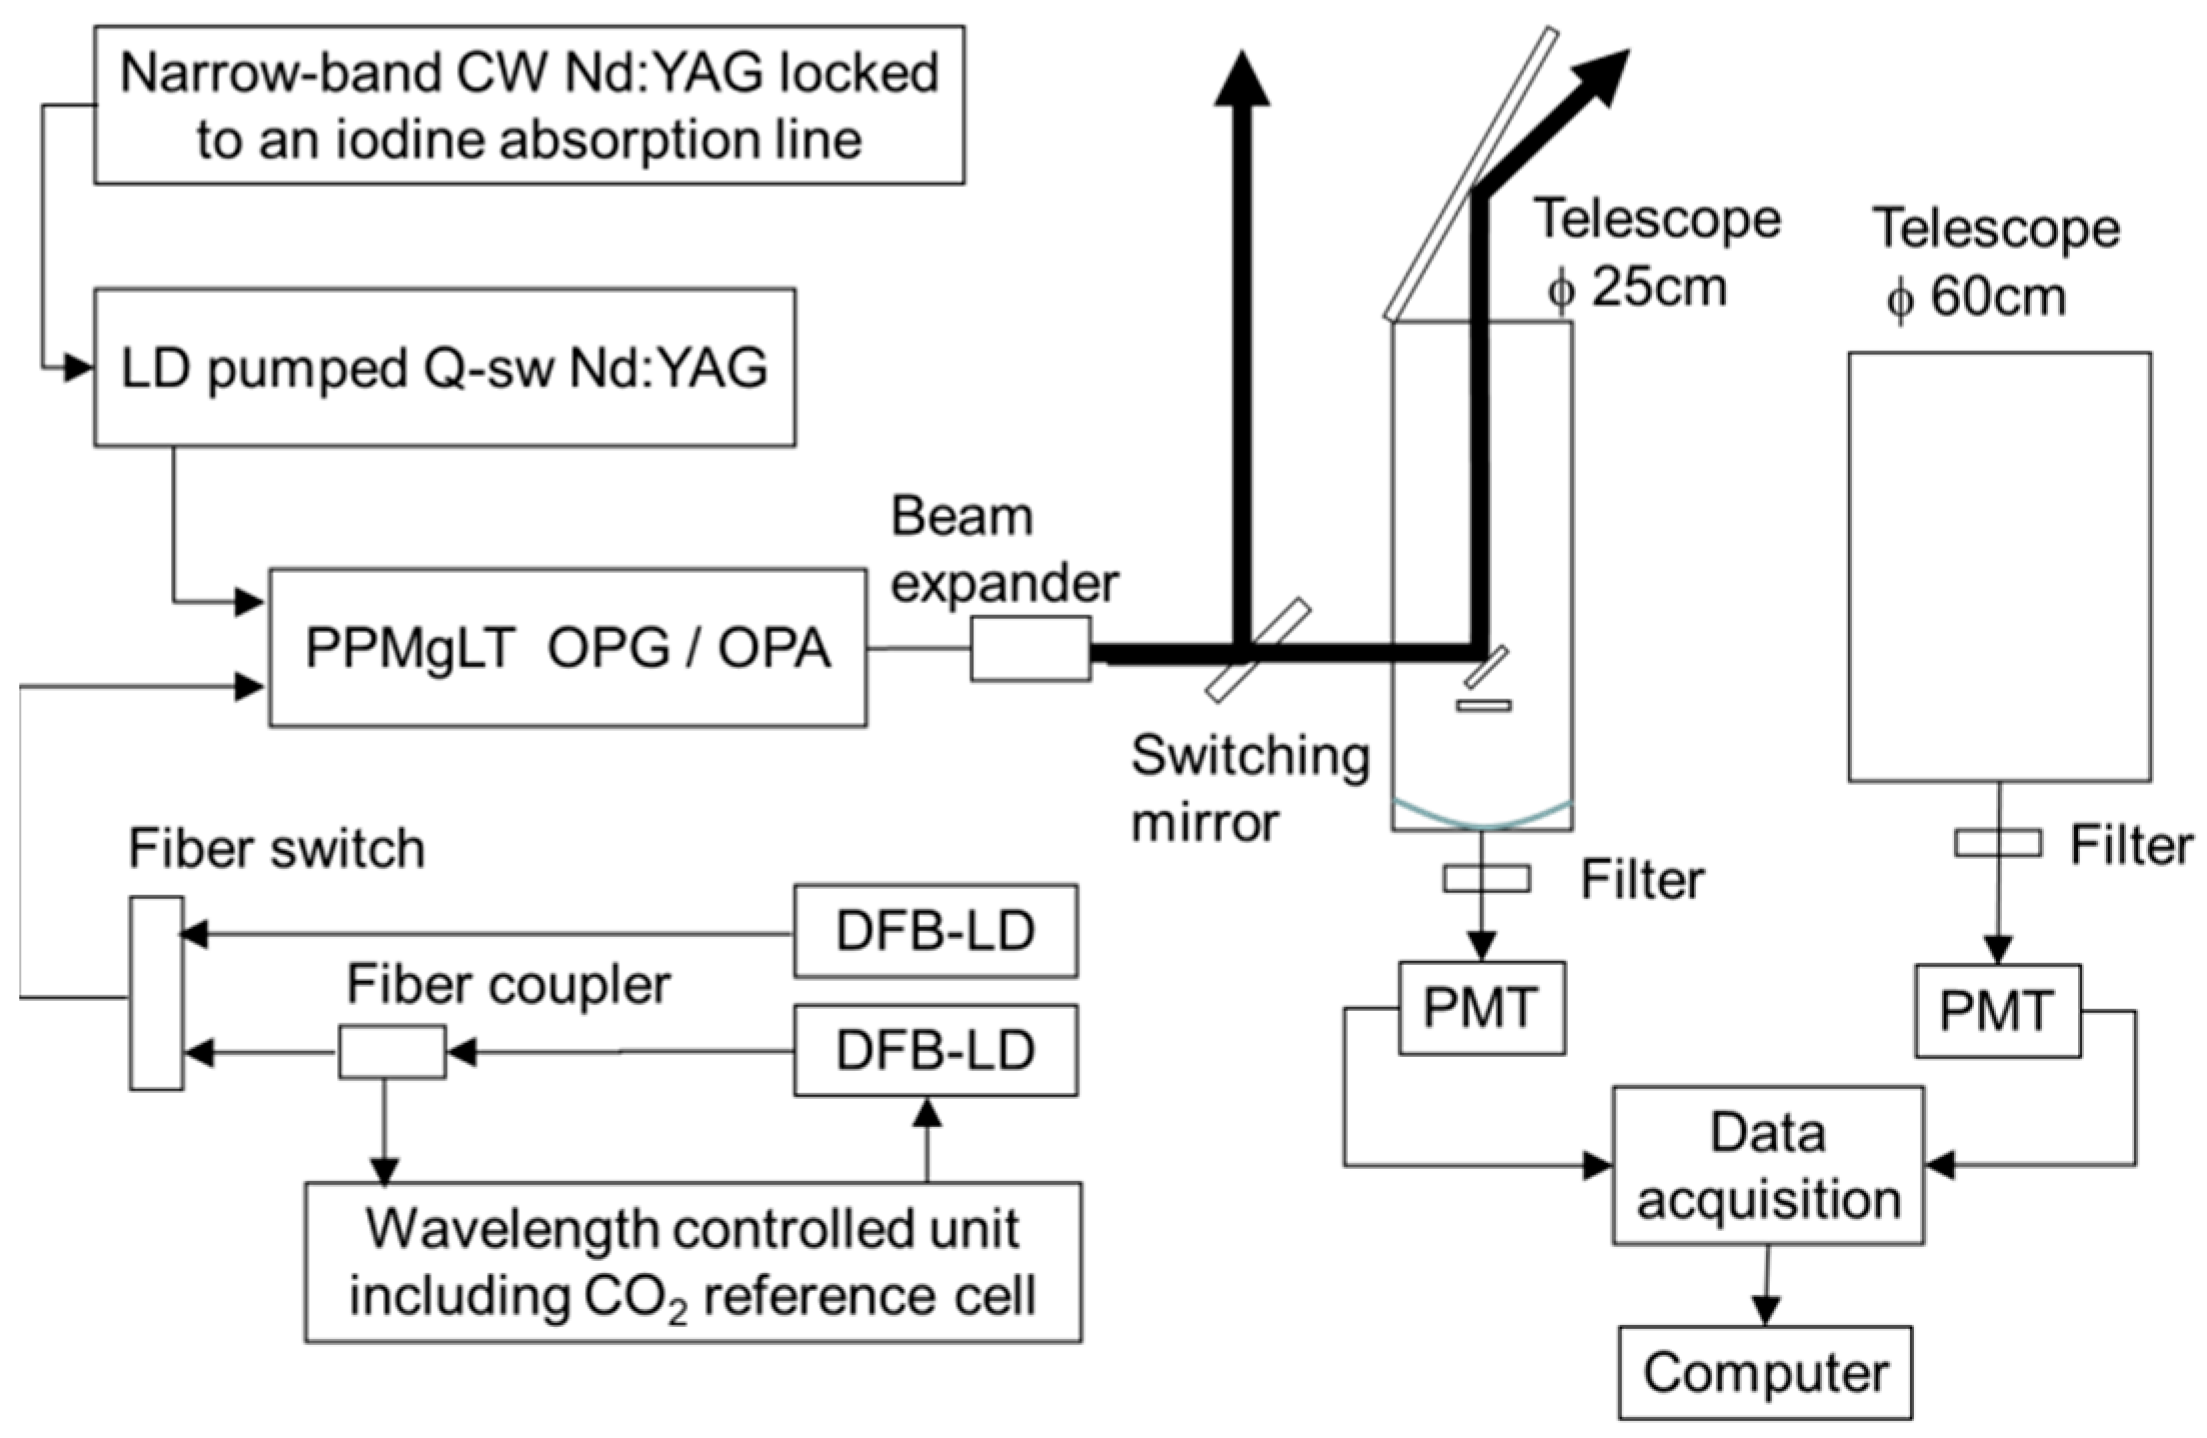
2.1. CO2 DIAL

Figure 1 shows a schematic illustration of the DIAL system. The DIAL technique uses the absorption properties of a target gas to deduce its atmospheric concentration. Laser beams at two different wavelengths are sent into the atmosphere. The wavelengths are chosen such that one of them is absorbed more (on-line wavelength, λon) than the other (off-line wavelength, λoff). The difference in the absorption along the beam path causes the returned Lidar signals to yield different range dependence. The average gas density n [/m3] between ranges R1 and R2 is given by the DIAL equation [19].
n = 1 2 Δ σ | R 1 R 2 | ln [ S o n ( R 1 ) S o f f ( R 2 ) S o n ( R 2 ) S o f f ( R 1 ) ]
where Son and Soff are the Lidar signals at λon and λoff, respectively, and Δσ is the differential absorption cross-section between λon and λoff. The mixing ratio is the ratio of the air density and the gas density 𝑛. Because atmospheric temperature and pressure are related by the ideal gas law, the mixing ratio is also related by the atmospheric temperature and pressure. The random error in the measurement of a signal S is calculated from Poisson statistics as √S. The relative error in n for a DIAL measurement in the photon counting mode is given by
Δ n n = 1 2 n Δ σ | R 1 R 2 | i = 1 2 j = 1 2 S i j + B S i j 2 ,
where i = 1, 2 denote ranges R1 and R2, respectively, and j = 1, 2 denote the on-line and off-line signals, respectively. B is the background noise.
Figure 2 shows a block diagram of the 1.6 μm CO2 DIAL system for comparison of measurements of vertical profiles of CO2 dry mole fractions by DIAL and the aircraft sensor. The system parameters are summarized in Table 1. To stabilize the oscillation wavelength of the OPG, an iodine locked seed laser was used for the pulsed Nd:YAG laser. The OPG output with an injection seeder was amplified by the OPA. The partial power of the on-line injection seeder (distributed feedback laser) was split off and directed through a wavelength-controlled unit. The on-line wavelength (1572.992 nm) laser was tuned to the absorption line center and stabilized by a feedback control unit using a CO2 absorption cell. The off-line wavelength (1573.137 nm) laser was operated in the free-run mode. Both the on-line and off-line distributed feedback (DFB) lasers were connected to an optical fiber switch and the switching speed was 250 Hz. The wavelength stability is measured by a wavemeter (HighFiness WS7/IR, Tübingen, Germany) within a 10 MHz frequency resolution for 2 h. It is estimated that the expected fluctuation in the wavelength is suppressed by less than 10 MHz. The DIAL measurement errors associated with a laser frequency uncertainty of <10 MHz are calculated to be 0.1%. The injection-seeded OPG generates a strong narrow signal and a broad side lobe with a 1.4 nm spectral width. The line width of the strong signal is less than 280 MHz. This side lobe results from a non-collinear phase-matched process, which experiences a significant overlap with the large pump beam. The measurement error by using the absorption cross section when compensating for the broad side lobe can be calibrated [18].
The dynamic range limitation of the receiving system made it difficult to measure from near the ground to an altitude of 5 km. Therefore, the two receiving systems were prepared: a “low-altitude” mode to target an altitude lower than 2.5 km and a “high-altitude” mode to target an altitude higher than 2.5 km. The atmospheric backscatters were collected by a 250 mm Schmidt–Cassegrain telescope with a field-of-view (FOV) of 1 mrad for the low-altitude mode and a 600 mm Schmidt–Cassegrain telescope with a FOV of 1 mrad for the high-altitude mode. The pulsed laser output was transmitted vertically into the atmosphere by a switching mirror for both low-altitude and high-altitude measurements. The collected scattered light was sent to the near-infrared PMT module (Hamamatsu Photonics K.K. H10330A-75, Hamamatsu, Japan) operated in the photon-counting mode. This PMT is contained in a thermally insulated sealed-off housing evacuated to a high vacuum. The internal thermoelectric cooler eliminates the need for liquid nitrogen and cooling water. The quantum efficiencies of the low-altitude and high-altitude modes were 2% and 8%, respectively. Because the backscattering light was strong for the low-altitude measurement, we attached an appropriate neutral density (ND) filter. We performed the CO2 mixing ratio measurement for daytime by using the 1.6 μm DIAL with a 1.0-nm-FWHM narrowband interference filter and a PMT.

2.2. Aircraft

Beechcraft King Air 200T, operated by Diamond Air Service Inc.,Toyoyama, Japan is a twin-turboprop aircraft with a pressurized cabin. We installed an in situ sensor with a nondispersive infrared gas analyzer (NDIR; LICOR. Inc., LI-840, Lincoln, NE, USA) and a cavity ring-down spectrometer (CRDS; Picarro, G2301-m, Santa Clara, CA, USA) for CO2 and methane (CH4). CRDS measurements are rapid and highly sensitive for measuring CO2 and CH4 mixing ratio [20]. A pulsed beam from a single-frequency laser diode enters an optical cell with highly reflective mirrors (typically R > 99.9%). The light transmitted through the exit mirror is measured with respect to time. Under certain conditions, the resulting signal decays exponentially with time. The decay time depends on the reflectivity of the two mirrors, the distance between the two mirrors, the speed of light, and the molecular absorption coefficient of absorbing species in the cavity. CO2 and CH4 mixing ratio are derived from absorption at selected spectral lines every 2 seconds. The time delay caused by the distance between the inlet and the CRDS is corrected. The CRDS is calibrated with standard gas before the flight. CRDS measurements were performed under moderate dehumidification of air samples. In our study, simultaneous H2O measurements were performed to correct these mixing ratio to dry mole fractions by the CRDS. We corrected the CRDS data using the following equation shown by Nara et al. [21].
X dry = X wet 1 a [ H 2 O ] CRDS b [ H 2 O ] CRDS 2
where Xdry is CO2 or CH4 mixing ratio corrected by the water correction function, and Xwet is observation by the CRDS. [H2O]CRDS indicates water vapor concentration reported by the CRDS. Estimated linear a and quadratic b terms of CO2 are 0.01204 and 0.00025. Estimated linear a and quadratic b terms of CH4 are 0.00999 and 0.00014.
We also performed flask sampling at eight altitude levels to check accuracy of the in situ CO2 profile and to obtain mixing ratio of other trace gases such as CH4, CO, N2O, H2, and SF6 [22]. Typical durations of spiral descent flights were about 1 h between 33,000 ft (9900 m) and 1600 ft (480 m). Vertical profiles of pressure, temperature, relative humidity, wind direction, and wind speed were monitored by the aircraft’s instruments.

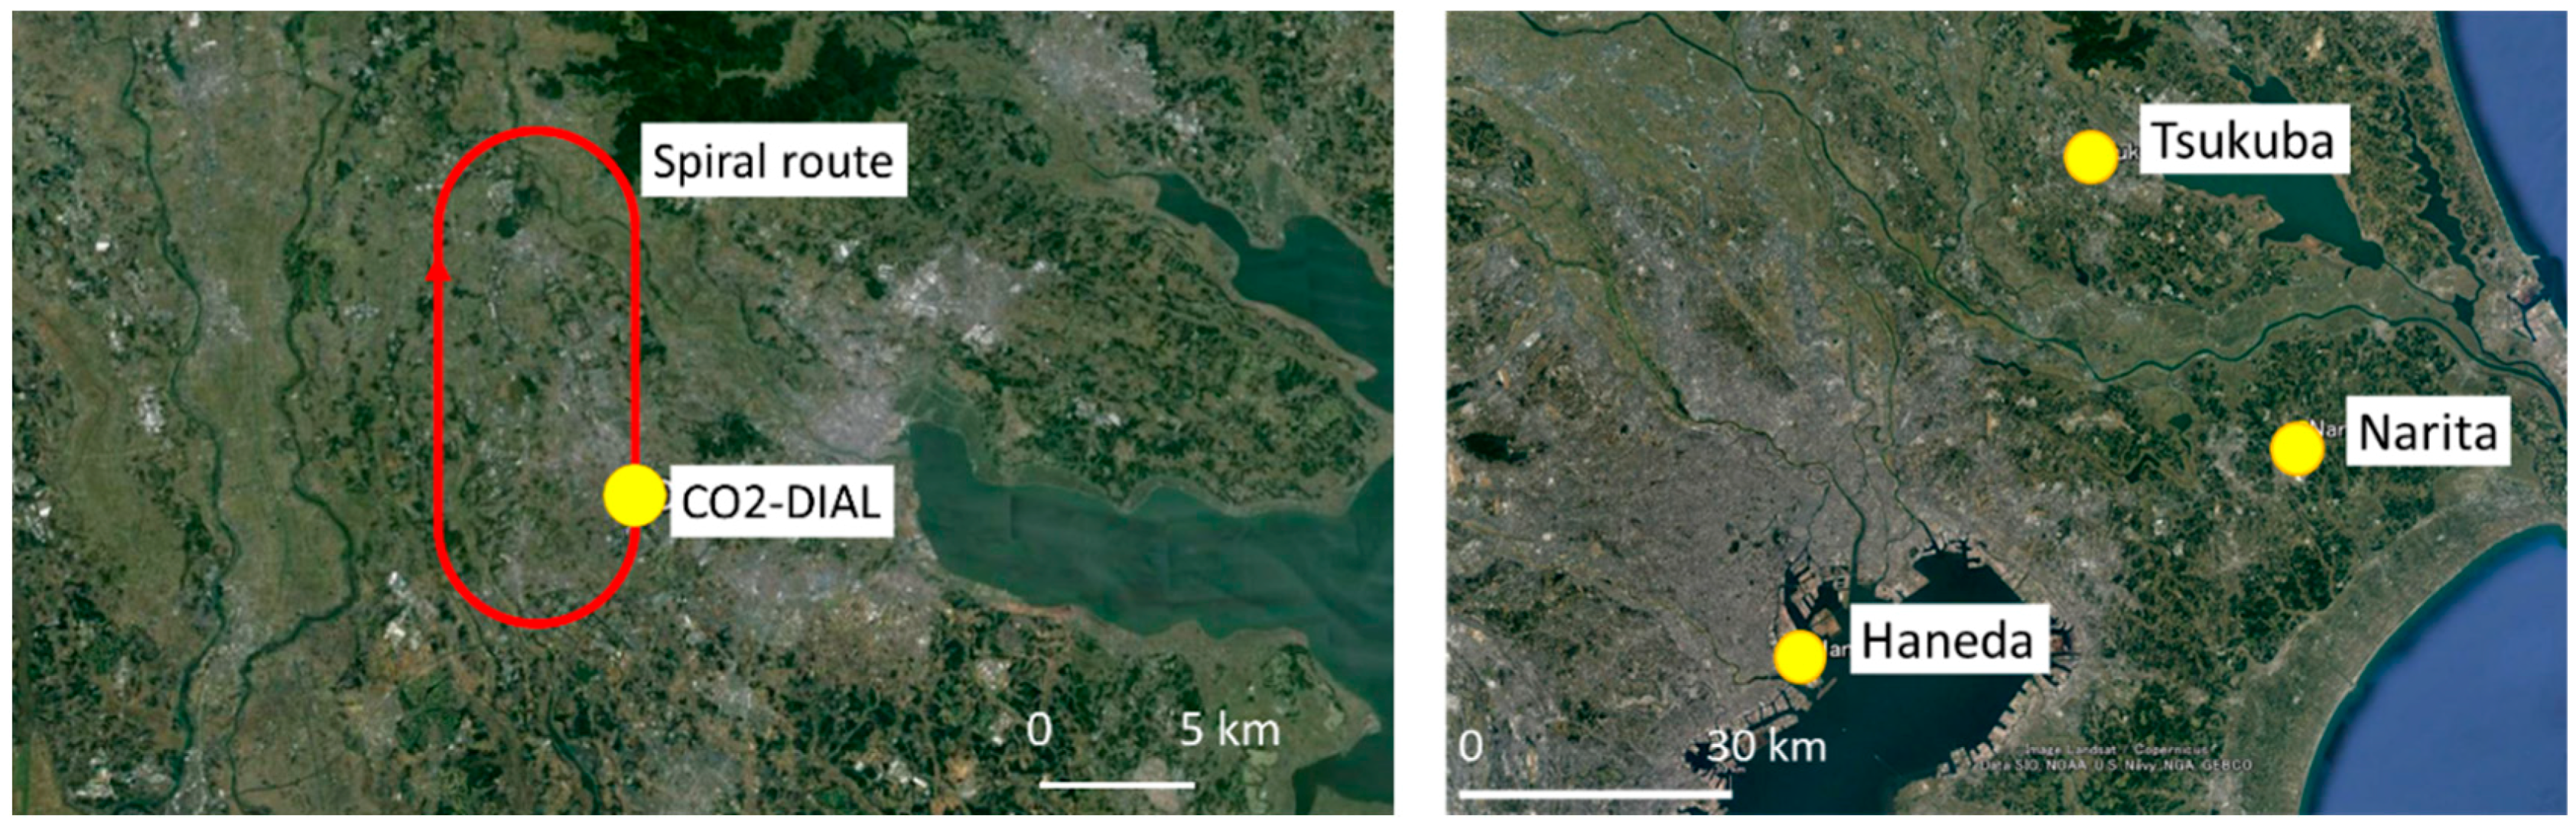
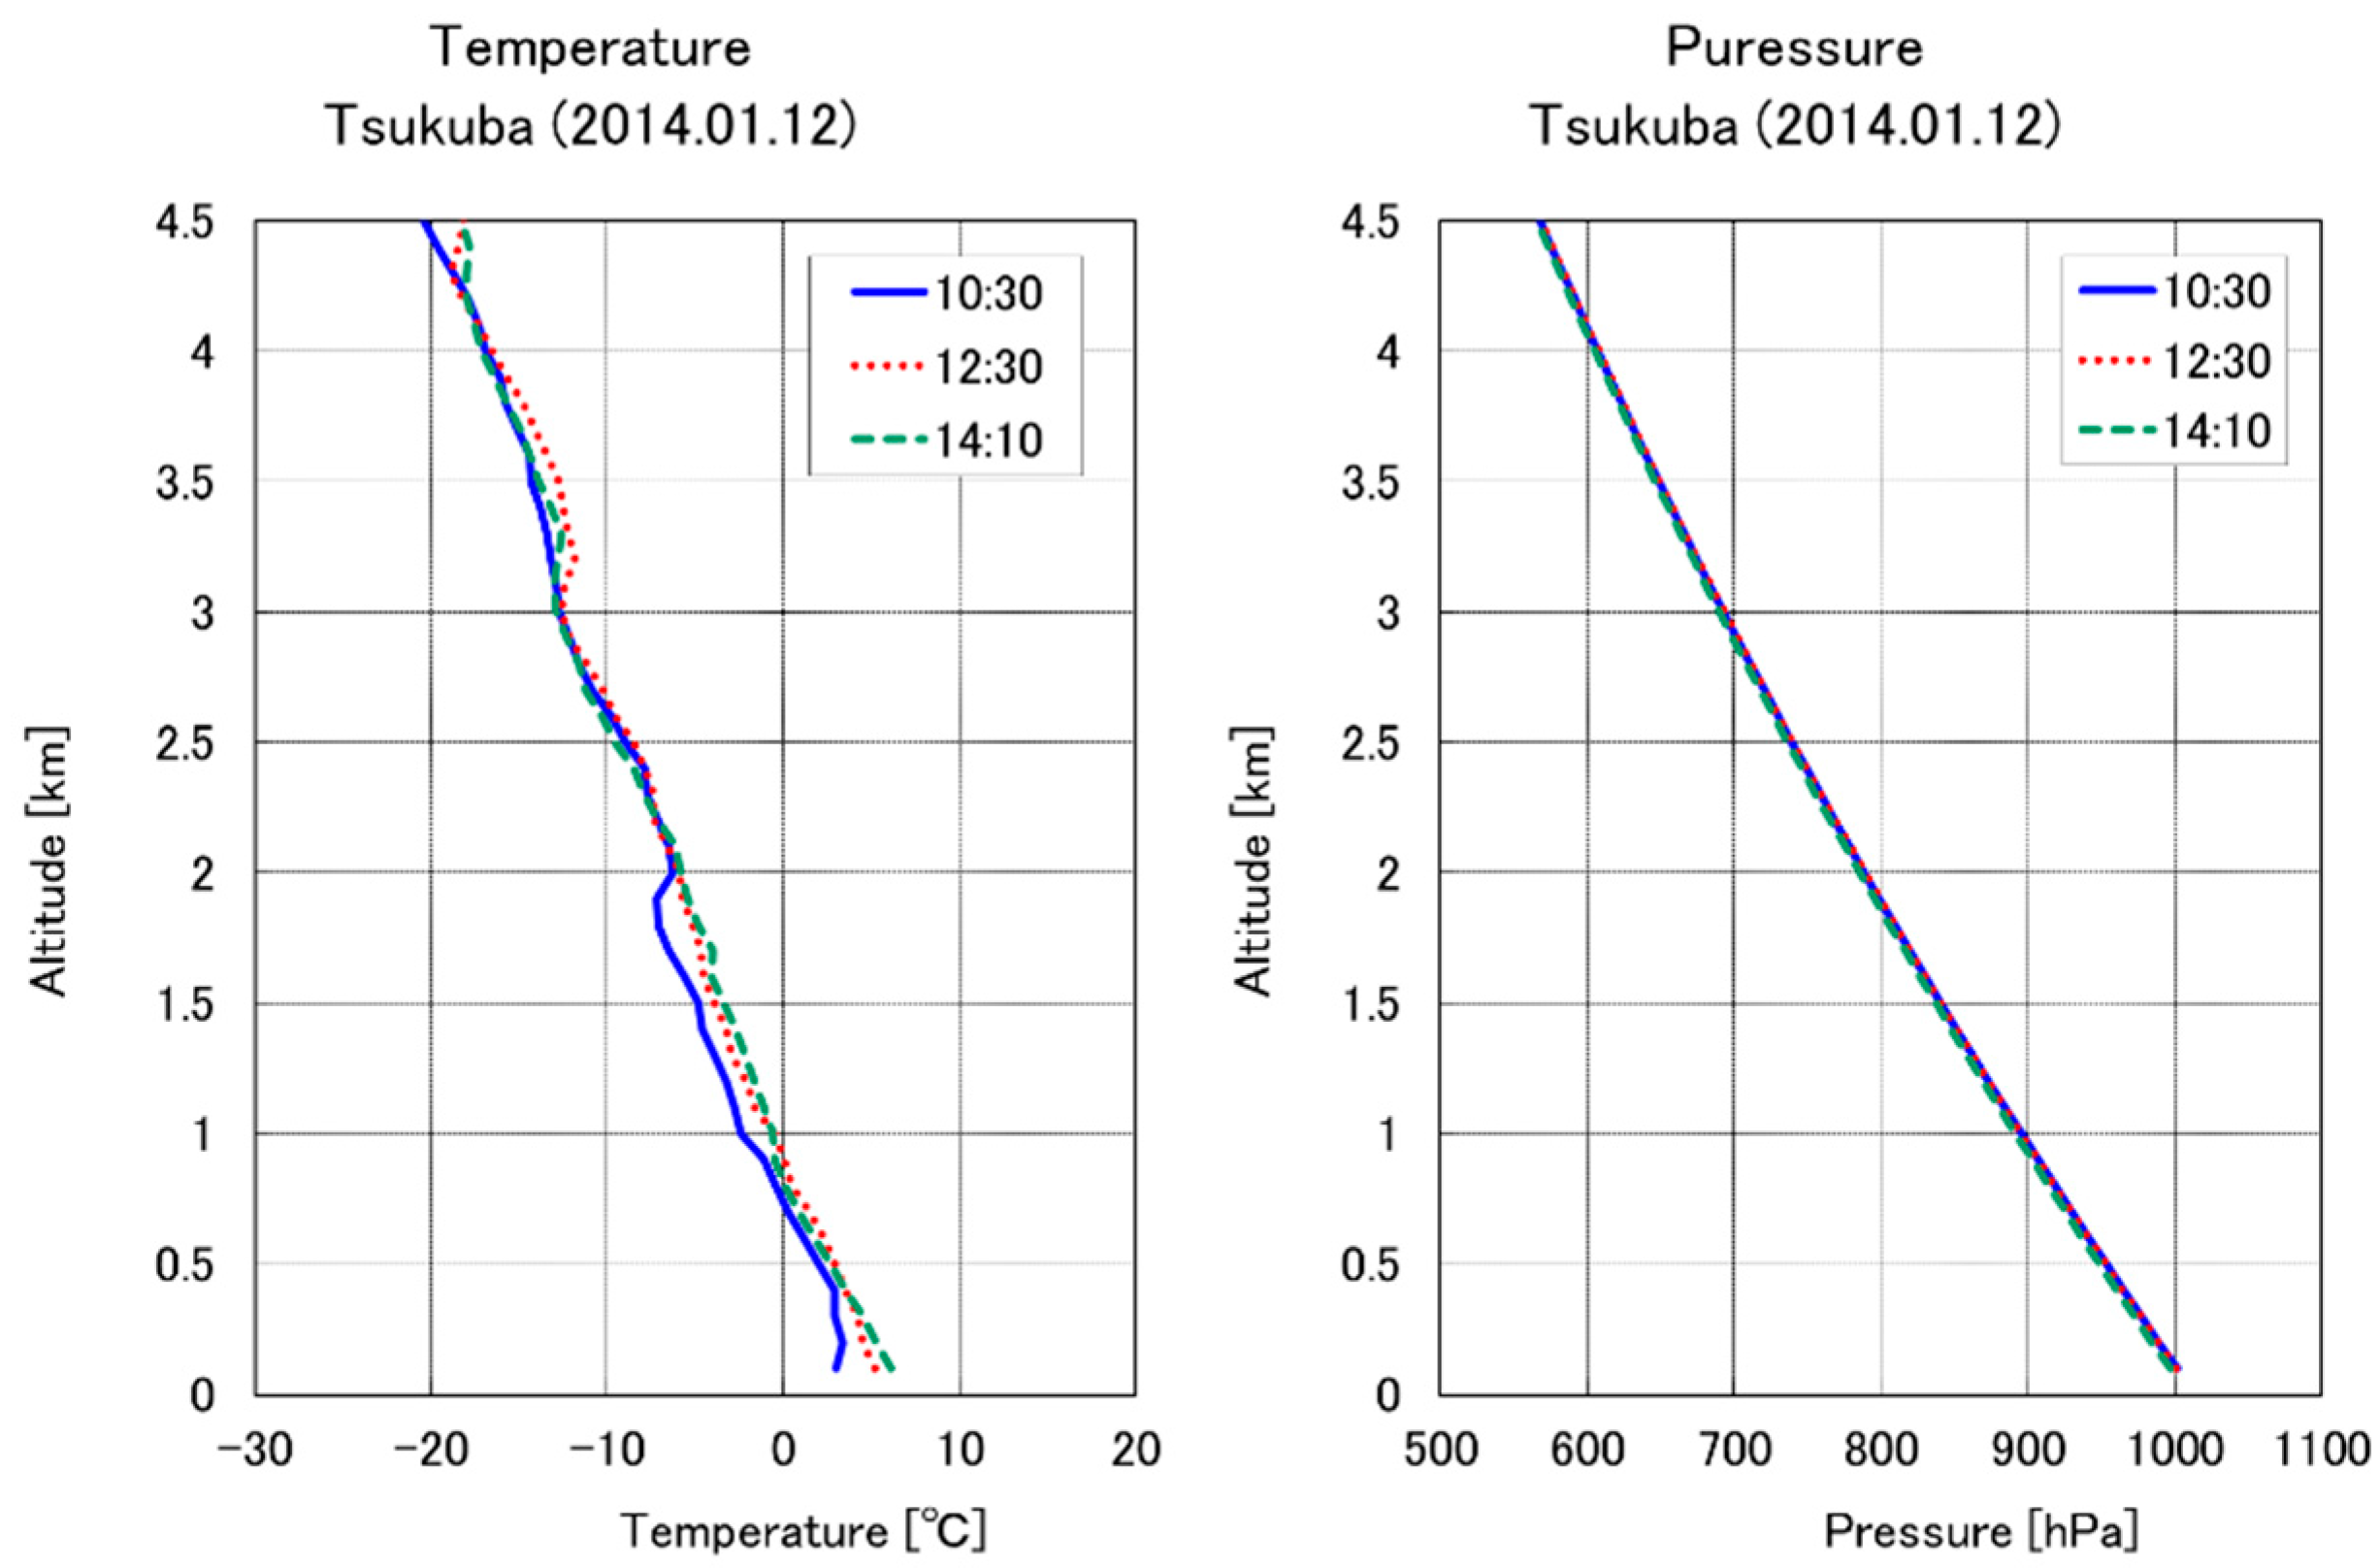
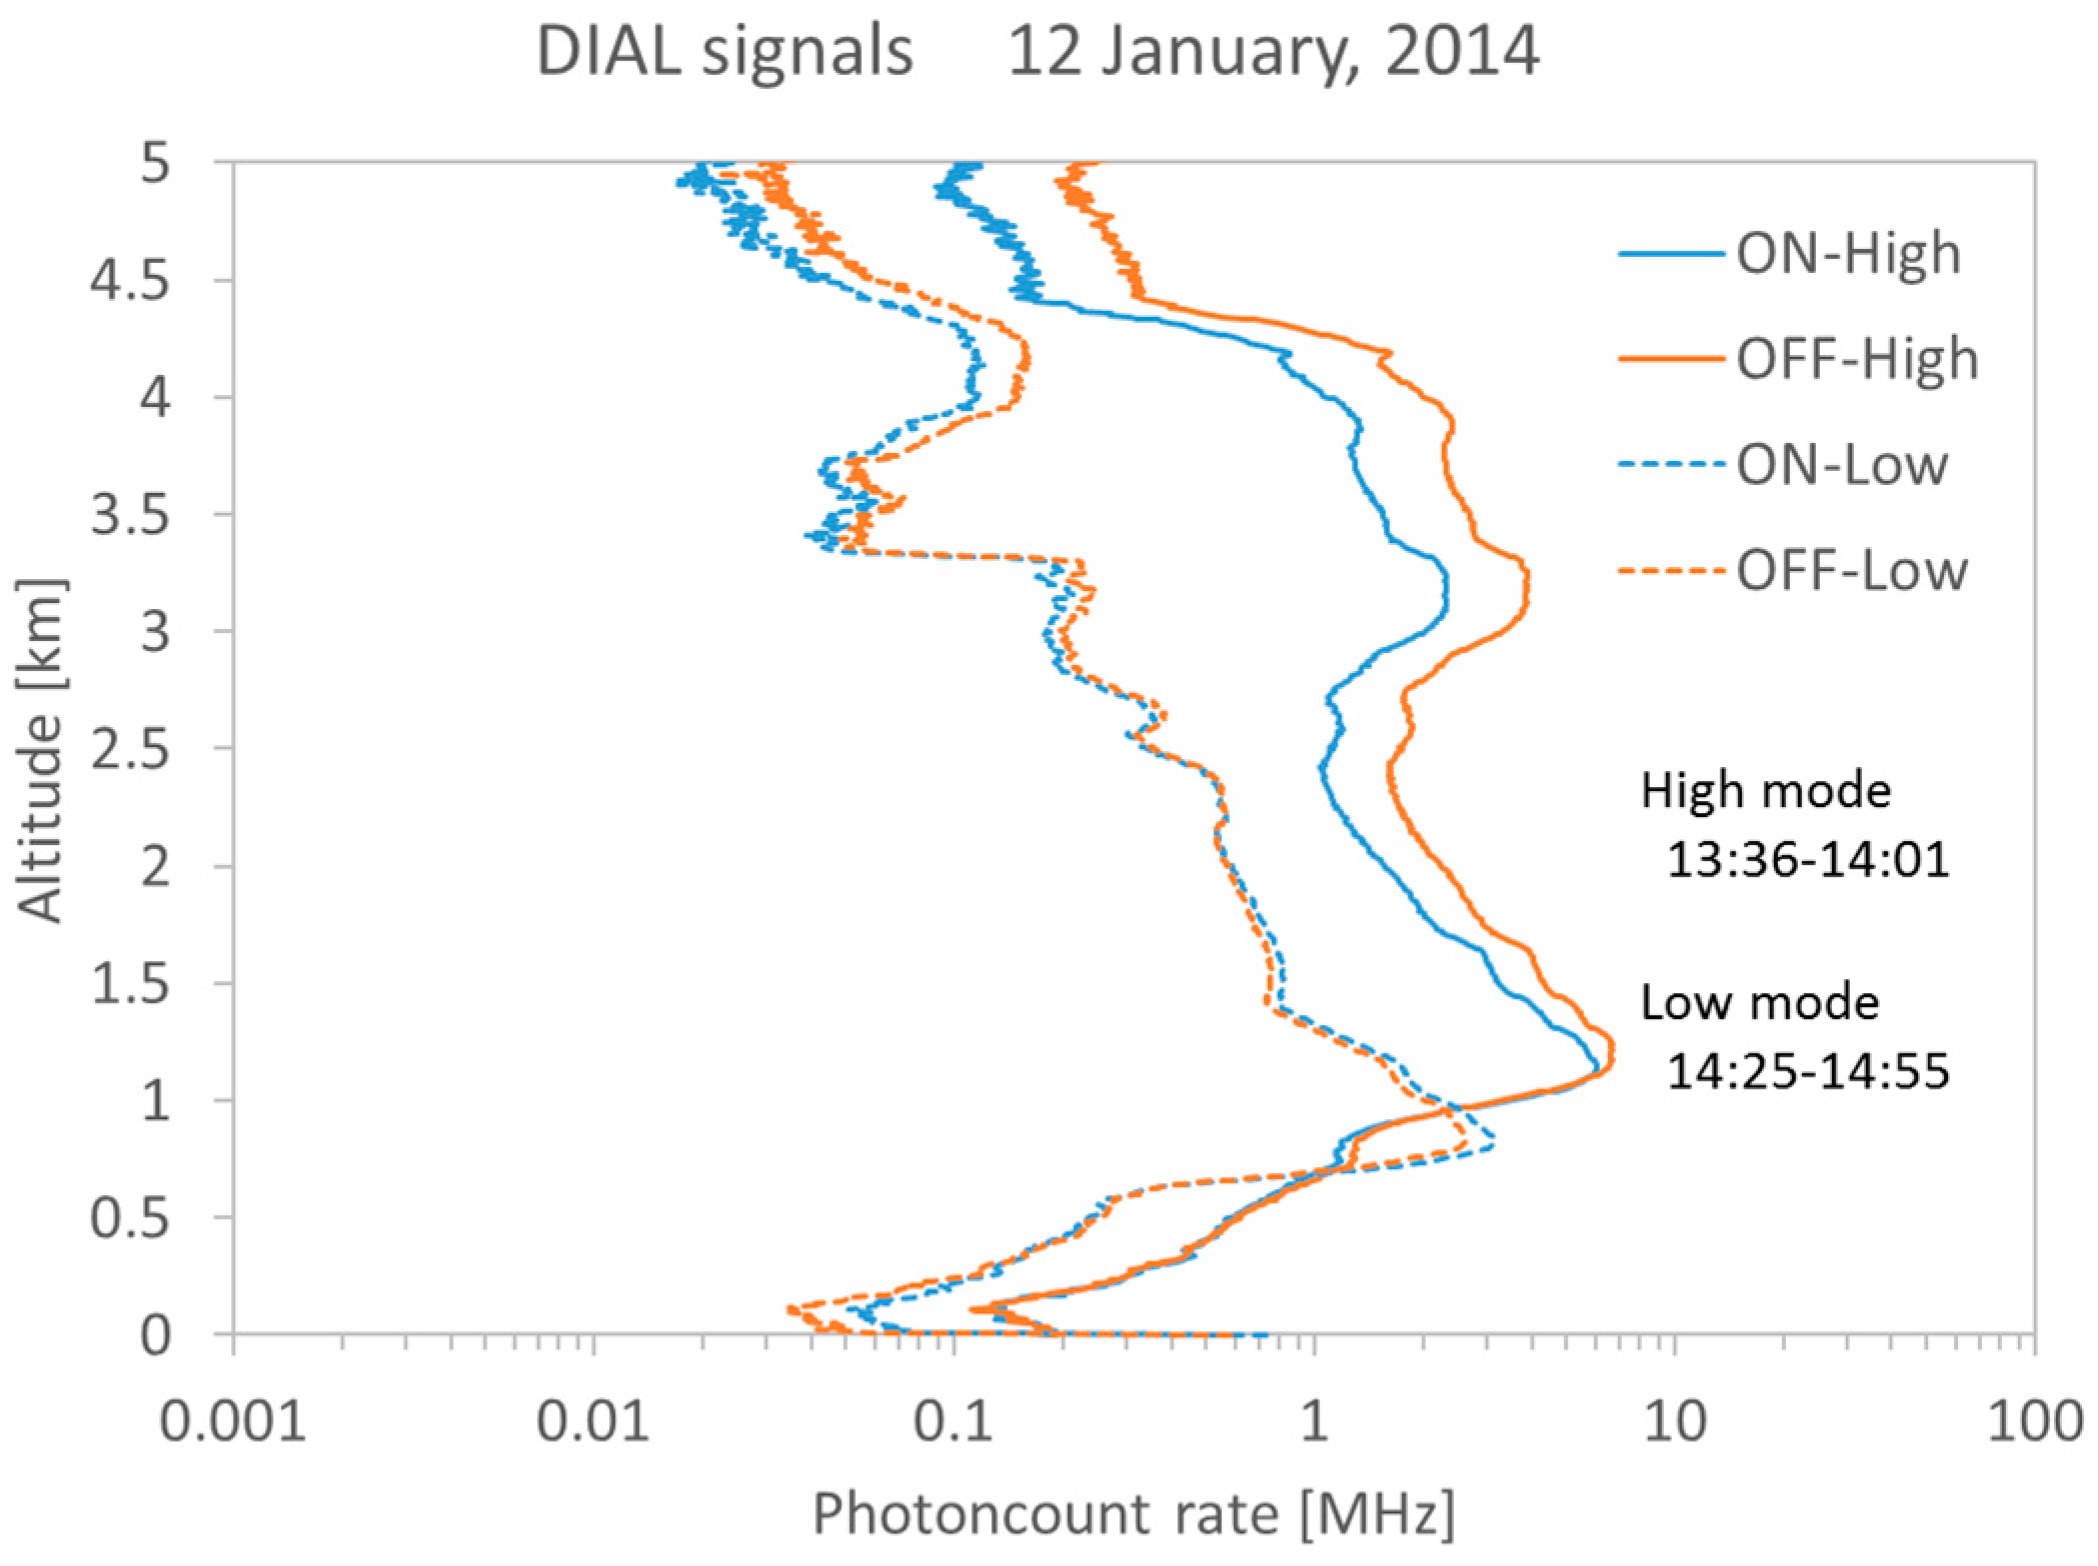
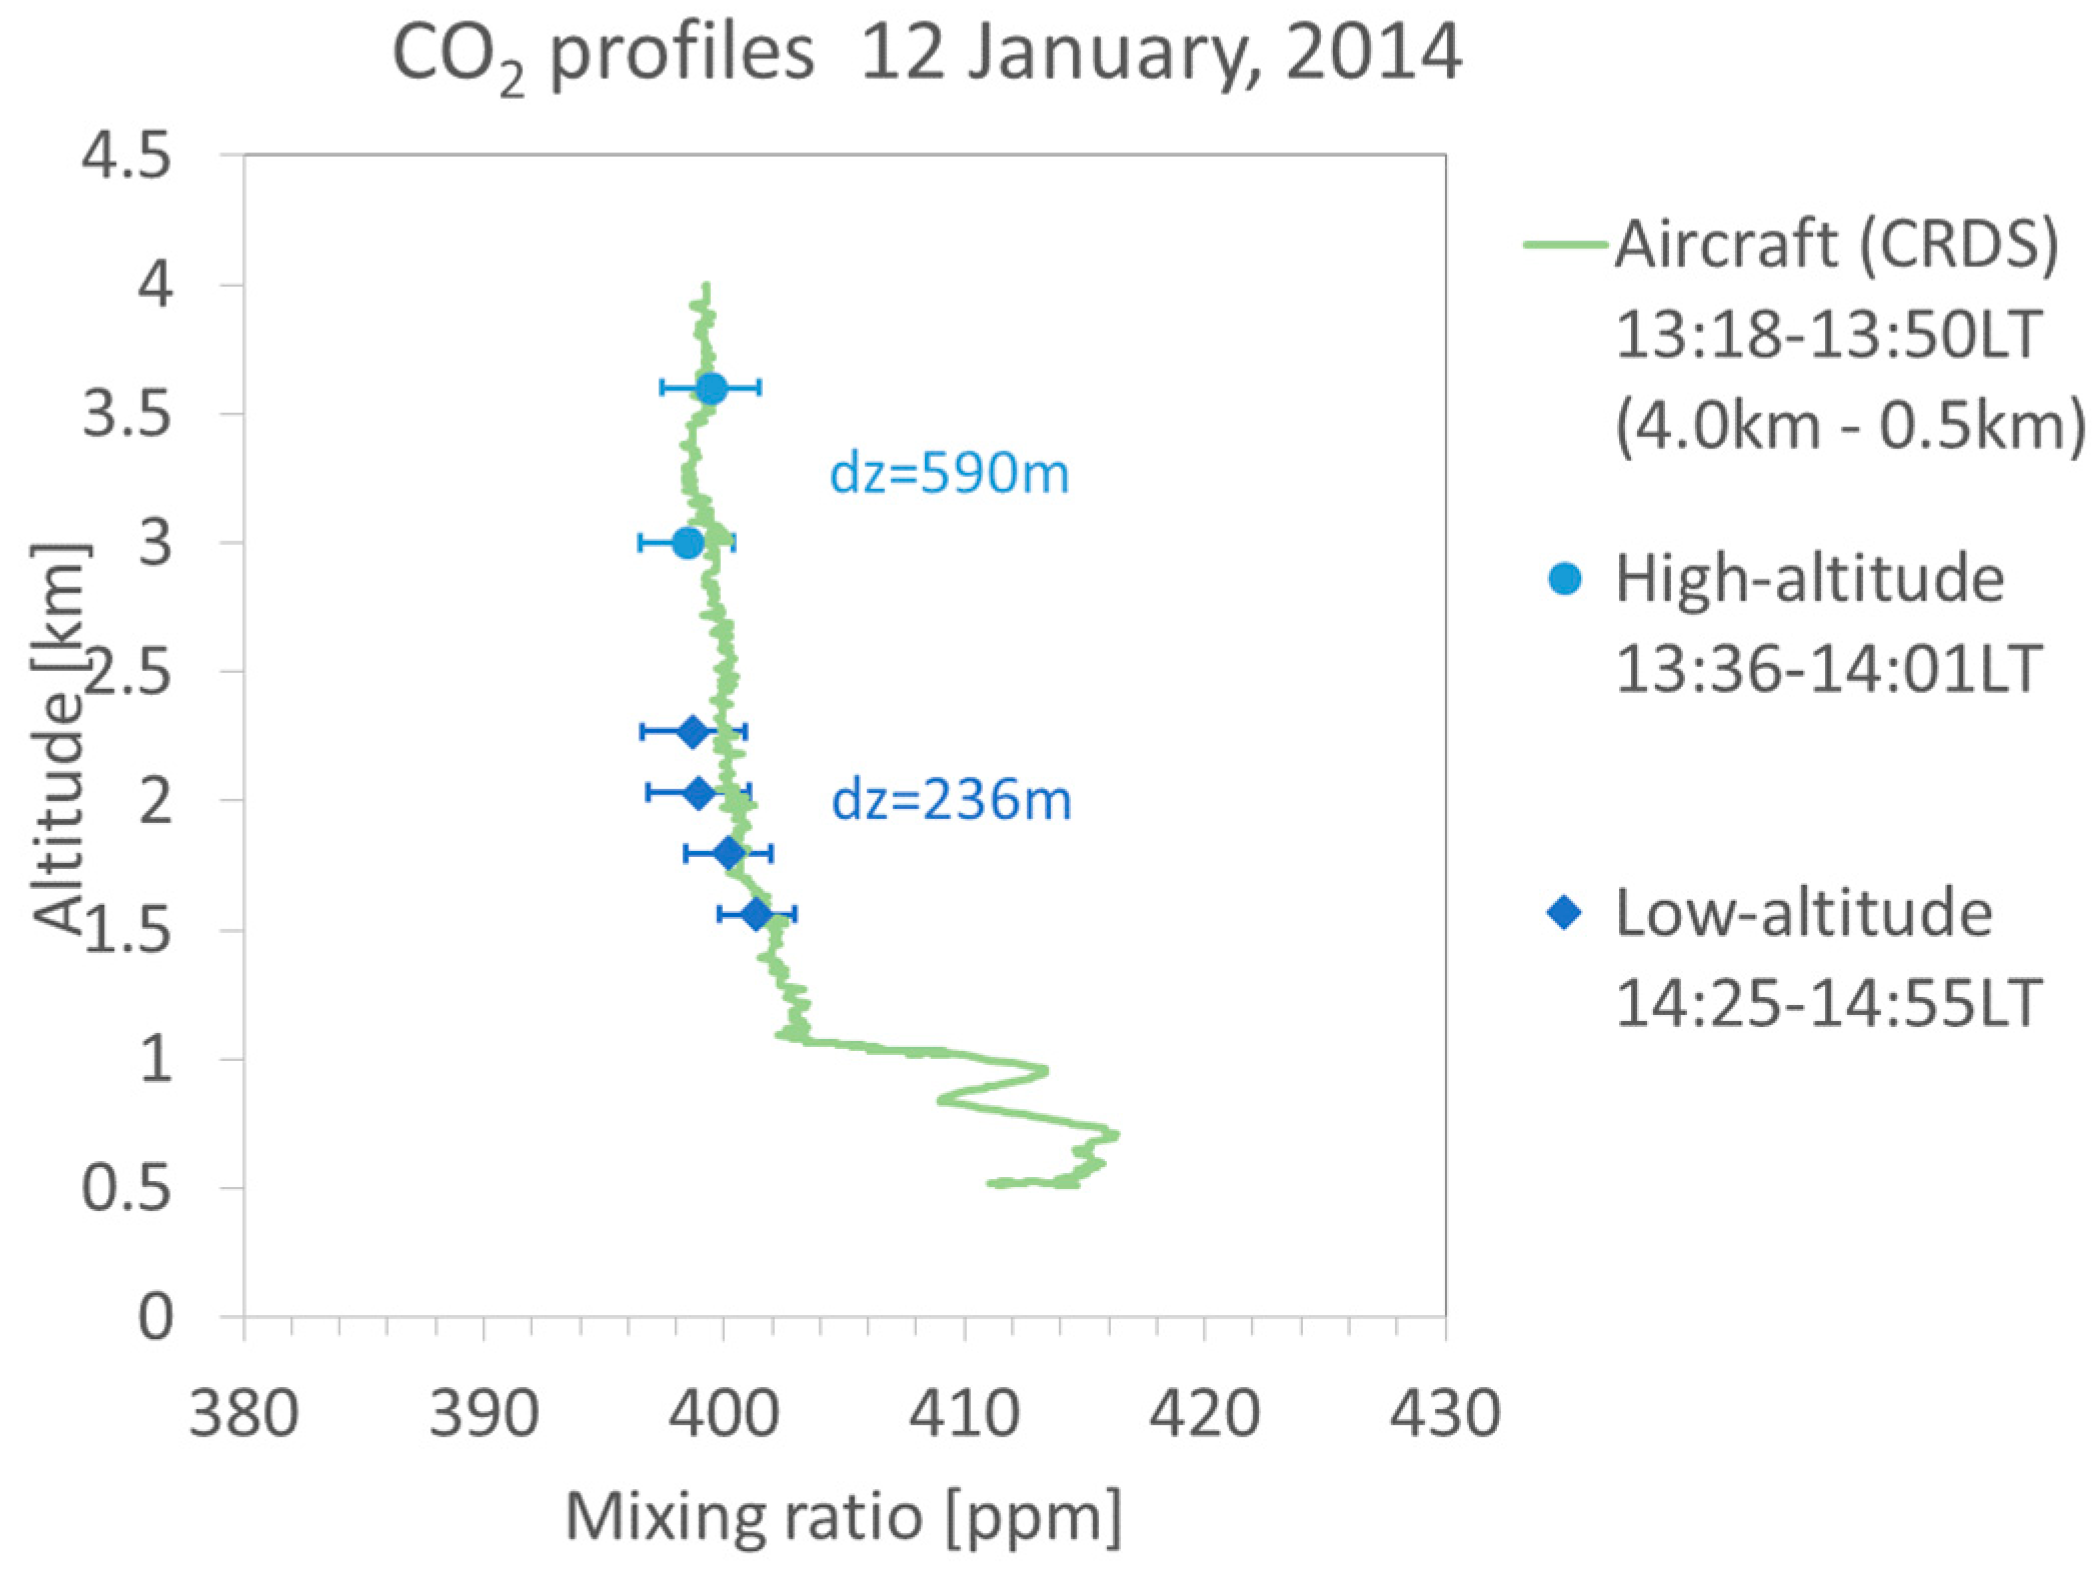
3. CO2 DIAL and Aircraft Campaign

In January 2014, two aircraft campaigns were made above the National Institute for Environmental Studies (NIES) in Tsukuba, Japan. Figure 3 shows the location of the observation site. Tsukuba is 50 km northeast of Tokyo and includes forests, agricultural lands, and urban areas. The aircraft took off from Sendai Airport, Miyagi, Japan. The CO2 DIAL system was installed in a mobile container for measurements of CO2 mixing ratio profile at the NIES campus. The size of the mobile container is 6096 L × 2438 W × 2621 H (mm), and it is towed by other cars. 200 VAC power supply for the Nd:YAG laser and 100 VAC are supplied externally. The room temperature of the container is controlled by the air conditioner. The OPG/OPA transmitter system is housed in a cover with air purifier and air conditioner to avoid dust. CO2 DIAL and aircraft campaign helds on 12 January 2014 at the NIES site. Because of the air traffic control restrictions for the controlled airspace of the Narita and Haneda international airports, the lowest flight altitude of the aircraft was 480 m over Tsukuba. Additional vertical profiles of pressure, temperature, relative humidity, wind direction, and wind speed were obtained by GPS sondes at NIES, Tsukuba, Japan. Figure 4 shows temperature and pressure profiles obtained by the GPS sondes for 12 January 2014. Temperature resolution is 0.1 °C and pressure resolution is 0.1 hPa. GPS sondes were launched at 10:30 LT, 12:30 LT, and 14:10 LT. Ground-based CO2 measurements were simultaneously performed using a NDIR at the Meteorological Research Institute, Tsukuba, Japan.
The CO2 DIAL system obtained the CO2 vertical mixing ratio profile for 1.5 to 3.5 km altitude from 13:36 to 14:55 LT on 12 January 2014. Figure 5 shows on-line and off-line return signals. The PMT signals are digitized by a LICEL transient recorder TR20-80 with 12 bit resolution, 20 MHz sampling rate equivalent to 7.5 m range resolution. Overlap altitudes are 0.8 km in the low-altitude mode and 1.1 km in the high-altitude mode. Rich aerosol backscattered signal is detected between 3 and 4 km altitude in the high-altitude mode, and is detected below 3.2 km altitude in the low-altitude mode. Figure 6 shows the comparison of DIAL data and aircraft (CRDS) data profiles (13:18 to 13:50 LT). The CRDS CO2 data were obtained from low altitude (0.5 km) to upper atmosphere (4.0 km). DIAL measurements were performed in the high-altitude mode from 13:36 to 14:01 LT and in the low-altitude mode from 14:25 to 14:55 LT. The optical density of the ND filter used in the low-altitude mode was 0.7. Vertical resolutions of the CO2 DIAL system were 236 m below 3 km and 590 m above 3 km. CO2 density obtained by DIAL measurement is calculated from Equation (1) and CO2 mixing ratio is obtained by air density calculated from temperature and pressure by a GPS sonde launched at 14:10 LT. The relative error of the DIAL data were calculated by Equation (2) and is shown as error bars in Figure 6. Table 2 shows the differences between CO2 mixing ratio derived from CO2 DIAL and aircraft measurements at various altitudes. The vertical resolution of CRDS measurements are adjusted to the CO2 DIAL measurements. In the low-altitude mode, the average relative error of the CO2 DIAL system was 1.91 ppm and the average difference between the values observed by the CO2 DIAL system and the aircraft sensor was −0.94 ± 1.91 ppm. In the high-altitude mode, the average relative error of the CO2 DIAL system was 1.98 ppm and the average difference between the values observed by the CO2 DIAL system and the aircraft sensor was −0.70 ± 1.98 ppm. The CO2 mixing ratio reported by aircraft observations were almost within the error bar of DIAL observations. The CO2 DIAL system is, therefore, capable of performing highly accurate vertical CO2 mixing ratio measurements.

4. Conclusions

We present the first evaluation of a campaign for measurement of CO2 mixing ratio vertical profiles with the CO2 DIAL system and a CRDS sensor onboard an aircraft over the site of NIES, Tsukuba, Japan, on 12 January 2014. CO2 DIAL data and aircraft CRDS data profiles were observed at 1.5 to 3.5 km altitude (13:36 to 14:55 LT) and 0.5–4.0 km altitude (13:18 to 13:50 LT). The CO2 mixing ratio profiles show excellent consistency within the error bars of the CO2 DIAL system, and the average difference between the CO2 DIAL and aircraft sensor measurements was −0.94 ± 1.91 ppm below 3 km and −0.70 ± 1.98 ppm above 3 km. These results demonstrate that the 1.6 μm direct-detection CO2 DIAL system can measure vertical CO2 mixing ratio profiles with high accuracy in the lower troposphere. Measurements of vertical CO2 profiles using the CO2 DIAL system can contribute to understanding forest CO2 flux without using towers and contribute to understanding CO2 flux from industrial and suburban areas.

Author Contributions

Conceptualization: Y.S., C.N., and M.A. Formal analysis: Y.S., M.A., and M.I. Project Administration: C.N. Supervision: O.U. Validation: Y.S., M.A., M.I., I.M., and O.U. Writing – original draft: Y.S.

Funding

This research was funded by the System Development Program for Advanced Measurement and Analysis of the Japan Science and Technology Agency. The aircraft campaign was supported in part by the GOSAT project.

Acknowledgments

This study was performed within the framework of the GOSAT Research Announcement. We are grateful to the NIES staff, especially Toshinobu Machida and Keiichi Katsumata, for the aircraft measurements.

Conflicts of Interest

The authors declare no conflict of interest.

References

  1. Stocker, T.F.; Qin, D.; Plattner, G.-K.; Tignor, M.; Allen, S.K.; Boschung, J.; Nauels, A.; Xia, Y.; Bex, V.; Midgley, P.M. IPCC, 2013: Climate Change 2013: The Physical Science Basis; Contribution of Working Group I to the Fifth Assessment Report of the Intergovernmental, Panel on Climate Change; Cambridge University Press: Cambridge, UK; New York, NY, USA, 2013; p. 1535. [Google Scholar] [CrossRef]
  2. Showstack, R. Carbon dioxide tops 400 ppm at Mauna Loa, Hawaii. Eos. Trans. Am. Geophys. Union 2013, 94, 192. [Google Scholar]
  3. Stephens, B.B.; Gurney, K.R.; Tans, P.P.; Sweeney, C.; Peters, W.; Bruhwiler, L.; Ciais, P.; Ramonet, M.; Bousquet, P.; Nakazawa, T.; et al. Weak Northern and Strong Tropical Land Carbon Uptake from Vertical Profiles of Atmospheric CO2. Science 2007, 316, 1732–1735. [Google Scholar] [CrossRef] [PubMed]
  4. Pales, J.C.; Keeling, C.D. The concentration of atmospheric carbon dioxide in Hawaii. J. Geophys. Res. 1965, 70, 6053–6076. [Google Scholar] [CrossRef]
  5. Inoue, H.Y.; Matsueda, H. Measurements of atmospheric CO2 from a meteorological tower in Tsukuba, Japan. Tellus B 2001, 53, 205–219. [Google Scholar] [CrossRef]
  6. Machida, T.; Matsueda, H.; Sawa, Y.; Nakagawa, Y.; Hirotani, K.; Kondo, N.; Goto, K.; Nakazawa, T.; Ishikawa, K.; Ogawa, T. Worldwide measurements of atmospheric CO2 and other trace gas species using commercial airlines. J. Atmos. Ocean. Technol. 2008, 25, 1744–1754. [Google Scholar] [CrossRef]
  7. Tanaka, T.; Miyamoto, Y.; Morino, I.; Machida, T.; Nagahama, T.; Sawa, Y.; Matsueda, H.; Wunch, D.; Kawakami, S.; Uchino, O. Aircraft measurements of carbon dioxide and methane for the calibration of ground-based high-resolution Fourier Transform Spectrometers and a comparison to GOSAT data measured over Tsukuba and Moshiri. Atmos. Meas. Tech. 2012, 5, 2003–2012. [Google Scholar] [CrossRef] [Green Version]
  8. Inoue, M.; Morino, I.; Uchino, O.; Miyamoto, Y.; Yoshida, Y.; Yokota, T.; Machida, T.; Sawa, Y.; Matsueda, H.; Sweeney, C.; et al. Validation of XCO2 derived from SWIR spectra of GOSAT TANSO-FTS with aircraft measurement data. Atmos. Chem. Phys. 2013, 13, 9771–9788. [Google Scholar] [CrossRef]
  9. Browell, E.V.; Wilkerson, T.D.; Mcilrath, T.J. Water vapor differential absorption Lidar development and evaluation. Appl. Opt. 1979, 18, 3474–3483. [Google Scholar] [CrossRef] [PubMed]
  10. Steinbrecht, W.; Rothe, K.W.; Walther, H. Lidar setup for daytime and nighttime probing of stratospheric ozone and measurements in polar and equatorial regions. Appl. Opt. 1989, 28, 3616–3624. [Google Scholar] [CrossRef] [PubMed]
  11. Repasky, K.S.; Moen, D.; Spuler, S.; Nehrir, A.R.; Carlsten, J.L. Progress towards an autonomous field deployable diode-laser-based differential absorption Lidar (DIAL) for profiling water vapor in the lower troposphere. Remote Sens. 2013, 5, 6241–6259. [Google Scholar] [CrossRef]
  12. Koch, G.J.; Barnes, B.W.; Petros, M.; Beyon, J.Y.; Amzajerdian, F.; Yu, J.; Davis, R.E.; Ismail, S.; Vay, S.; Kavaya, M.J.; et al. Coherent differential absorption Lidar measurements of CO2. Appl. Opt. 2004, 43, 5092–5099. [Google Scholar] [CrossRef] [PubMed]
  13. Fiorani, L.; Santoro, S.; Parracino, S.; Nuvoli, M.; Minopoli, C.; Aiuppa, A. Volcanic CO2 detection with a DFM/OPA-based Lidar. Opt. Lett. 2015, 40, 1034–1036. [Google Scholar] [CrossRef] [PubMed]
  14. Queiβer, M.; Granieri, D.; Burton, B. A new frontier in CO2 flux measurements using a highly portable DIAL laser system. Sci. Rep. 2016, 6, 33834. [Google Scholar] [CrossRef] [PubMed]
  15. Cadiou, E.; Dherbecourt, J.B.; Gorju, G.; Melkonian, J.M.; Godard, A.; Pelon, J.; Raybaut, M. Atmospheric CO2 measurements with a 2-μm DIAL instrument. EPJ Web Conf. 2018, 176, 05045. [Google Scholar] [CrossRef]
  16. Refaat, T.F.; Singh, U.N.; Petros, M.; Remus, R.; Yu, J. Self-calibration and laser energy monitor validations for a double-pulsed 2-μm CO2 integrated path differential absorption Lidar application. Appl. Opt. 2015, 54, 7240–7251. [Google Scholar] [CrossRef] [PubMed]
  17. Gibert, F.; Edouart, D.; Cénac, C.; Le Mounier, F.; Dumas, A. 2-μm Ho emitter-based coherent DIAL for CO2 profiling in the atmosphere. Opt. Lett. 2015, 40, 3093–3096. [Google Scholar] [CrossRef] [PubMed]
  18. Shibata, Y.; Nagasawa, C.; Abo, M. Development of 1.6 μm DIAL using OPG/OPA transmitter for measuring atmospheric CO2 concentration profiles. Appl. Opt. 2017, 56, 1194–1201. [Google Scholar] [CrossRef] [PubMed]
  19. Ismail, S.; Browell, E.V. Airborne and spaceborne Lidar measurementfs of water vapor profiles: a sensitivity analysis. Appl. Opt. 1989, 28, 3603–3615. [Google Scholar] [CrossRef] [PubMed]
  20. Chen, H.; Winderlich, J.; Gerbig, C.; Hoefer, A.; Rella, C.W.; Crosson, E.R.; Van Pelt, A.D.; Steinbach, J.; Kolle, O.; Beck, V.; et al. High-accuracy continuous airborne measurements of greenhouse gases (CO2 and CH4) using the cavity ring-down spectroscopy (CRDS) technique. Atmos. Meas. Tech. 2010, 3, 375–386. [Google Scholar] [CrossRef]
  21. Nara, H.; Tanimoto, H.; Tohjima, Y.; Mukai, H.; Nojiri, Y.; Katsumata, K.; Rella, C.W. Effect of air composition (N2, O2, Ar, and H2O) on CO2 and CH4 measurement by wavelength-scanned cavity ring-down spectroscopy: calibration and measurement strategy. Atmos. Meas. Tech. 2012, 5, 2689–2701. [Google Scholar] [CrossRef]
  22. Ohyama, H.; Kawakami, S.; Tanaka, T.; Morino, I.; Uchino, O.; Inoue, M.; Sakai, T.; Nagai, T.; Yamazaki, A.; Uchiyama, A.; Fukamachi, T.; et al. Observations of XCO2 and XCH4 with ground-based high-resolution FTS at Saga, Japan, and comparisons with GOSAT products. Atmos. Meas. Tech. 2015, 8, 5263–5276. [Google Scholar] [CrossRef]
Figure 1. Schematic illustration of the differential absorption Lidar (DIAL) system.
Sensors 18 04064 g001
Figure 2. Block diagram of the 1.6 µm DIAL system for measurement of CO2 mixing ratio profiles. The low-altitude mode measurements were performed using a 25-cm-diameter telescope and the high-altitude mode measurements were done using a 60-cm-diameter telescope.
Sensors 18 04064 g002
Figure 3. Observation sites where CO2 DIAL (right) and aircraft measurements (left) were made on 12 January 2014 over Tsukuba.
Sensors 18 04064 g003
Figure 4. GPS sonde temperature (left) and pressure (right) profiles launched from Tsukuba on 12 January 2014.
Sensors 18 04064 g004
Figure 5. On-line and off-line return signals with high-altitude mode and low-altitude mode. The range resolution is 7.5 m.
Sensors 18 04064 g005
Figure 6. Comparison of CO2 vertical mixing ratio profiles observed by DIAL and aircraft. dz: vertical resolution.
Sensors 18 04064 g006
Table 1. Parameters of the 1.6 µm DIAL system.
Low-AltitudeHigh-Altitude
Pulse Energy6 mJ
Laser WavelengthOn: 1572.992 nm, Off: 1573.137 nm
Telescope Diameter25 cm60 cm
Interference Filter1.0 nm FWHM
Quantum Efficiency2 %8 %
Detection SchemePhoton counting mode
Table 2. Comparison of CO2 mixing ratio derived from CO2 DIAL and aircraft measurements. (*Difference: DIAL − aircraft).
Altitude [m]Vertical Resolution [m]CO2 DIAL [ppm]Relative Error (CO2 DIAL) [ppm]Aircraft (CRDS) [ppm]*Difference [ppm]
1560236 (low-altitude)401.361.59401.83−0.47
1797400.161.79400.68−0.51
2033398.972.10400.47−1.50
2269398.732.16400.01−1.28
3002590 (high-altitude)398.431.93399.50−1.07
3599399.442.03399.080.37

