Article

New ZnO-Based Glass Ceramic Sensor for H2 and NO2 Detection

1
High Institute for Engineering & Technology, 21 K Cairo-Belbeis Rd, Al-Obour 11828, Egypt
2
INSTM R.U PoliTO-LINCE Laboratory, Department of Applied Science and Technology, Politecnico di Torino, Corso Duca degli Abruzzi, 24, 10129 Torino, Italy
3
Faculty of Engineering and Technology, Badr University in Cairo (BUC), Badr 11829, Egypt
4
Department of Applied Science and Technology, Politecnico di Torino, 10129 Torino, Italy
*
Author to whom correspondence should be addressed.
Sensors 2017, 17(11), 2538; https://doi.org/10.3390/s17112538
Submission received: 8 October 2017 / Revised: 30 October 2017 / Accepted: 31 October 2017 / Published: 3 November 2017
(This article belongs to the Special Issue Gas Sensors based on Semiconducting Metal Oxides)

Abstract

:
In this study, a glass ceramic with a nominal composition 58ZnO:4Bi2O3:4WO3:33.3B2O3 was synthesized by melt quenching technique. A gas sensor was then manufactured using a ZnO sol-gel phase as a permanent binder of the glass–ceramic to an alumina substrate having interdigitated electrodes. The film sensitivity towards humidity, NH3, H2 and NO2 was studied at different temperatures. X-ray diffraction technique (XRD), field emission- scanning electron microscopy (FE-SEM) and differential thermal analysis (DTA) were used to characterize the prepared material. Though the response in the sub-ppm NO2 concentration range was not explored, the observed results are comparable with the latest found in the literature.

1. Introduction

The demand for rugged and reliable chemical sensors able to operate in harsh industrial environments, as well as for public health and security is still high. These sensors have to cover a wide range of industries such as metallurgy, glass, ceramic, paper, automotive, aerospace and energy [1]. To fulfill these requests, emission monitoring sensors able to detect CO, CO2, NOx (NO and NO2), O2, hydrocarbons (HCs) and volatile organic compounds (VOCs) have been developed. Chemical sensors are also used in domestic appliances and air quality monitoring, as well as, for the early detection of smoke/fire and of hazardous chemical agents, to provide safety and security in public places and transportation systems [1]. Yet, despite the high demand, major advances in these sensors in terms of simple structure, lower cost, better selectivity, durability and reliability are always needed. Throughout the years, many materials based on polymers, composites and ceramics have been tested as gas sensors due to their own features and specific operating conditions. However, great attention has been paid to ceramic materials because of their chemical inertness. The base materials most widely investigated for ceramic gas sensors are transition metal oxides based on SnO2, TiO2, WO3, In2O3, Fe2O3 and ZnO [2]. ZnO sensing properties have been extensively studied, exhibiting, for example, a high sensitivity to CO, NO, NO2, H2S, C2H5OH, NH3, CH4, SO2 gases and acetaldehyde [3,4,5,6]. In addition, many metals such as Al, In, Cu, Fe, Sn, Pt and Ru were proposed as dopants in ZnO gas sensors to improve their sensing properties [3,5].
Preparation techniques can considerably affect the physical, chemical and functional properties of semiconducting metal oxide-based gas sensors too. Thus, new synthesis routes, as well as doping, are two promising approaches for the design of highly sensitive and selective gas sensors. Insulated matrix with percolating conductive fillers have been deeply investigated because of the electromechanical interactions between the various phases [7]. Usually, conductor–insulator composites consist of glass, ceramics, or polymer as the insulating phase and of metal, carbon or polymers, as the conducting one [7,8]. In glasses or ceramics as sensing materials, the variation of their electrical properties, such as impedance or capacitance, is exploited for gas detection. There are, however, few papers dealing with glass ceramics as humidity [9] and gas sensors [10,11,12,13,14,15,16]. Thus, based on previous experiences [17,18], in this research, ZnO crystals were grown from a glassy matrix having the composition 58ZnO:4WO3:4Bi2O3:33.3B2O3 by means of a crystallization process. The gas sensing properties of this material were investigated at different operating temperatures with respect to water vapor, NH3, H2 and NO2.

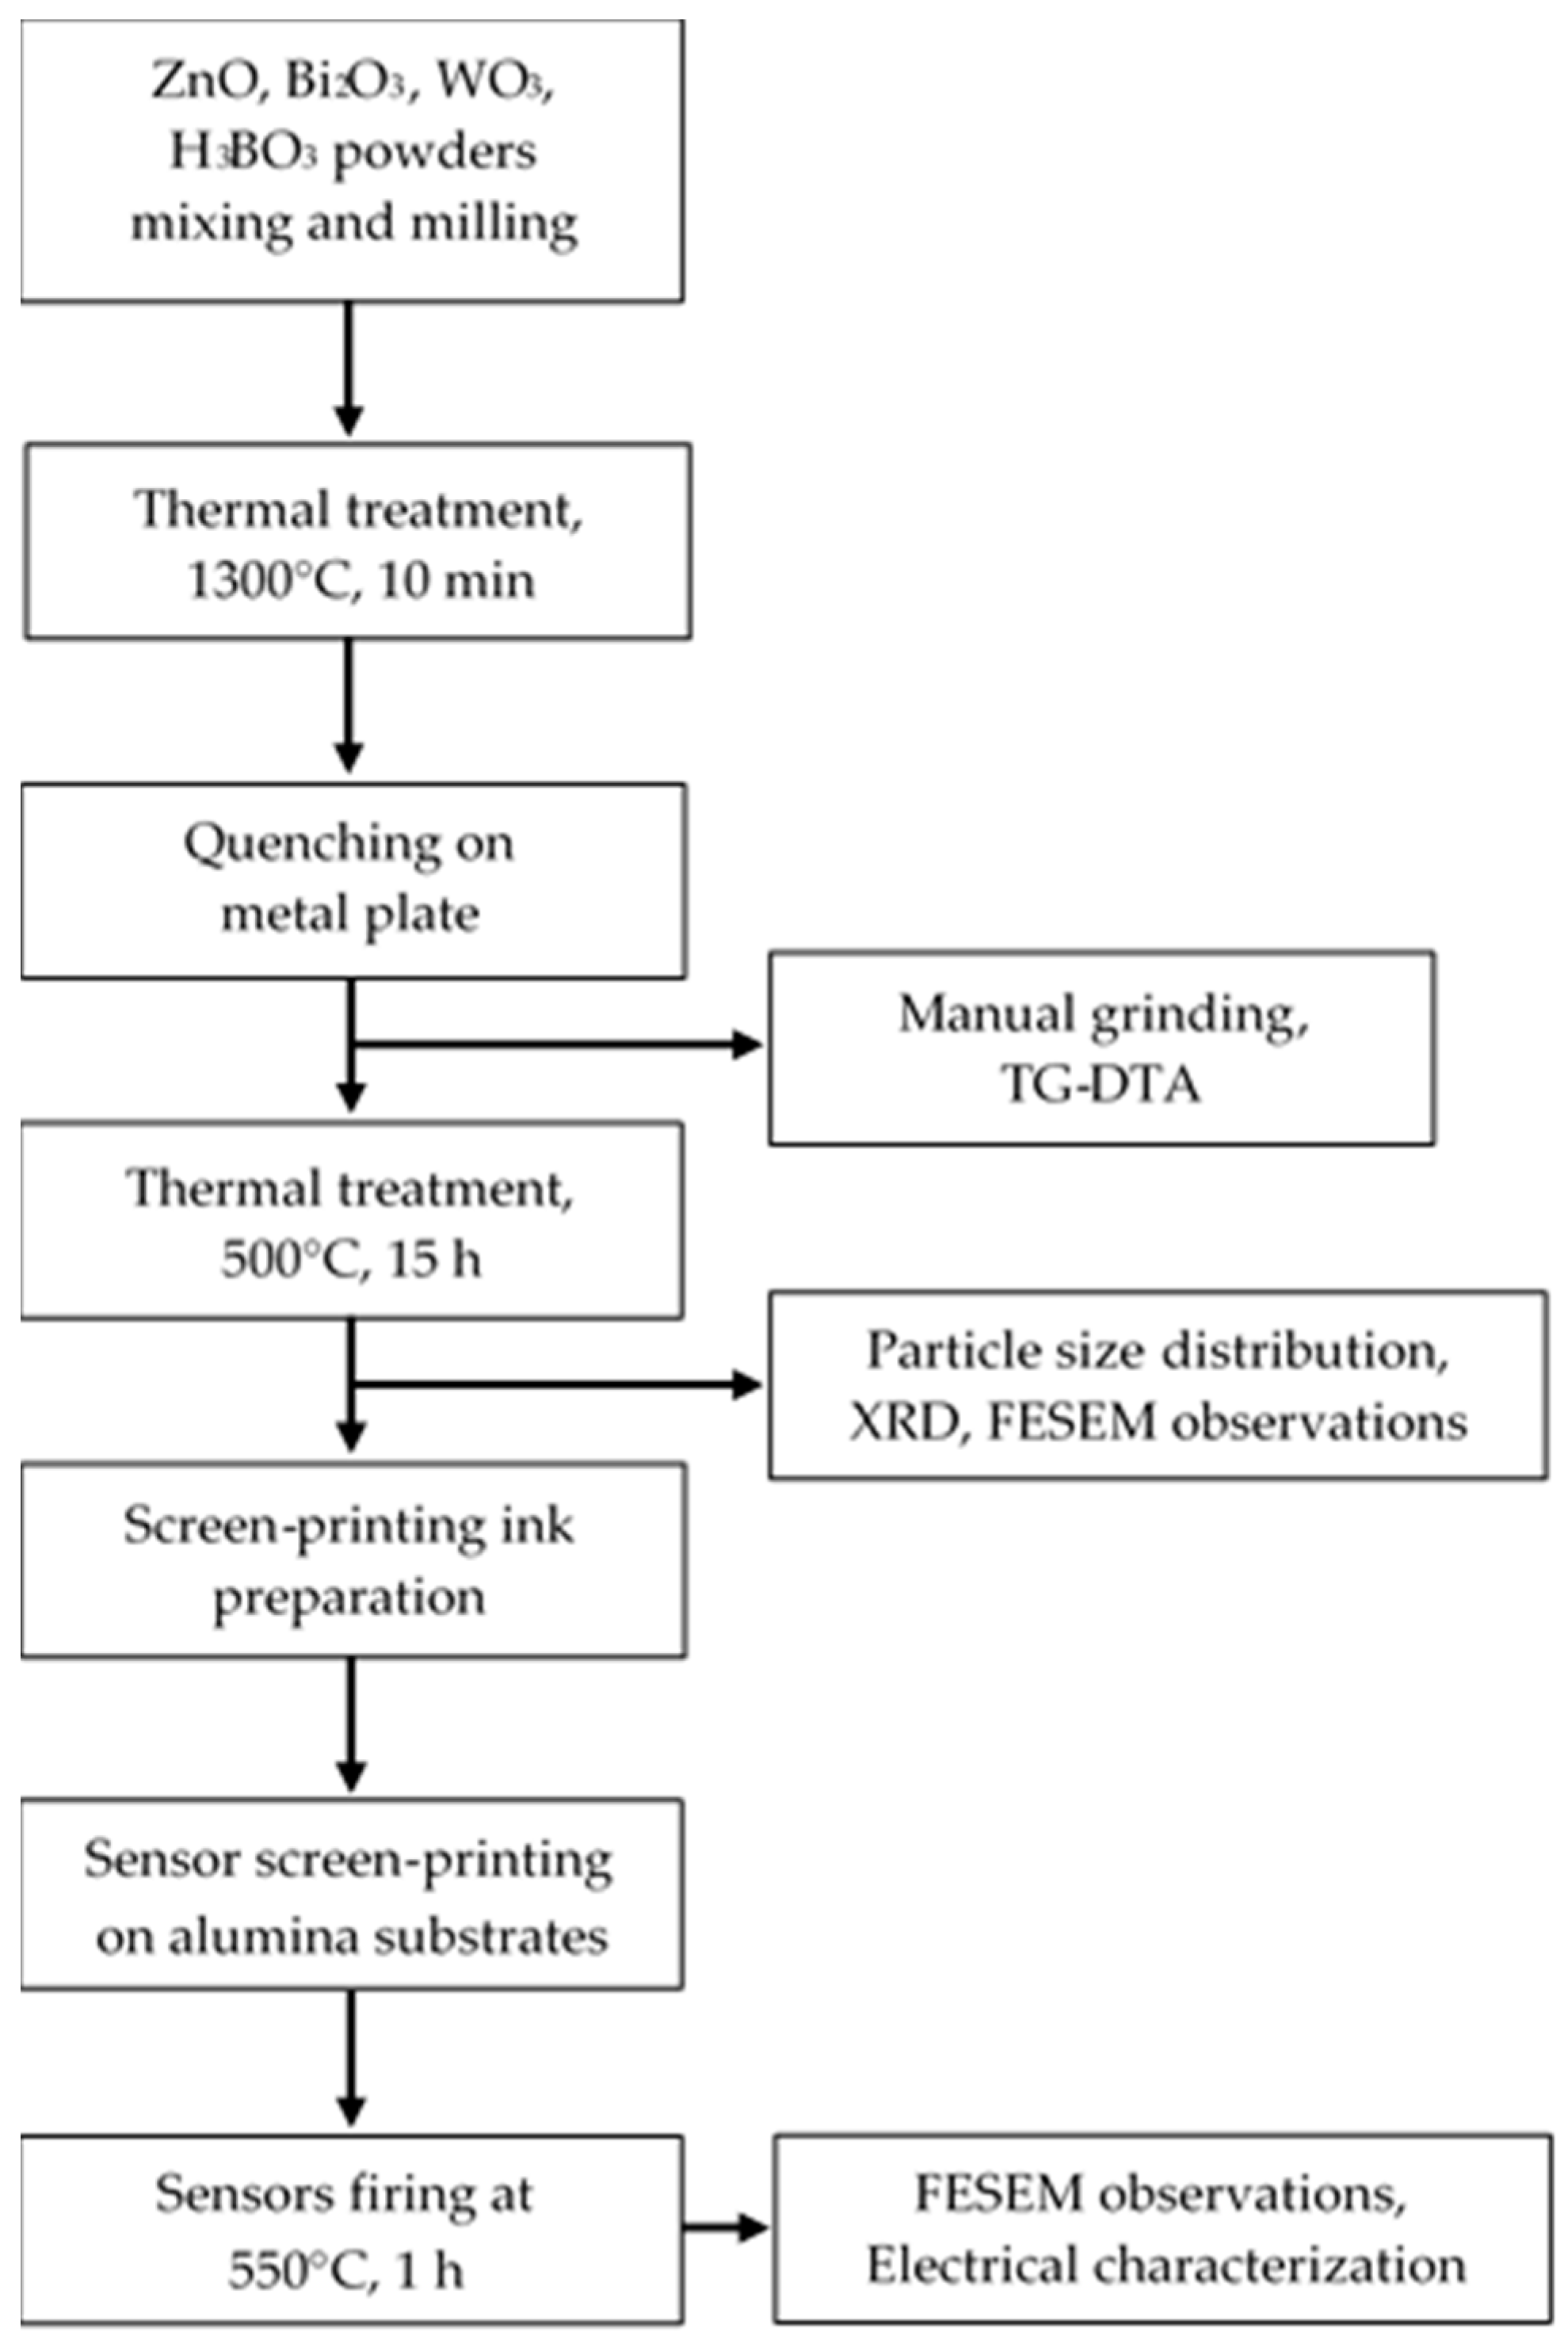
2. Materials and Methods

Figure 1 illustrates a flow-chart of the sensing material and of the sensors preparation and characterization.
Powders of zinc oxide (ZnO—Aldrich > 99%), bismuth oxide (Bi2O3—Alfa Aesar, 99.999% metal basis), tungsten oxide (WO3—Aldrich > 99%) and boric acid (H3BO3—Alfa Aesar, 99.999% metal basis) were used as raw materials for glass preparation; all chemicals were ACS grade.
The composition of the studied batch is 58ZnO:4WO3:4Bi2O3:33.3B2O3 and is reported in the ternary diagram of Figure 2 in mole ratio of oxides. Compositions in mol% and wt% can be calculated by the following Equation (1):
x A = ( X A   ·   M A   / X A   · M A   + X B   · M B   ) × 100 ,
where: xA,B is the amount in wt% of compound A or B, XA,B is the amount in mol% of compound A or B and MA,B is the molar mass of A or B. ZnO, WO3 and Bi2O3 were used as starting chemicals, while H3BO3 (boric acid) was used as precursor for the formation of B2O3 according to the chemical reaction described by Equation (2):
2 H 3 B O 3 B 2 O 3 + 3 H 2 O ,
After that, the bismuth oxide, boric acid, zinc oxide and tungsten oxide amounts were calculated for 10 g batches. The raw materials were mixed and milled in an agate mortar for 10 min to homogenize the mixture, prior to transfer it into a suitable platinum crucible. Then, the mixture was heated for 10 min at 1300 °C in a muffle furnace, prior to be poured onto a metal plate for quenching with a cooling rate of 102–103 K/s. Finally, the glass was manually ground by means of an agate mortar and an agate pestle. About 50 mg of the prepared powder was placed into a platinum crucible for simultaneous thermogravimetric–differential thermal analysis (TG-DTA, Neztsch STA 409, Selb, Germany) with a reference sample made of alumina powder. The analysis was performed under static air with a 10 °C/min heating rate up to 800 °C. A thermal treatment at 500 °C for 15 h (i.e., at a temperature close to the estimated crystallization temperature onset of glass, Tx) was then carried out to crystallize ZnO nanoparticles.
Particle size distribution of the powder heat-treated at 500 °C for 15 h was evaluated by laser granulometry (Malvern 3600D, Worcestershire, UK). Laser granulometry measurements were carried out after dispersion in ethanol, before and sonication for 10 min.
X-ray diffraction patterns were collected on prepared powders by means of a X’Pert Powder Pan Analytical Diffractometer, equipped with a Cu anticathode (λ Cu Kα anticathode = 0.154056 nm). Samples were scanned at a rate of 0.02 °/s in the range from 5° to 70° in 2θ. Finally, samples were chromium sputtered for Field Emission Scanning Electron Microscopy (FESEM), Zeiss Merlin, Oberkochen, Germany) observations.
Glass ceramic (GC) sensors were prepared by adding 2-propanediol to GC powder and mixing in a mortar till getting an acceptable viscous paste. The ink was then manually screen-printed over an alumina substrate onto interdigitated Pt electrodes (Figure 3). These samples were fired at 550 °C for 1 h with a 2 °C/min heating rate.
The sensors were first tested in a laboratory apparatus made of a thermostated chamber, operating at room temperature (RT), in which relative humidity (RH) was varied between 0 and 96% by steps, each one of 3 min [19]. In this RH system, compressed air was separated into two fluxes: one was dehydrated over a chromatography alumina bed, while the second one was directed through two water bubblers (three bubblers if measurements were performed under NH3 atmosphere [20]), generating, respectively, a dry and a humid flow [19]. During measurements, the overall airflow (dry + humid one) was kept constant (0.05 L/s). As water is a polarizable molecule and to avoid electrolysis due to the applied voltage, each tested sensor was alimented by an external alternating voltage (V = 3.6 V @ 1 kHz) and constituted a variable resistance of this electrical circuit. A multimeter (Keithley 2700, Beaverton, OR, USA) was used to measure the voltage at the output of the circuit [19]. The sensor resistance was determined by means of a calibrating curve drawn by substituting the sensor, in the circuit, by known resistances and by measuring the voltage across them. RH values were measured by means of a commercial humidity and temperature probe (Delta Ohm DO9406, Padova, Italy).
For ammonia measurements, the ammonia flow was obtained by diluting an ammonium hydroxide solution (Fluka, Minneapolis, MN, USA) in deionized water (ratio 1:20) into a third drechsel through which the airflow was bubbled [20]. The corresponding ppm of NH3 concentration was then estimated by a commercial ammonia probe (Gas Microalert 5, BW Technologies, Calgary, AB, Canada).
Finally, glass ceramic sensors were tested, first under an oxidizing (NO2, 1, 2.5, 5 ppm) and then, under a reducing gas (H2, 20, 50, 100 ppm) at a constant flow rate of 200 sccm (standard cubic centimeters). The sensors were investigated in dry air and in humid conditions (50 RH%) and were exposed to each gas concentration for 10 min, while air was flowed for 30 min before increasing the concentration of the targeted gas. Finally, air was flowed during 60 min when changing gas (from NO2 to H2) and when performing measurements from dry air to humid one. All measurements were carried out using a flow through cell made of Teflon [21]. The sensors were equipped with a screen-printed heater which was alimented by a variable DC power supply to reach the different operating temperatures (from 150 °C to 250 °C). The heater was previously calibrated by means of a pyrometer prior to the sensors’ measurements [21]. The resistances of the sensors were continuously measured with a computer-controlled system by a digital multimeter (Keithley DMM 199, Beaverton, OR, USA) [21].
The sensor response (SR), was defined as the relative variation of the starting resistance in the absence of the test gas, R0, and the resistance measured under gas exposure, Rg, as described by Equation (3):
S R = R g R 0 ,

3. Results

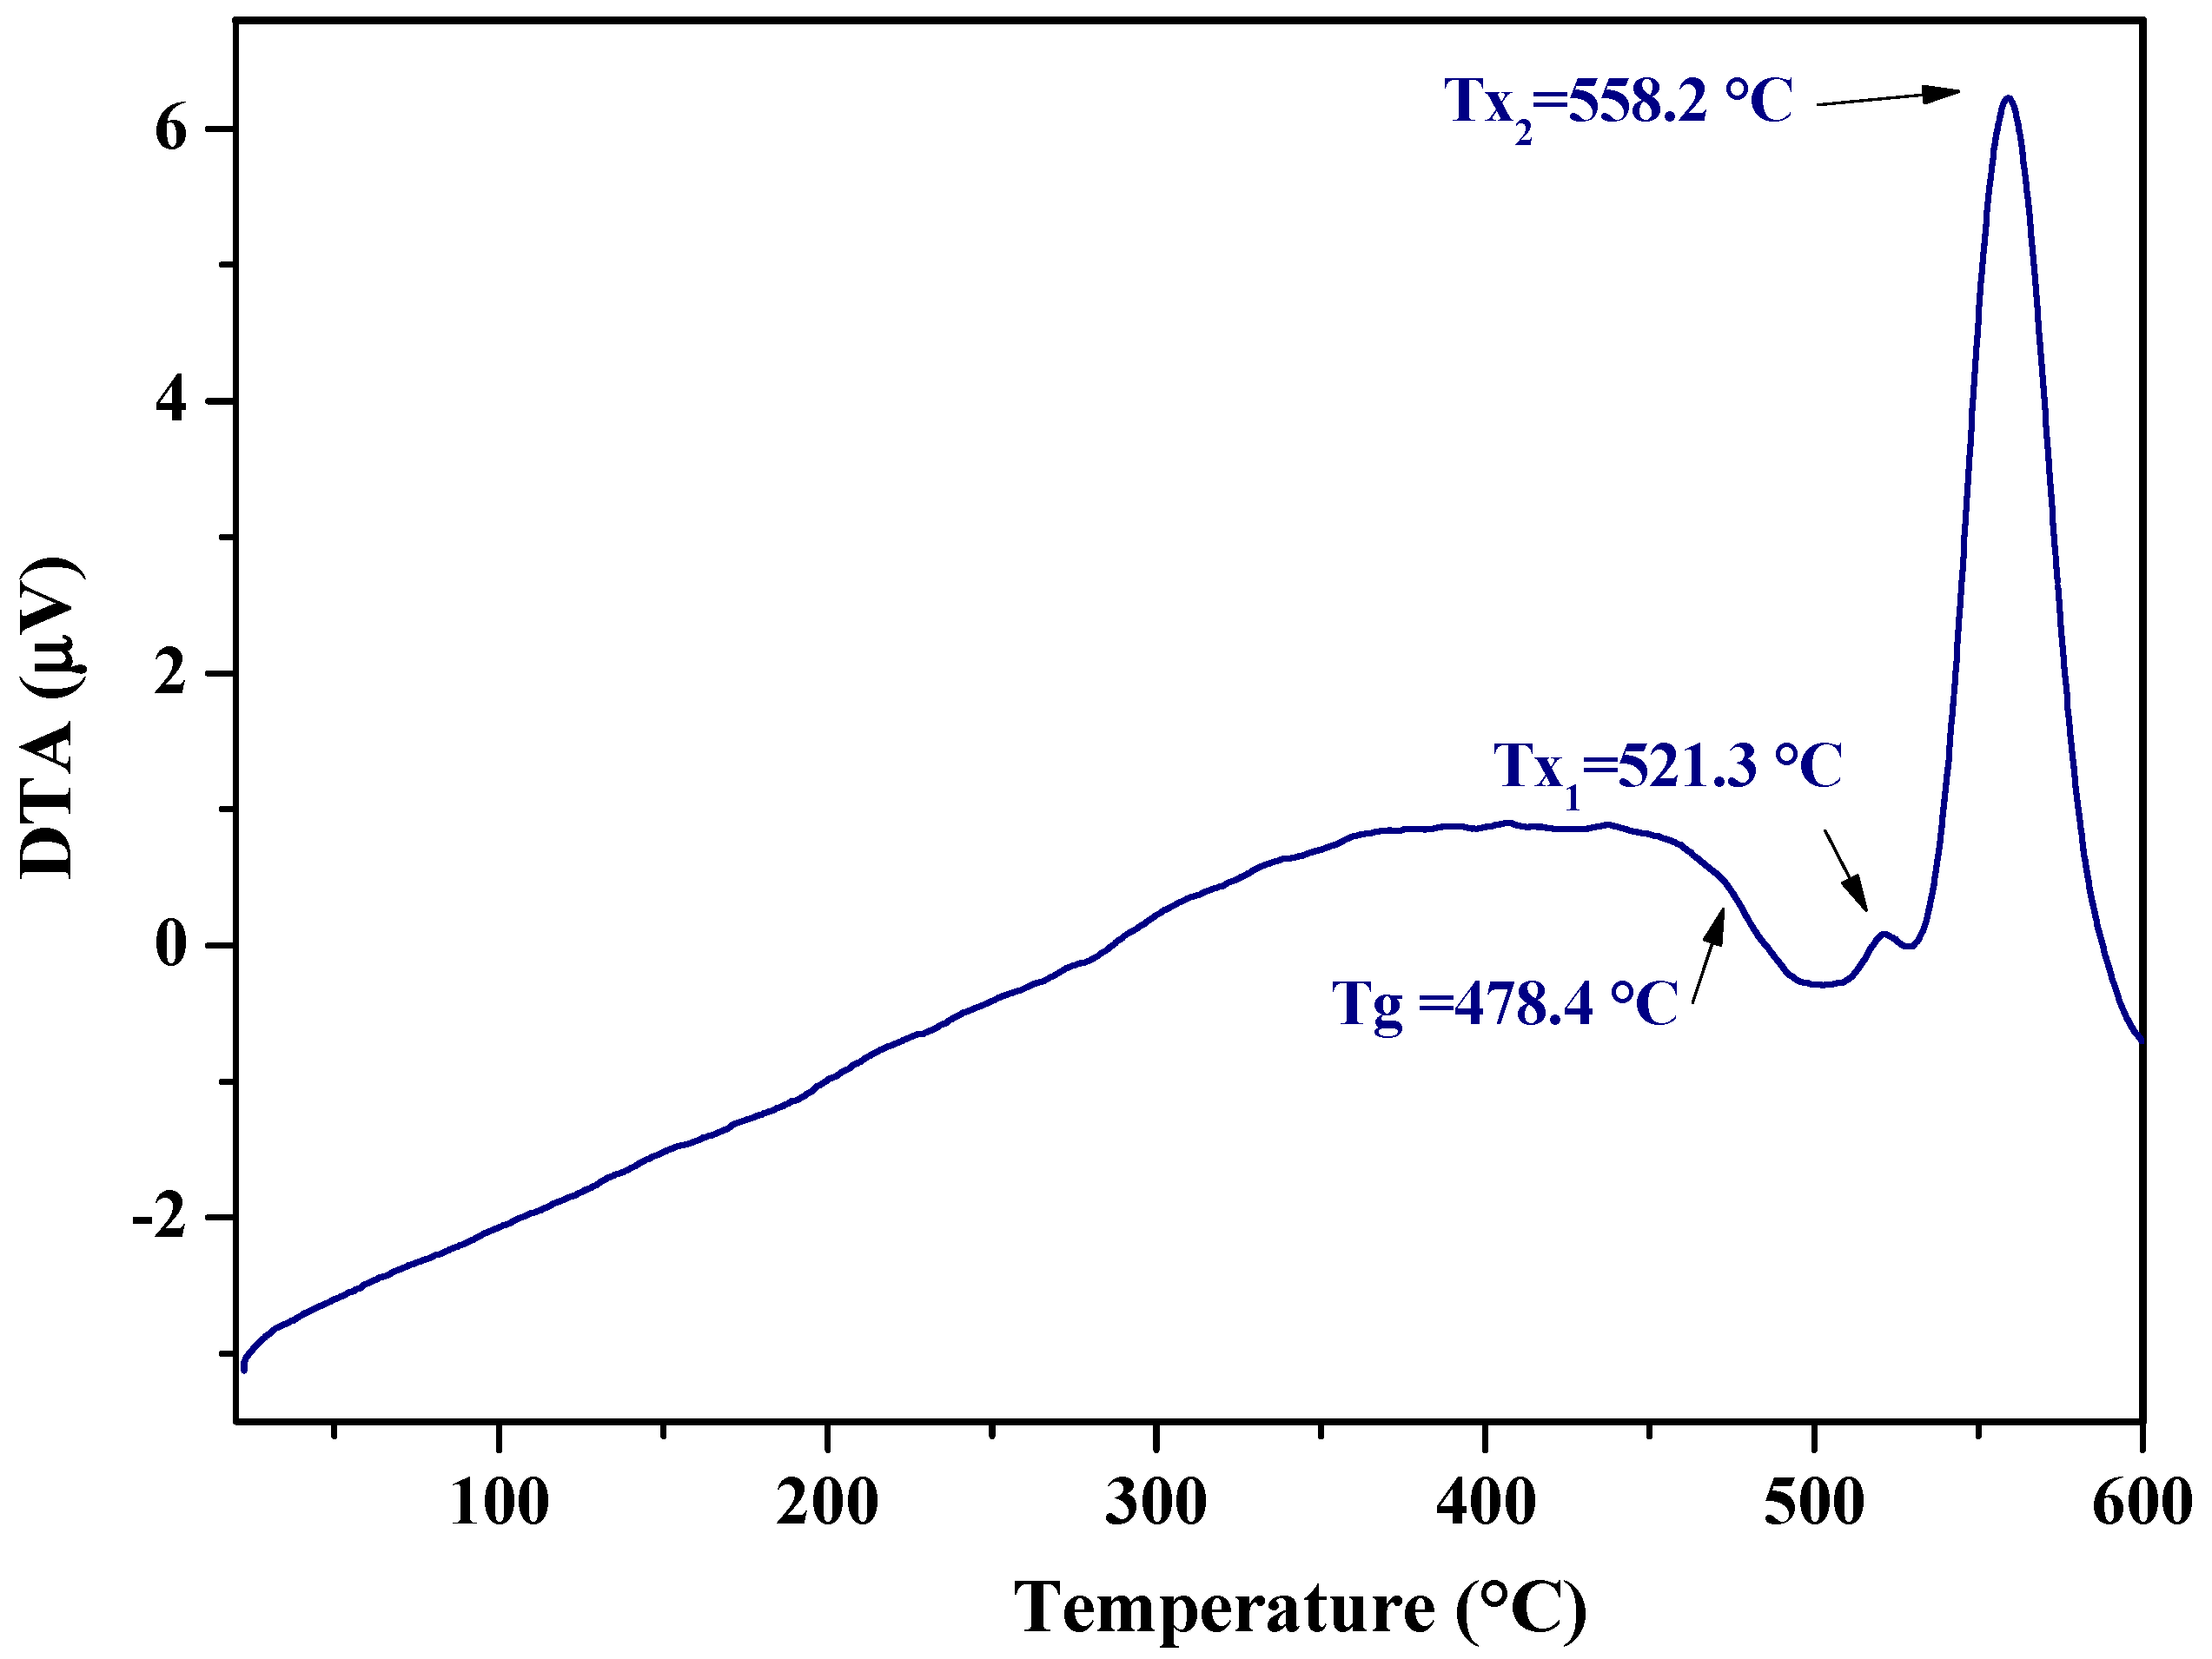
3.1. Differential Thermal Analysis

The DTA curve of the glass having the composition 58ZnO:4Bi2O3:4WO3:33.3B2O3 is reported in Figure 4: a glass transition temperature (Tg) is visible at about 478 °C and glass crystallization temperatures (Tx1 and Tx2) are evidenced above 500 °C. Considering the estimated crystallization temperature onset of glass Tx at 538 °C, the studied glass sample was submitted to a heat treatment for 15 h at the temperature near to the established Tx (500 °C).

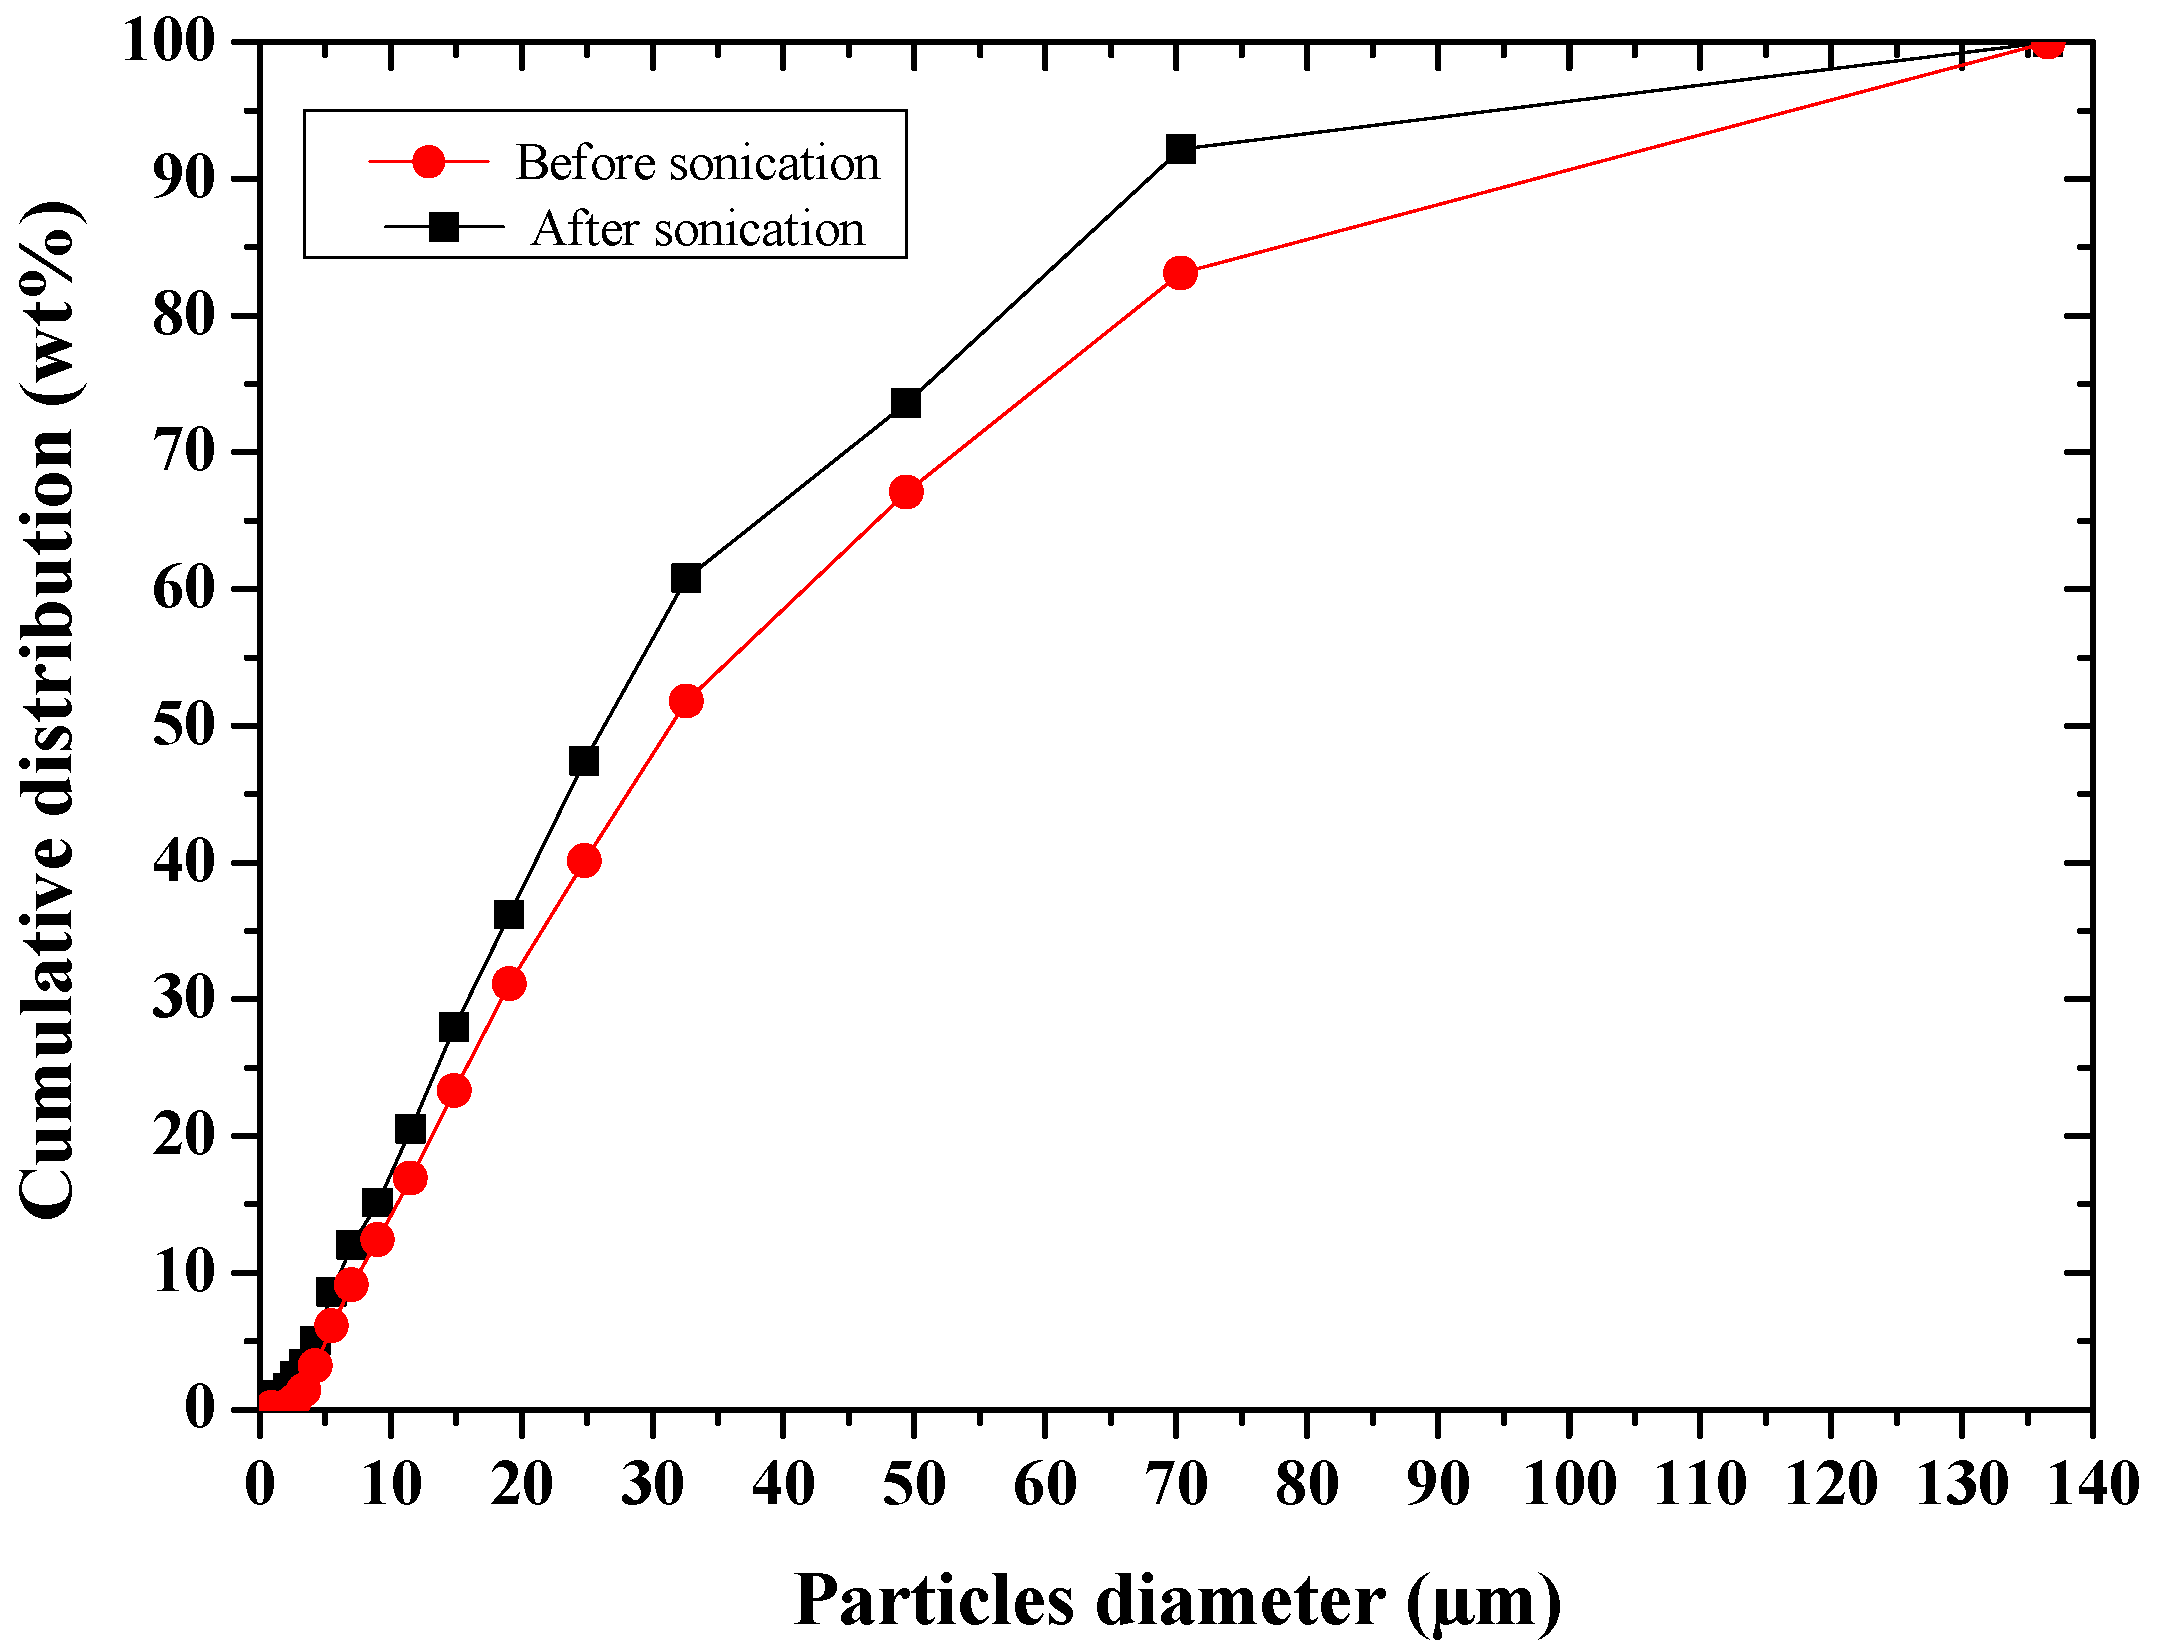
3.2. Particle Size Distribution

After sonication of the powder in ethanol for 10 min, Table 1 and Figure 5 showed a slight agglomeration of the particles. The easy deagglomeration of the powder grains suggest that the agglomerates were soft ones.

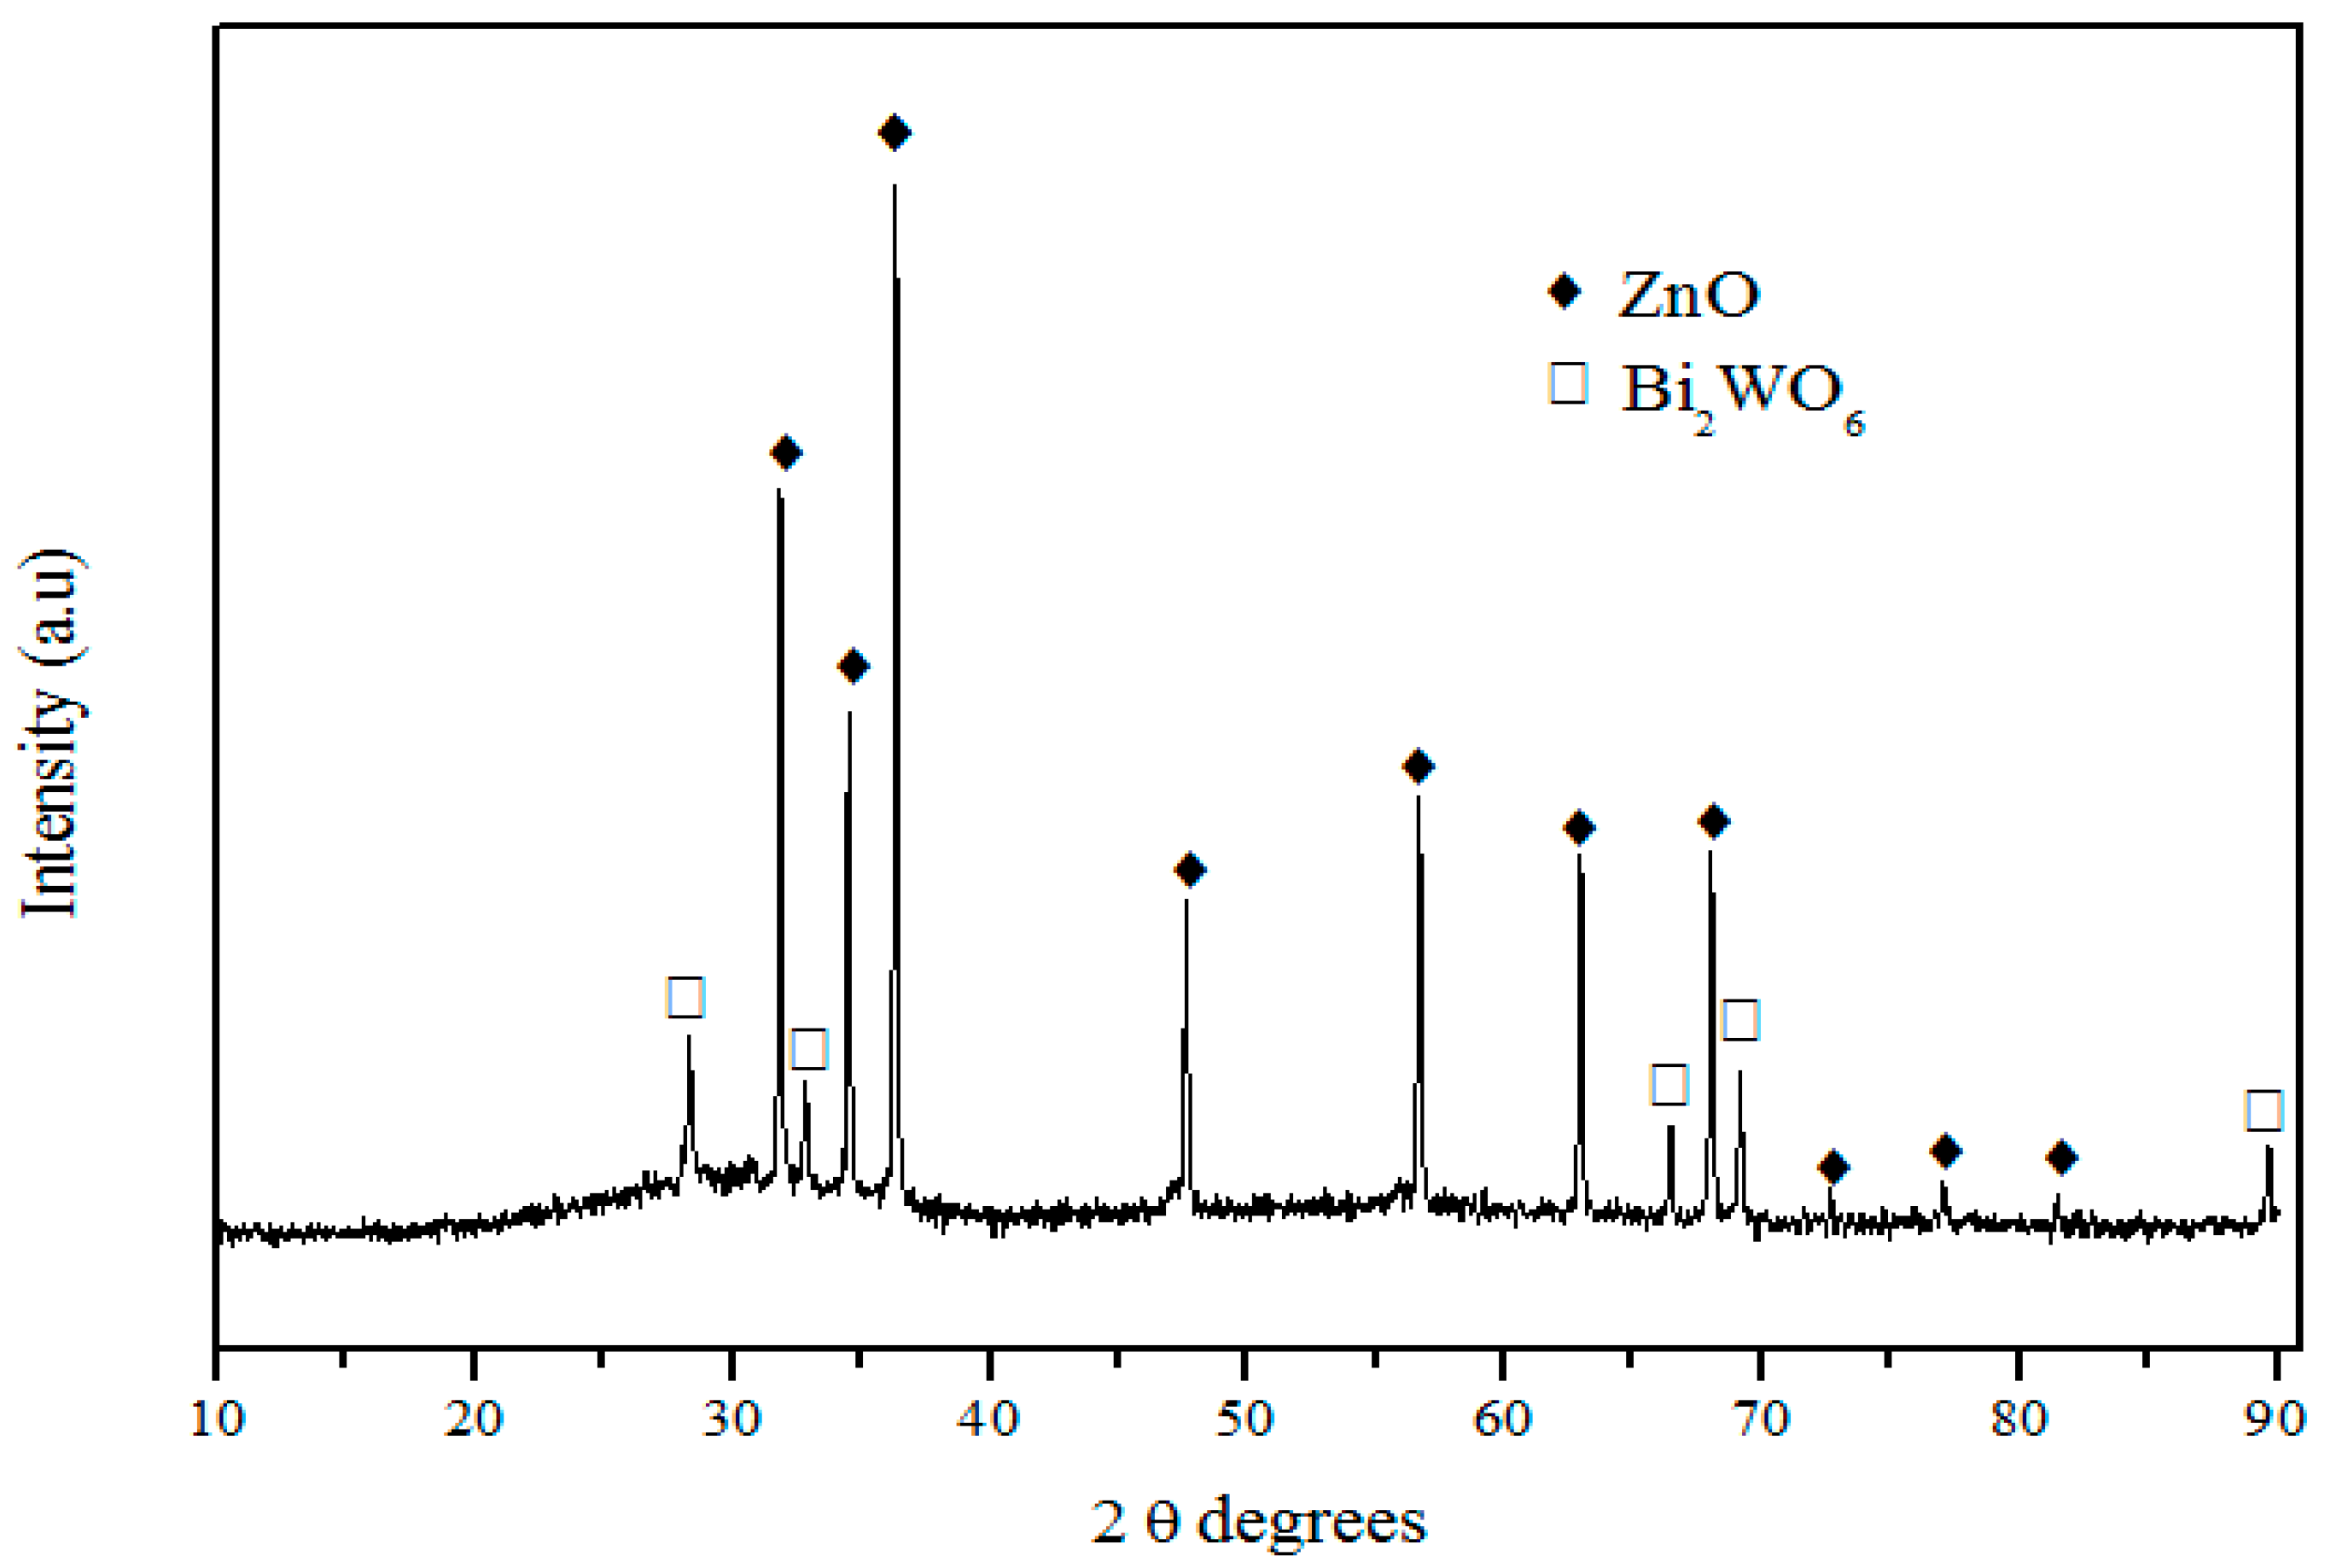
3.3. X-ray Diffraction

XRD pattern shown in Figure 6 evidences the presence of two different crystalline phases: ZnO (JCPDS card no°1389-0511) and Bi2WO6 (JCPDS card no°1373-2020). ZnO is the main crystalline phase, whereas Bi2WO6 appears as the secondary crystalline phase.

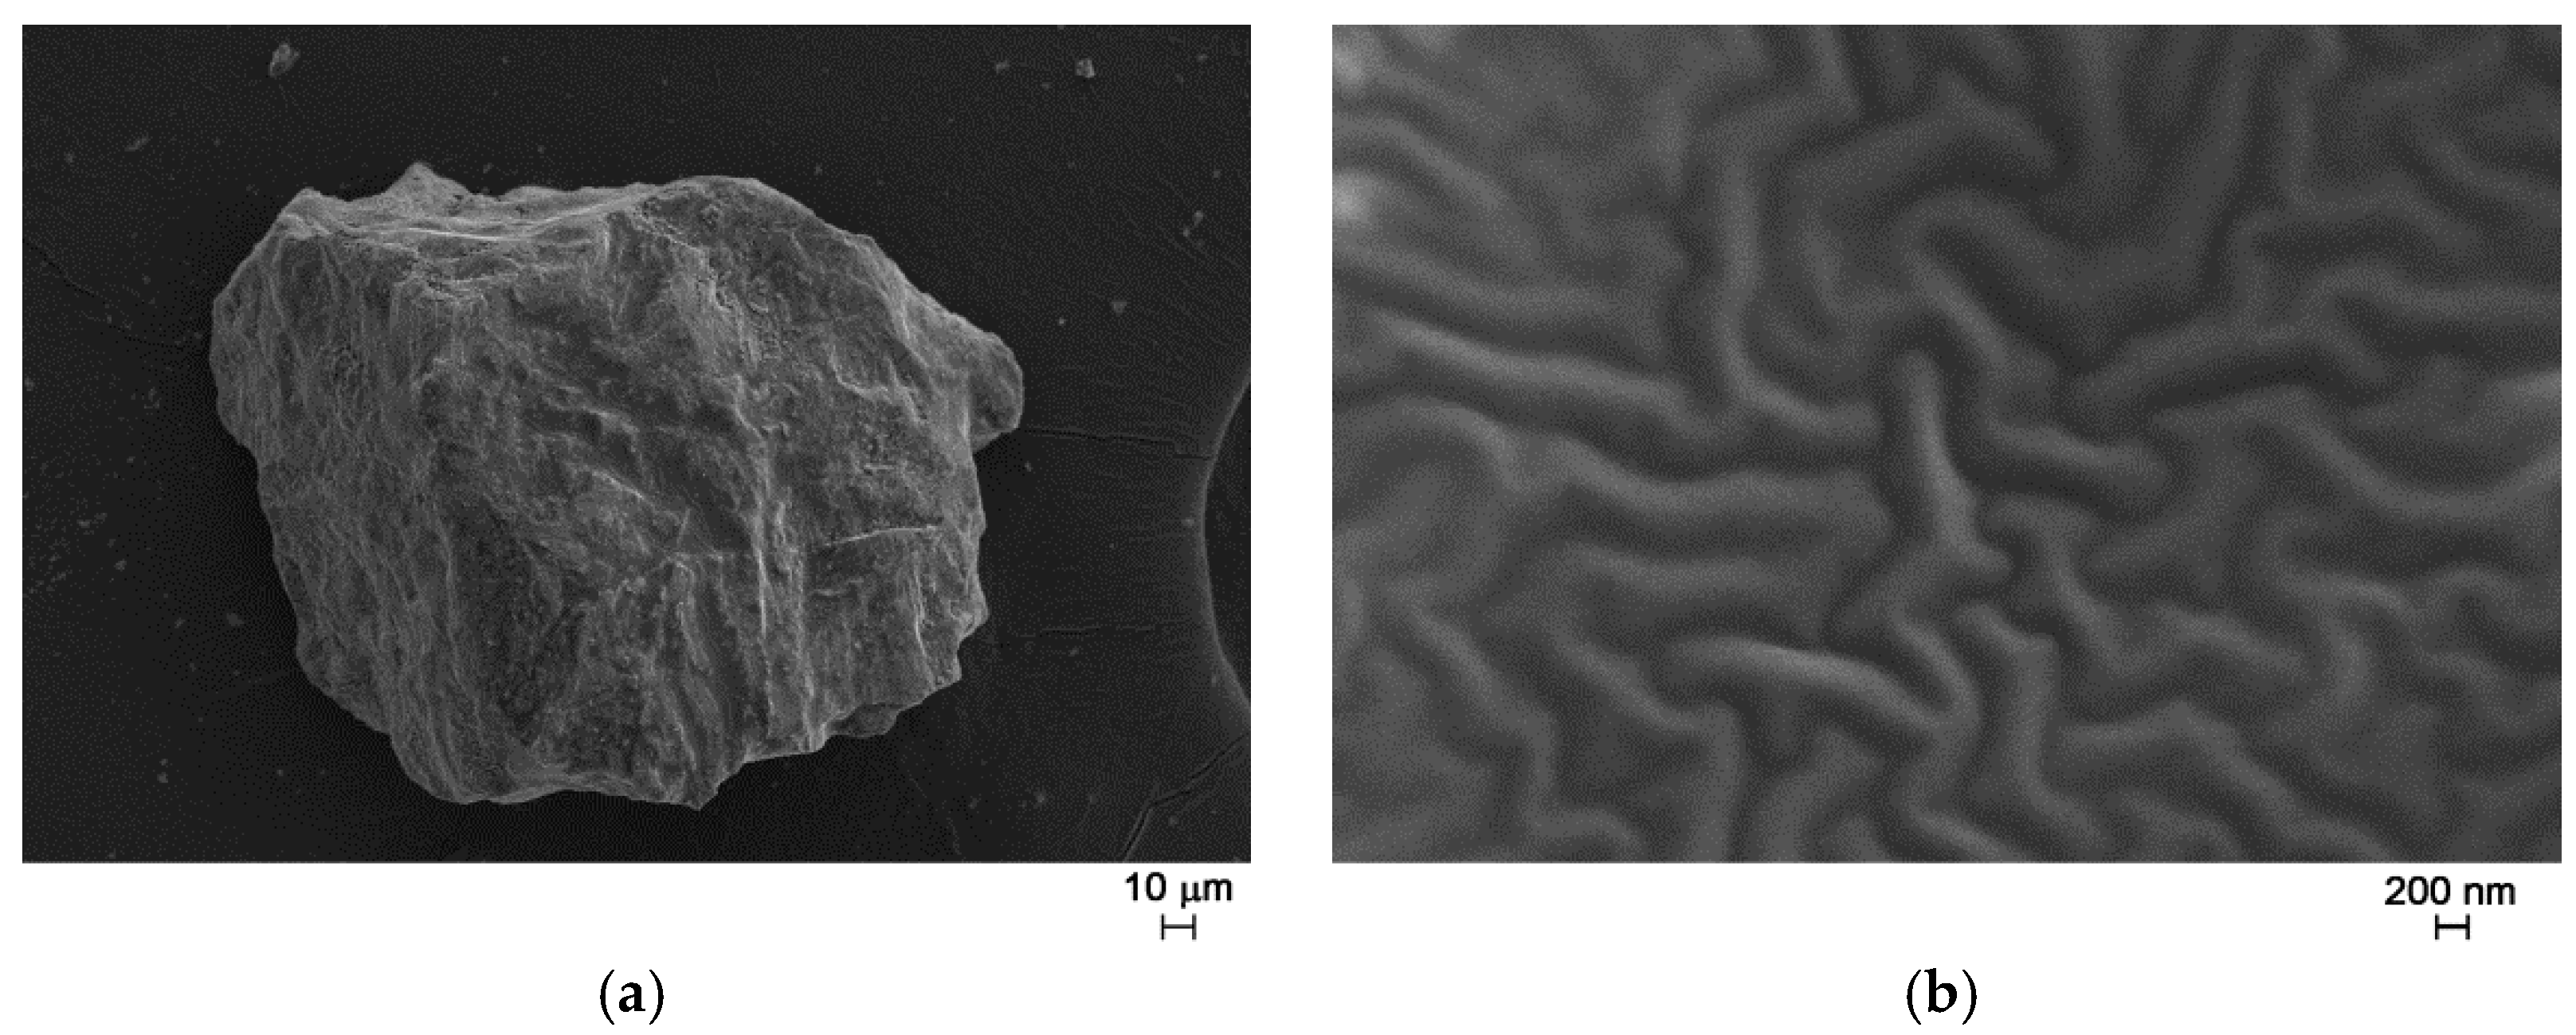
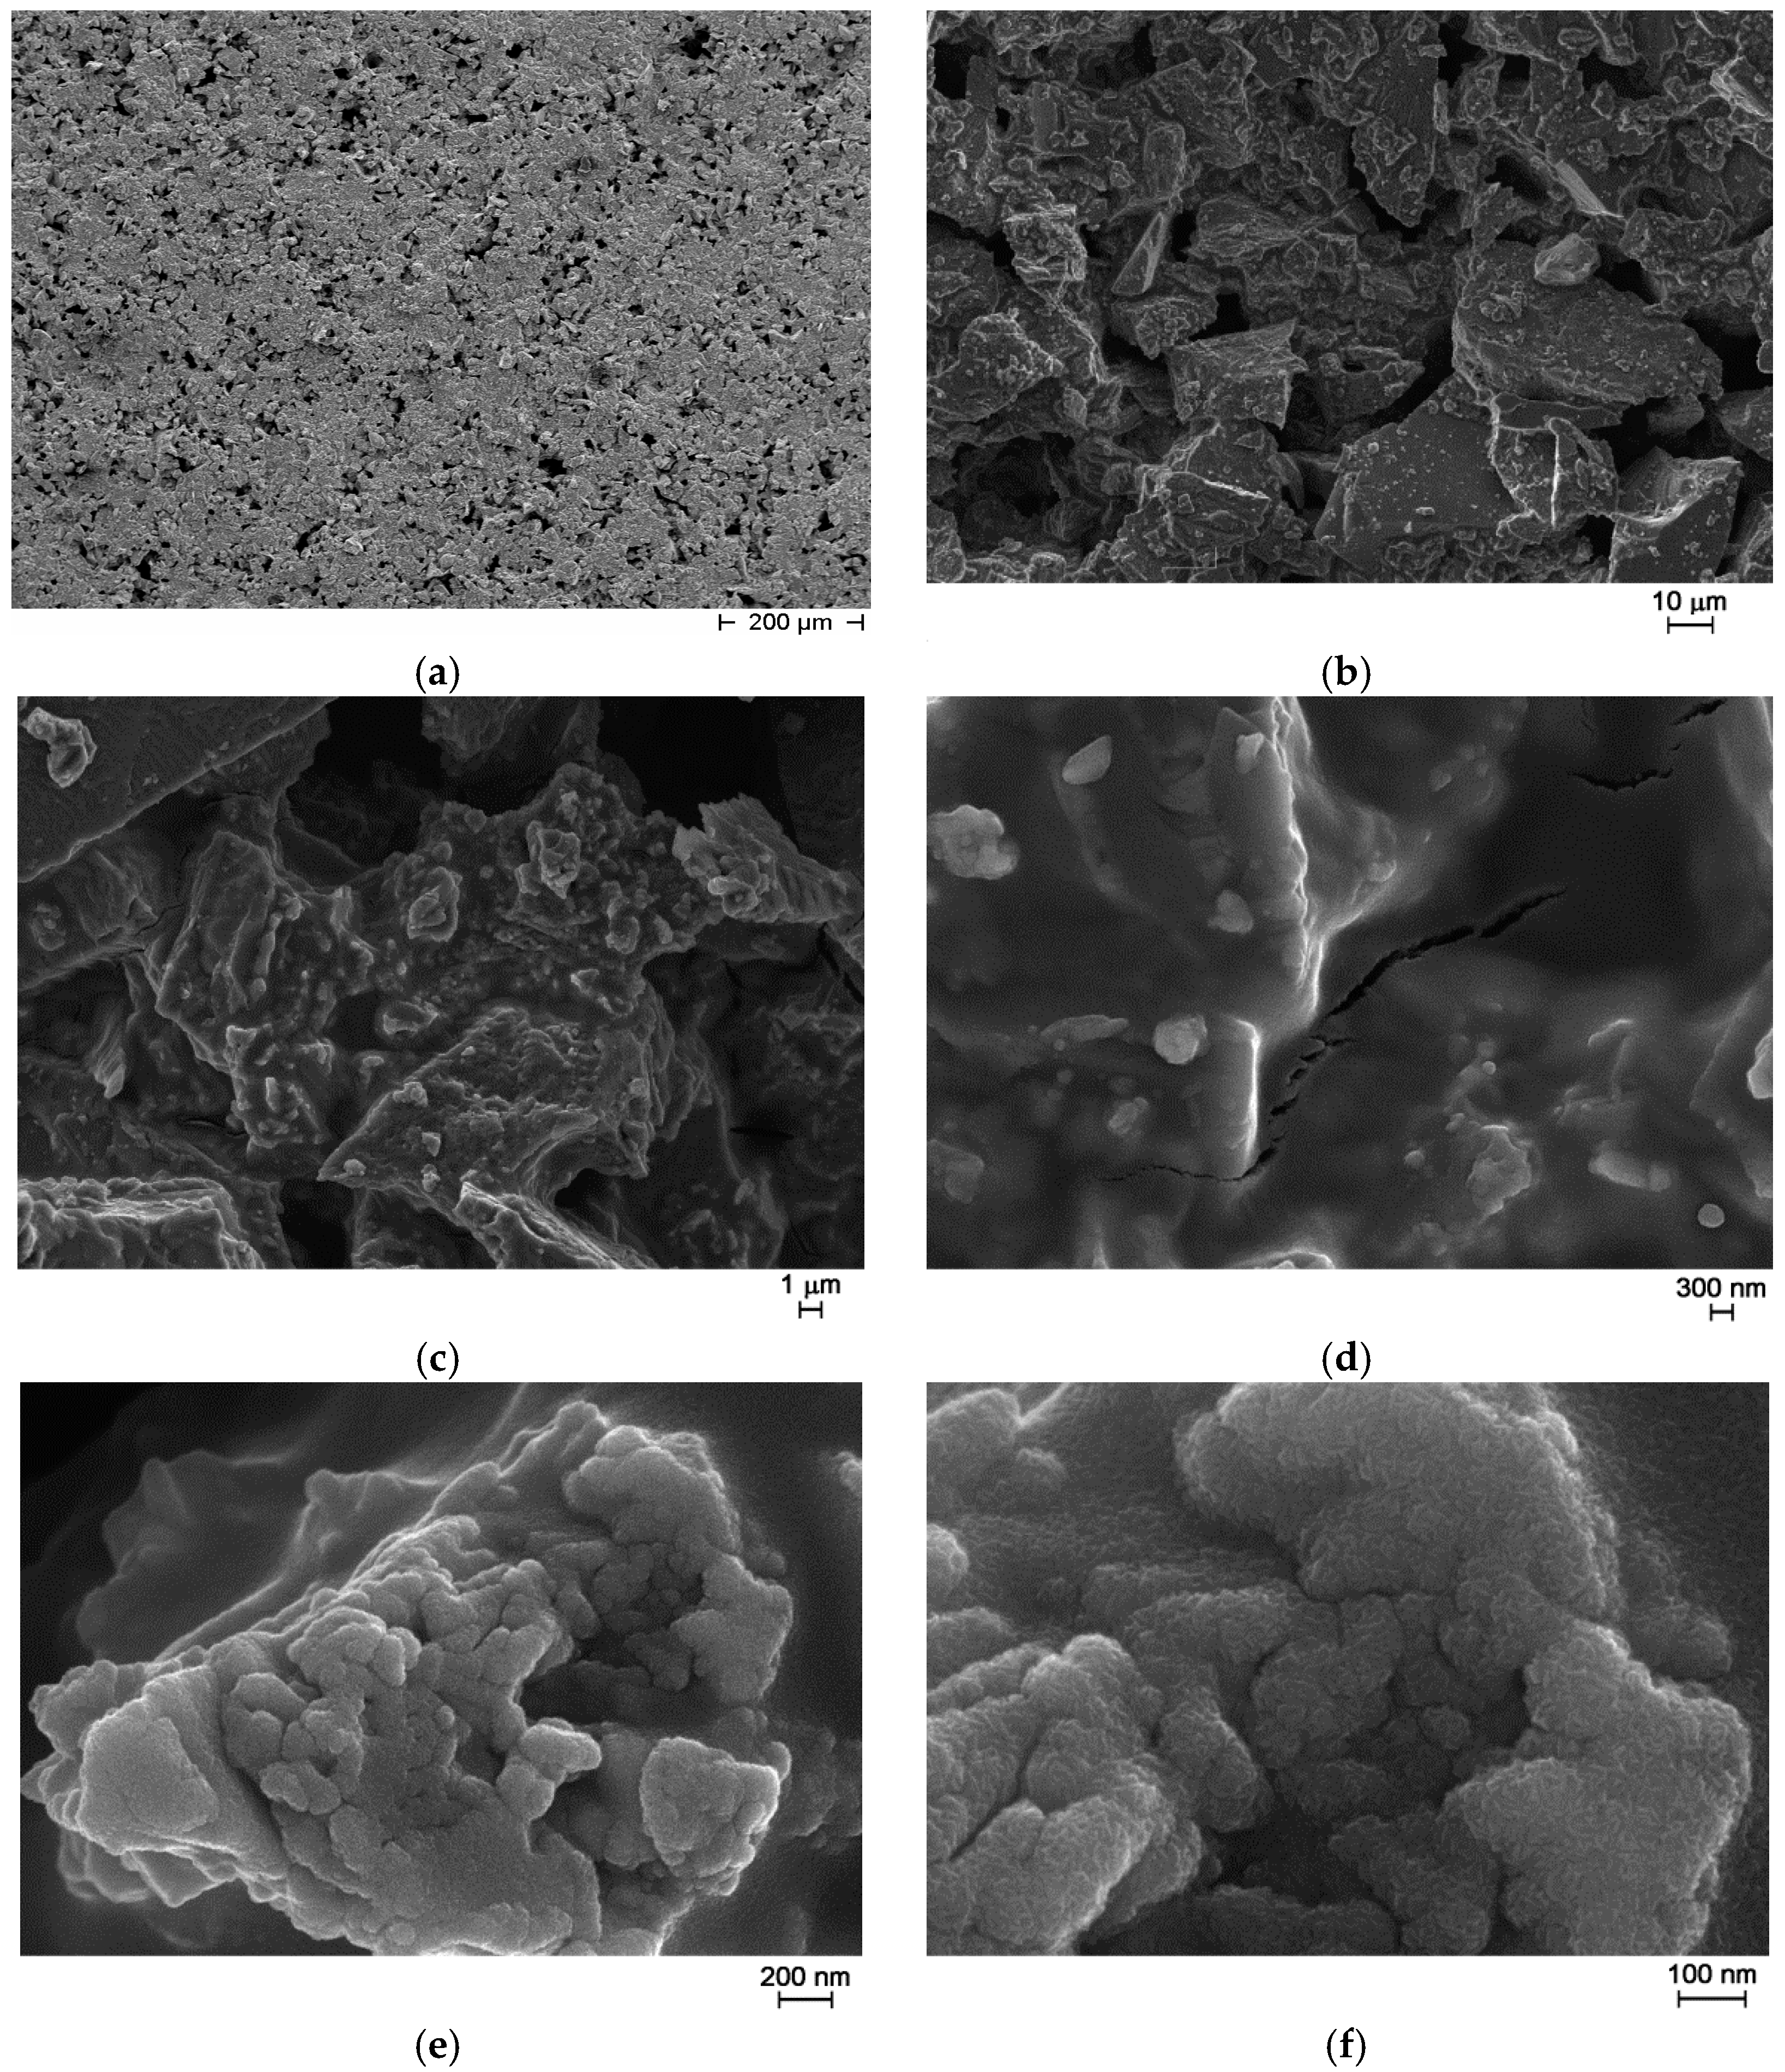
3.4. SEM/FE-SEM Observations and Elemental Microanalysis

After the thermal treatment at 500 °C for 15 h, FE-SEM observations showed the presence of a glassy matrix where particles with different size and shape are embedded (Figure 7).
Elemental microanalysis (performed by means of an Energy Dispersive X-ray Spectrometer, EDS) was performed on different points along the crystals presented in Figure 7 and the matrix. The results confirmed the presence of Zn, W, and Bi atoms. In addition, they revealed a slightly higher percentage of zinc in the crystals than in the glassy matrix (Table 2).

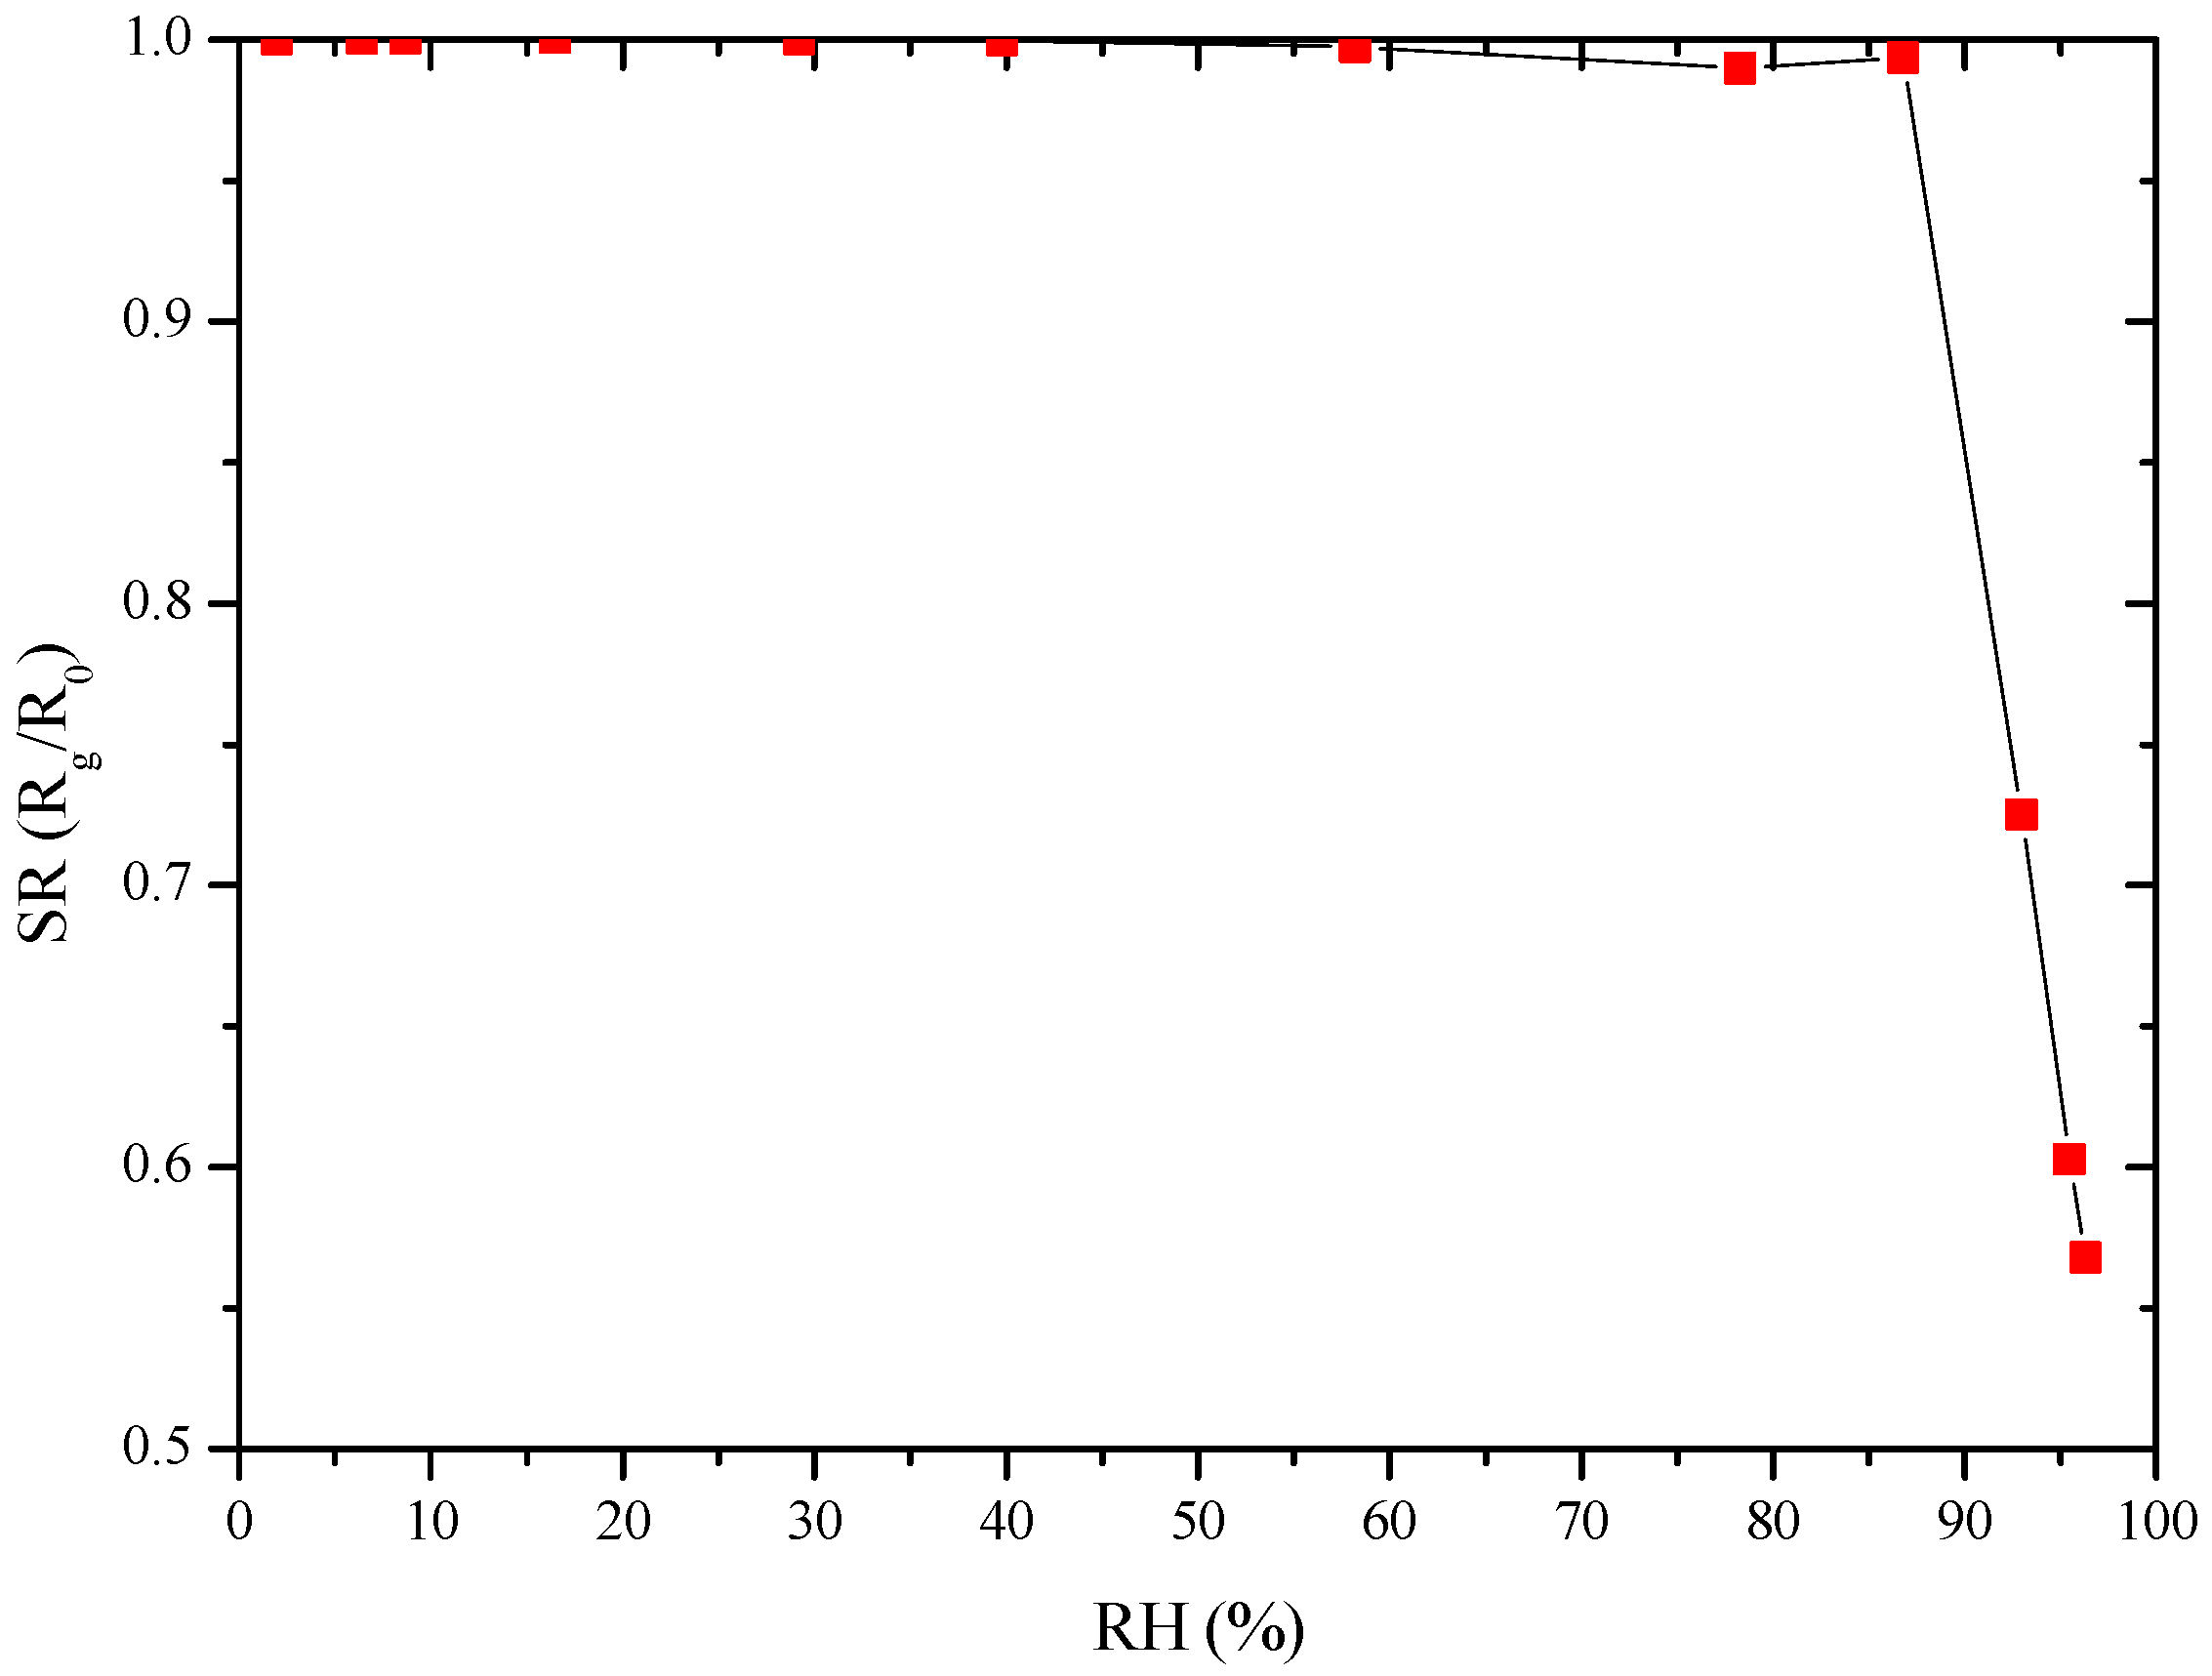
3.5. Sensitivity towards Humidity at Room Temperature

The prepared sensors gave a poor response to water vapor at room temperature up to 87 RH%, as illustrated in Figure 8. This result is encouraging as water vapor is an interfering gas in pollutants detection.

3.6. Sensitivity towards NH3 at Room Temperature

The sensors gave almost no response towards ammonia at RT in the range 0–75 ppm (curve not shown here). This result is also encouraging as the sensor seems to be selective, at least with respect to ammonia in water.

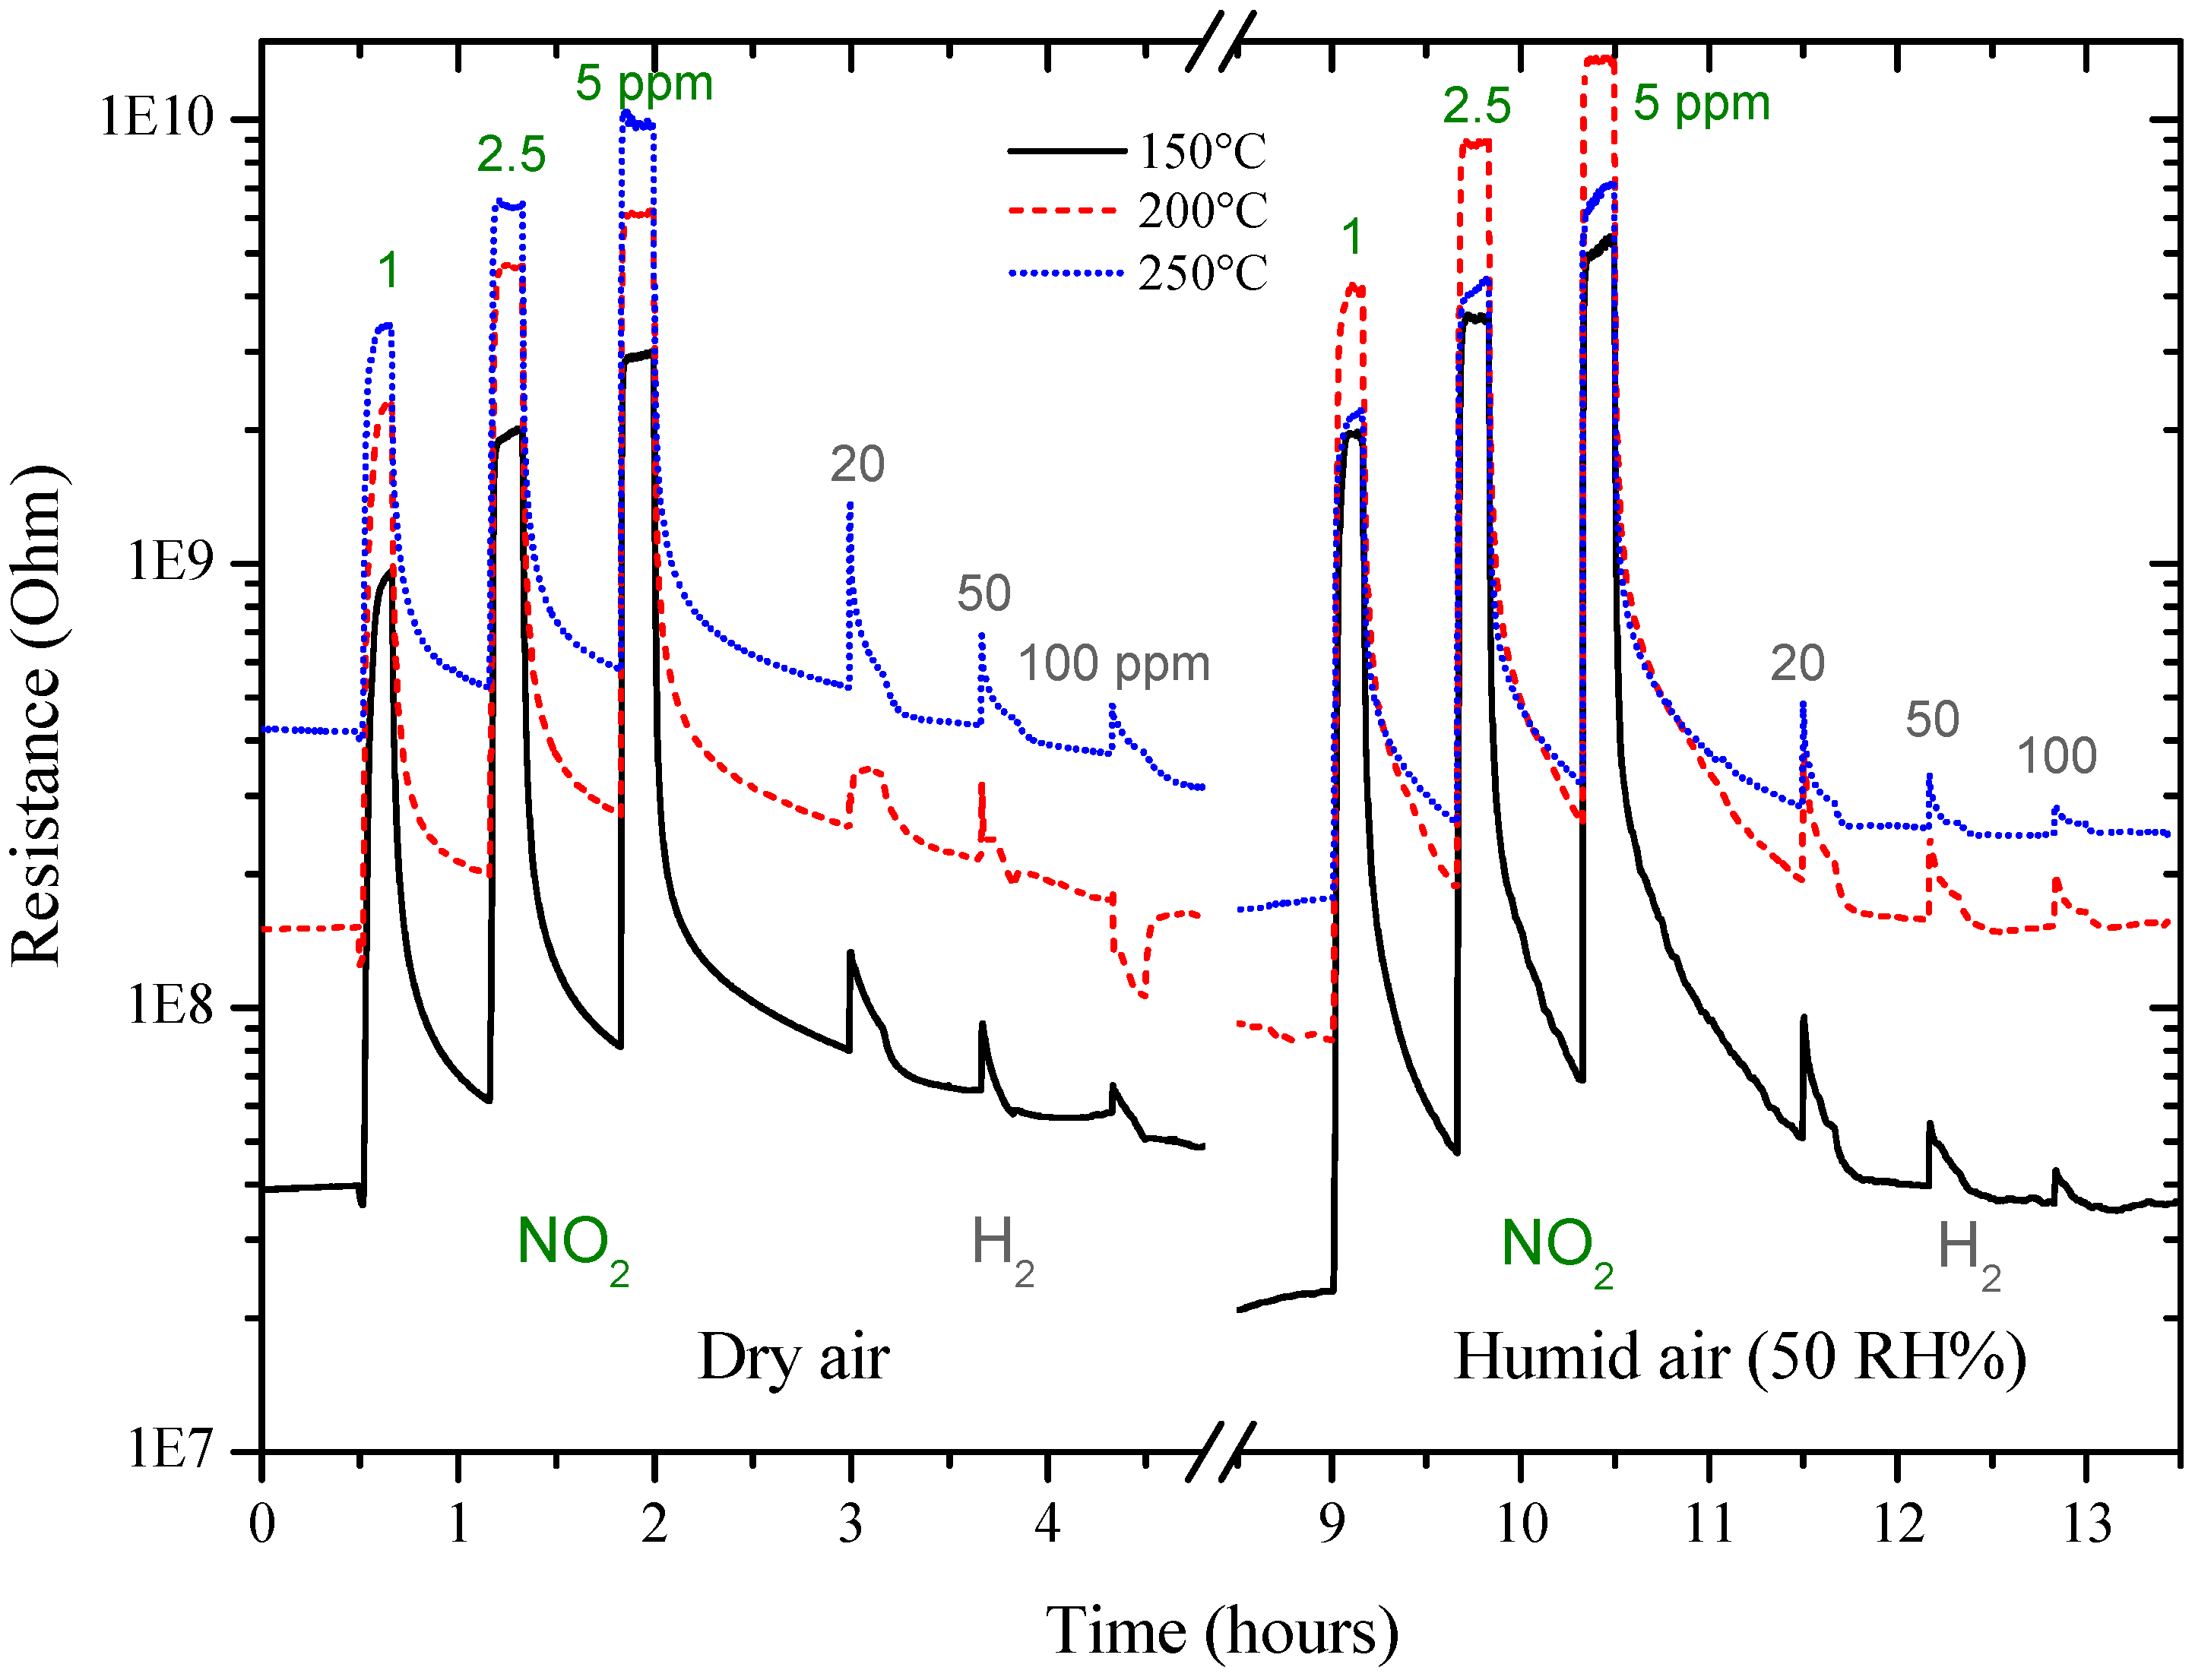
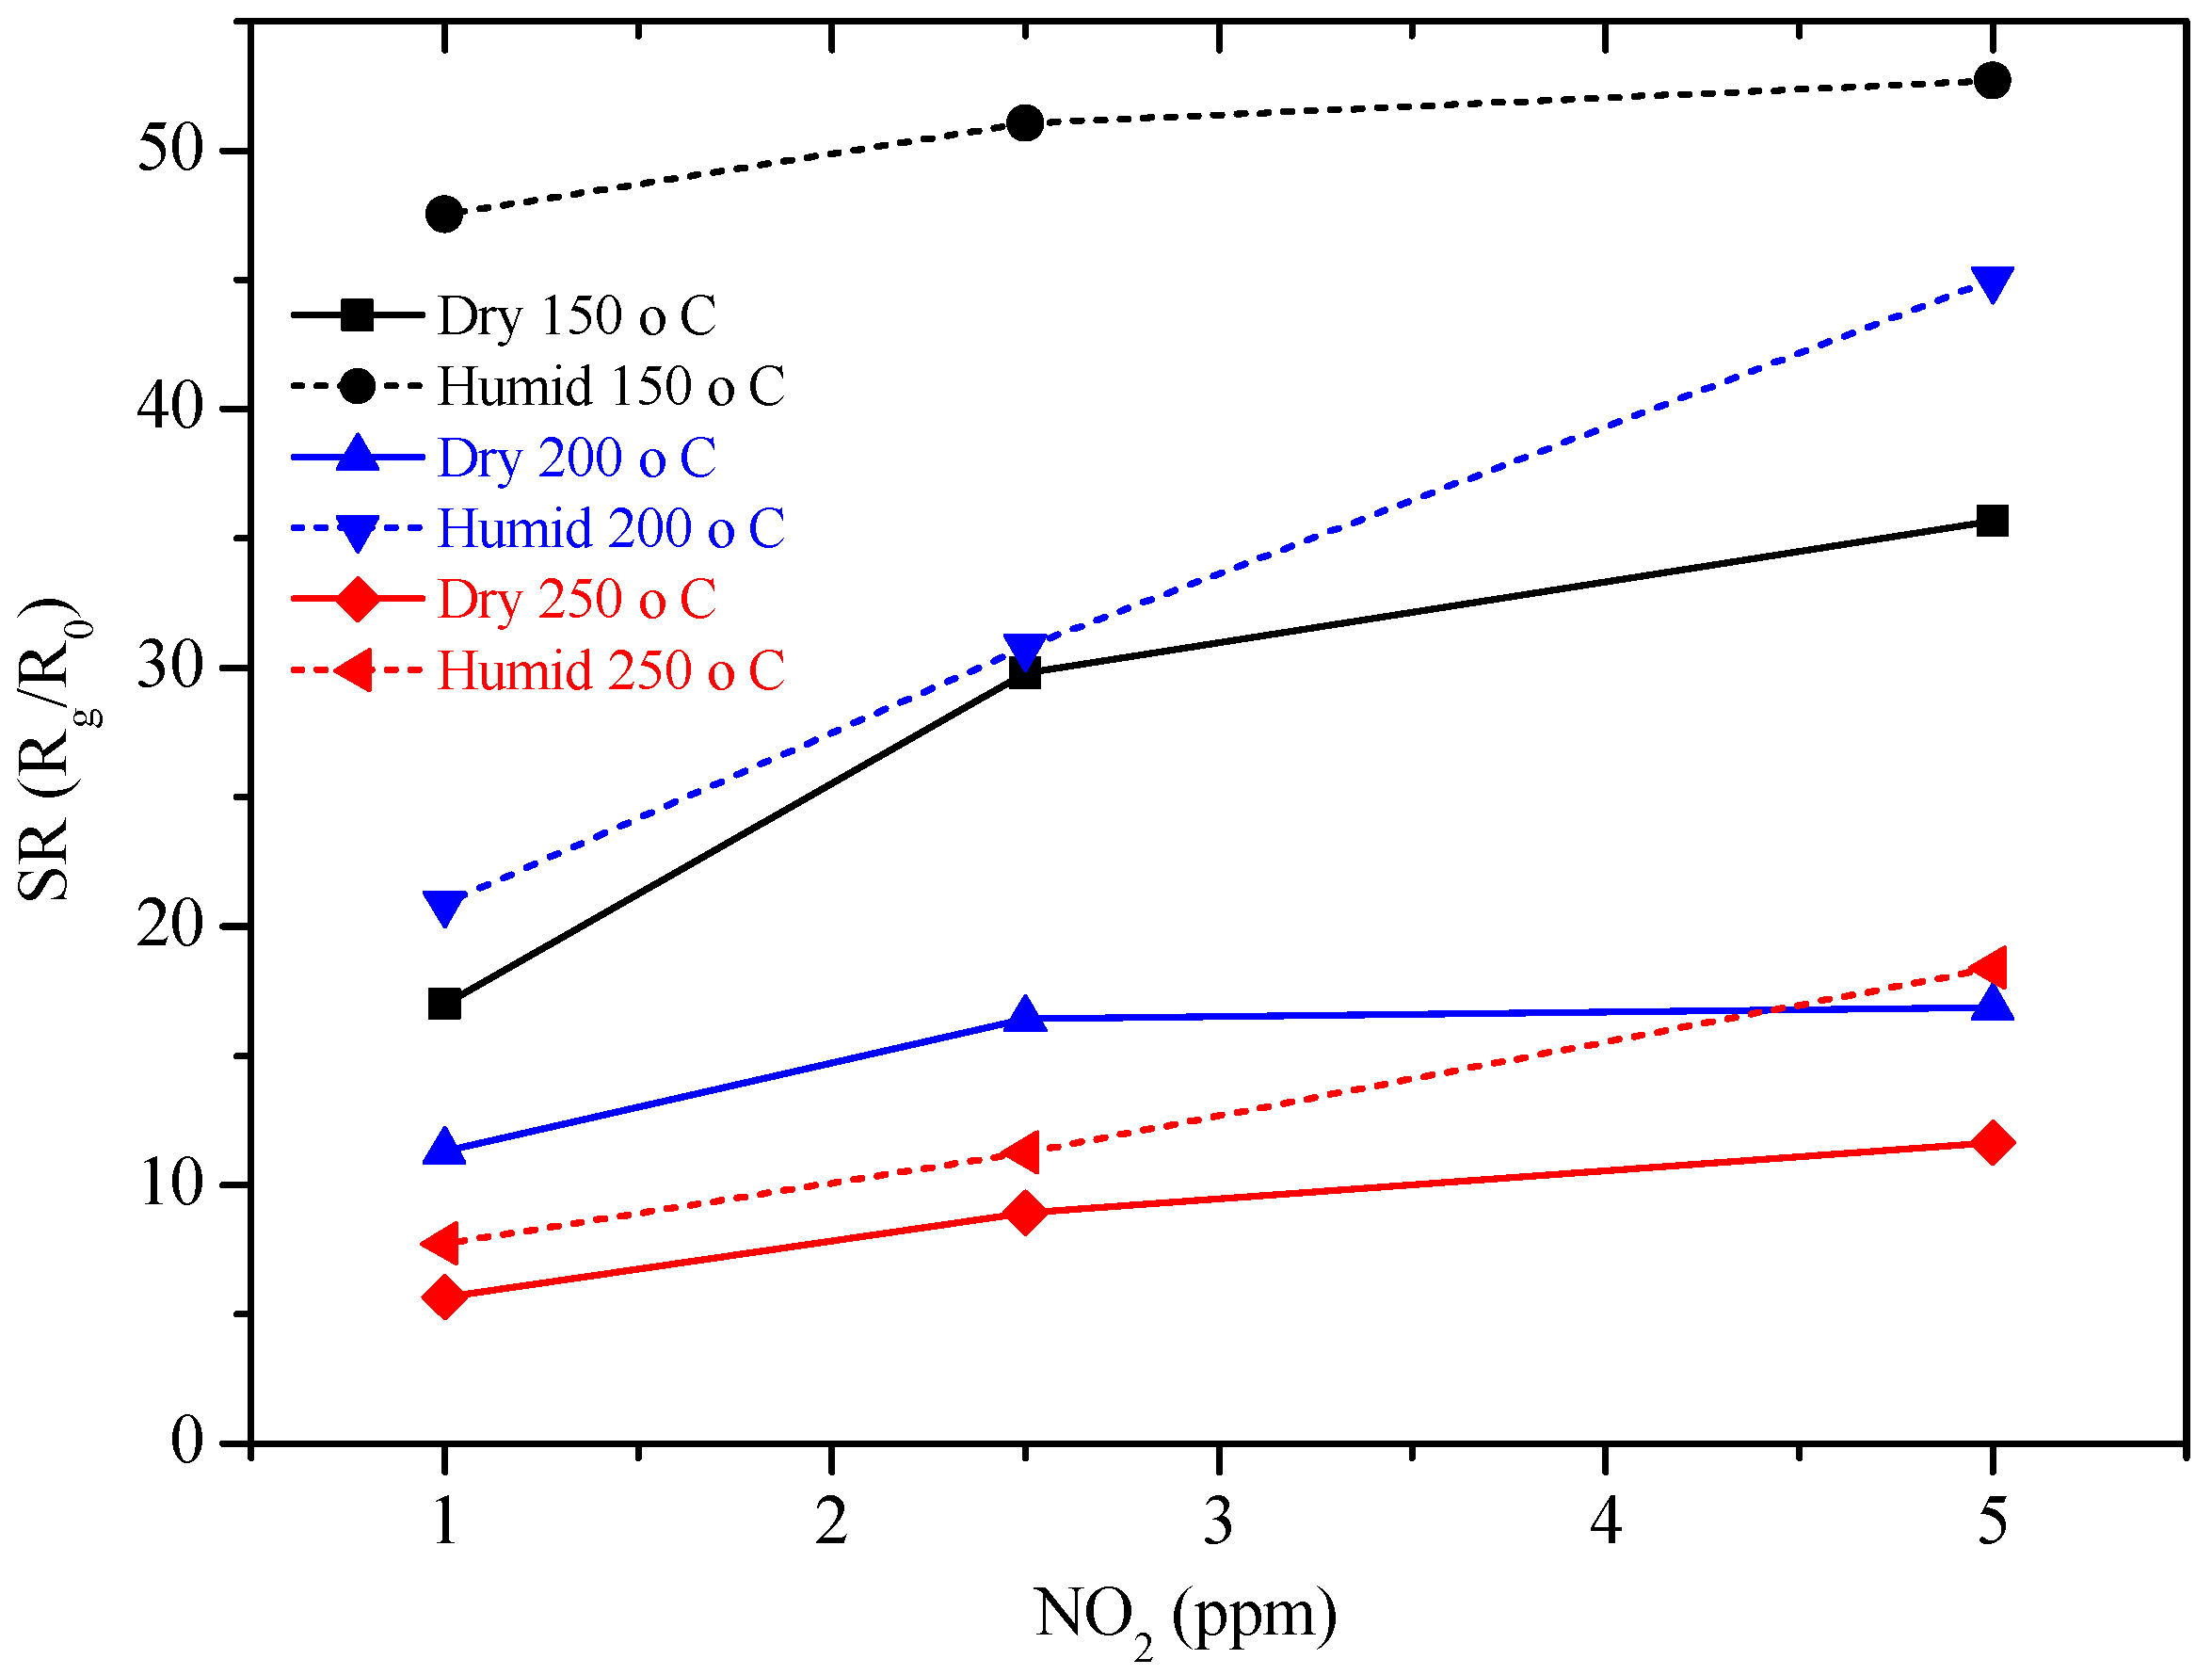
3.7. Sensitivity towards H2 and NO2 at High Temperature

The screen-printed sensors were then tested by DC resistance measurements under different concentrations of an oxidizing gas (NO2 1, 2.5, 5 ppm), first and then, of a reducing gas (H2 20, 50, 100 ppm), in dry and humid air (50%) at different temperatures (Figure 10).
From preliminary measurements, no response to the targeted gases was observed and the sensors showed very high resistance values, around 100 GΩ, probably because of the limited adhesion to the alumina substrates. Thus, to improve the adhesion and to decrease the resistance of the screen-printed sensing film, a sol-gel phase based on ZnO was added to the as prepared glass ceramic powder, as follows: 200 mg of zinc acetate dihydrate (Sigma Aldrich, Milan, Italy) was dissolved in 0.625 cm3 ethanol, and subsequently 0.066 mL monoethanolamine (MEA, Sigma Aldrich, Milan, Italy) was added under stirring. After 30 min, 0.625 mL of Emflow (a mix of terpinols from Emca Remex, Montgomeryville, PA, USA) were added and after 5 more min of stirring, 70 wt% of liquid was added to the as prepared glass ceramic powder [22]. Then, the paste was screen printed over the alumina substrates with interdigitated Pt electrodes. FE-SEM observations of the new films were done and are reported in Figure 9. After thermal treatment, the screen-printed film is still porous as illustrated in Figure 9a–c. The cracks visible in Figure 9d were already seen on glass ceramics powder alone. The sol-gel phase probably led to the grains visible in Figure 9e, and is made of small particles as illustrated by Figure 9f.
From FE-SEM observations, the thickness of the screen-printed films is around 41 ± 7.2 µm (average of 10 measurements).
The new sensors were then tested by DC resistance measurements with the same pulse program previously used with GC sensors, under the same concentrations of NO2 (1, 2.5, 5 ppm) and of H2 (20, 50, 100 ppm), in a dry and humid air (50%), at 150, 200 and 250 °C. Sol-gel GC sample seems to be more sensitive to NO2 than H2, as shown in Figure 10 and the sensor’s resistance always increased, whatever the gas considered. The higher the temperature, the higher the resistance value is (Figure 10). The sensor response to different concentrations of NO2 were determined and are shown in Figure 11. Response time, defined as the time required to reach 90% of the final equilibrium resistance value after gas injection, of sol-gel GC sensor towards NO2 at 150, 200 and 250 °C were calculated from Figure 10 and are listed in Table 3. Considering these results, the shortest response times towards NO2 were reached at 250 °C, under dry and humid air (Figure 12). Recovery times were not determined because during these measurements the sensor resistance was not always allowed to reach the baseline value. Anyway, recovery times are estimated to be always much longer than response times (the resistance value slowly recovers its initial value before gas injection), indicating a rather strong binding between the sensing material and the target gas.

4. Discussion

The sensor response to different concentrations of NO2 evidenced that the sensitivity to humidity, almost absent at RT (Figure 8), is enhanced at higher temperatures (150–250 °C, Figure 10 and Figure 11). These results are rather surprising because the mechanisms involved are very different. At high temperatures, chemisorbed water molecules give electrons to the sensing material and, in case of a n-type semiconductor, its resistance decreases. On the contrary, at room temperature, the resistance decrease is due to capillary condensation in pores, or to water molecules hopping, especially at higher RH values. A possible explanation may be because, when present, water molecules form a layer of OH ions on the oxide surface which tends to lower the number of chemisorbed oxygen species. This surface covering by water molecules reduces the available sites for NO2 and H2 molecules to adsorb and thus, deteriorates sensor performances [23,24]. In any case, the higher the working temperature, the lower the influence of water vapor is (Figure 11).
Undoped zinc oxide (ZnO) is a well-known intrinsic n-type semiconductor having a wide band gap (3.37 eV) due to the presence of intrinsic defects (oxygen vacancies and zinc interstitials). Bi2WO6 is also a n-type semiconductor but with a lower band gap (2.7–2.8 eV) respect to ZnO [25]. Then, in the glass ceramic, ZnO and Bi2WO6 may form a n-n heterojunction if the phases are in contact together. At temperatures between 100 and 500 °C, the presence of atmospheric oxygen leads to the formation of adsorbed layers of molecular (O2) and/or atomic (O, O2−) oxygen ions. It is known in literature that below 150 °C, the molecular form dominates and above this temperature the ionic species dominate [26]. In any case, these species lead to the formation of a depletion layer at the surface of a semiconducting oxide due to electrons trapping [27,28]. However, in a n-type semiconductor, NO2 does not react with pre-adsorbed oxygen and the sensors’ resistance changes are due to a direct chemisorption process [29]. A series of reactions (Equations (4)–(6) leading to nitrates and nitrites formation is reported in Ref. [30]:
N O 2 + é ( c . b . ) N O 2 ,
N O 2 + V O N O 2 + V O ,
2 N O 2 + O 2 + é ( c . b . ) 2 N O 3 ,
2 N O 2 + O 2 + V O ( c . b . ) 2 N O 3 + V O ,
N O 2 + O N O 3 ,
In surface reactions (4) and (5), electrons from the conduction band are trapped when surface species are formed, but not in reaction (6). If nitrates are formed according to Equation (6), a further equilibrium must be taken into consideration due to NO3- dissociation (Equation (7)):
N O 3 + é ( c . b . ) N O + 2 O ,
N O 3 + V O N O + 2 O + V O ,
In Figure 10, the resistance of the GC sensor increased upon exposure to NO2, as expected for a n-type semiconductor, suggesting that the detection mechanism can be associated with the previous reactions. However, surprisingly, the sensor resistance increased in the presence of H2 molecules too (Figure 10). This behavior can be explained considering that n to p transitions have been already observed in several semiconducting oxides throughout the years [31,32]. In the case of ZnO nanotubes, since the surface conduction is due to both electrons and holes contribution, the change of majority carrier density can lead to the inversion of the type of mobile carriers at the surface [32]. Variations of majority carrier density may be explained considering Equations (4a) and (5a) where electrons from the conduction band are trapped by adsorbed H2 molecules and then, their concentration becomes lower than the concentration of holes [30,31]. These results could explain the observed n to p transition. To support this hypothesis, this behavior is generally observed in the temperature range 200–250 °C, where the presence of both the molecular and atomic oxygen species is probable [31,32]. However, further investigation is needed to better understand the origin of such anomaly.
Though the response of our sensor in the sub-ppm NO2 concentration range was not explored, the observed results are comparable with the latest found in literature for ZnO-based sensors (Table 4).

5. Conclusions

A glass–crystalline material containing ZnO as the primary crystalline phase was successfully produced by melt quenching technique. A gas sensor was then fabricated using a ZnO sol-gel phase as a permanent binder of the glass ceramic to the alumina substrate. The sensor response depends on the operating temperature and on the concentration of the target gas. The highest response to NO2 was observed at an operating temperature of 150 °C. However, a certain interference with water vapor was evidenced at this temperature, even if the higher the working temperature (250 °C in our case), the lower the influence of water vapor is. Another possible solution to limit water vapor interferences is to reduce the porosity of the film, as already proposed in Ref. [52], although the counterpart can be a certain loss of sensitivity. A last solution could be to grow ZnO nanotubes on top of glass ceramic grains from sol-gel solution [53]. In this case, a higher hydrophobicity of the surface coated with needles can be obtained [53], by mimicking the lotus effect [54]. To conclude, glass ceramic materials are promising in sensors application not only as humidity sensors but also for detecting other gases.

Acknowledgments

M.H. and A.S.A. are grateful for the financial support of Erasmus Mundus External cooperation window, FFEEBB and WELCOME projects action 2. The authors express their deep acknowledges to Udo Weimar and Nicolae Bârsan from the Universität Tübingen, Institut für Physikalische und Theoretische Chemie, Tübingen, Baden-Wurttemberg, Germany, for their help, the access to laboratory facilities and the fruitful discussions. Susan Wicker is also acknowledged for testing gas sensors.

Author Contributions

M.H., D.M. and J.M.T. conceived and designed the experiments; M.H., A.S.A. and M.A. performed the experiments; All the Authors analyzed the data; M.H. and J.M.T. wrote the paper.

Conflicts of Interest

The authors declare no conflict of interest.

References

  1. Akbar, S.A.; Park, C.-O. Guest editorial: Chemical sensors for pollution monitoring and control. J. Mater. Sci. 2003, 38, 4237. [Google Scholar] [CrossRef]
  2. Kim, H.-J.; Lee, J.-H. Highly sensitive and selective gas sensors using p-type oxide semiconductors: Overview. Sens. Actuators B Chem. 2014, 192, 607–627. [Google Scholar] [CrossRef]
  3. Kanan, S.M.; El-Kadri, O.M.; Abu-Yousef, I.A.; Kanan, M.C. Semiconducting metal oxide based sensors for selective gas pollutant detection. Sensors 2009, 9, 8158–8196. [Google Scholar] [CrossRef] [PubMed]
  4. Siriwong, C.; Wetchakun, K.; Wisitsoraat, A.; Phanichphant, S. Gas sensing properties of WO3-doped ZnO nanoparticles synthesized by flame spray pyrolysis. In Proceedings of the IEEE Sensors Conference, Christchurch, New Zealand, 25–28 October 2009; pp. 118–122. [Google Scholar] [CrossRef]
  5. Wetchakun, K.; Samerjai, T.; Tamaekong, N.; Liewhiran, C.; Siriwong, C.; Kruefu, V.; Wisitsoraat, A.; Tuantranont, A.; Phanichphant, S. Semiconducting metal oxides as sensors for environmentally hazardous gases. Sens. Actuator B Chem. 2011, 160, 580–591. [Google Scholar] [CrossRef]
  6. Stankova, M.; Vilanova, X.; Calderer, J.; Llobet, E.; Brezmes, J.; Gràcia, I.; Cané, C.; Correig, X. Sensitivity and selectivity improvement of rf sputtered WO3 micro hot plate gas sensors. Sens. Actuators B Chem. 2006, 113, 241–248. [Google Scholar] [CrossRef]
  7. Rotzetter, A.C.C.; Luechinger, N.A.; Athanassiou, E.K.; Mohn, D.; Koehler, F.M.; Grass, R.N. Sintering of core–shell Ag/glass nanoparticles: Metal percolation at the glass transition temperature yields metal/glass/ceramic composites. J. Mater. Chem. 2010, 20, 7769–7775. [Google Scholar] [CrossRef]
  8. Razza, N.; Blanchet, B.; Lamberti, A.; Pirri, F.C.; Tulliani, J.-M.; Bozano, L.D.; Sangermano, M. UV-Printable and Flexible Humidity Sensors Based on Conducting/Insulating Semi-Interpenetrated Polymer Networks. Macromol. Mater. Eng. 2017, 302. [Google Scholar] [CrossRef]
  9. Gwirc, S.N. Glass modified sensitive surface thick film humidity sensor. Sens. Actuators B Chem. 1994, 18–19, 107–110. [Google Scholar] [CrossRef]
  10. Kokubu, T.; Nakahara, Y.; Yamane, M.; Aizawa, M. Electrical and electrochemical properties of TiO2-SiO2 porous glass ceramics and their application. J. Electroanal. Chem. 1993, 347, 123–136. [Google Scholar] [CrossRef]
  11. Yamamoto, K.; Kasuga, T.; Nogami, M. An oxygen sensor based on copper(I)-conducting CuTi2(PO4)3 glass ceramics. Appl. Phys. Lett. 1998, 73, 3297–3299. [Google Scholar] [CrossRef]
  12. Yamamoto, K.; Kasuga, T.; Nogami, M. Copper-conducting NASICON-type CuTi2(PO4)3 glass-ceramics for application to a novel O2 sensor. Mater. Res. Soc. Symp. Proc. 1999, 548, 641–646. [Google Scholar] [CrossRef]
  13. Ambekar, P.; Randhawa, J.; Bhoga, S.S.; Singh, K. Galvanic CO2 Sensor with Li2O: B2O3 Glass Ceramics Based Composite. Ionics 2004, 10, 45–49. [Google Scholar] [CrossRef]
  14. Tripathy, M.R.; Joshi, R.; Mehra, N.C.; Kumar, S.; Tandon, R.P. Electrical conduction and gas sensing characteristics of 15Fe2O3–5ZnO–80TeO2. Mater. Lett. 2007, 61, 585–587. [Google Scholar] [CrossRef]
  15. Karakuscu, A.; Ponzoni, A.; Aravind, P.R.; Sberveglieri, G.; Soraru, G.D. Gas Sensing Behavior of Mesoporous SiOC Glasses. J. Am. Ceram. Soc. 2013, 96, 2366–2369. [Google Scholar] [CrossRef]
  16. Barde, R.V.; Waghuley, S.A. V2O5-P2O5 Glass Ceramic as a Resistive Solid-State CO2 Gas Sensor. Asian J. Chem. 2012, 24, 5622–5624. [Google Scholar]
  17. Milanova, M.; Iordanova, R.; Aleksandrov, L.; Hassan, M.; Dimitriev, Y. Glass formation and structure of glasses in the ZnO-Bi2O3-WO3-MoO3 system. J. Non-Cryst. Solids 2011, 357, 2713–2718. [Google Scholar] [CrossRef]
  18. Ataalla, M.; Milanova, M.; Hassan, M.; Afify, A.S.; Tulliani, J.M.; Dimitriev, Y. Nano- and microsized phases in the WO3-ZnO-Nd2O3-Al2O3 system for applications in environmental monitoring. In NATO Science for Peace and Security Series A: Chemistry and Biology; Petkov, P., Tsiulyanu, D., Kulisch, W., Popov, C., Eds.; Springer: Dordrecht, The Netherlands, 2015; pp. 451–459. ISBN 978-94-017-9699-6. [Google Scholar]
  19. Tulliani, J.-M.; Bonville, P. Influence of the dopants on the electrical resistance of hematite-based humidity sensors. Ceram. Int. 2005, 31, 507–514. [Google Scholar] [CrossRef]
  20. Tulliani, J.-M.; Cavalieri, A.; Musso, S.; Sardella, E.; Geobaldo, F. Room temperature ammonia sensors based on zinc oxide and functionalized graphite and multi-walled carbon nanotubes. Sens. Actuators B Chem. 2011, 152, 144–154. [Google Scholar] [CrossRef]
  21. Simmendinger, W.; Oprea, A.; Bârsan, N.; Weimar, U. Non-conventional Phthalocyanines for field effect gas detection. Sens. Actuators B Chem. 2013, 179, 54–60. [Google Scholar] [CrossRef]
  22. Della Gaspera, E.; Guglielmi, M.; Martucci, A.; Giancaterini, L.; Cantalini, C. Enhanced optical and electrical gas sensing response of sol–gel based NiO–Au and ZnO–Au nanostructured thin films. Sens. Actuators B Chem. 2012, 164, 54–63. [Google Scholar] [CrossRef]
  23. Traversa, E. Ceramic sensors for humidity detection: The state-of-the-art and future developments. Sens. Actuators B Chem. 1995, 23, 135–156. [Google Scholar] [CrossRef]
  24. Wang, C.; Yin, L.; Zhang, L.; Xiang, D.; Gao, R. Metal oxide gas sensors: Sensitivity and influencing factors. Sensors 2010, 10, 2088–2106. [Google Scholar] [CrossRef] [PubMed]
  25. Hilla, J.C.; Choi, K.-S. Synthesis and characterization of high surface area CuWO4 and Bi2WO6 electrodes for use as photo anodes for solar water oxidation. J. Mater. Chem. A 2013, 1, 5006–5014. [Google Scholar] [CrossRef]
  26. Bârsan, N.; Weimar, U. Conduction model of metal oxide gas sensors. J. Electroceram. 2001, 7, 143–167. [Google Scholar] [CrossRef]
  27. Xue, X.; Nie, Y.; He, B.; Xing, L.; Zhang, Y.; Wang, Z.L. Surface free-carrier screening effect on the output of a ZnO nanowire nanogenerator and its potential as a self-powered active gas sensor. Nanotechnology 2013, 24, 225501. [Google Scholar] [CrossRef] [PubMed]
  28. Wang, P.; Fu, Y.; Yu, B.; Zhao, Y.; Xing, L.; Xue, X. Realizing room-temperature self-powered ethanol sensing of ZnO nanowire arrays by combining their piezoelectric, photoelectric and gas sensing characteristics. J. Mater. Chem. A 2015, 3, 3529–3535. [Google Scholar] [CrossRef]
  29. Berger, O.; Hoffmann, T.; Fischer, W.-J.; Melev, V. Influence of microstructure of tungsten oxide thin films on their general performance as ozone and NOx gas sensor. In Smart Sensors, Actuators, and MEMS, Proceedings of the Microtechnologies for the New Millennium, Maspalomas, Gran Canaria, Canary Islands, Spain, 19–21 May 2003; Chiao, J.-C., Varadan, V.K., Cané, C., Eds.; Society of Photo-Optical Instrumentation Engineers (SPIE): Washington, DC, USA, 2003; pp. 870–881. [Google Scholar] [CrossRef]
  30. Chiorino, A.; Ghiotti, G.; Prinetto, F.; Carotta, M.C.; Gnani, D.; Martinelli, G. Preparation and characterization of SnO2 and MoOx–SnO2 nanosized powders for thick films gas sensors. Sens. Actuators B Chem. 1999, 58, 338–349. [Google Scholar] [CrossRef]
  31. Gurlo, A.; Bârsan, N.; Oprea, A.; Sahm, M.; Sahm, T.; Weimar, U. An n- to p-type conductivity transition induced by oxygen adsorption on α-Fe2O3. Appl. Phys. Lett. 2004, 85, 2280–2282. [Google Scholar] [CrossRef]
  32. Pati, S.; Banerji, P.; Majumder, S.B. N- to p-type carrier reversal in nanocrystalline indium doped ZnO thin film gas sensors. Int. J. Hydrogen Energy 2014, 39, 15134–15141. [Google Scholar] [CrossRef]
  33. Liu, S.; Yu, B.; Zhang, H.; Fei, T.; Zhang, T. Enhancing NO2 gas sensing performances at room temperature based on reduced graphene oxide–ZnO nanoparticles hybrids. Sens. Actuators B Chem. 2014, 202, 272–278. [Google Scholar] [CrossRef]
  34. Abideen, Z.U.; Katoch, A.; Kim, J.-H.; Kwon, Y.J.; Kim, H.W.; Kim, S.S. Excellent gas detection of ZnO nanofibers by loading with reduced graphene oxide nanosheets. Sens. Actuators B Chem. 2015, 221, 1499–1507. [Google Scholar] [CrossRef]
  35. Cho, P.S.; Kim, K.W.; Lee, J.H. NO2 sensing characteristics of ZnO nanorods prepared by hydrothermal method. J. Electroceram. 2006, 17, 975–978. [Google Scholar] [CrossRef]
  36. Albiss, B.A.; Sakhaneh, W.A.; Jumah, I.; Obaidat, I.M. NO2 Gas Sensing Properties of ZnO/Single-Wall Carbon Nanotube Composites. IEEE Sens. J. 2010, 10, 1807–1812. [Google Scholar] [CrossRef]
  37. Öztürk, S.; Kılınç, N.; Öztürk, Z.Z. Fabrication of ZnO nanorods for NO2 sensor applications: Effect of dimensions and electrode position. J. Alloys Compd. 2013, 581, 196–201. [Google Scholar] [CrossRef]
  38. Vyas, R.; Sharma, S.; Gupta, P.; Prasad, A.K.; Dhara, S.K.; Tyagi, A.K.; Sachdev, K.; Sharma, S.K. Nitrogen dioxide induced conductivity switching in ZnO thin film. J. Alloys Compd. 2013, 571, 6–11. [Google Scholar] [CrossRef]
  39. Li, J.; Zhang, W.; Sun, J. Enhanced NO2 detection using hierarchical porous ZnO nanoflowers modified with graphene. Ceram. Int. 2016, 42, 9851–9857. [Google Scholar] [CrossRef]
  40. Vanalakara, S.A.; Patil, V.L.; Harale, N.S.; Vhanalakar, S.A.; Gang, V.; Kim, V.; Patil, P.S.; Kim, J.H. Controlled growth of ZnO nanorod arrays via wet chemical route for NO2 gas sensor applications. Sens. Actuators B Chem. 2015, 221, 1195–1201. [Google Scholar] [CrossRef]
  41. Li, X.; Wang, J.; Xie, D.; Xu, J.; Xia, Y.; Xiang, L. Enhanced p-type NO2-sensing properties of ZnO nanowires utilizing CNTs electrode. Mater. Lett. 2017, 206, 18–21. [Google Scholar] [CrossRef]
  42. Rane, Y.N.; Shende, D.A.; Raghuwanshi, M.G.; Ghule, A.V.; Patil, V.L.; Patil, P.S.; Gosavi, S.R.; Deshpande, N.G. Synthesis of flower shaped ZnO thin films for resistive sensing of NO2 gas. Microchim. Acta 2017, 184, 2455–2463. [Google Scholar] [CrossRef]
  43. Sayago, I.; Hontañón, E.; Aleixandre, M.; Fernández, M.J.; Santos, J.P.; Gràcia, I. ZnO and ZnO/SnO2 nanofibers as resistive gas sensors for NO2 detection. In Proceedings of the 2017 Spanish Conference on Electron Devices, CDE, Barcelona, Spain, 8–10 February 2017; Institute of Electrical and Electronics Engineers (IEEE): New York, NY, USA, 2017; pp. 1–4. [Google Scholar] [CrossRef]
  44. Oh, E.; Choi, H.-Y.; Jung, S.-H.O.; Cho, S.; Kim, J.C.; Lee, K.-H.; Kang, S.-W.; Kim, J.; Yun, J.-Y.; Jeong, S.-H. High-performance NO2 gas sensor based on ZnO nanorod grown by ultrasonic irradiation. Sens. Actuators B Chem. 2009, 141, 239–243. [Google Scholar] [CrossRef]
  45. Navale, Y.H.; Navale, S.T.; Ramgir, N.S.; Stadler, F.J.; Gupta, S.K.; Aswal, D.K.; Patil, V.B. Zinc oxide hierarchical nanostructures as potential NO2 sensors. Sens. Actuators B Chem. 2017, 251, 551–563. [Google Scholar] [CrossRef]
  46. Patil, V.L.; Vanalakara, S.A.; Patil, P.S.; Kim, J.H. Fabrication of nanostructured ZnO thin films based NO2 gas sensor via SILAR technique. Sens. Actuators B Chem. 2017, 239, 1185–1193. [Google Scholar] [CrossRef]
  47. Geng, X.; Zhang, C.; Luo, Y.; Debliquy, M. Flexible NO2 gas sensors based on sheet-like hierarchical ZnO1−x coatings deposited on polypropylene papers by suspension flame spraying. J. Taiwan Inst. Chem. Eng. 2017, 75, 280–286. [Google Scholar] [CrossRef]
  48. Fan, F.; Feng, Y.; Bai, S.; Feng, J.; Chen, A.; Li, D. Synthesis and gas sensing properties to NO2 of ZnO nanoparticles. Sens. Actuators B Chem. 2013, 185, 377–382. [Google Scholar] [CrossRef]
  49. Xia, Y.; Wang, J.; Li, X.; Xie, D.; Zhou, D.; Xiang, L.; Komarneni, S. Nanoseed-assisted rapid formation of ultrathin ZnO nanorods for efficient room temperature NO2 detection. Ceram. Int. 2016, 42, 15876–15880. [Google Scholar] [CrossRef]
  50. Shingange, K.; Swart, H.C.; Mhlongo, G.H. Au functionalized ZnO rose-like hierarchical structures and their enhanced NO2 sensing performance. Physica B 2017. [Google Scholar] [CrossRef]
  51. Hassan, M.; Afify, A.S.; Tulliani, J.M. Synthesis of ZnO Nanoparticles onto Sepiolite Needles and Determination of Their Sensitivity toward Humidity, NO2 and H2. J. Mater. Sci. Technol. 2016, 32, 573–582. [Google Scholar] [CrossRef]
  52. Tulliani, J.-M.; Baroni, C.; Lopez, C.; Dessemond, L. New NOx sensors based on hematite doped with alkaline and alkaline-earth elements. J. Eur. Ceram. Soc. 2011, 31, 2357–2364. [Google Scholar] [CrossRef]
  53. Vallejos, S.; Gràcia, I.; Pizúrová, N.; Figueras, E.; Hubálek, J.; Cané, C. Tuning of the Humidity-Interference in Gas Sensitive Columnar ZnO Structures. In Proceedings of the Eurosensors Conference 2017, Paris, France, 3–6 September 2017; MDPI: Basel, Switzerland, 2017. [Google Scholar] [CrossRef]
  54. Patankar, N.A. Mimicking the Lotus Effect: Influence of Double Roughness Structures and Slender Pillars. Langmuir 2004, 20, 8209–8213. [Google Scholar] [CrossRef] [PubMed]
Figure 1. Flow-chart of the sensing material and of the sensors preparation and characterization.
Sensors 17 02538 g001
Figure 2. Ternary diagram of ZnO-Bi2O3-WO3 system, where (○) indicate glasses and (●) crystalline phases; ( Sensors 17 02538 i001) 58ZnO:4Bi2O3:4WO3:33.3B2O3.
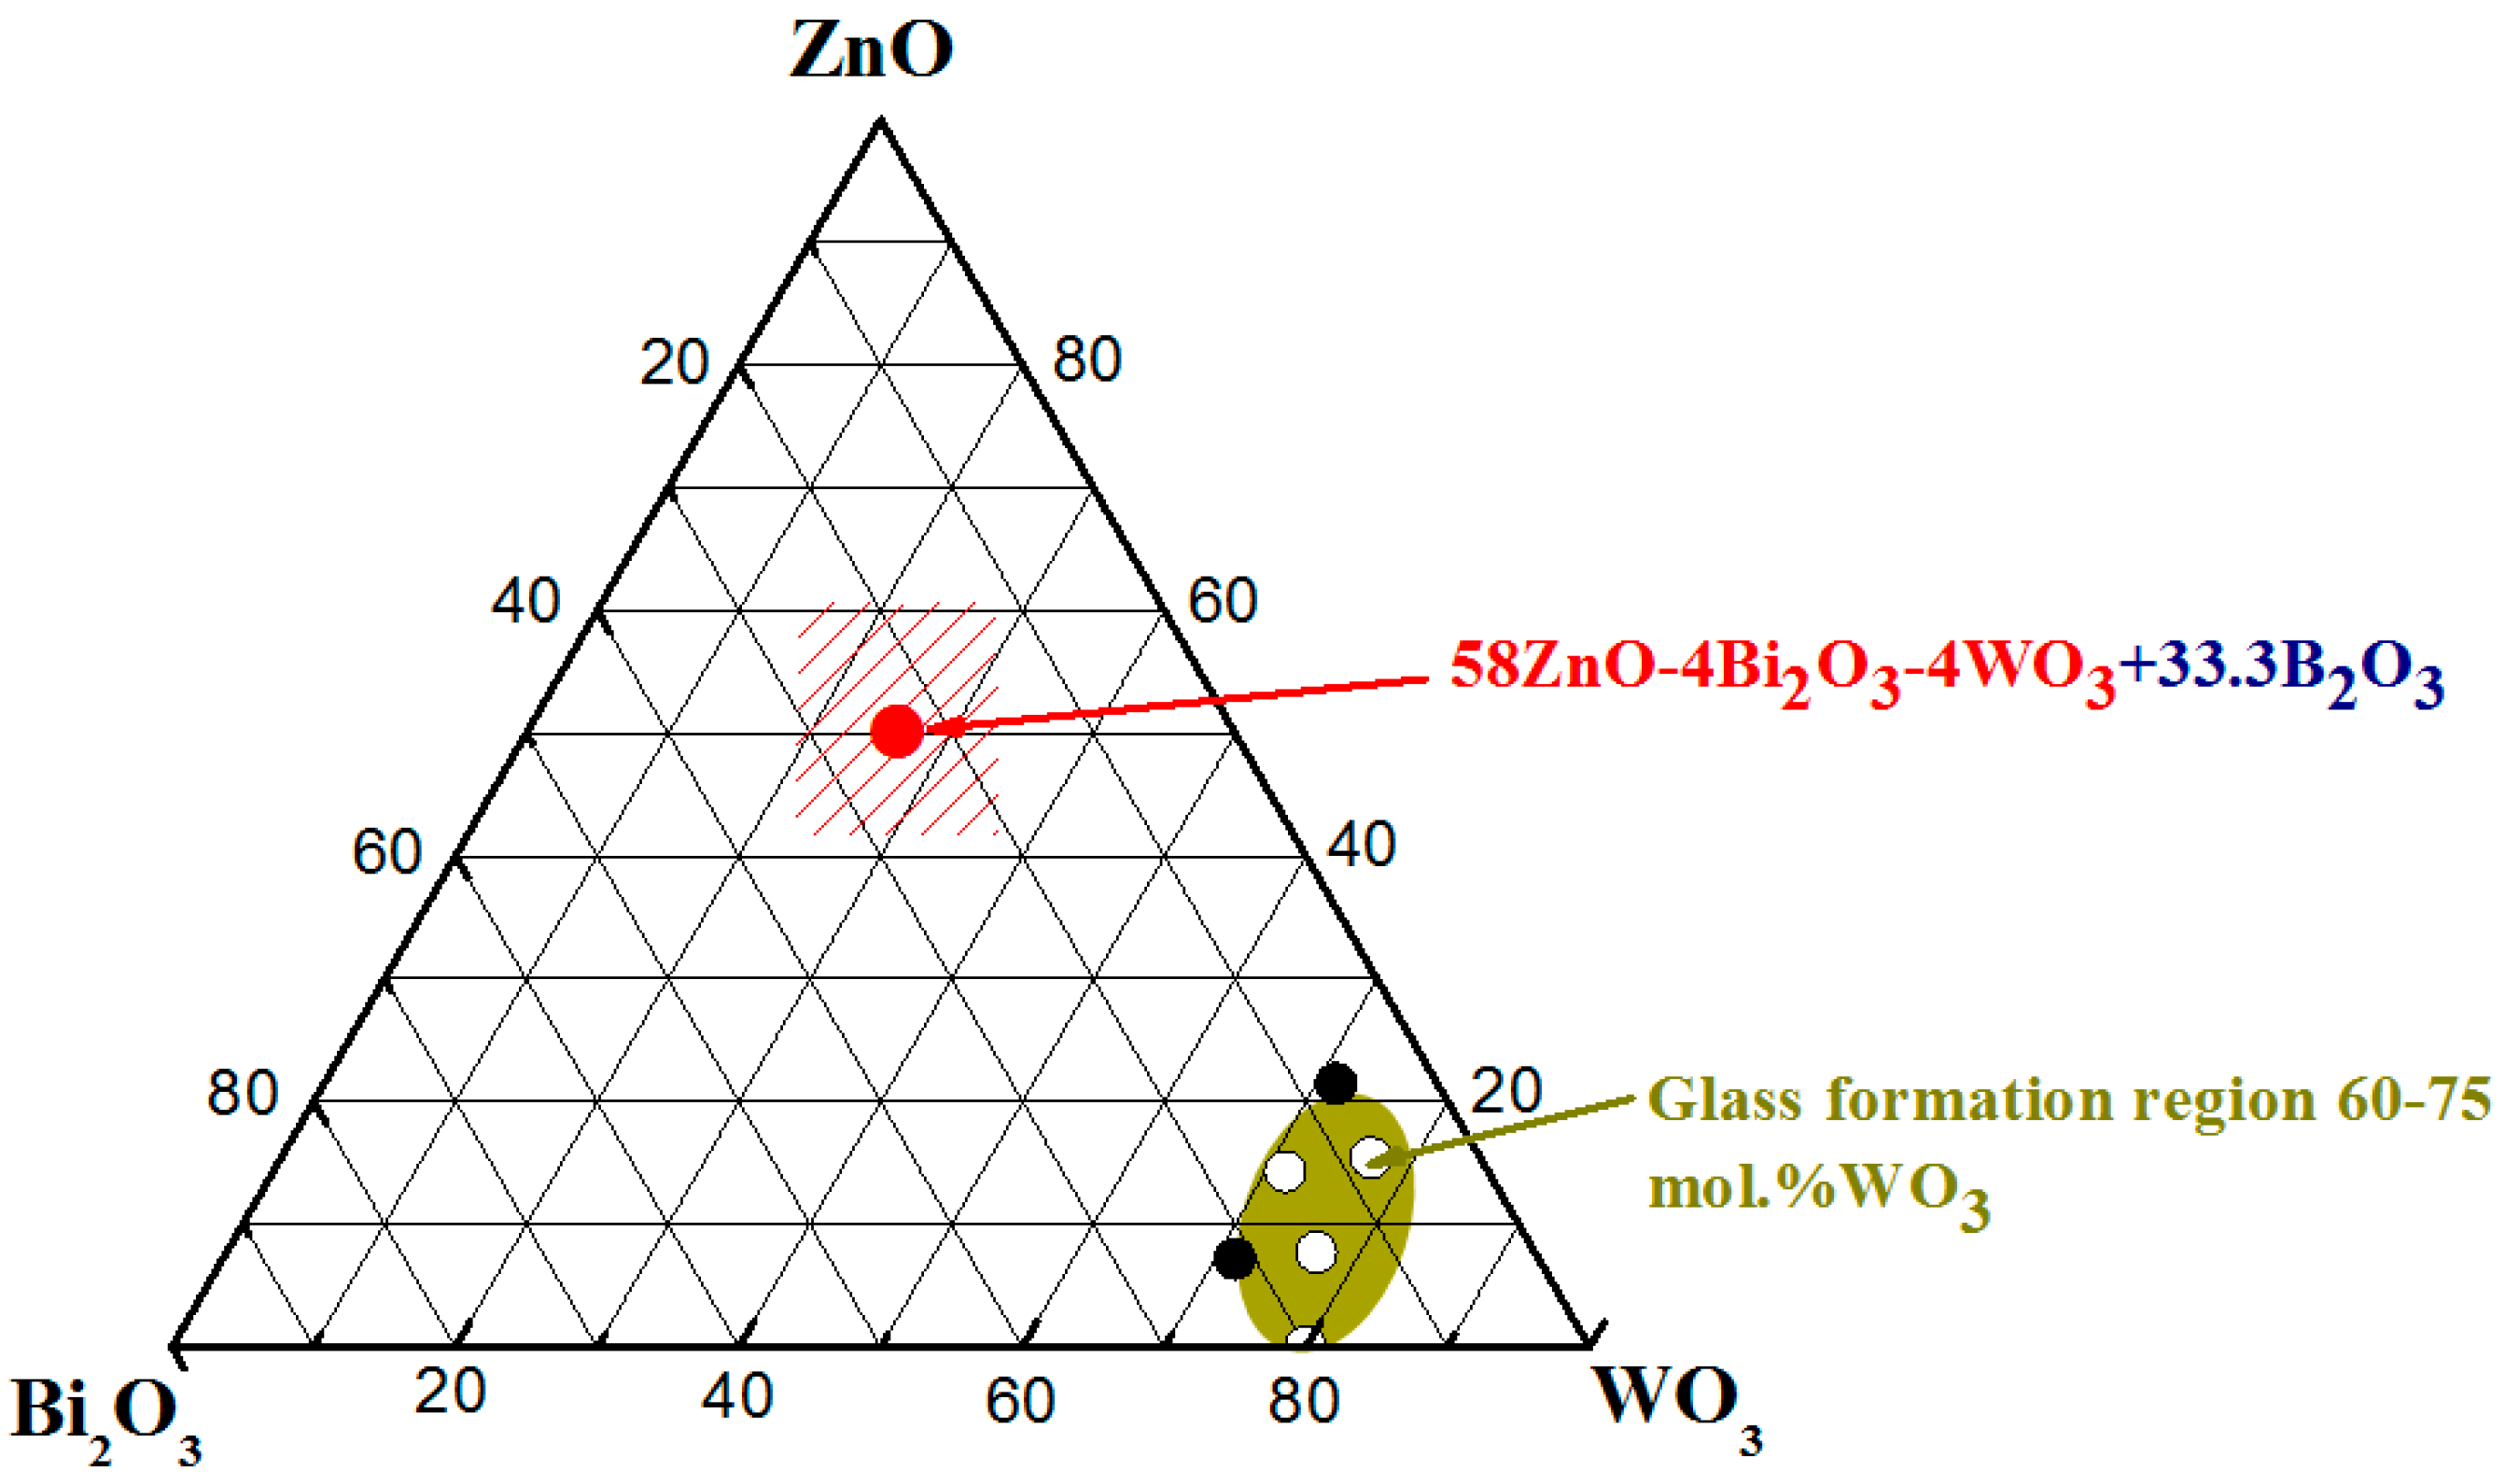
Sensors 17 02538 g002
Figure 3. Screen-printed glass ceramic (GC) film onto alumina substrate with Pt interdigitated electrodes.
Sensors 17 02538 g003
Figure 4. DTA curve of glass with nominal composition 58ZnO:4Bi2O3:4WO3:33.3B2O3.
Sensors 17 02538 g004
Figure 5. Particle size distribution of glass–ceramic powder before and after sonication.
Sensors 17 02538 g005
Figure 6. XRD pattern of glass ceramic with nominal composition 58ZnO:4WO3:4Bi2O3:33.4B2O3 heat treated at 500 °C for 15 h.
Sensors 17 02538 g006
Figure 7. FE-SEM micrographs of as prepared glass ceramic, magnification = 1000× (a); 50,000× (b).
Sensors 17 02538 g007
Figure 8. GC sensor response towards RH at RT.
Sensors 17 02538 g008
Figure 9. FE-SEM micrographs of sol-gel glass ceramic thick-film: pores in the screen-printed film (ac); cracks (d); small particles due to sol-gel phase (e); ZnO crystals from sol-gel phase (f).
Sensors 17 02538 g009
Figure 10. Resistance of sol-gel GC sensor at 150, 200 and 250 °C under NO2 and H2.
Sensors 17 02538 g010
Figure 11. Sensor response of GC sol-gel sensor at 150, 200 and 250 °C under NO2 in dry air and under 50 RH%.
Sensors 17 02538 g011
Figure 12. Response time of GC sol-gel sensor in function of NO2 concentration and temperature.
Sensors 17 02538 g012
Table 1. Diameter in micron of glass ceramic powder before and after sonication.
Cumulative wt% BelowBefore Sonication (µm)After Sonication (µm)
909767
503226
201411
Table 2. EDS results of the glass ceramic as prepared material.
At %
ElementCrystalMatrix
Zn84.9479.94
W0.853.35
Bi14.2116.71
Table 3. Response time of sol-gel GC sensor towards NO2 at 150, 200 and 250 °C.
[gas] (ppm)12.55
Response time (dry air 150 °C)5 min 10 s1 min 30 s22 s
Response time (humid air 150 °C)3 min 54 s1 min 40 s1 min 40 s
Response time (dry air 200 °C)4 min 40 s2 min 2 s47 s
Response time (humid air 200 °C)3 min54 s47 s
Response time (dry air 250 °C)3 min 32 s43 s25 s
Response time (humid air 250 °C)3 min1 min 19 s47 s
Table 4. Response towards NO2 of ZnO-based resistive sensors.
Technological RouteFilm TypeNO2 Sensor Response (SR)Conditions of MeasurementReference
In-situ production of ZnO nanoparticles onto reduced graphene oxiden.m.1SR = (Ra – Rg)/Ra 0.26 under 5 ppmRT[33]
Reduced graphene oxide nanosheets-loaded ZnO nanofibers via electrospinningThin-filmSR = Rg/Ra ca. 90 under 1 ppm400 °C[34]
ZnO nanorods prepared by hydrothermal methodn.m.SR = Rg/Ra 1.8 under 1 ppm300 °C[35]
ZnO/Single Walled Nano-Tubes 1:1 in wt spin coatedThick-filmSR = Ra/Rg 0.7 under 1 ppm300 °C[36]
ZnO nanorods prepared by hydrothermal methodThin-filmSR = Rg − Ra/Rg 12.4 under 0.1 ppm100 °C[37]
ZnO produced by wet chemical routeThin-filmSR = Ra/Rg 1.01 under 2 ppm300 °C[38]
ZnO nanoflowers prepared by hydrothermal synthesis + reduced graphene oxideThick-filmSR = Rg/Ra ca. 13 under 1 ppm174 °C[39]
ZnO nanorods deposited using a wet chemical routeThin-filmSR = Rg − Ra/Rg ca. 5.7 under 20 ppm175 °C[40]
Metallic single-walled carbon nanotubes electrodes with ZnO nanowiresThick-filmSR = Rg − Ra/Ra 2 under 2.5 ppm25 °C[41]
Soft chemical synthesis of flower-shaped ZnOThin-filmSR = Rg/Ra 1.4 under 10 ppm200 °C[42]
Electrospun ZnO fibersThin-filmSR = Rg/Ra ca. 5.5 under 0.1 ppm200 °C[43]
Sonochemical growth of high-density ZnO nanorod arraysThin-filmSR = Rg − Ra/Ra ca. 8 under 0.1 ppm250 °C[44]
Hierarchical ZnO nanostructures by thermal evaporation methodThick-filmSR = Rg − Ra/Ra 0.41 under 1 ppm200 °C[45]
ZnO film produced via ion layer adsorption and reaction (SILAR) techniqueThin-filmSR = Rg − Ra/Ra 1.37 under 10 ppm150 °C[46]
Sheet-like hierarchical ZnO coatings deposited by suspension flame sprayingThick-filmSR = Rg − Ra/Ra 2.6 under 1 ppmRT + white light[47]
ZnO nanoparticles produced by separate nucleation and aging steps (SNAS)PelletSR = Rg/Ra ca. 226 under 40 ppm290 °C[48]
ZnO submicron rods drop cast on oxidized silicon substrateThick-filmSR = Rg − Ra/Ra 1 under 1 ppmRT[49]
Drop coating of ZnO and Au/ZnO rose-like structures made by microwave-assisted hydrothermal methodn.m.S = (Rg − Ra)/Ra 75 under 5 ppm300 °C[50]
ZnO nanoparticles precipitated on sepiolite needlesThick-filmSR = Ra/Rg ca. 1.08 under 1 ppm300 °C[51]
ZnO-based glass ceramic sensorThick-filmSR = Rg/Ra ca. 17 under 1 ppm150 °CThis work
1 n.m.: not mentioned.

