1. Introduction
Viscosity and density are the fundamental properties of a fluid, and their measurements are important in many applications, from the quality control of combustible gases [
1] to blood coagulation tests [
2]. Various kinds of cantilever sensors have been developed to measure the viscosity and density of fluids [
1,
2,
3,
4,
5,
6,
7,
8,
9,
10], which are usually based on the resonance of the cantilever [
1,
3,
4,
5,
7,
8,
9,
10]. That is, the density and viscosity of a fluid are obtained from a change in resonant frequency and peak width (or quality factor) when the cantilever is immersed in the fluid. These cantilevers were approximated as vibrating spheres in a viscous environment [
5,
9], or the hydrodynamic function [
11] was used to account for the real geometry of the cantilevers [
4,
10], which allows the multimode analysis, but places a restriction in the frequency range and an added mass on the cantilever.
In our previous study [
12], we presented simultaneous measurements of the mass and position of micro-beads attached to the vibrating cantilever in fluids. Wave propagations along the cantilever depended on the interaction between the beads, the cantilever, and the surrounding fluid. The change in the wave propagations was used for the measurements. In the present study, we propose an alternative method to determine the density and viscosity of a fluid using a wave propagation analysis for piezoelectrically excited microscale- and nanoscale-thickness cantilevers depending on their sensitivities in a gas or a liquid. The viscosity and density of the fluid can then be obtained by measuring the change in the wavenumber induced by the fluid-structure interaction. The fluid-structure interactions and the wave propagation on the cantilevers partially and totally immersed in viscous fluids were analyzed to calculate the transfer functions of the microscale- and nanoscale-thickness cantilevers in liquids and gases, respectively. Both viscosity and density were then determined and compared with the known values.
The measured transfer function and wavenumber of the cantilever presented more reliable information over a wide range of frequencies, whereas commonly used resonance-based methods require a frequency range close to the resonant frequencies and are subject to a significant amount of uncertainties in case of liquids due to their low quality factors [
12]. In this regard, the use of wave propagation characteristics is advantageous because it does not require the accurate determination of natural frequencies, thereby providing a reliable method to find the properties of liquids.
3. Experimental Setup
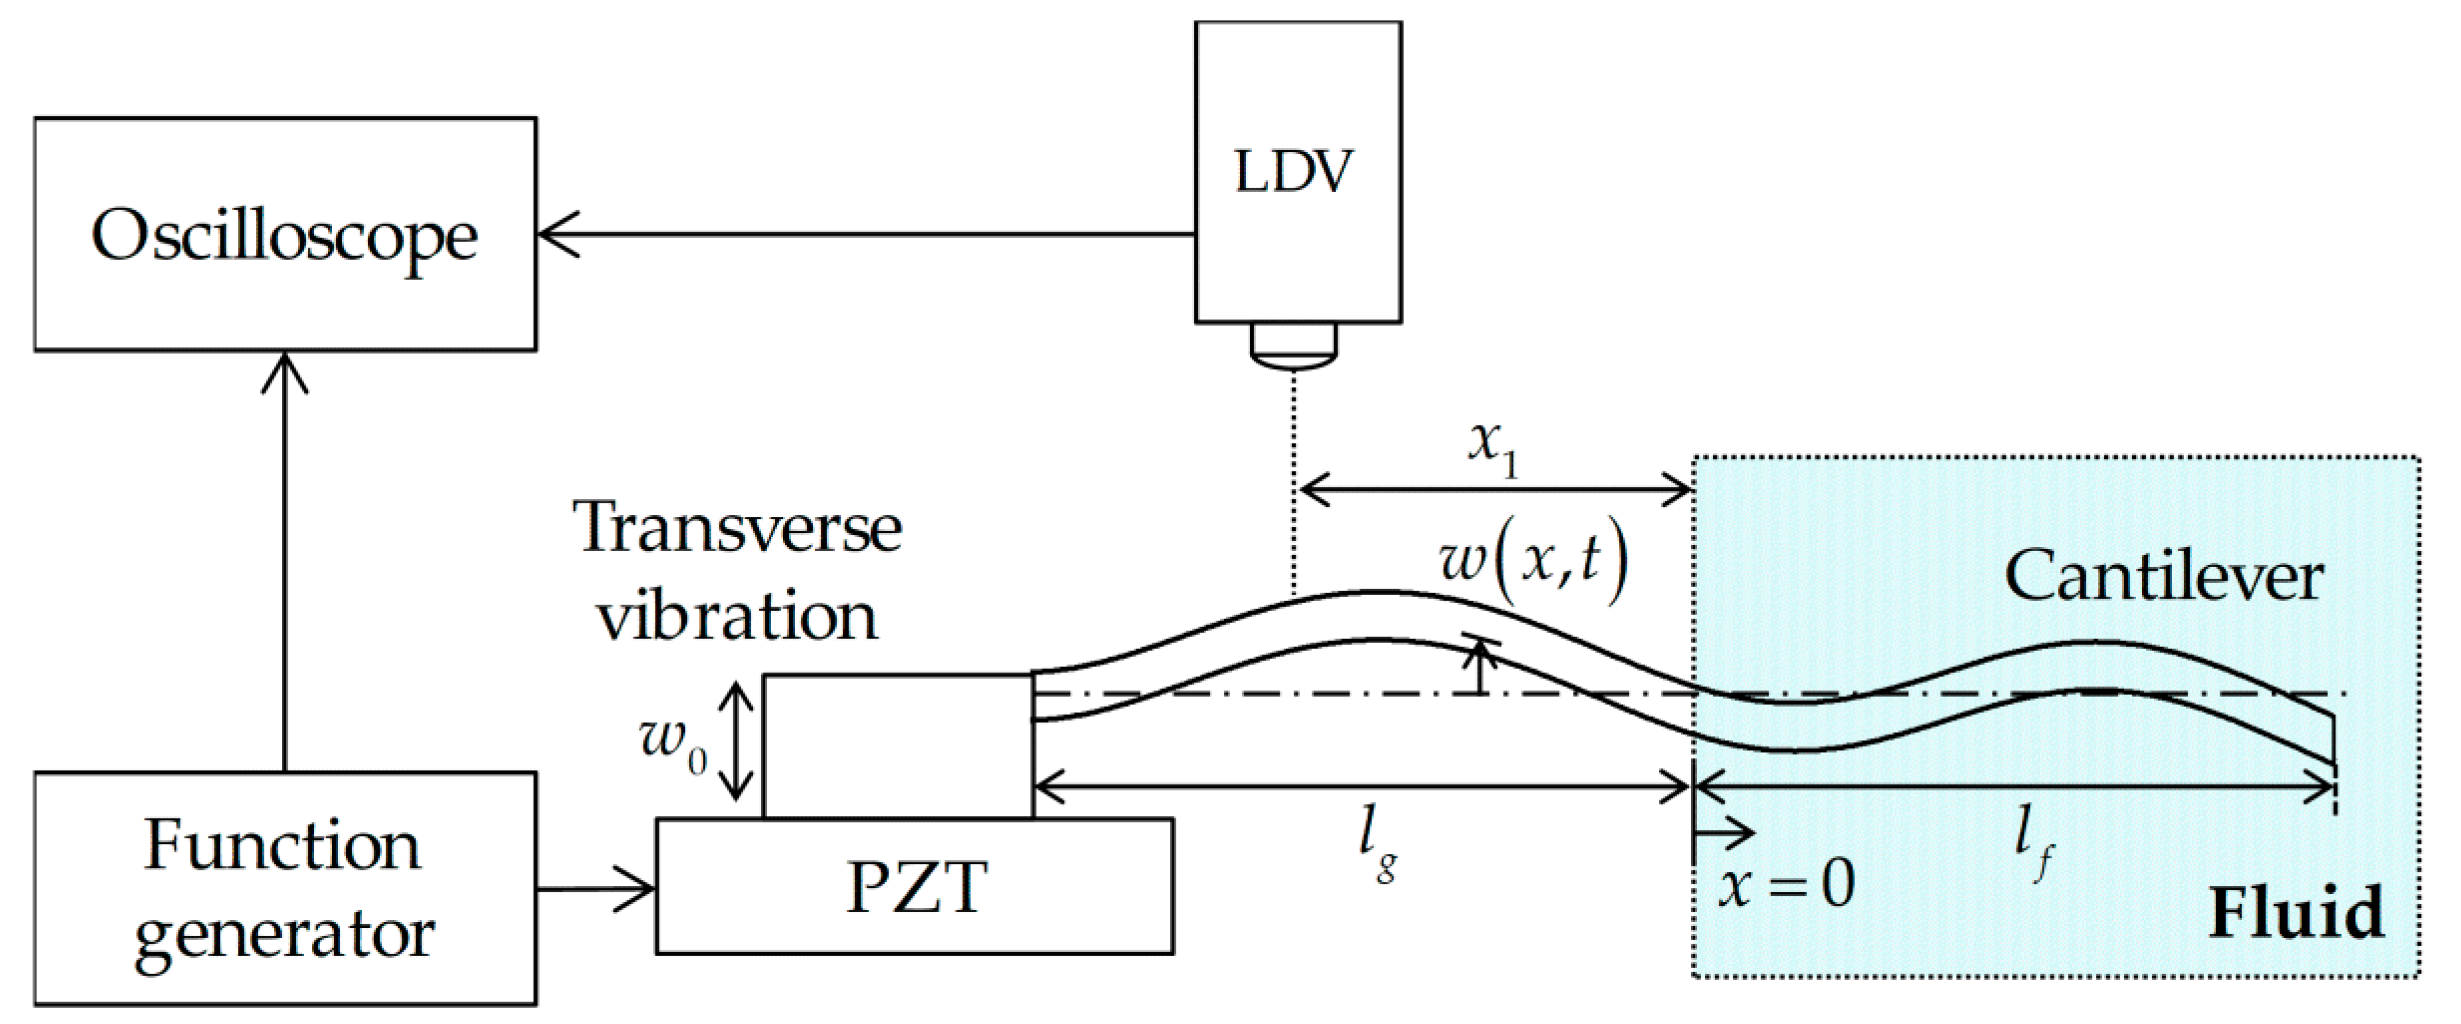
Figure 1 shows the schematic of the experimental setup where the free end of the cantilever is partially immersed in a fluid. The fabrication of the nanoscale-thickness cantilevers was described in previous work [
12], and the microscale-thickness cantilever was purchased from a company (ALOAL-TL, Probes, Seoul, Korea). The cantilever chip was clamped on a lead zirconate titanate (PZT; Physik Instrumente, Karlsruhe, Germany) sheet providing excitation. A noise with the bandwidth of 1 MHz and peak-to-peak voltage of 3 V was generated by a function generator (33500B, Agilent) and applied to the PZT sheet. The vibration velocity of the cantilever was measured at the clamped boundary and the one-fifth position of the beam through a single-point laser Doppler vibrometer (Polytec, Dexter, MI, USA) [
12]. The voltages from the function generator and output voltage from the laser Doppler vibrometer (LDV) measurement were used to obtain the transfer function.
Figure 2a,b show the experimental systems and the magnified views of the nanoscale-thickness cantilever [
12] (150 × 10 × 0.20 μm
3, 0.70 ± 0.20 ng) fully immersed in a gas and the microscale-thickness cantilever (458 × 51 × 2.0 μm
3, 109 ± 58 ng) partially immersed in a liquid, respectively. Considering the size of the cantilever chips, the nanoscale-thickness cantilever chip (5 × 5 × 0.7 mm
3) was attached to a 10 × 10 × 0.5 mm
3 PZT chip, while the microscale-thickness cantilever chip (1.5 × 3.5 × 0.3 mm
3) was fixed to a 4 × 6 × 0.5 mm
3 PZT chip. Two wires were connected to the PZT chips to apply the excitation voltage. The nanoscale-thickness cantilever chip with the PZT chip was placed inside a gas chamber (70 × 65 × 30 mm
3;
Figure 2a) which was composed of two throttle valves and a pressure gauge to control the gas flow and its static pressure. Density and viscosity were measured for CO
2, N
2, and air of different pressures in the gas chamber. The vacuum pressure was set using a vacuum pump (Rocker610, Rocker Scientific, New Taipei, Taiwan).
The density and viscosity of deionized water, acetone, and 25%
v/
v glycerol were measured using the microscale-thickness cantilever. The cantilever chip with the PZT chip was fixed on a slide glass, and a syringe needle (22 G; inner diameter: 0.4 mm) which contains a liquid inside, was set to slide parallel to the cantilever length direction to adjust the immersion length (
Figure 2b). The cantilever was coated with a thin film of aluminum by the manufacturer, and there was no visible capillary flow on the surface when the liquid meniscus was formed on the surface of the cantilever. Although the immersion length was manually controlled and can be changed by evaporation of the liquid, a single measurement was carried out for 2 s and was not affected by the change. After the immersion experiment with a liquid, the cantilever was washed with flowing 70% ethanol and deionized water for 1 min, and then gently dried with a nitrogen gun.
4. Results and Discussion
For the proposed experimental setup, the effect of the fluid-structure interaction on the wave propagation of the microscale-thickness cantilever was estimated. The fluid loading should have significant impacts on the vibration response for fluid property measurements. If the loading is too large, the vibration occurs as for a completely damped beam without any information about the fluid properties.
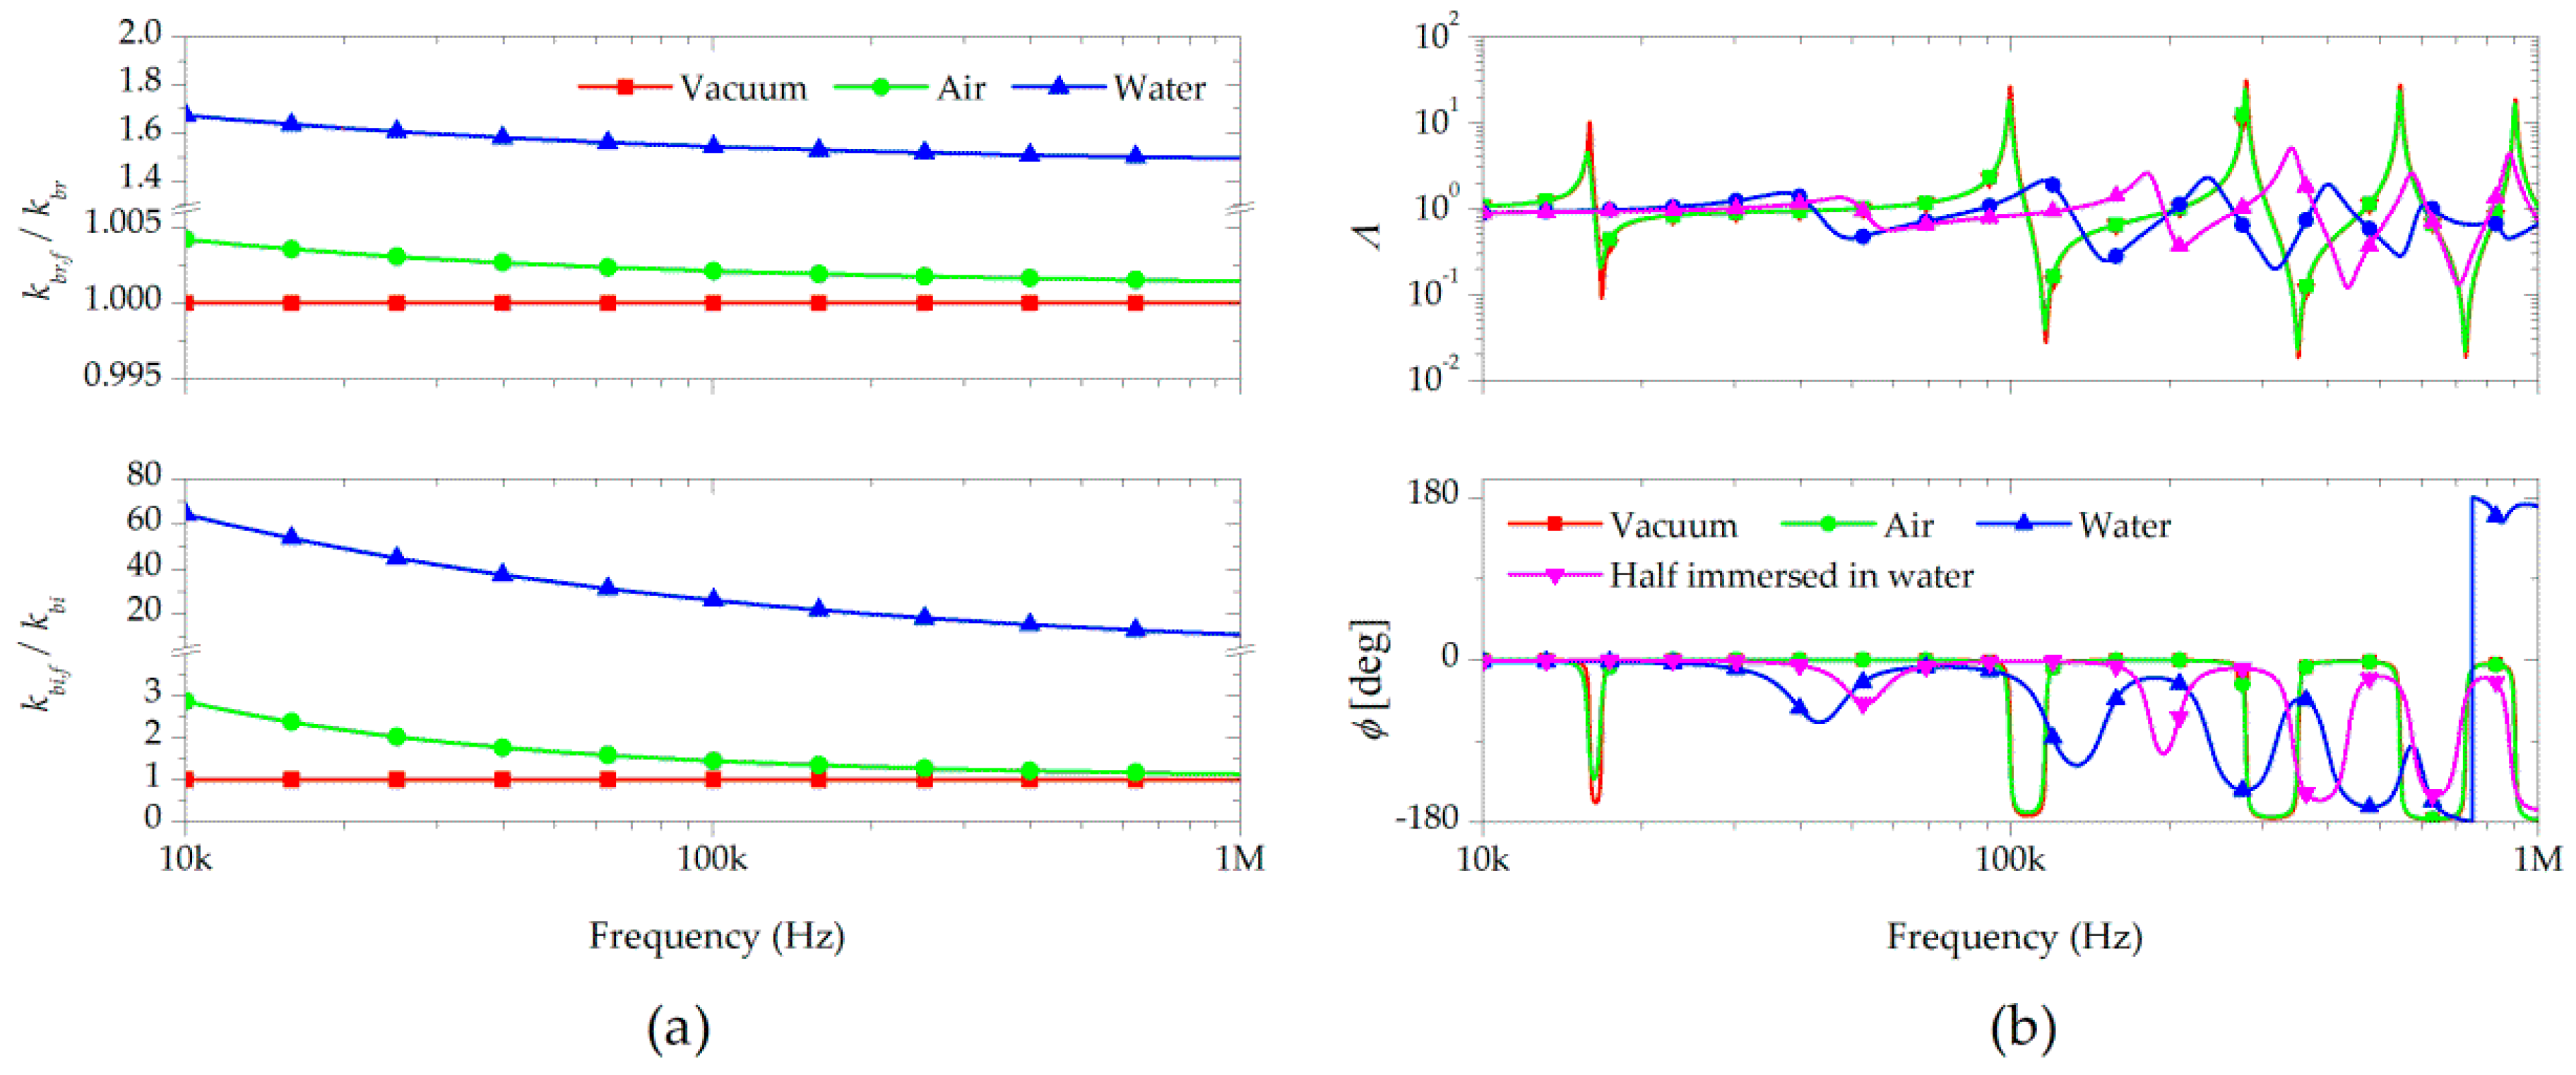
Figure 3a shows the ratios of the wavenumbers in air and water predicted using Equation (5). The wavenumbers showed greater change in liquid than in gas. As frequency increased, the ratios of the wavenumbers decreased. The real part of the wavenumber affects the wavelength, and the imaginary part influences the vibration amplitude of the cantilever. The liquid densities and viscosities were clearly larger than those of gases, and had more significant influence on the wavenumber.
Vibration responses in the frequency range of the cantilever were determined by the boundary conditions (Equation (6)), and then the transfer function was calculated by Equation (7). The transfer functions of the cantilevers in vacuum and water (completely and partially immersed) are shown in
Figure 3b. A significant decrease of the resonance frequencies and the vibration magnitude of the transfer functions occurred in the cantilevers in the water. The change of the transfer function of the cantilever in air was negligible, because the bending stiffness of the cantilever was too large to detect the fine change induced by air. The resonance frequencies and vibration amplitude of the cantilever fully immersed in vacuum and water were different.
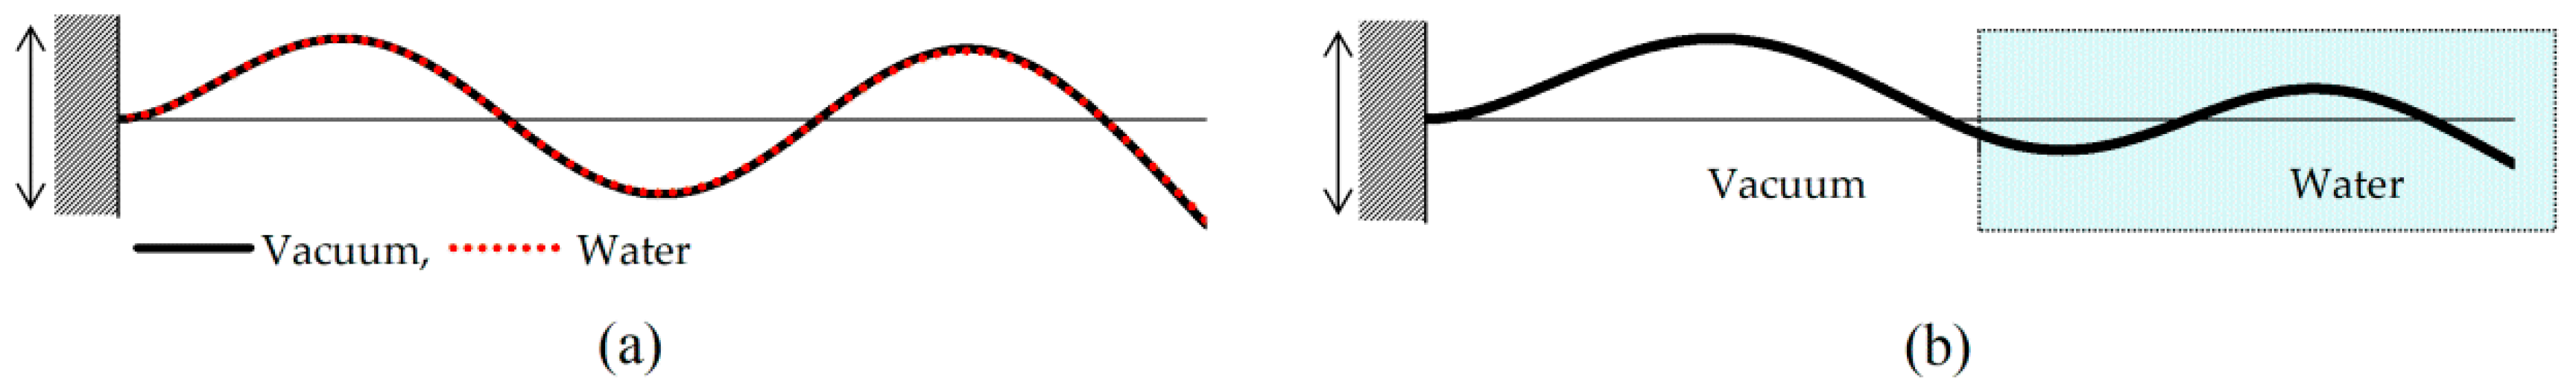
Figure 4 shows the standing wave pattern at the fourth resonance frequency calculated from Equation (4) when the cantilever was fully and half-immersed in vacuum and water. The standing wave pattern was not affected by the fluid-structure interaction when fully immersed (
Figure 4a). On the other hand, the half-immersed cantilever exhibited a different standing wave pattern due to the variation of the wavelength at a single frequency (
Figure 4b). This half-immersion was advantageous in reducing the fluid structure interaction, thereby increasing the magnitude of responses required for precise vibration sensing.
The effects of the fluid-structure interaction on the wave propagation of the cantilever were analyzed by the change in the wavenumber.
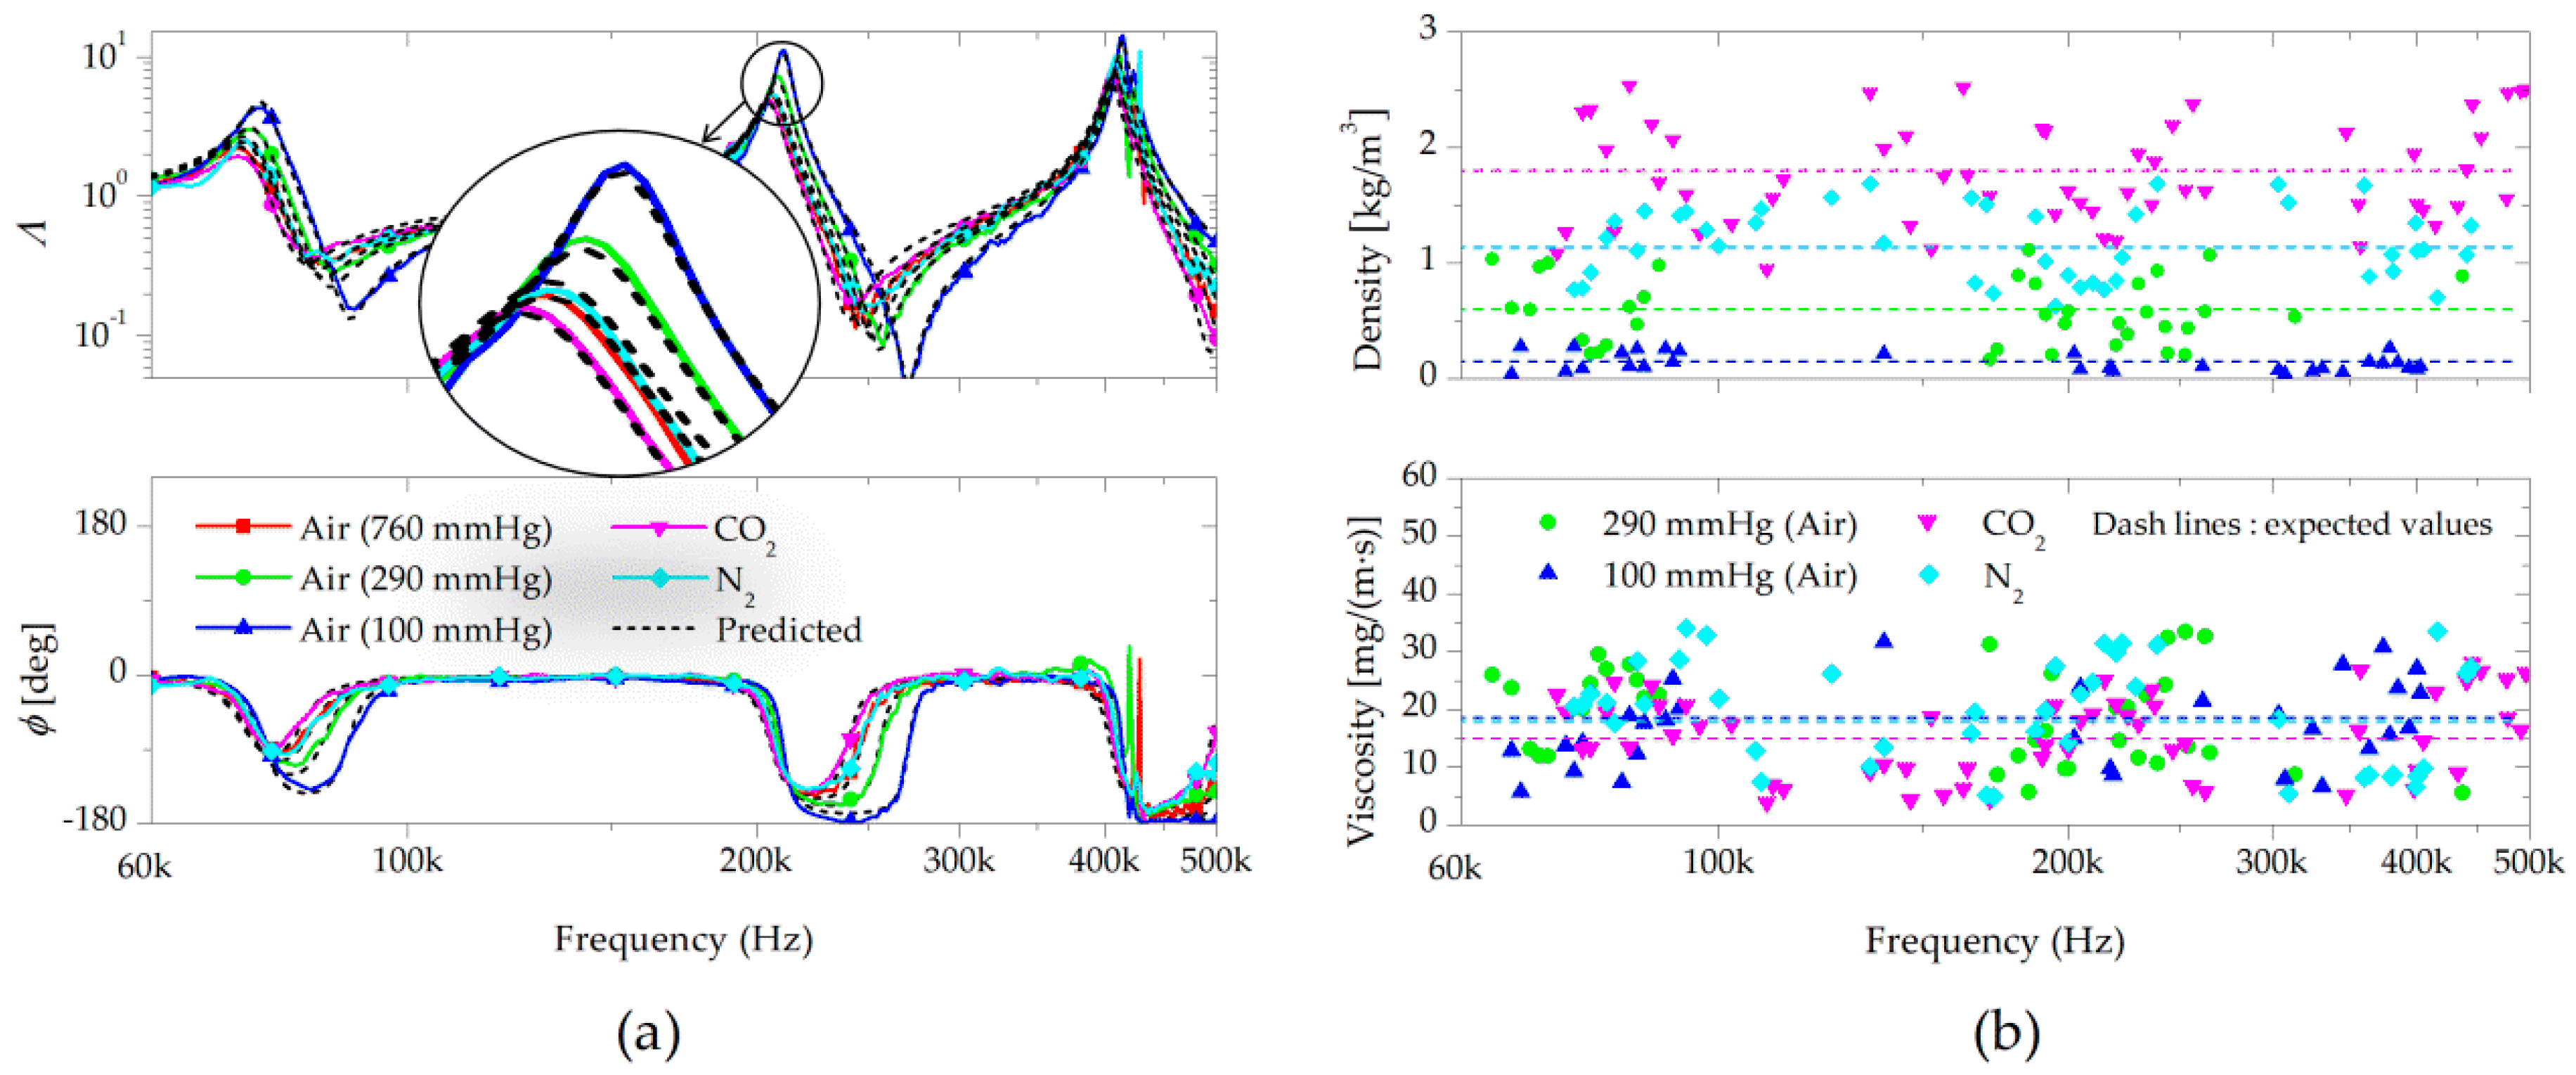
Figure 5a shows the measured and predicted transfer functions when the cantilever was completely immersed (
) in air at different pressures (760 mmHg, 290 mmHg, and 100 mmHg), carbon dioxide at atmospheric pressure, and nitrogen at atmospheric pressure. As shown in
Figure 5a, the measured vibration behaviors showed excellent agreement with those predicted by Equation (7). The small change in the transfer function affected by the gas-structure interaction force was measured by utilizing the nanoscale-thickness cantilevers of small bending stiffness. The natural frequencies decreased due to the fluid loading effects, and the vibration damping decreased with increasing frequency.
To measure the dynamic stiffness of the cantilever, air at 760 mmHg was used for a reference fluid, as it has known values of density and viscosity. For the calculation of the density and viscosity, the wavenumbers of the cantilever in the fluids were applied to the proposed process. The densities and viscosities (
Figure 5b) were measured at each frequency of the vibration measurements. Although the vibration response showed a significant amount of variations over a wide range of frequencies, the estimated values were almost frequency-invariant in the frequency bands. The obtained fluid properties were averaged out at the mean values, which showed more robustness with more data than the resonance-based methods. The measured densities and viscosities along with typical values are shown in
Table 1, where the relative differences between these two varied from 1.6 to 7.3%.
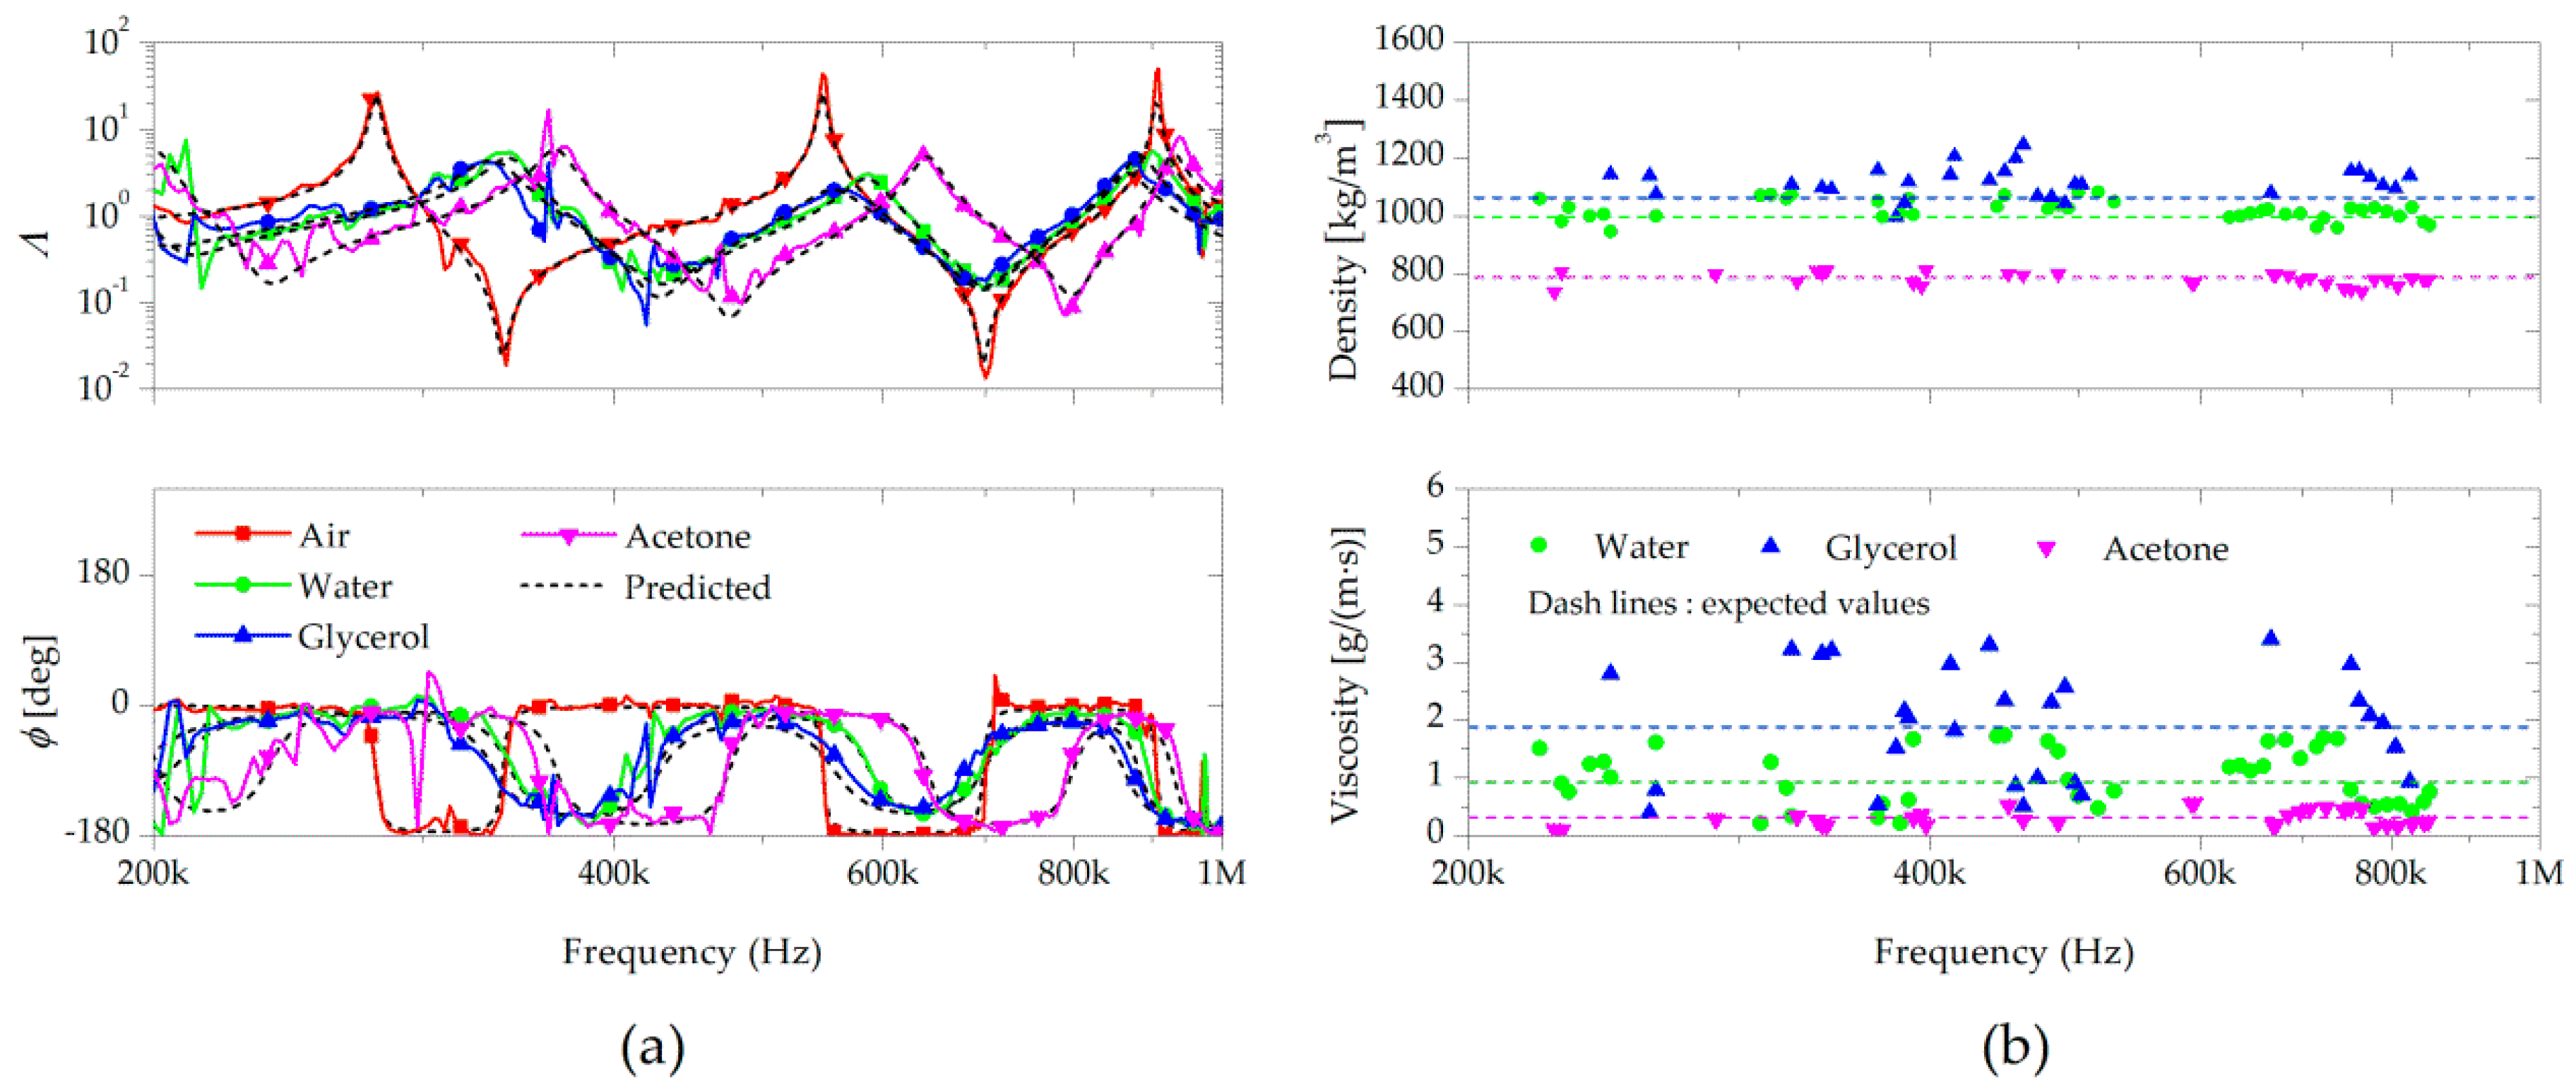
Figure 6a shows the measured transfer functions when the cantilever was partially immersed in water, 25% (
v/
v) glycerol in water, or acetone (
, where
L is the length of the cantilever). The fluid-structure interaction reduced the wave speed significantly since the densities of liquids are three orders of magnitude higher than those of gases. The vibration amplitude in liquids was lower than that in vacuum due to the larger dissipation of the wave energy. In fact, the resonant vibration responses were very small when completely immersed in liquids. As the cantilever length in liquid decreased, the natural frequency and overall vibration amplitude increased. Therefore, the cantilevers were controlled to be partially immersed so that the vibration resonance was sufficient for measuring cantilever oscillation and its interaction with the surrounding fluids. The influence of fluid-structure interaction was significant at low frequencies, and decreased with increasing frequency as predicted by Equation (5). The wavenumber variation also decreased for the cantilever in vacuum with increasing frequency.
Figure 6b shows the calculated density and viscosity after solving for the flexural wave interaction with the partial immersions. When the cantilevers were immersed in the liquids, the variation of the transfer functions due to the fluid loading was significantly larger than those in the gas. With the larger influence of the fluid loading, the measured liquid densities showed smaller variations than those of the gases, which may be due to the reduced relative influence from sensitivity of the sensor and noise due to external flow. The mean values of the measured properties and its comparison to the properties obtained from the literature are shown in
Table 2. With the partially immersed cantilevers, the discrepancies between the measurements and typical values were less than 4.8% for the densities and 3.1% for the viscosities. The accuracies for the viscosities was better than previous studies that had used a change in resonant frequency and peak width for the measurements [
1,
3,
4,
5,
7,
8,
9,
10]. Moreover, the measurement was more accurate in liquids than in gases, which is interesting, because in most resonant sensors, it is easier to make measurements in gases because of the larger quality factors in gases. This increased accuracy was due to the larger fluid loading effects on the estimated wavenumber. The accuracy also depended strongly on the frequency ranges and cantilever properties. Therefore, if the range of fluid properties is known beforehand, the cantilever specifications can be optimized to maximize the fluid-structure interaction in the frequency range of the data acquisition, thereby increasing the accuracy.


