
Three-Dimensional Measurement for Specular Reflection Surface Based on Reflection Component Separation and Priority Region Filling Theory


Abstract
:1. Introduction
2. Specular Highlight Removal
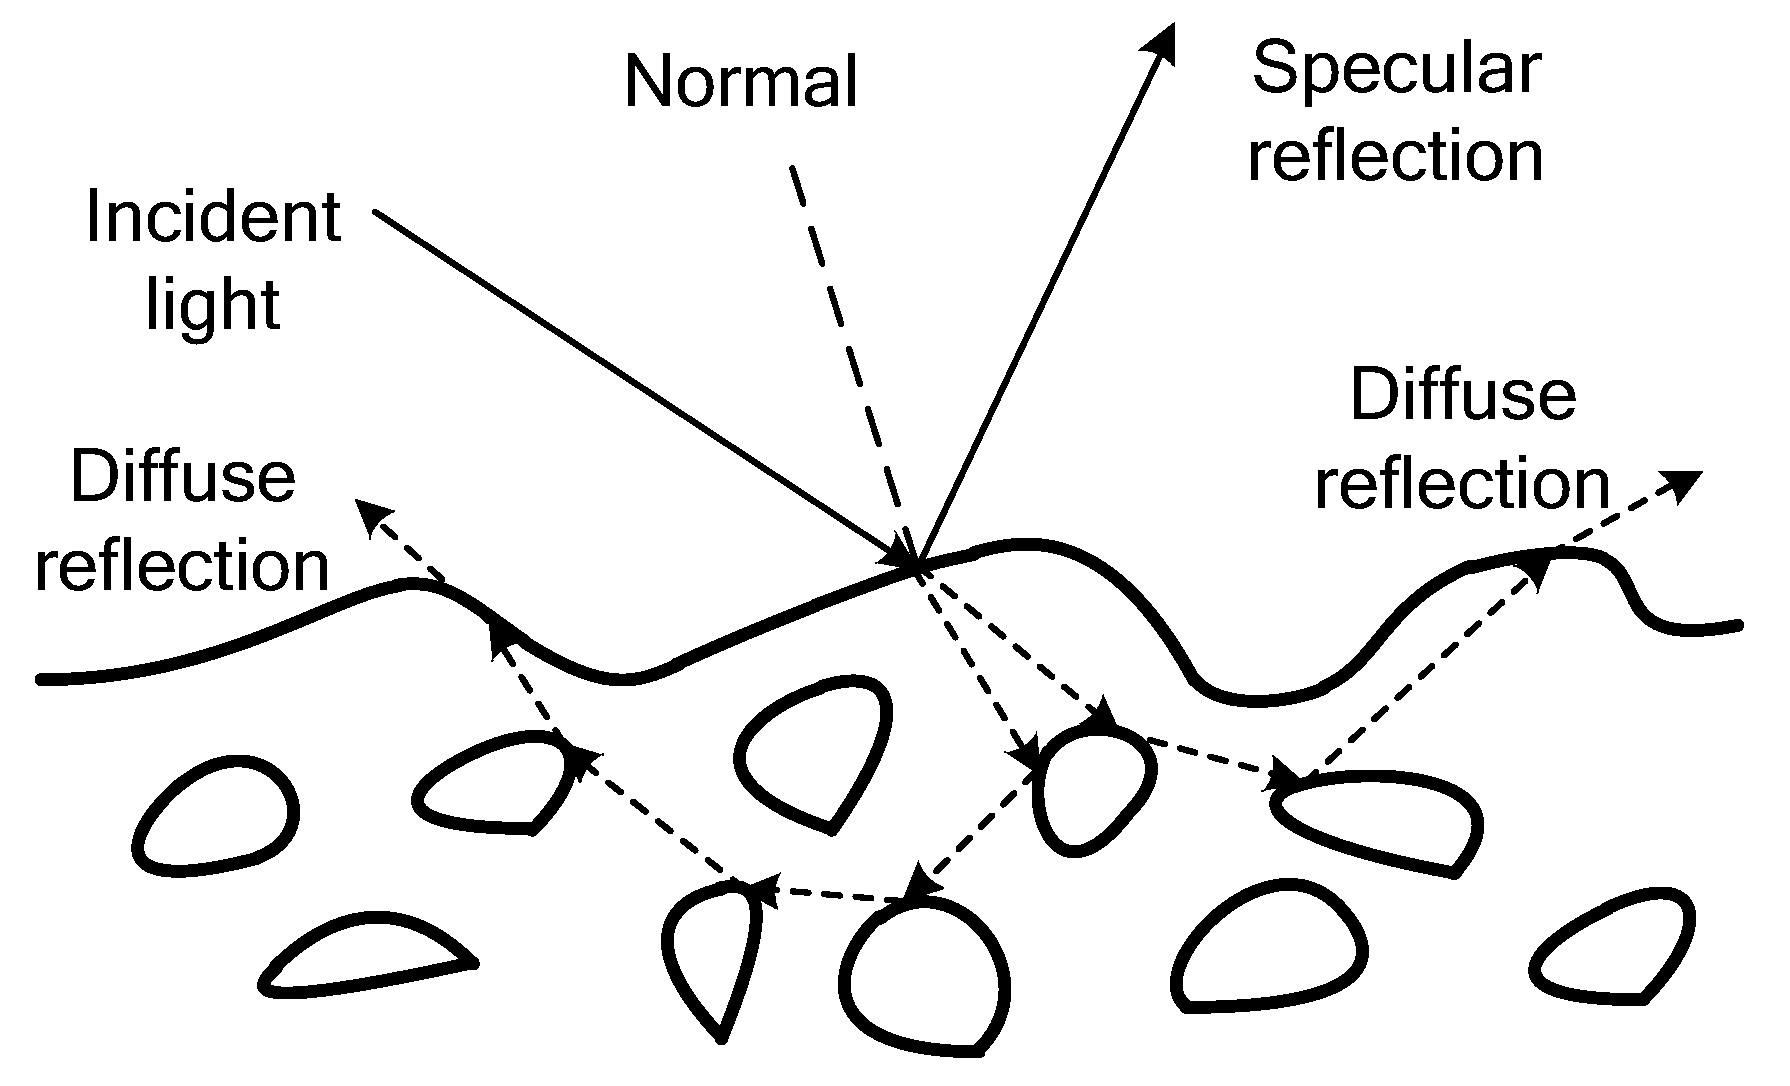
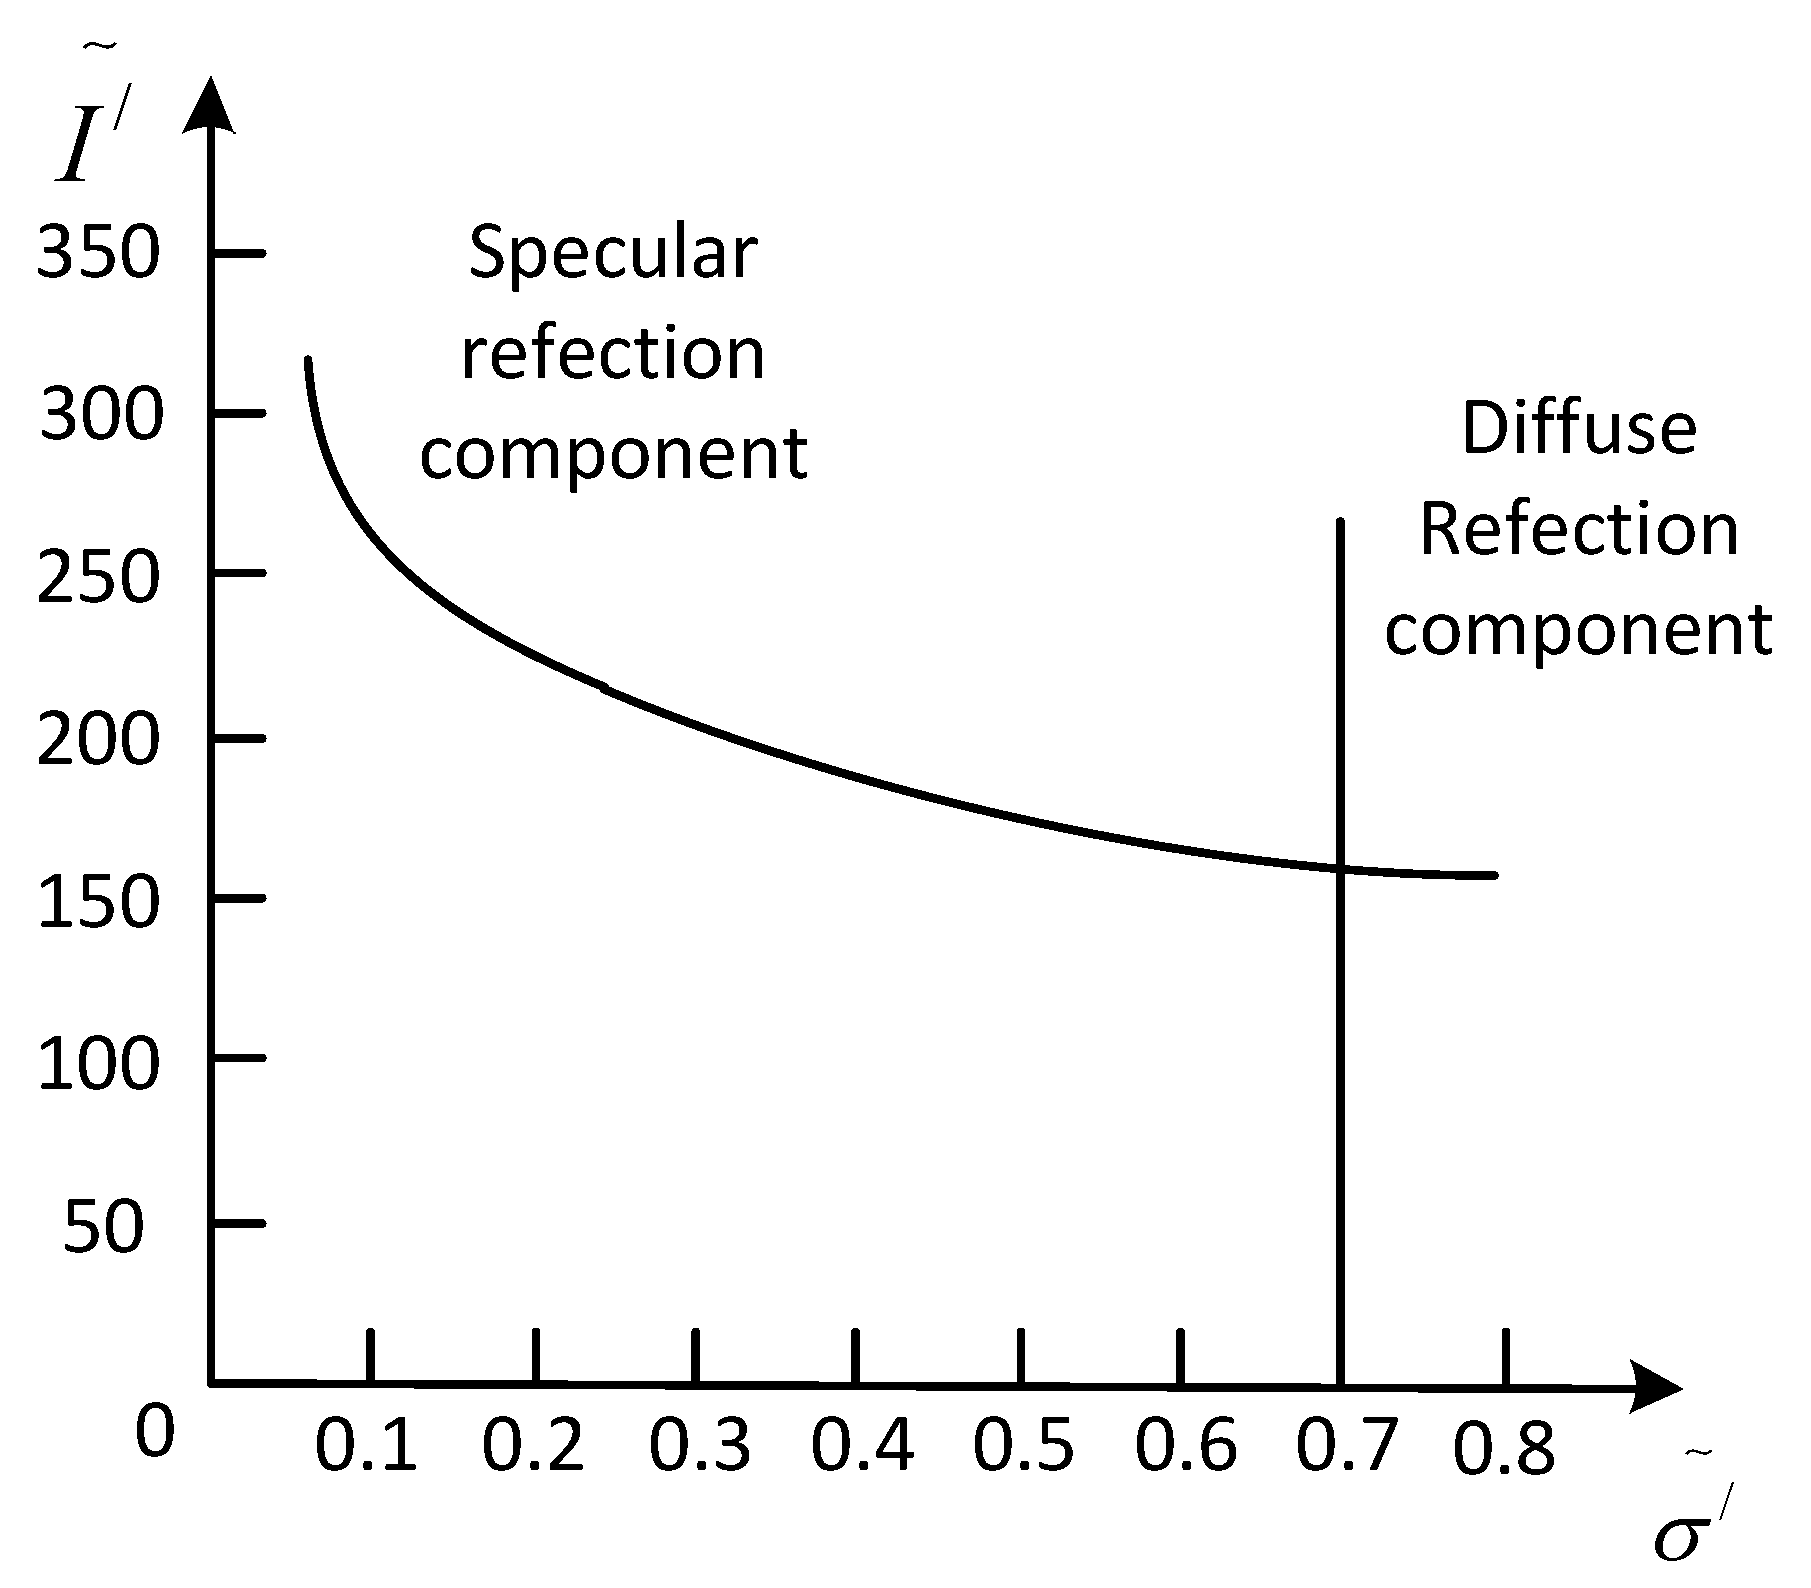
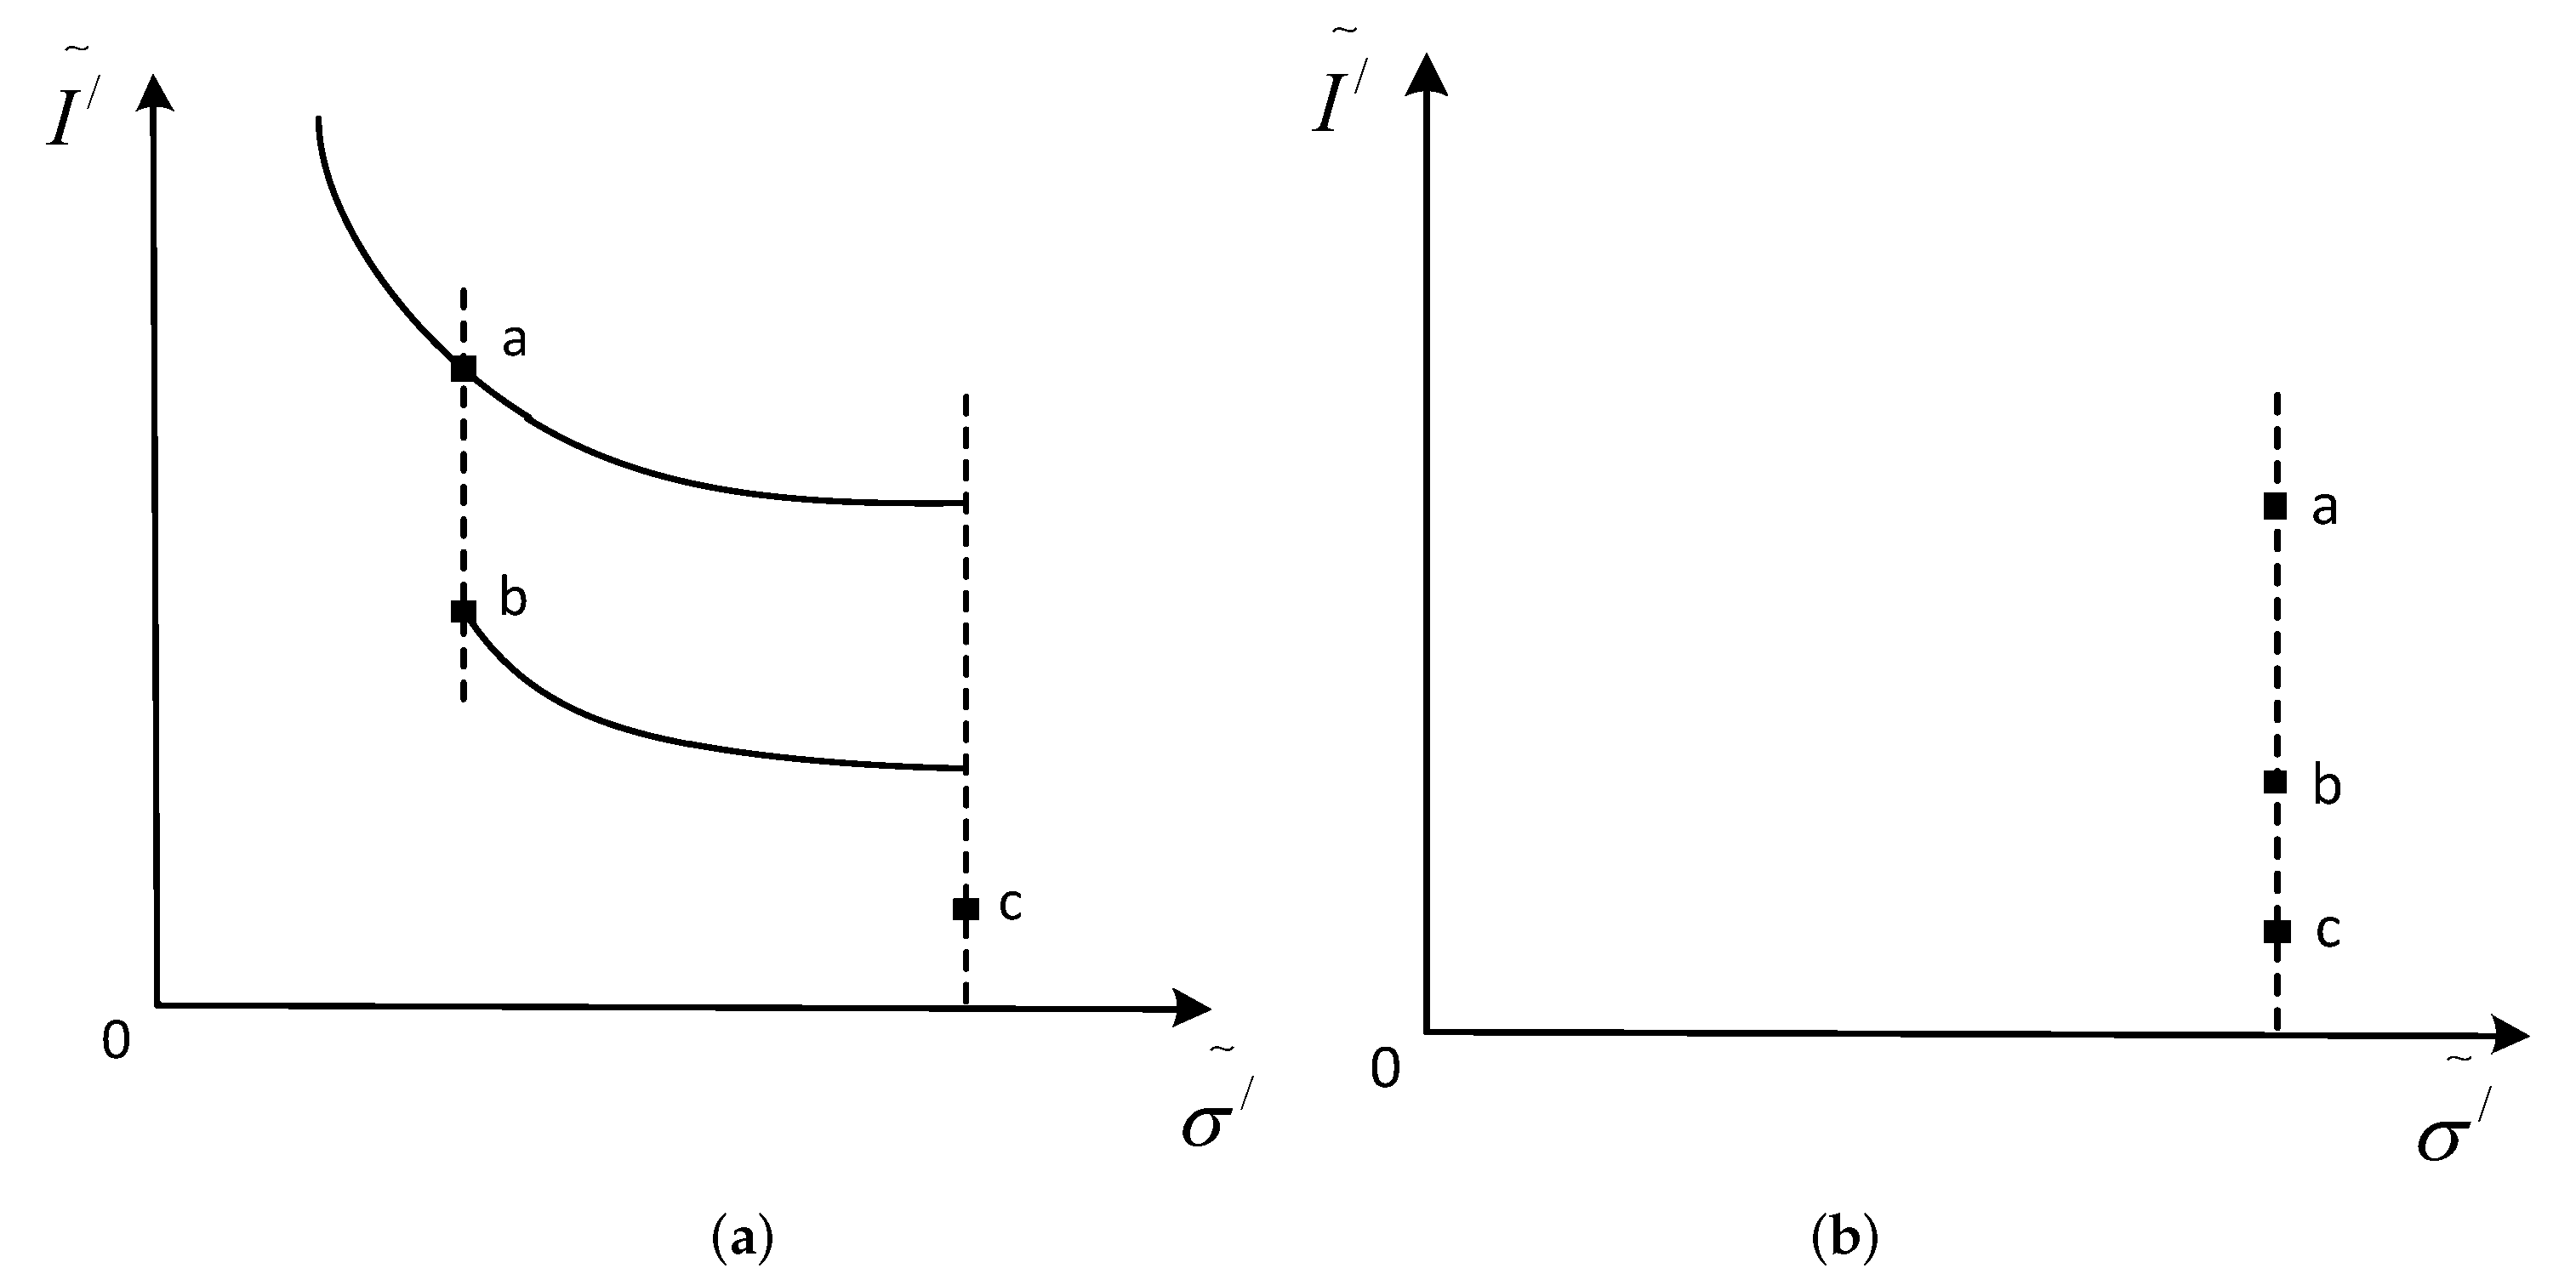
2.1. Reflection Model
2.2. Selection of Highlight Pixels
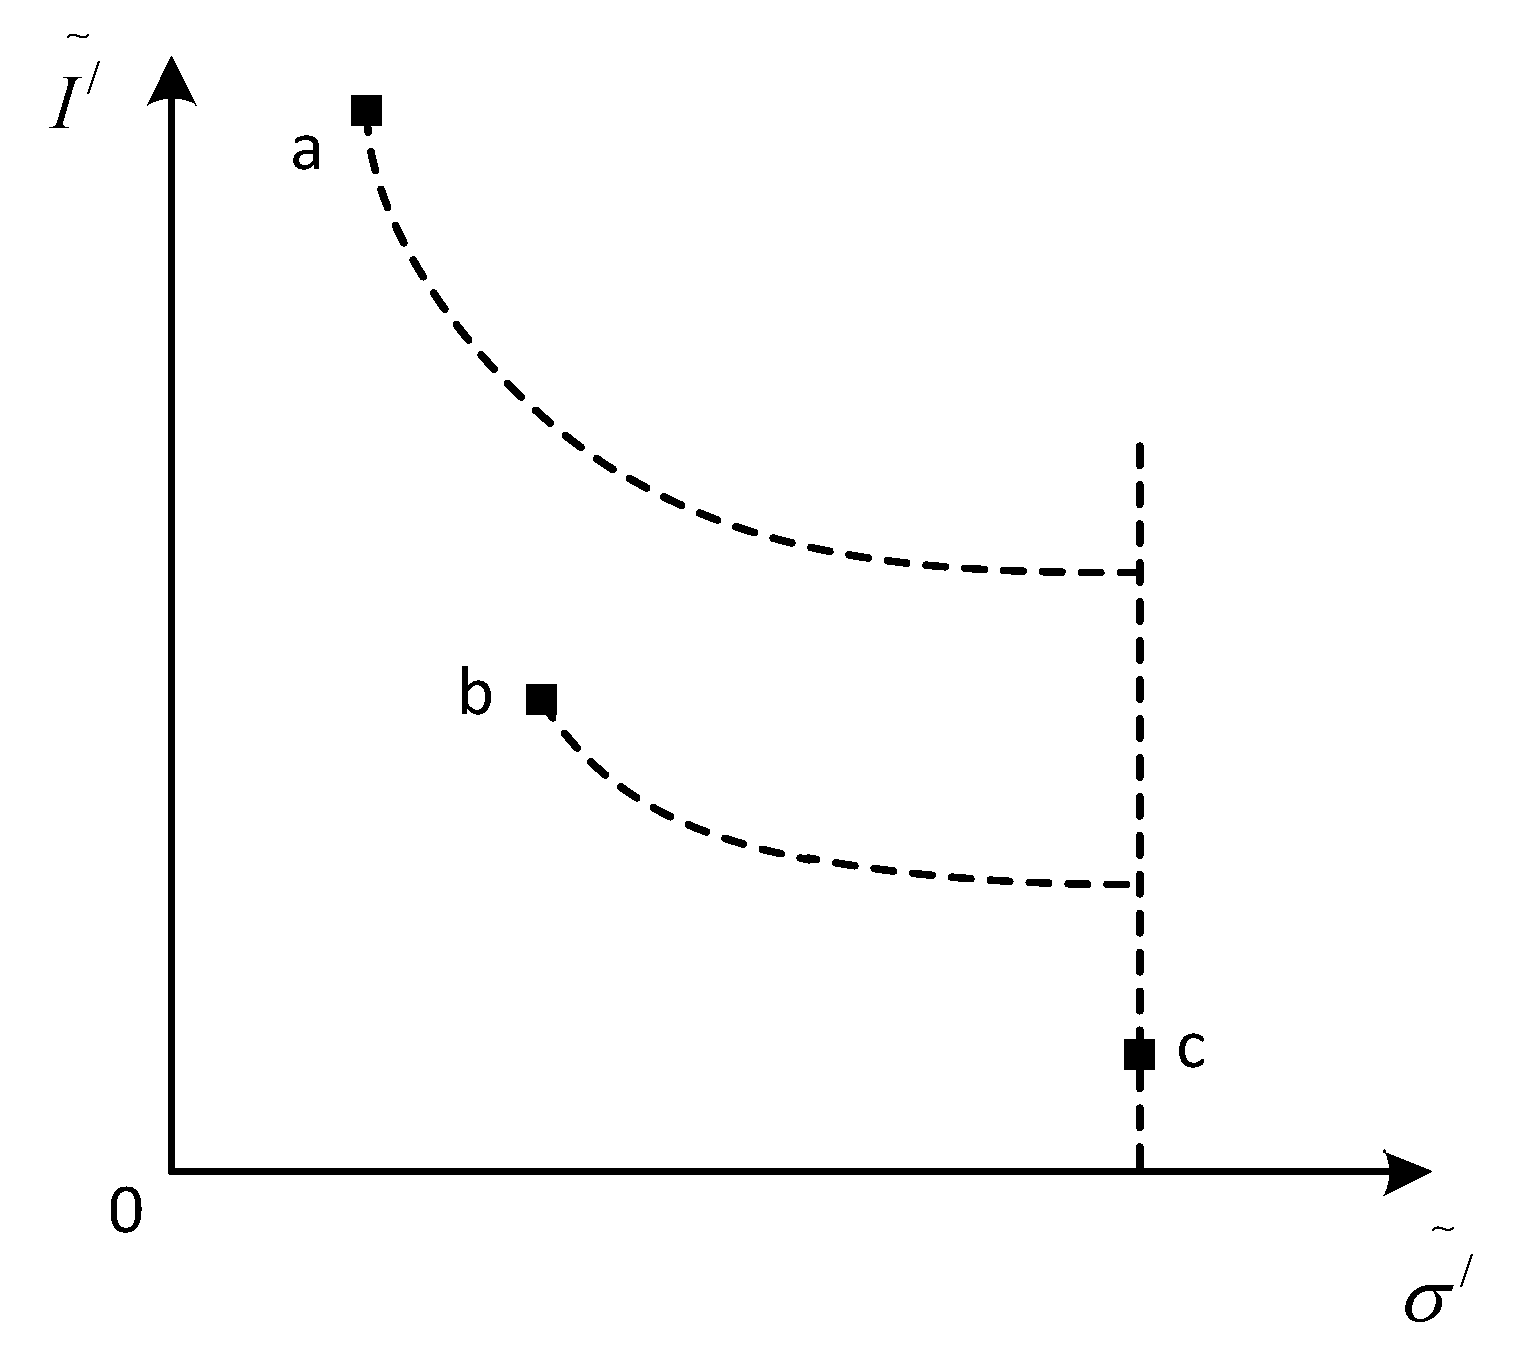
2.3. Specular Reflection Component Removal Theory
3. Highlight Region Inpainting Based on Priority Theory
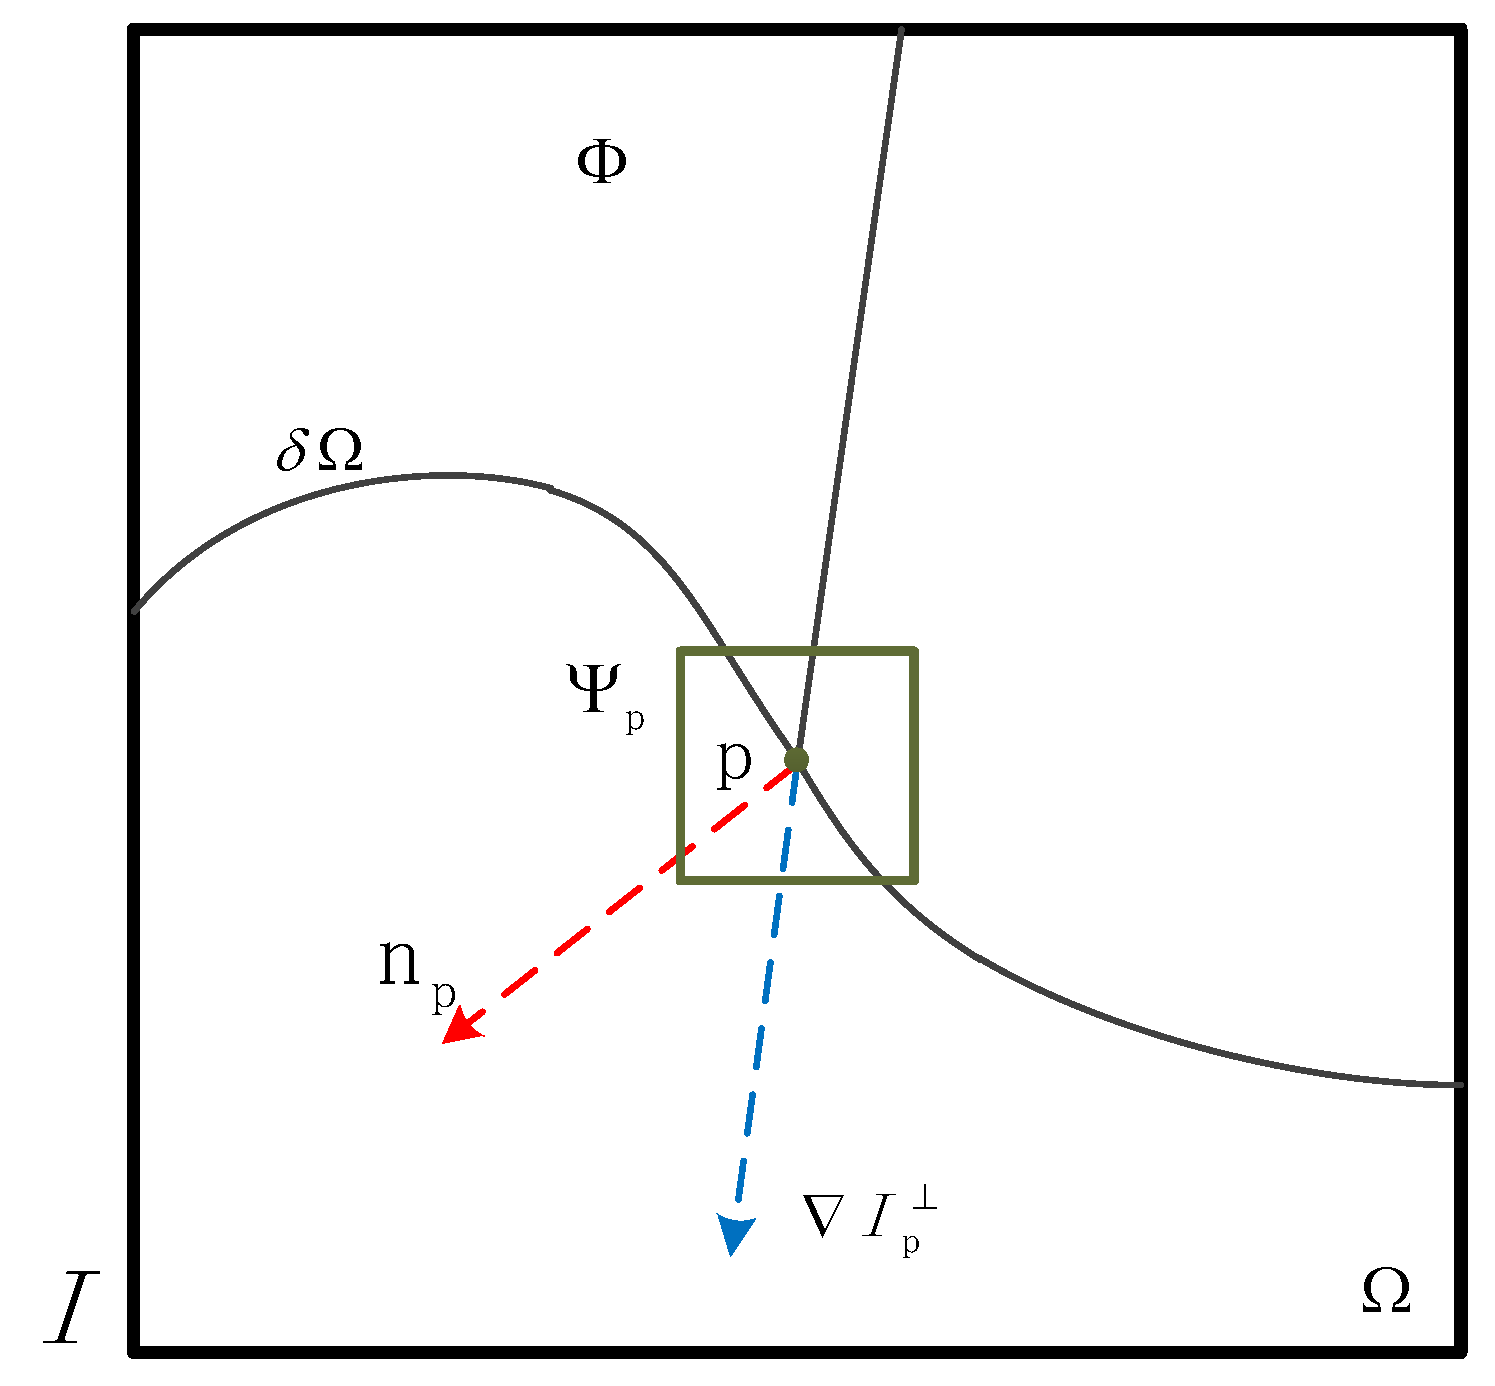
3.1. Principal of Region Filling Method Based on Priority Theory
3.2. Highlight Region Filling Algorithm
| Algorithm 1. Highlight region filling algorithm |
| Selected Ω and defined Φ = I − Ω |
| Define ψp, and compute P (p) |
| (WHILE) the area Ω has not been completely processed |
| Find highest priority patch in Φ, and find module |
| Copy data from to in Φ |
| Updata C (p) |
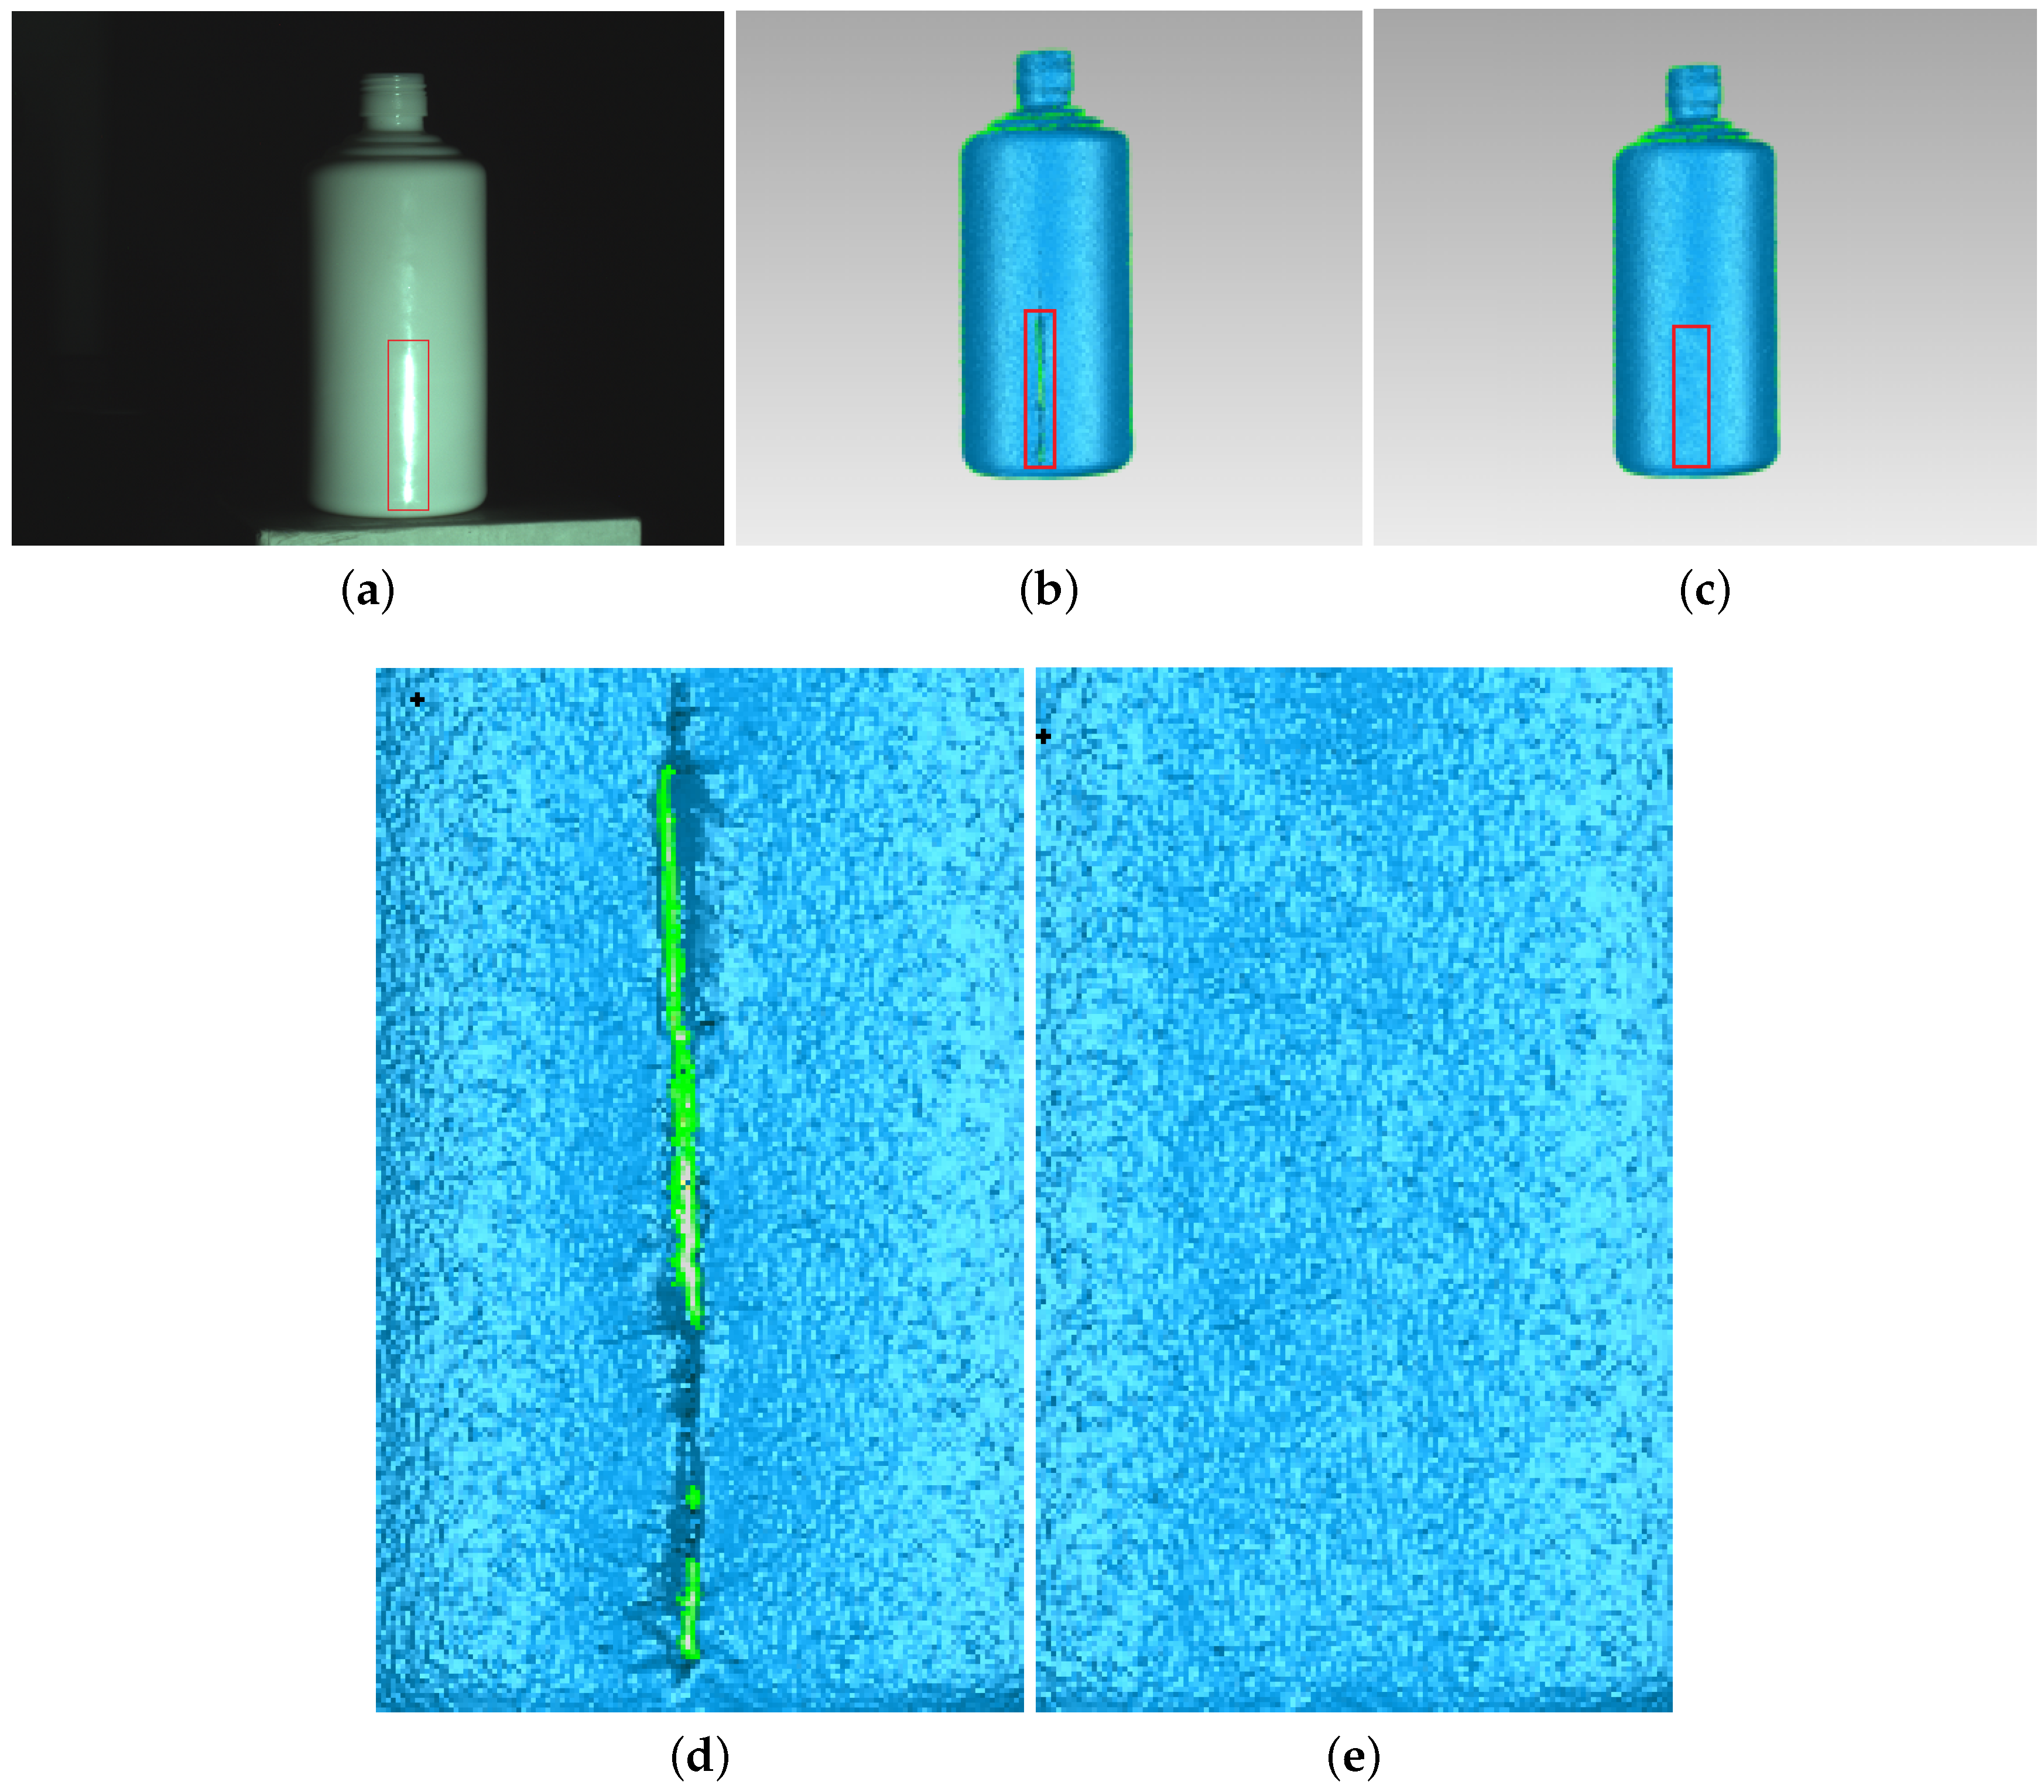
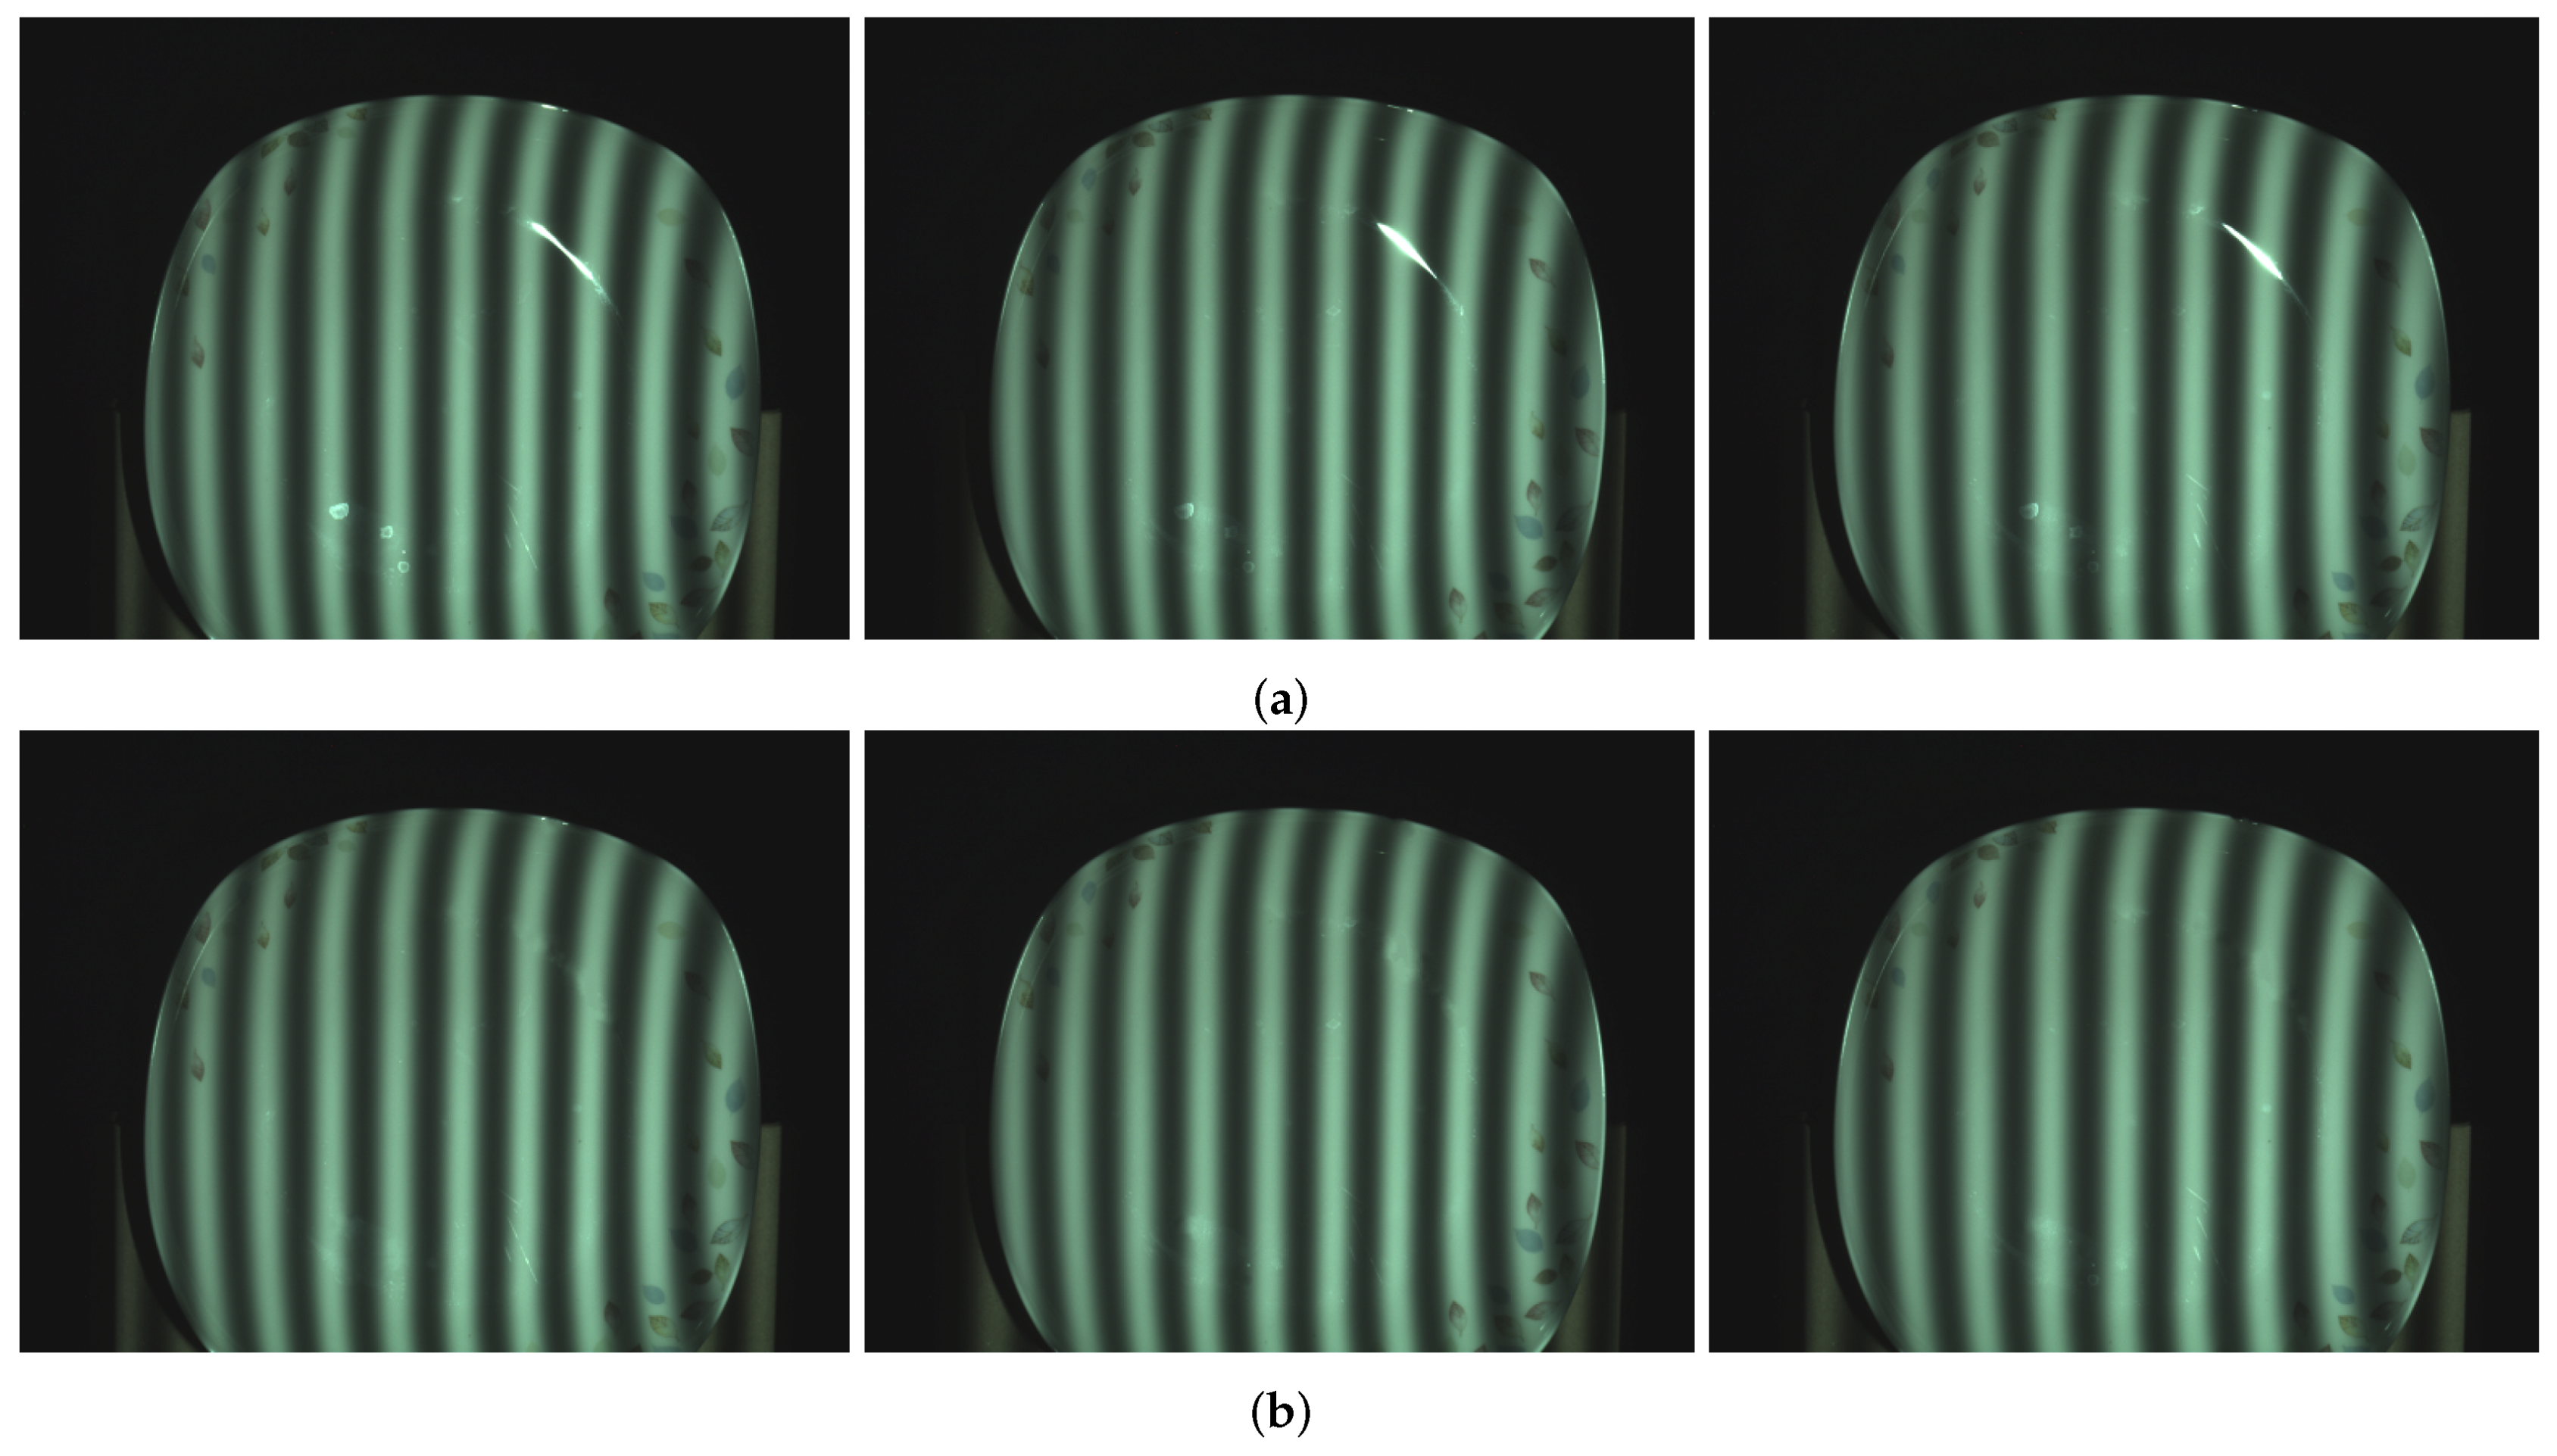
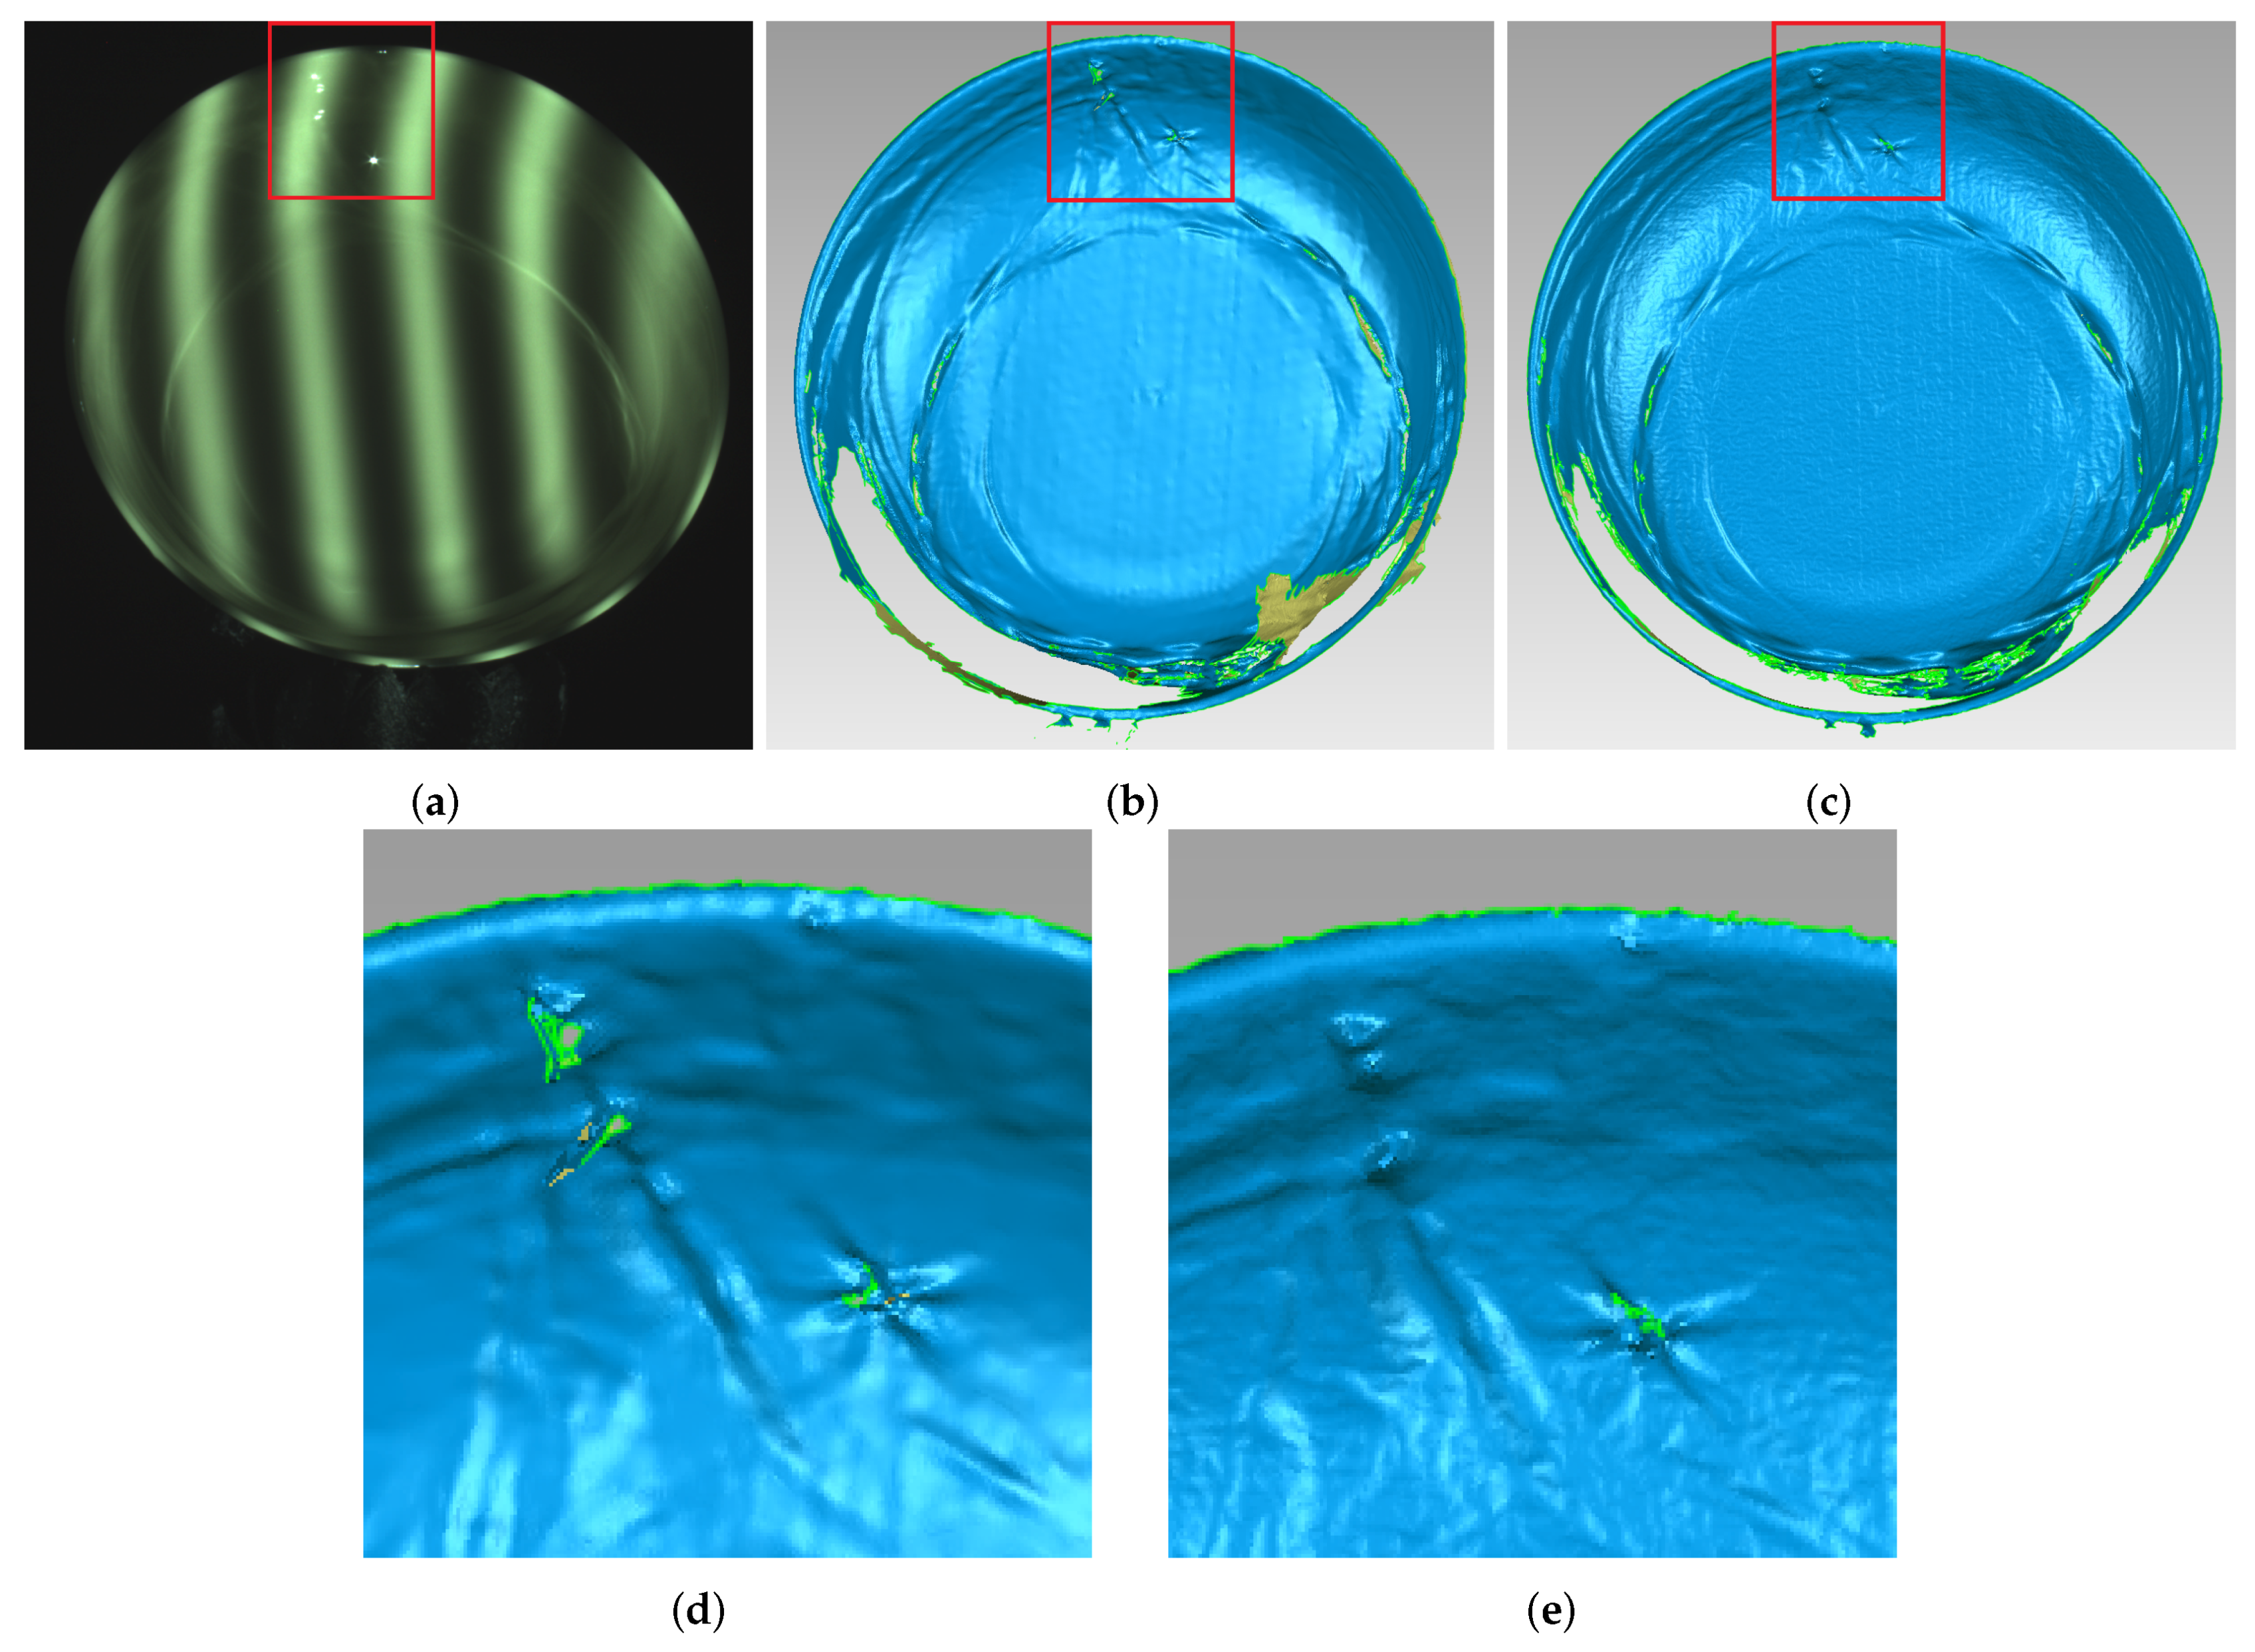
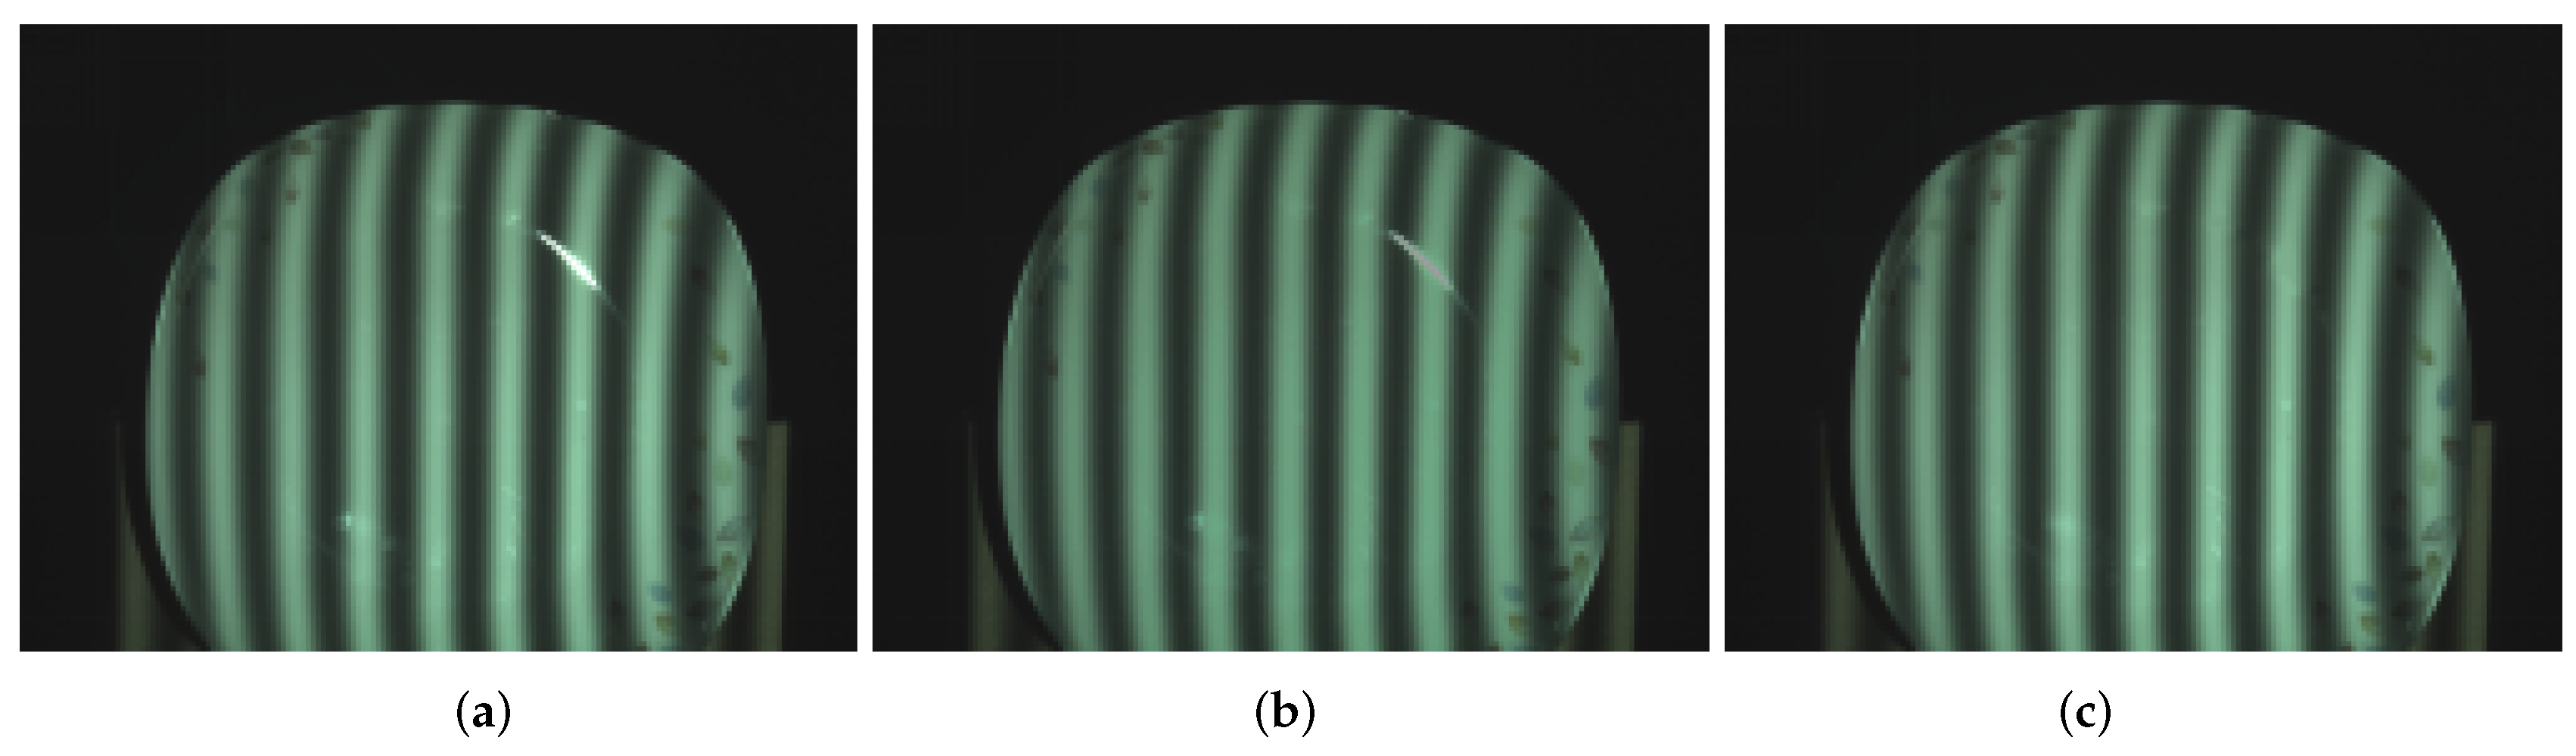
4. Experiment
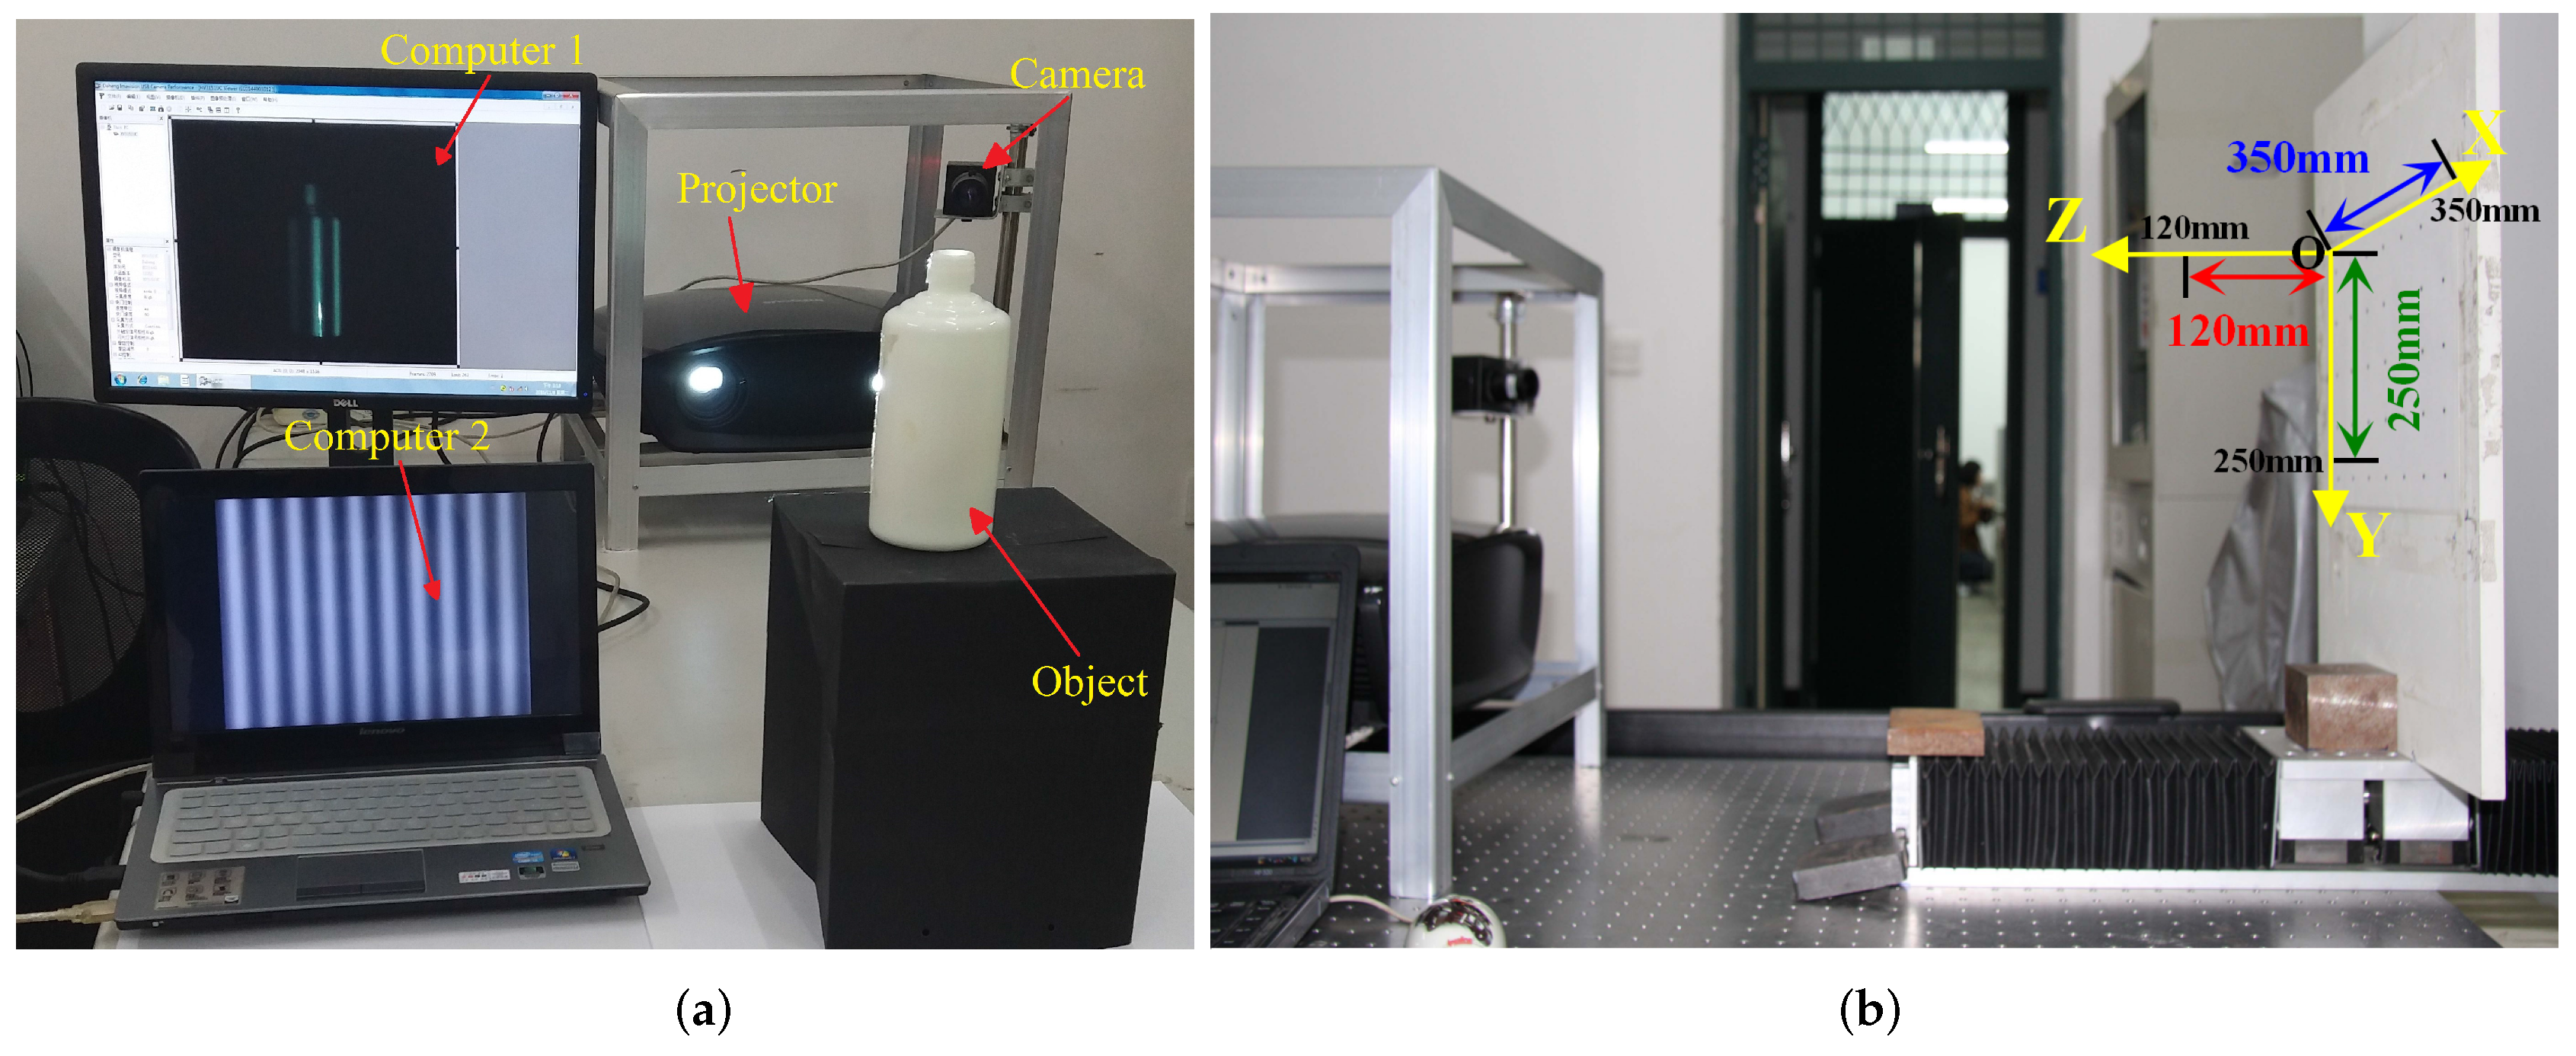
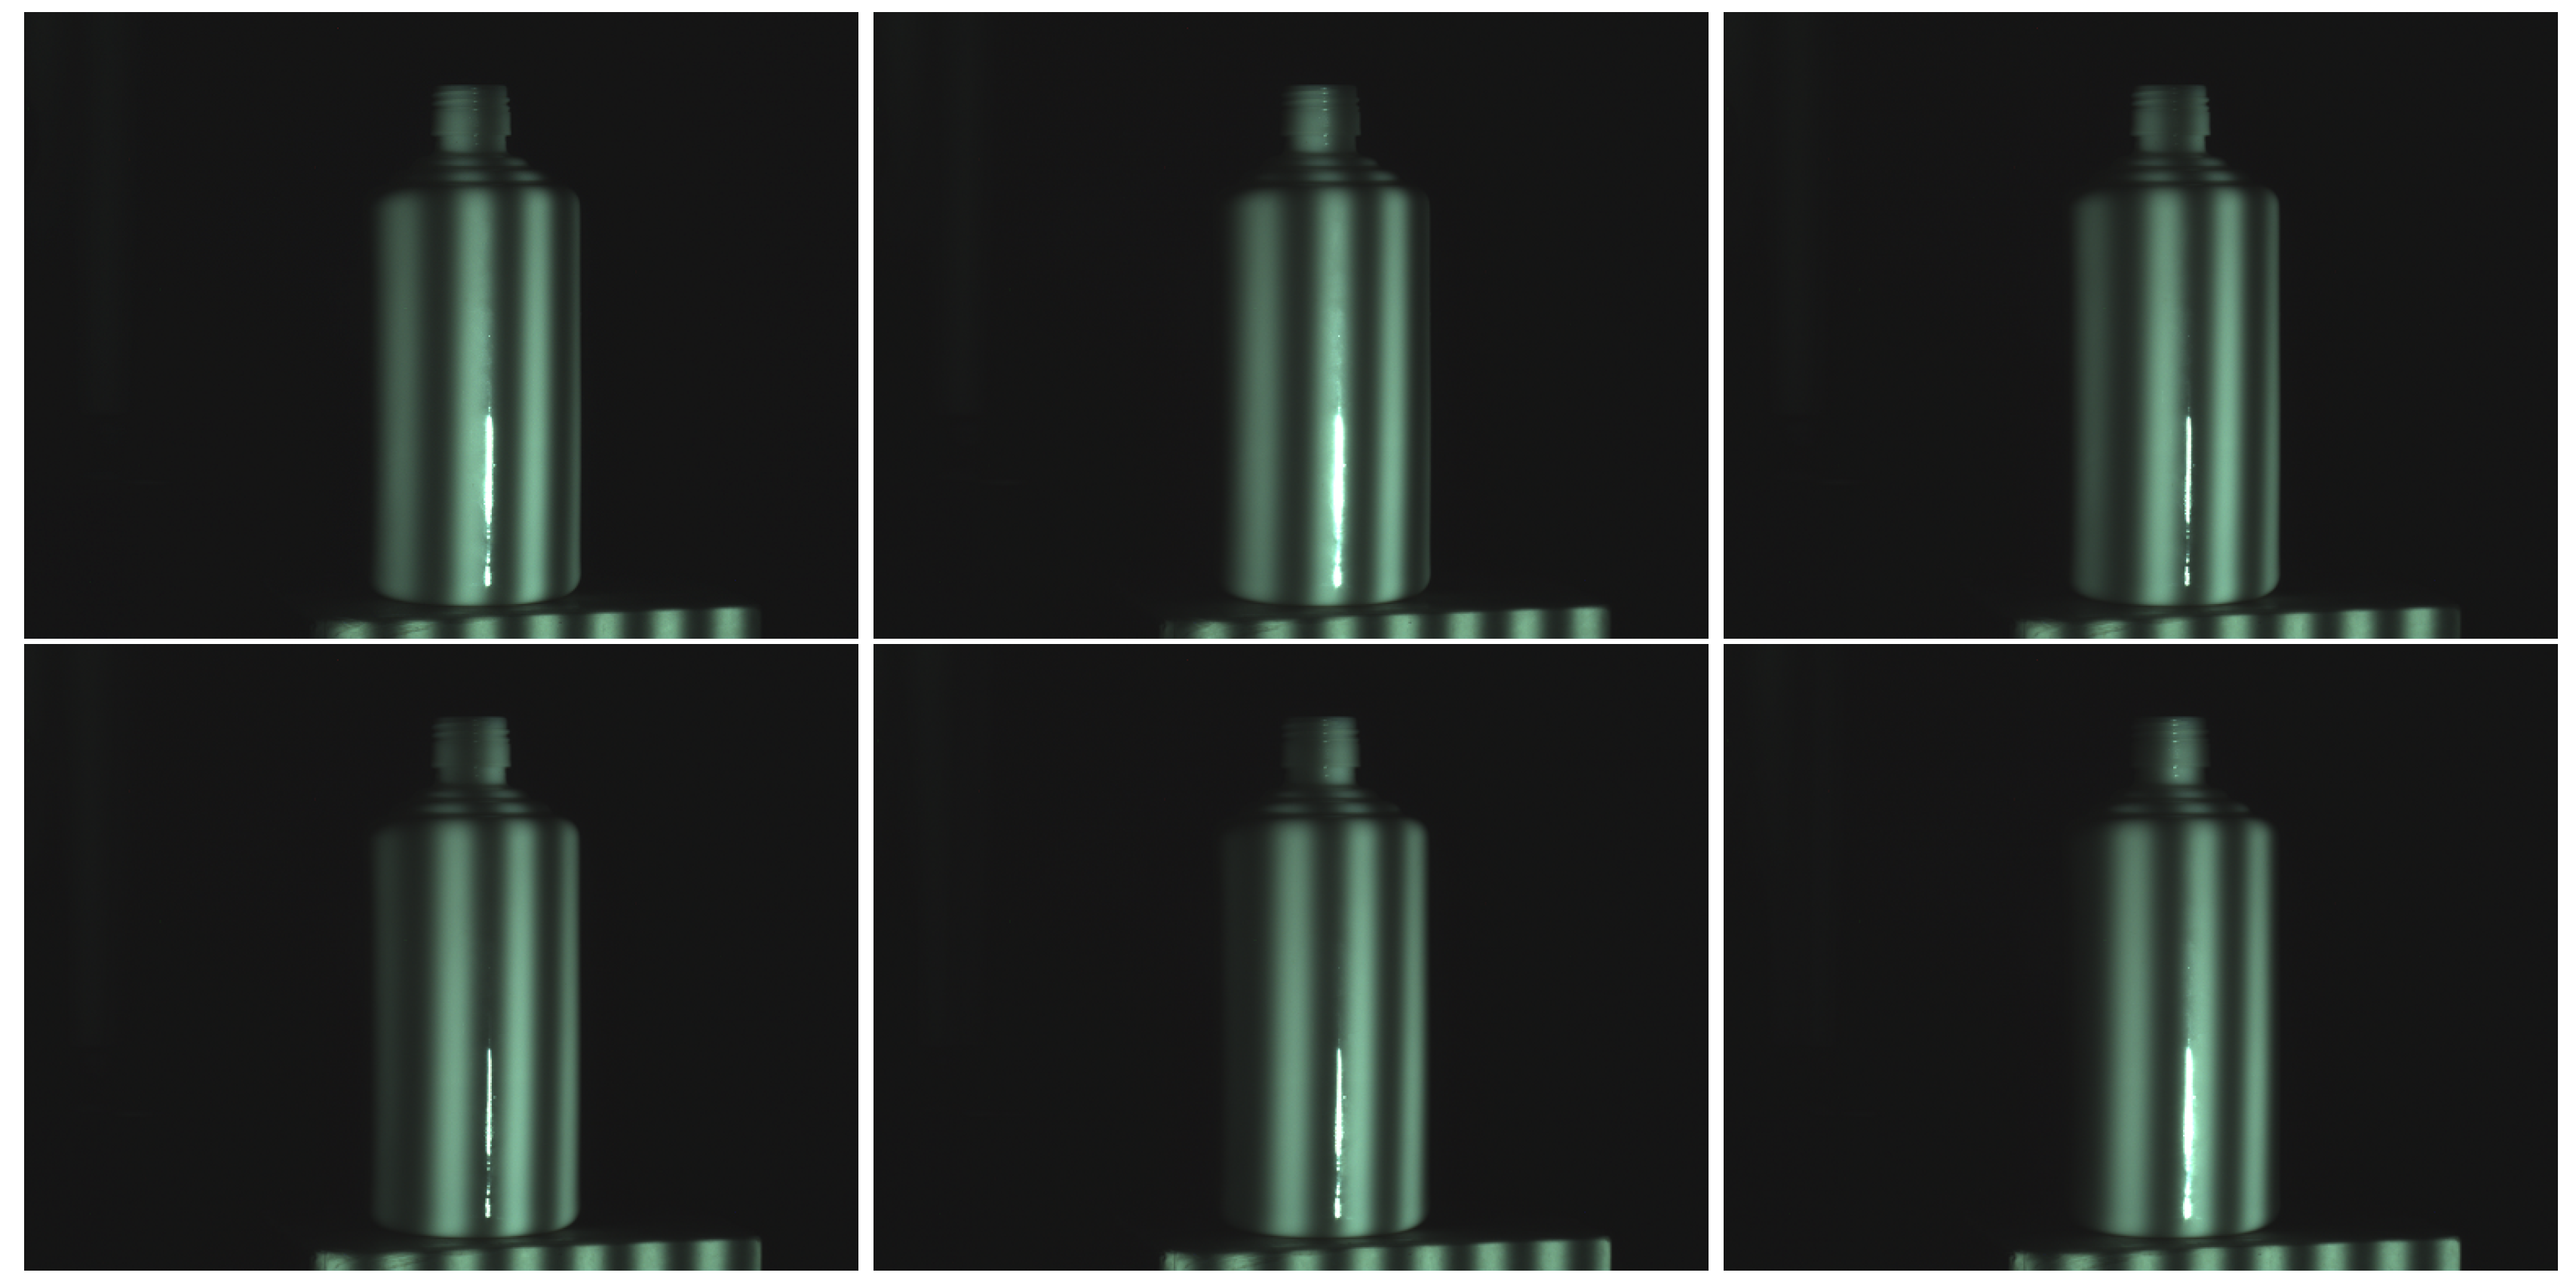
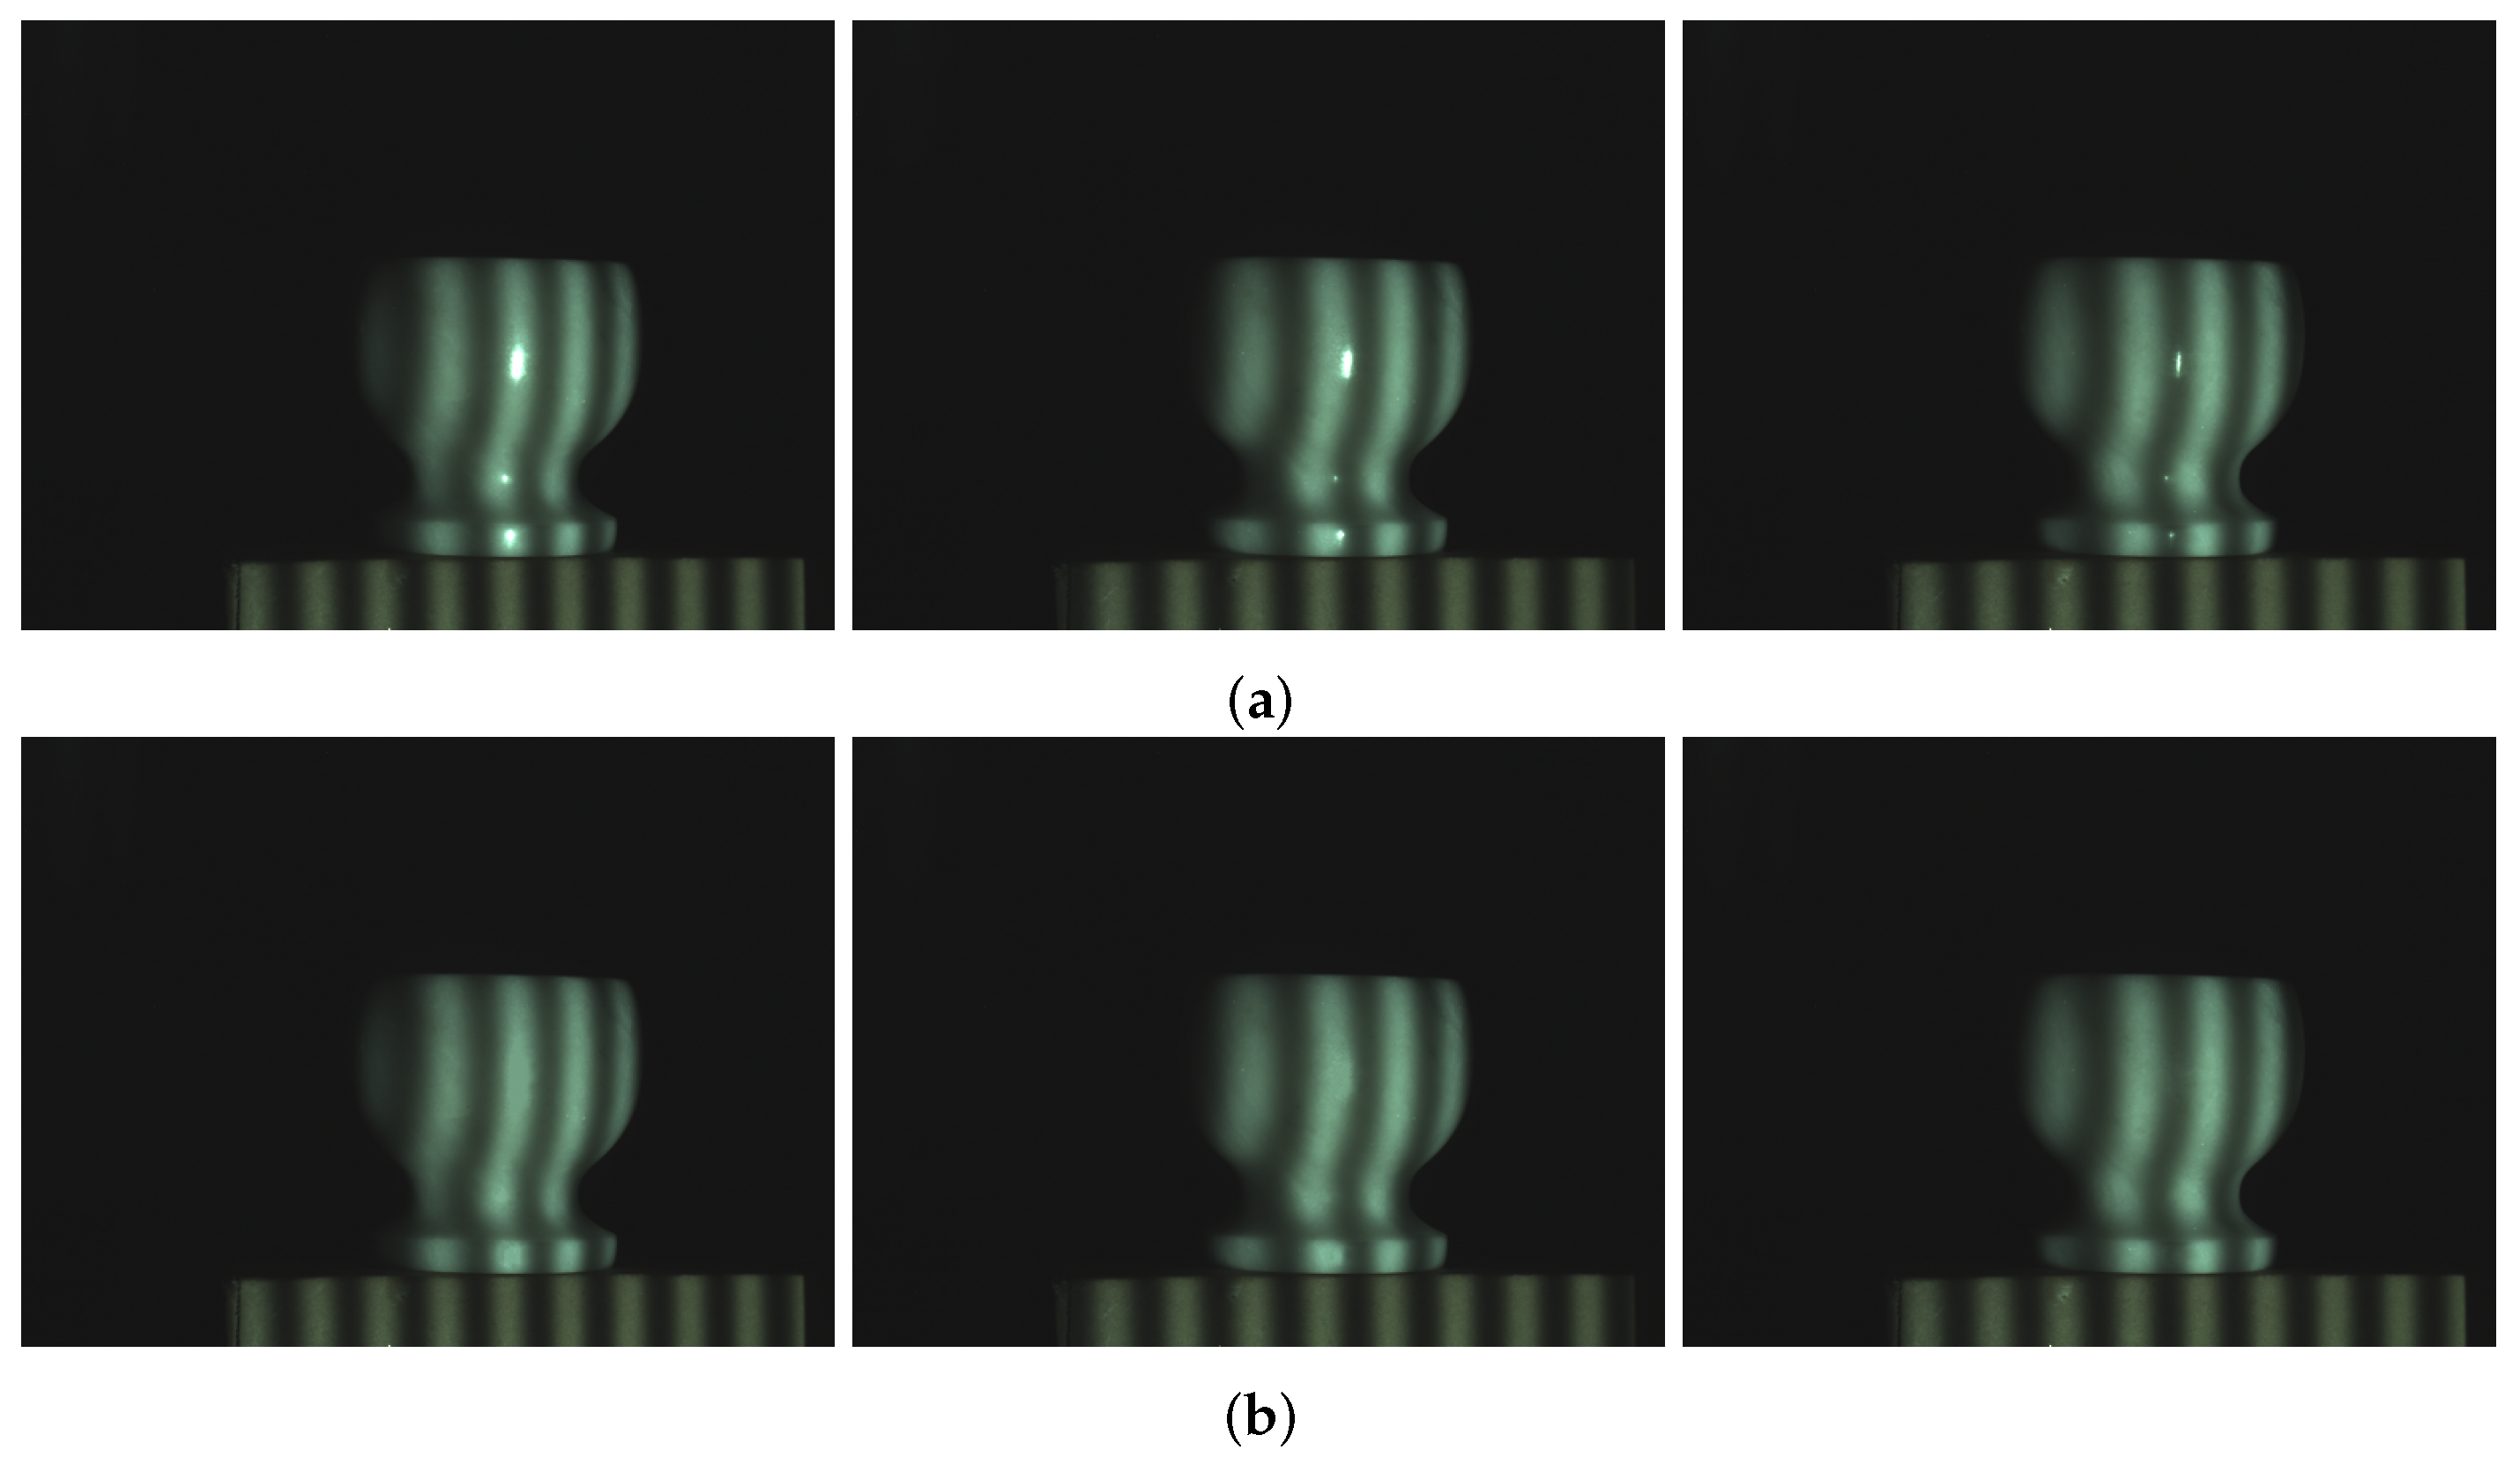
4.1. System Introduction
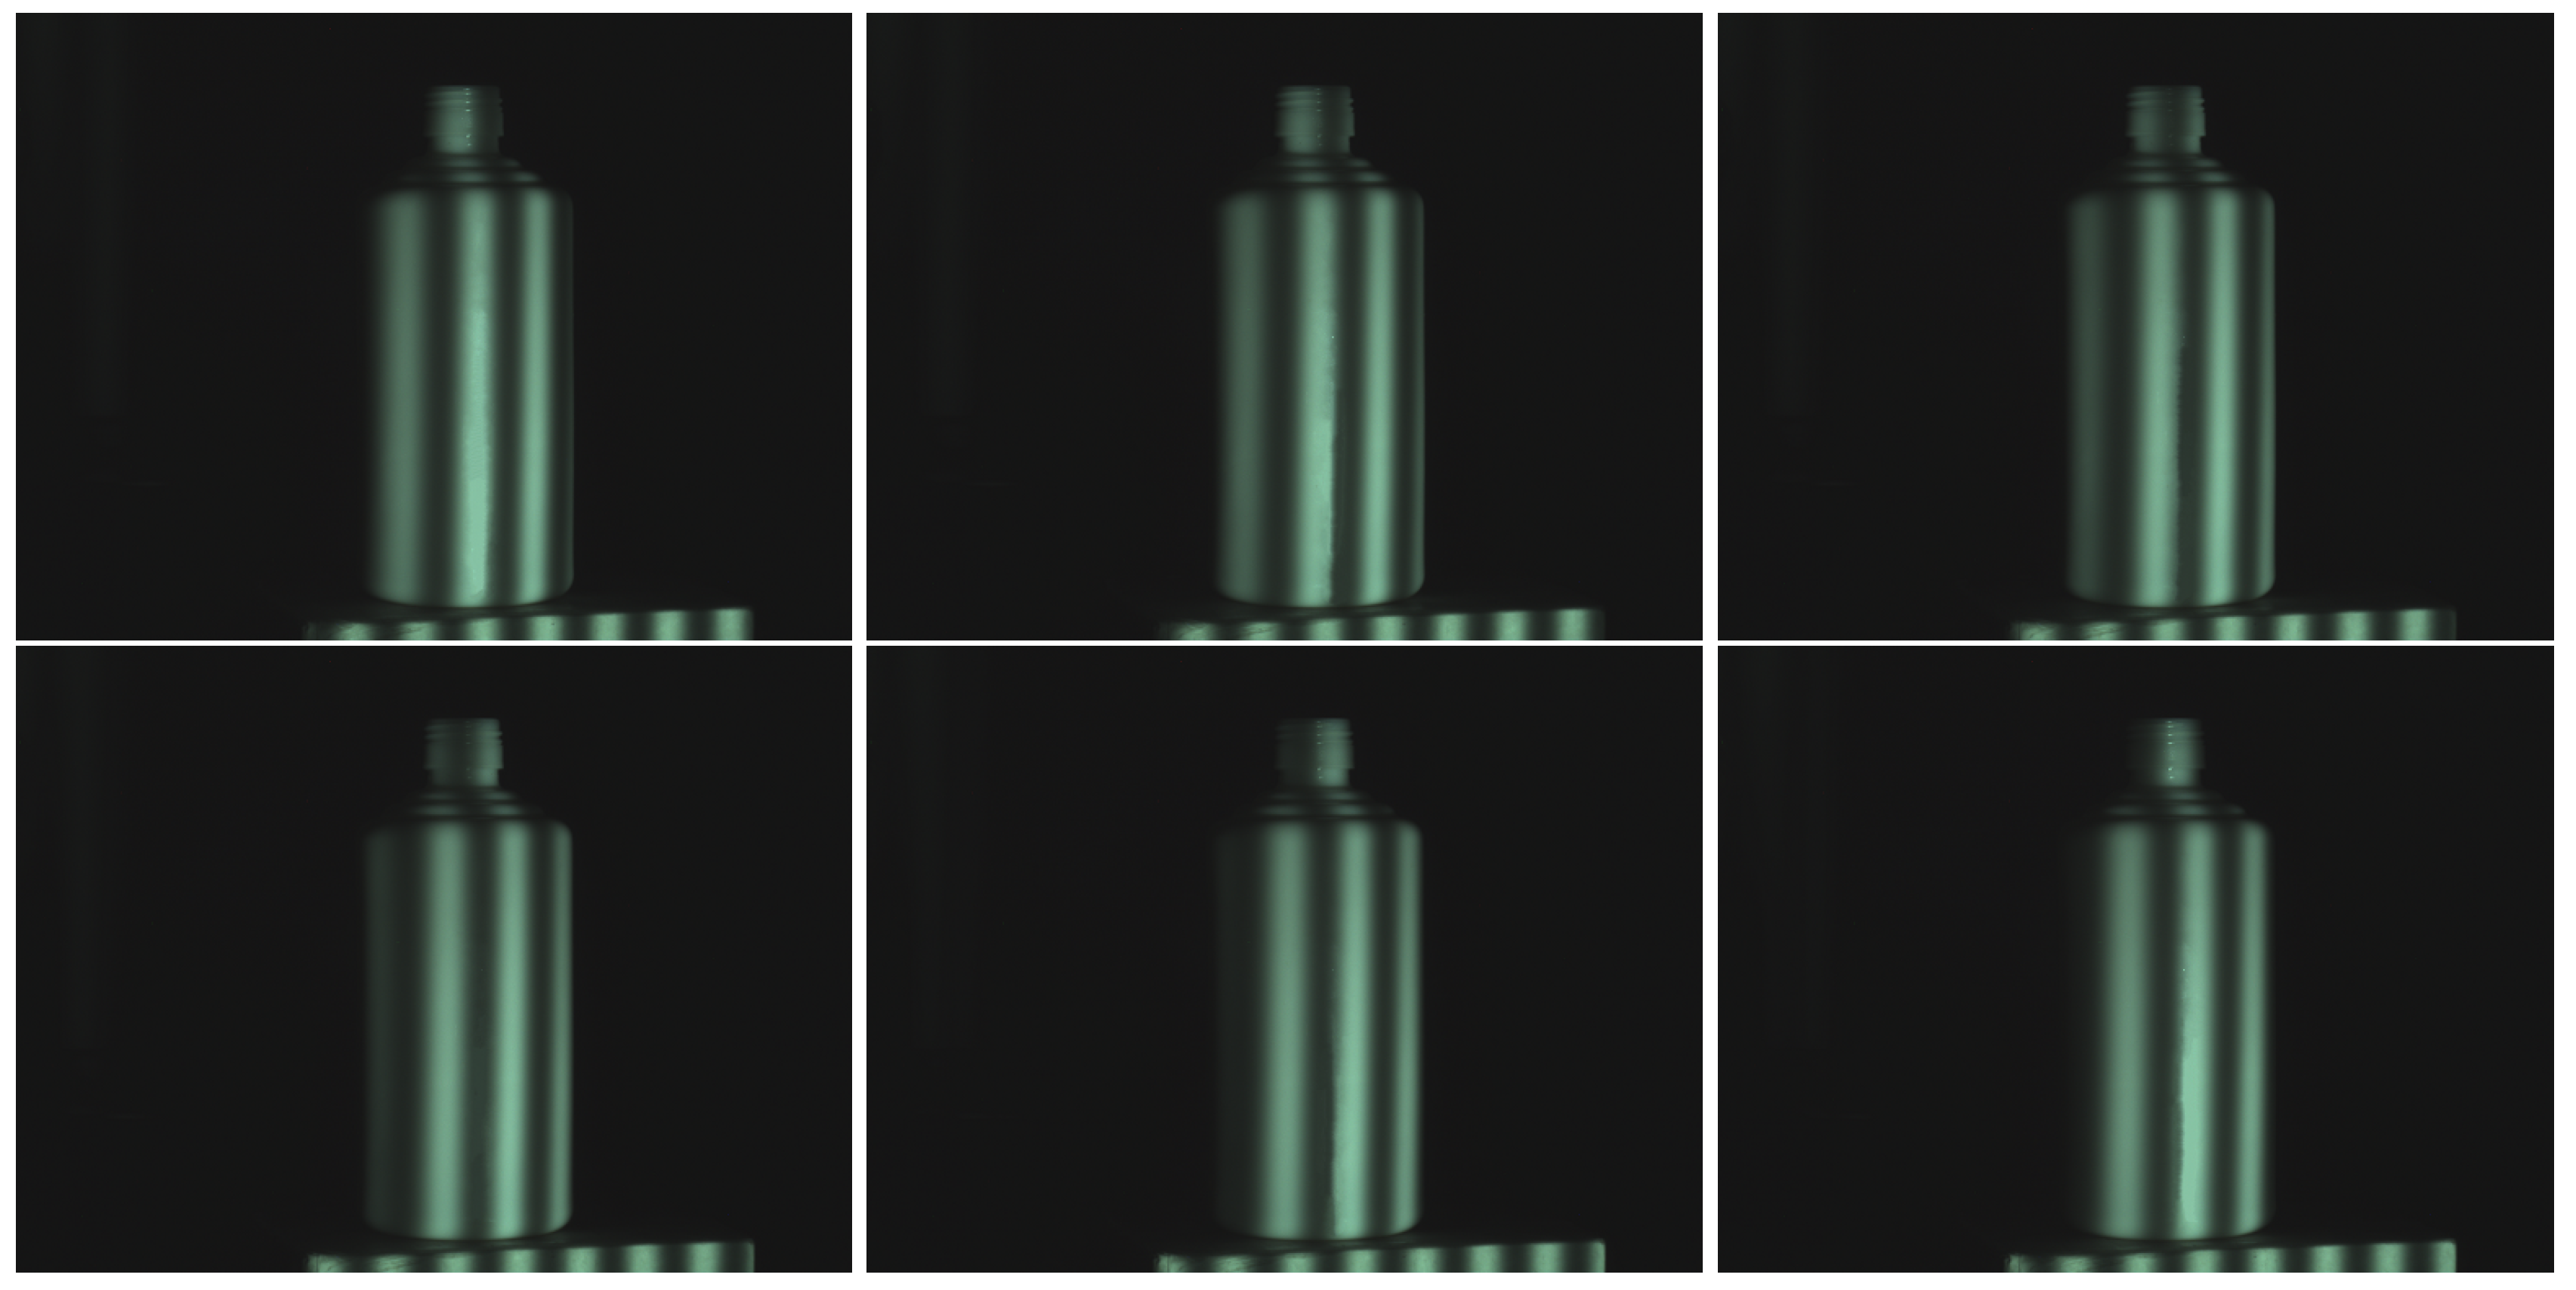
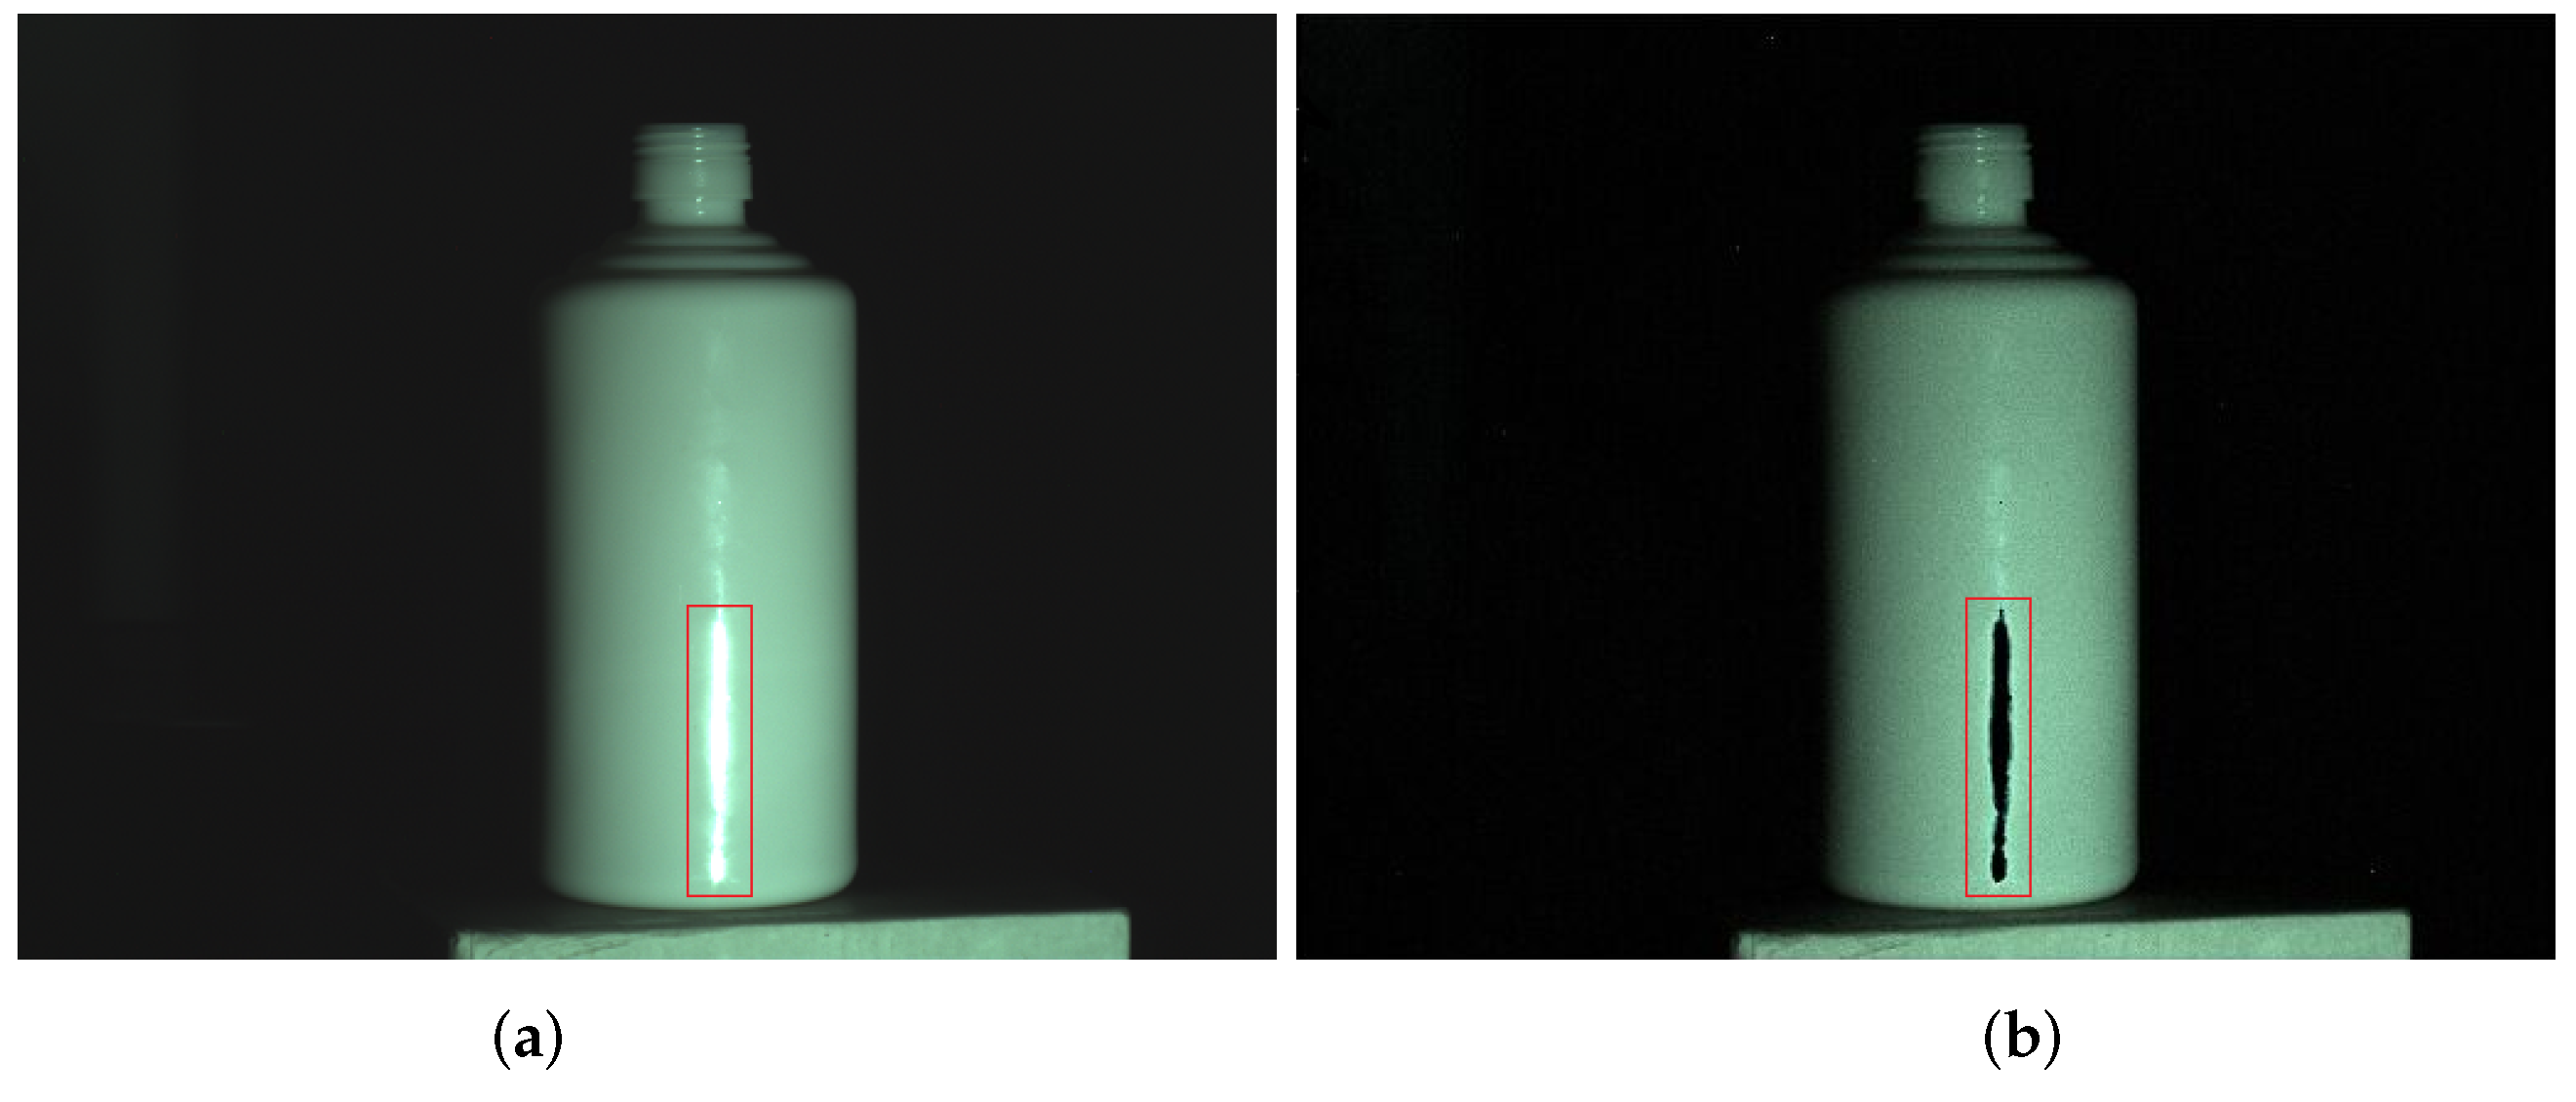
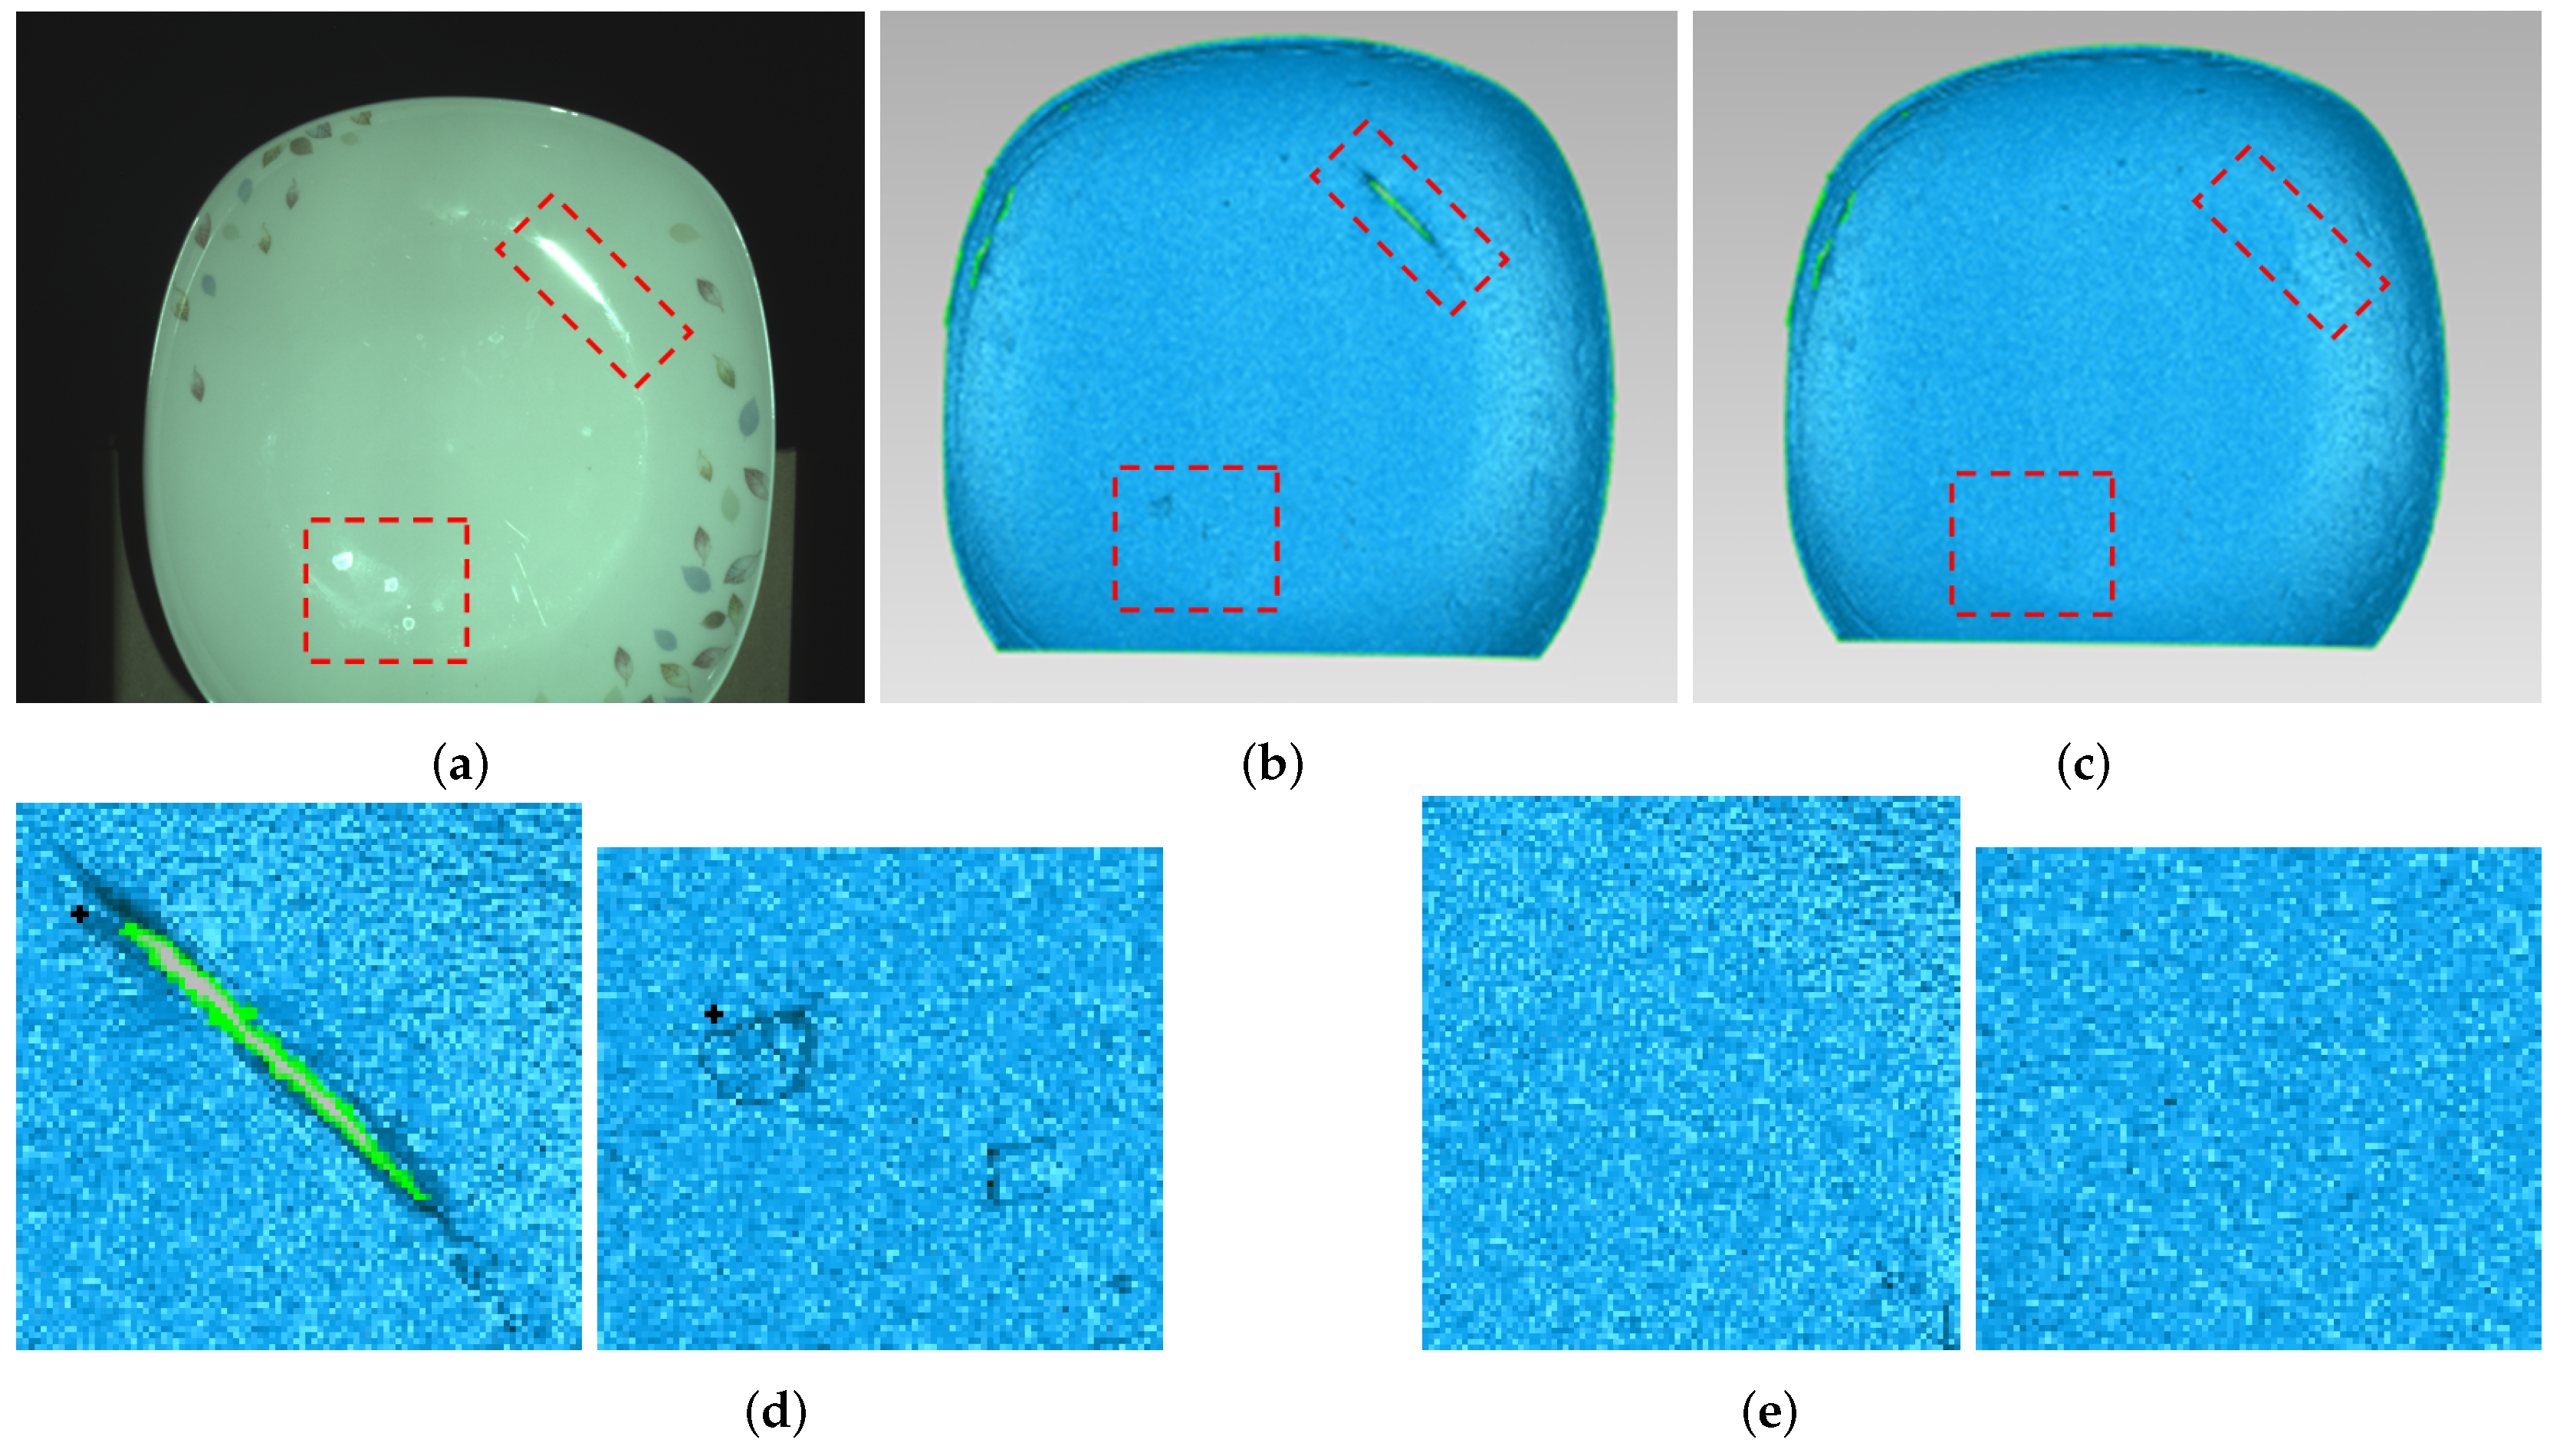
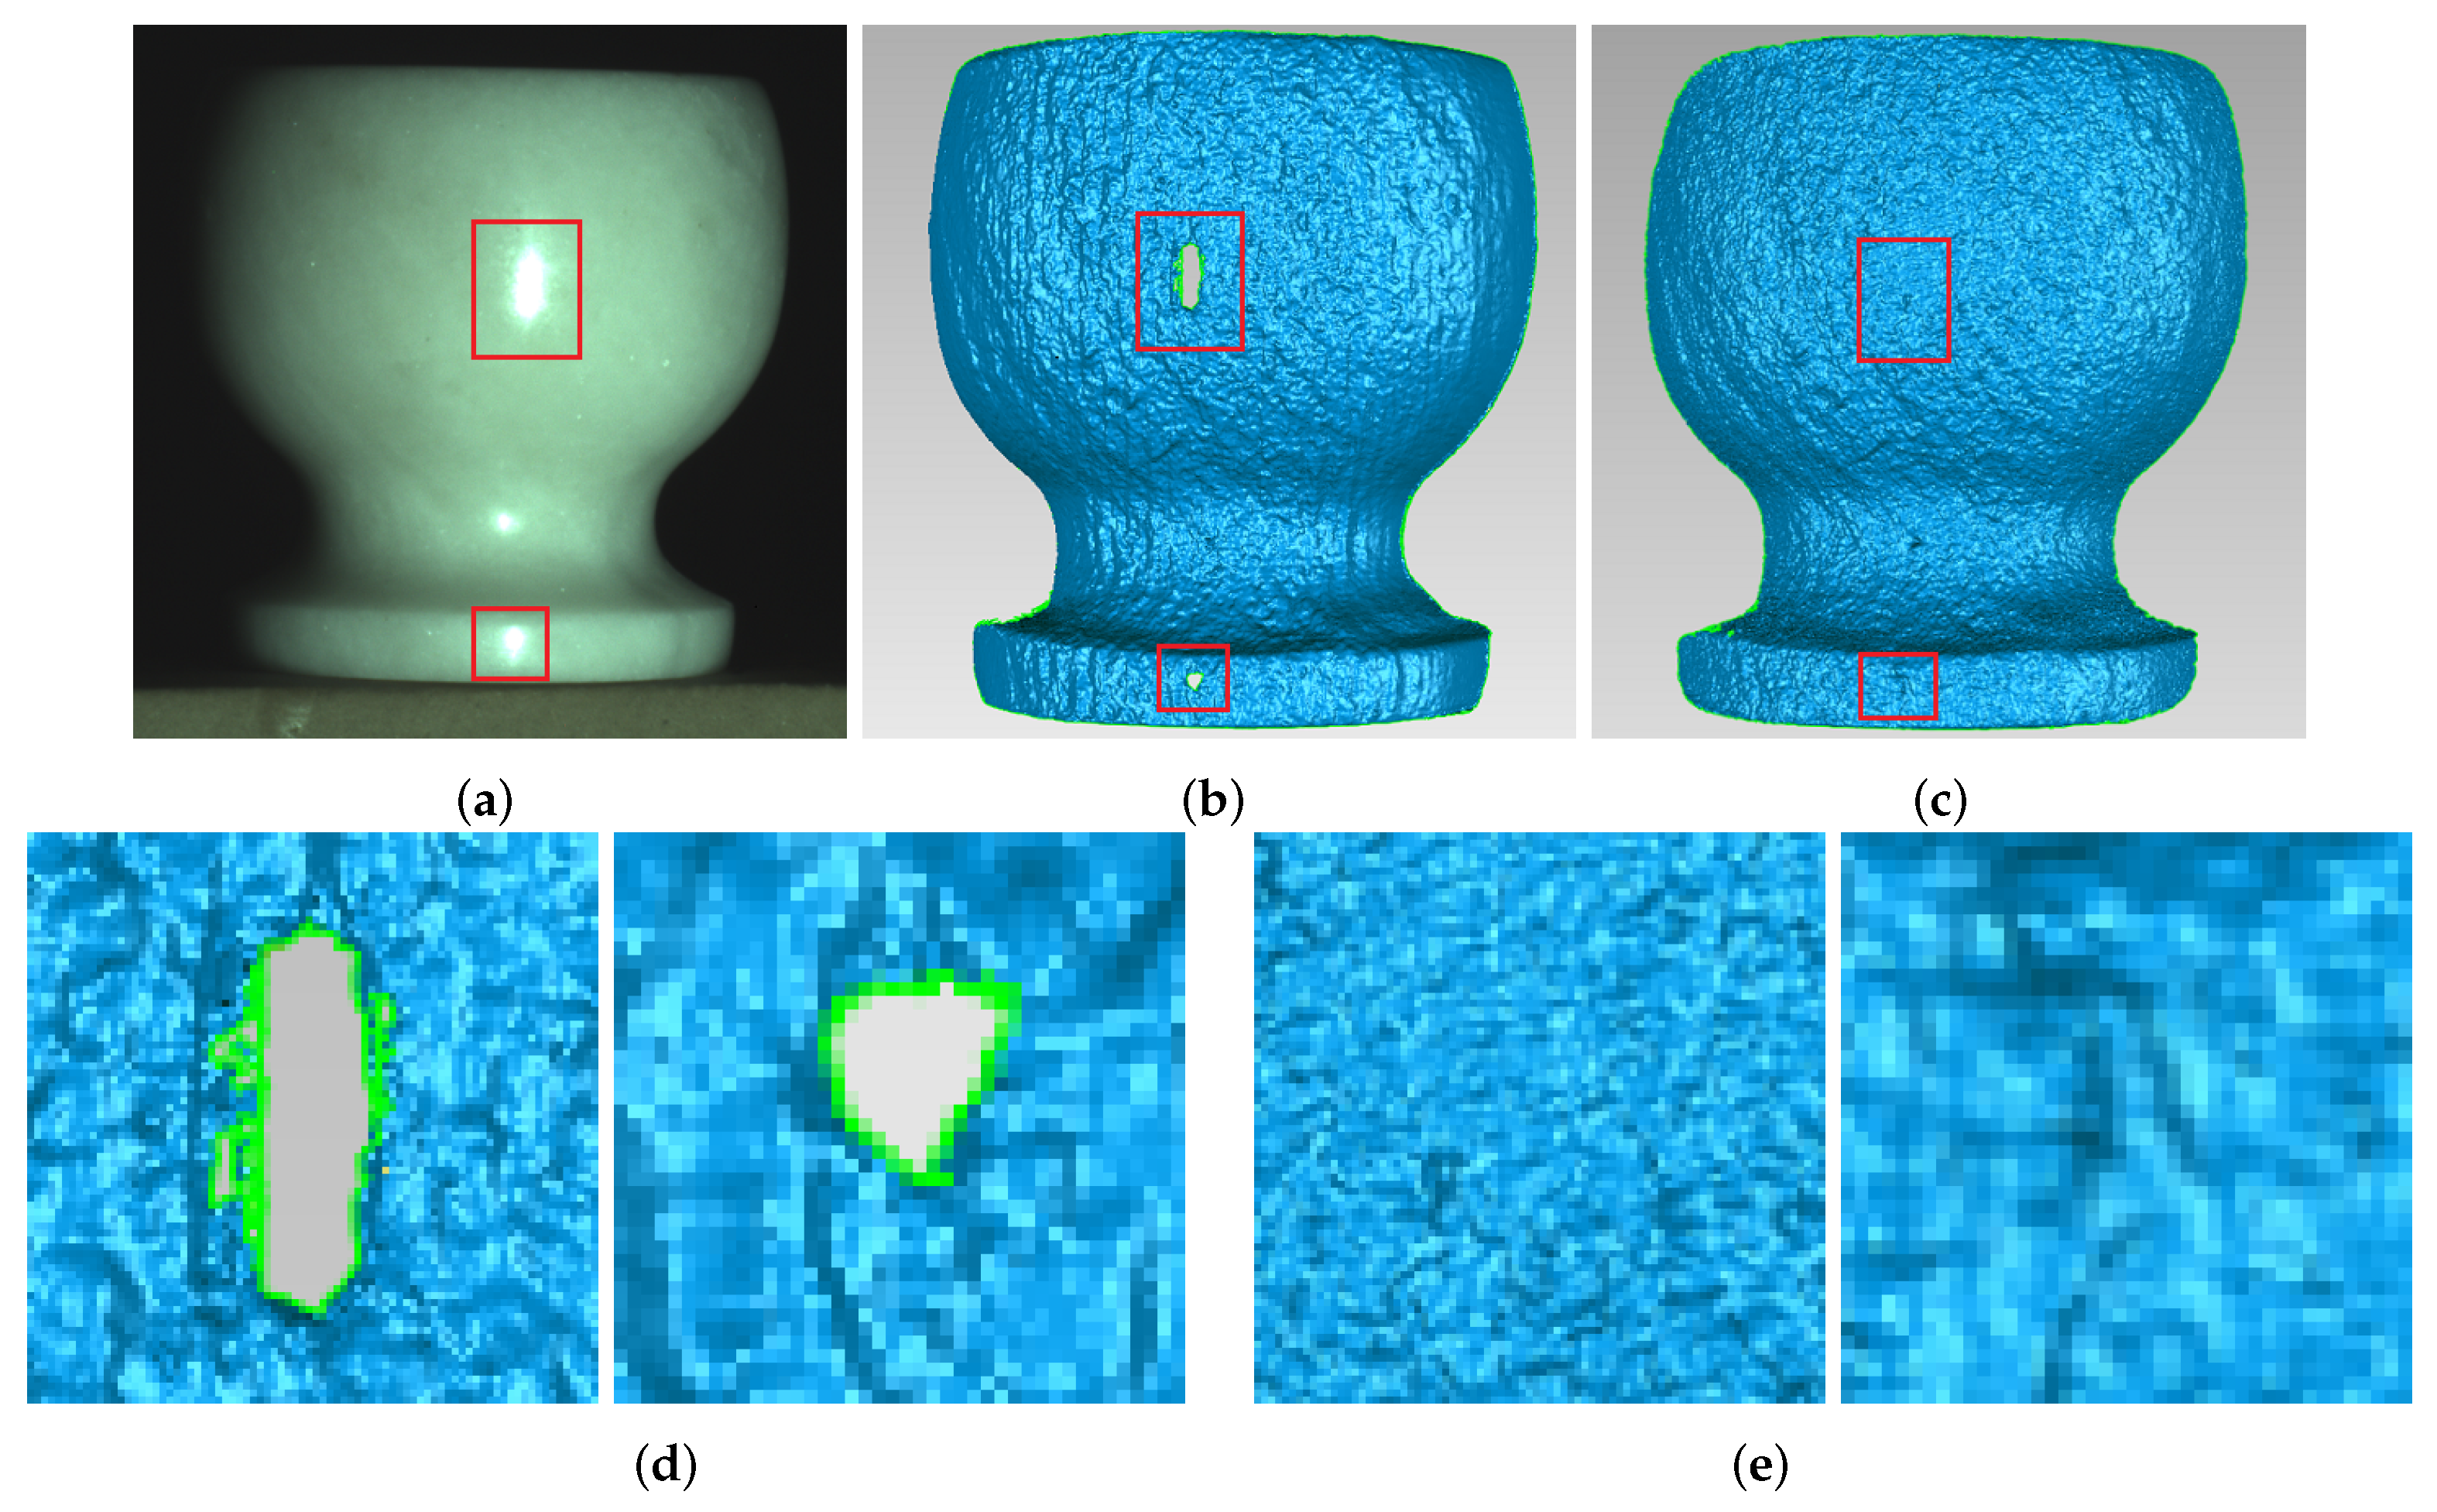
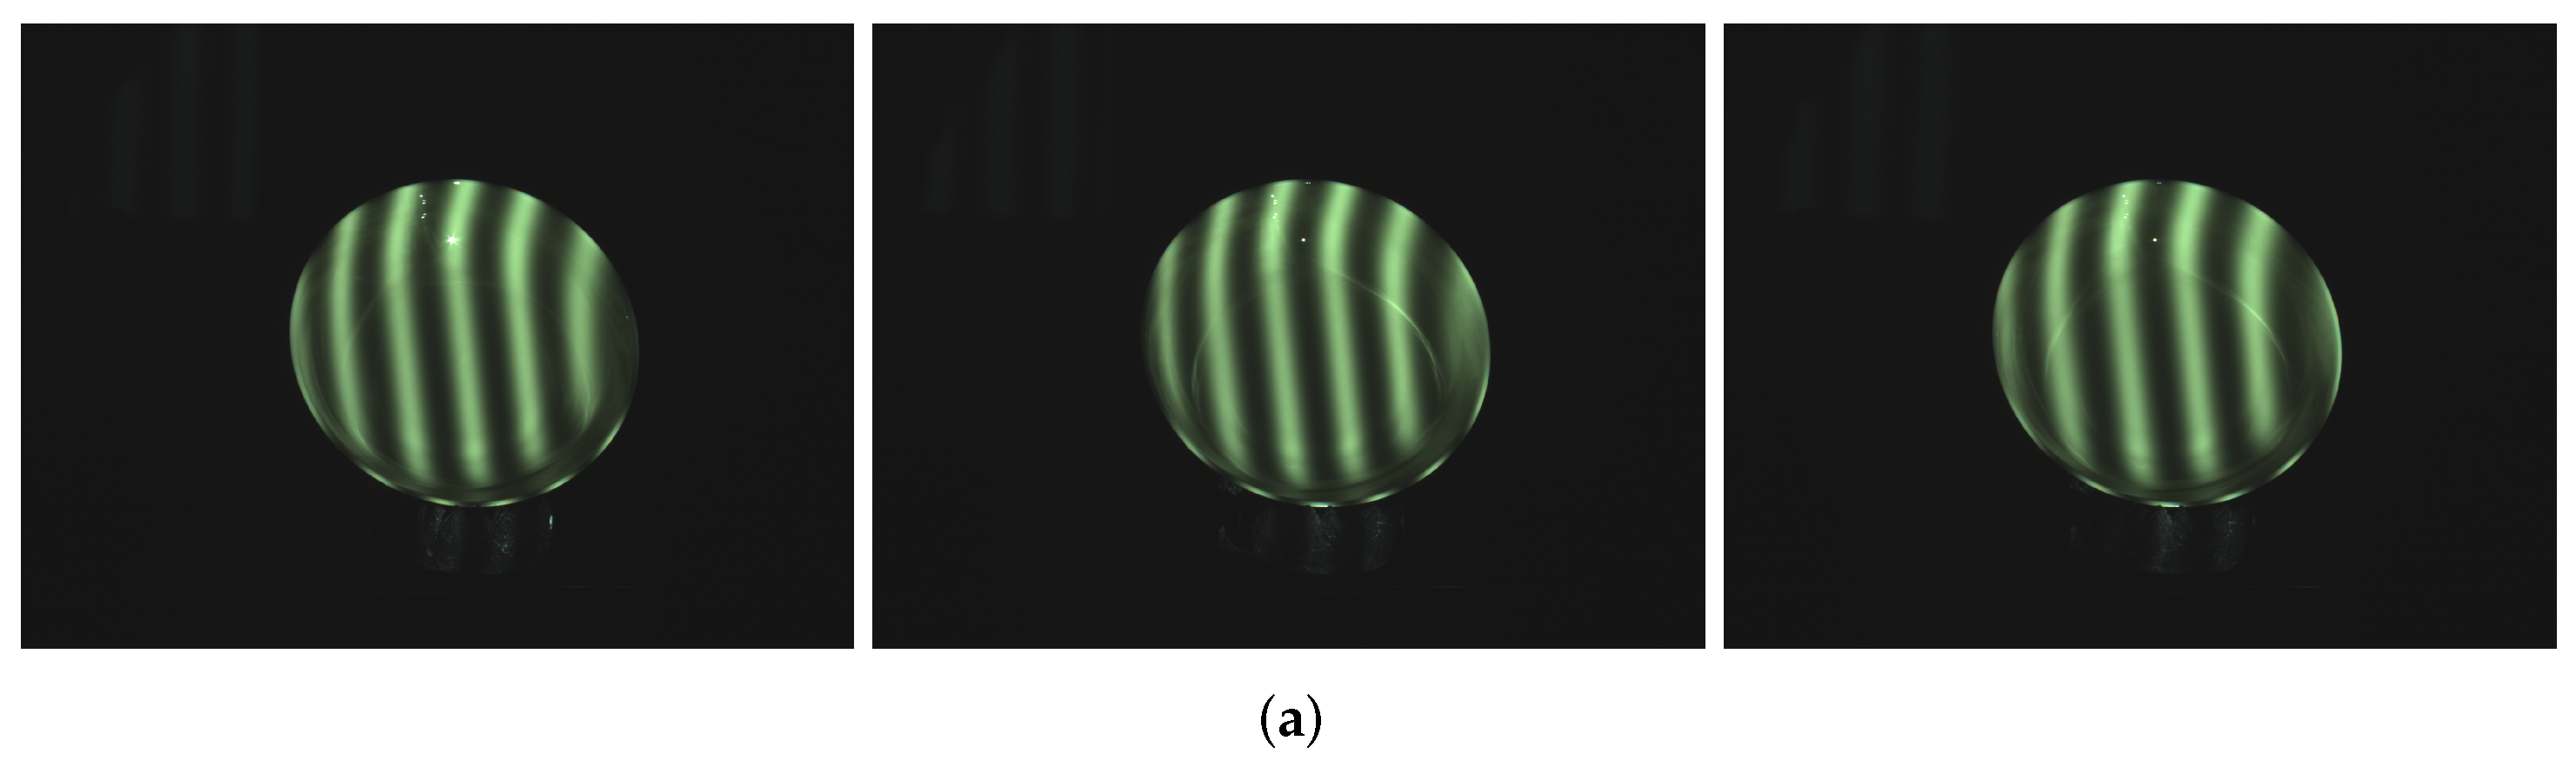
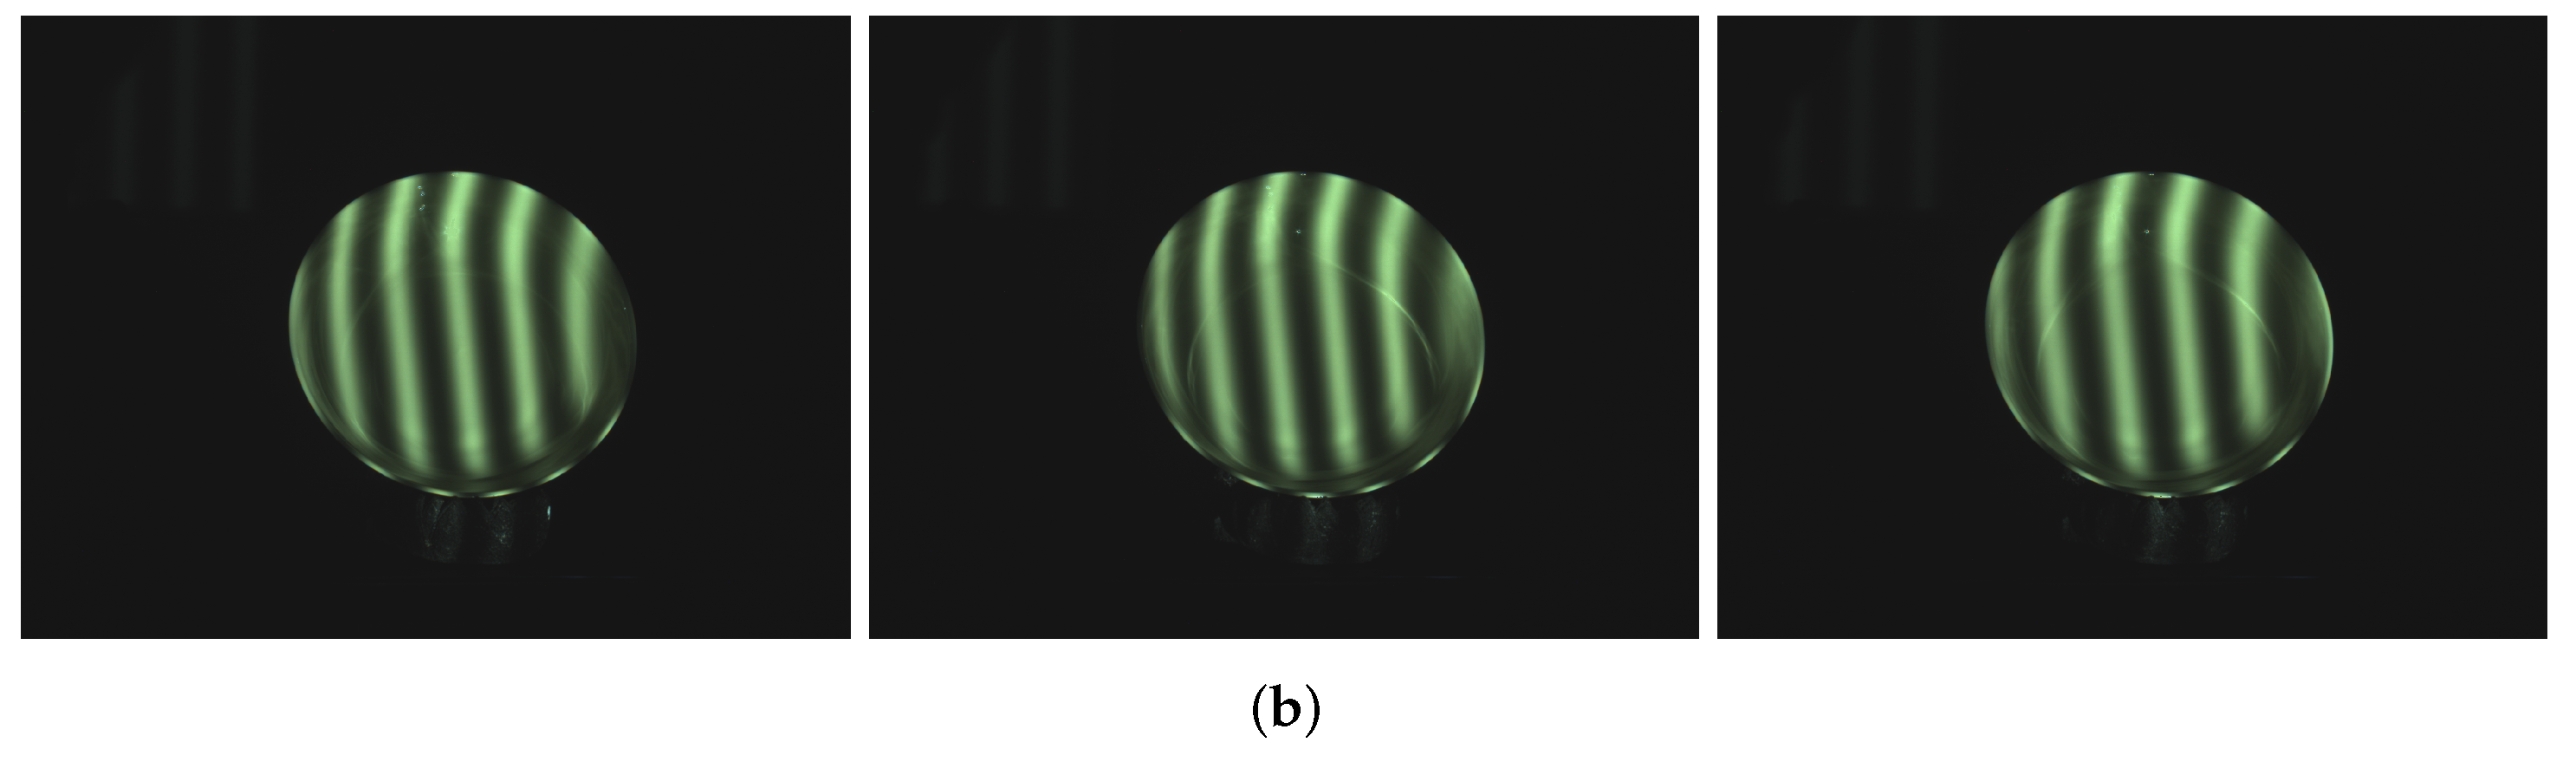
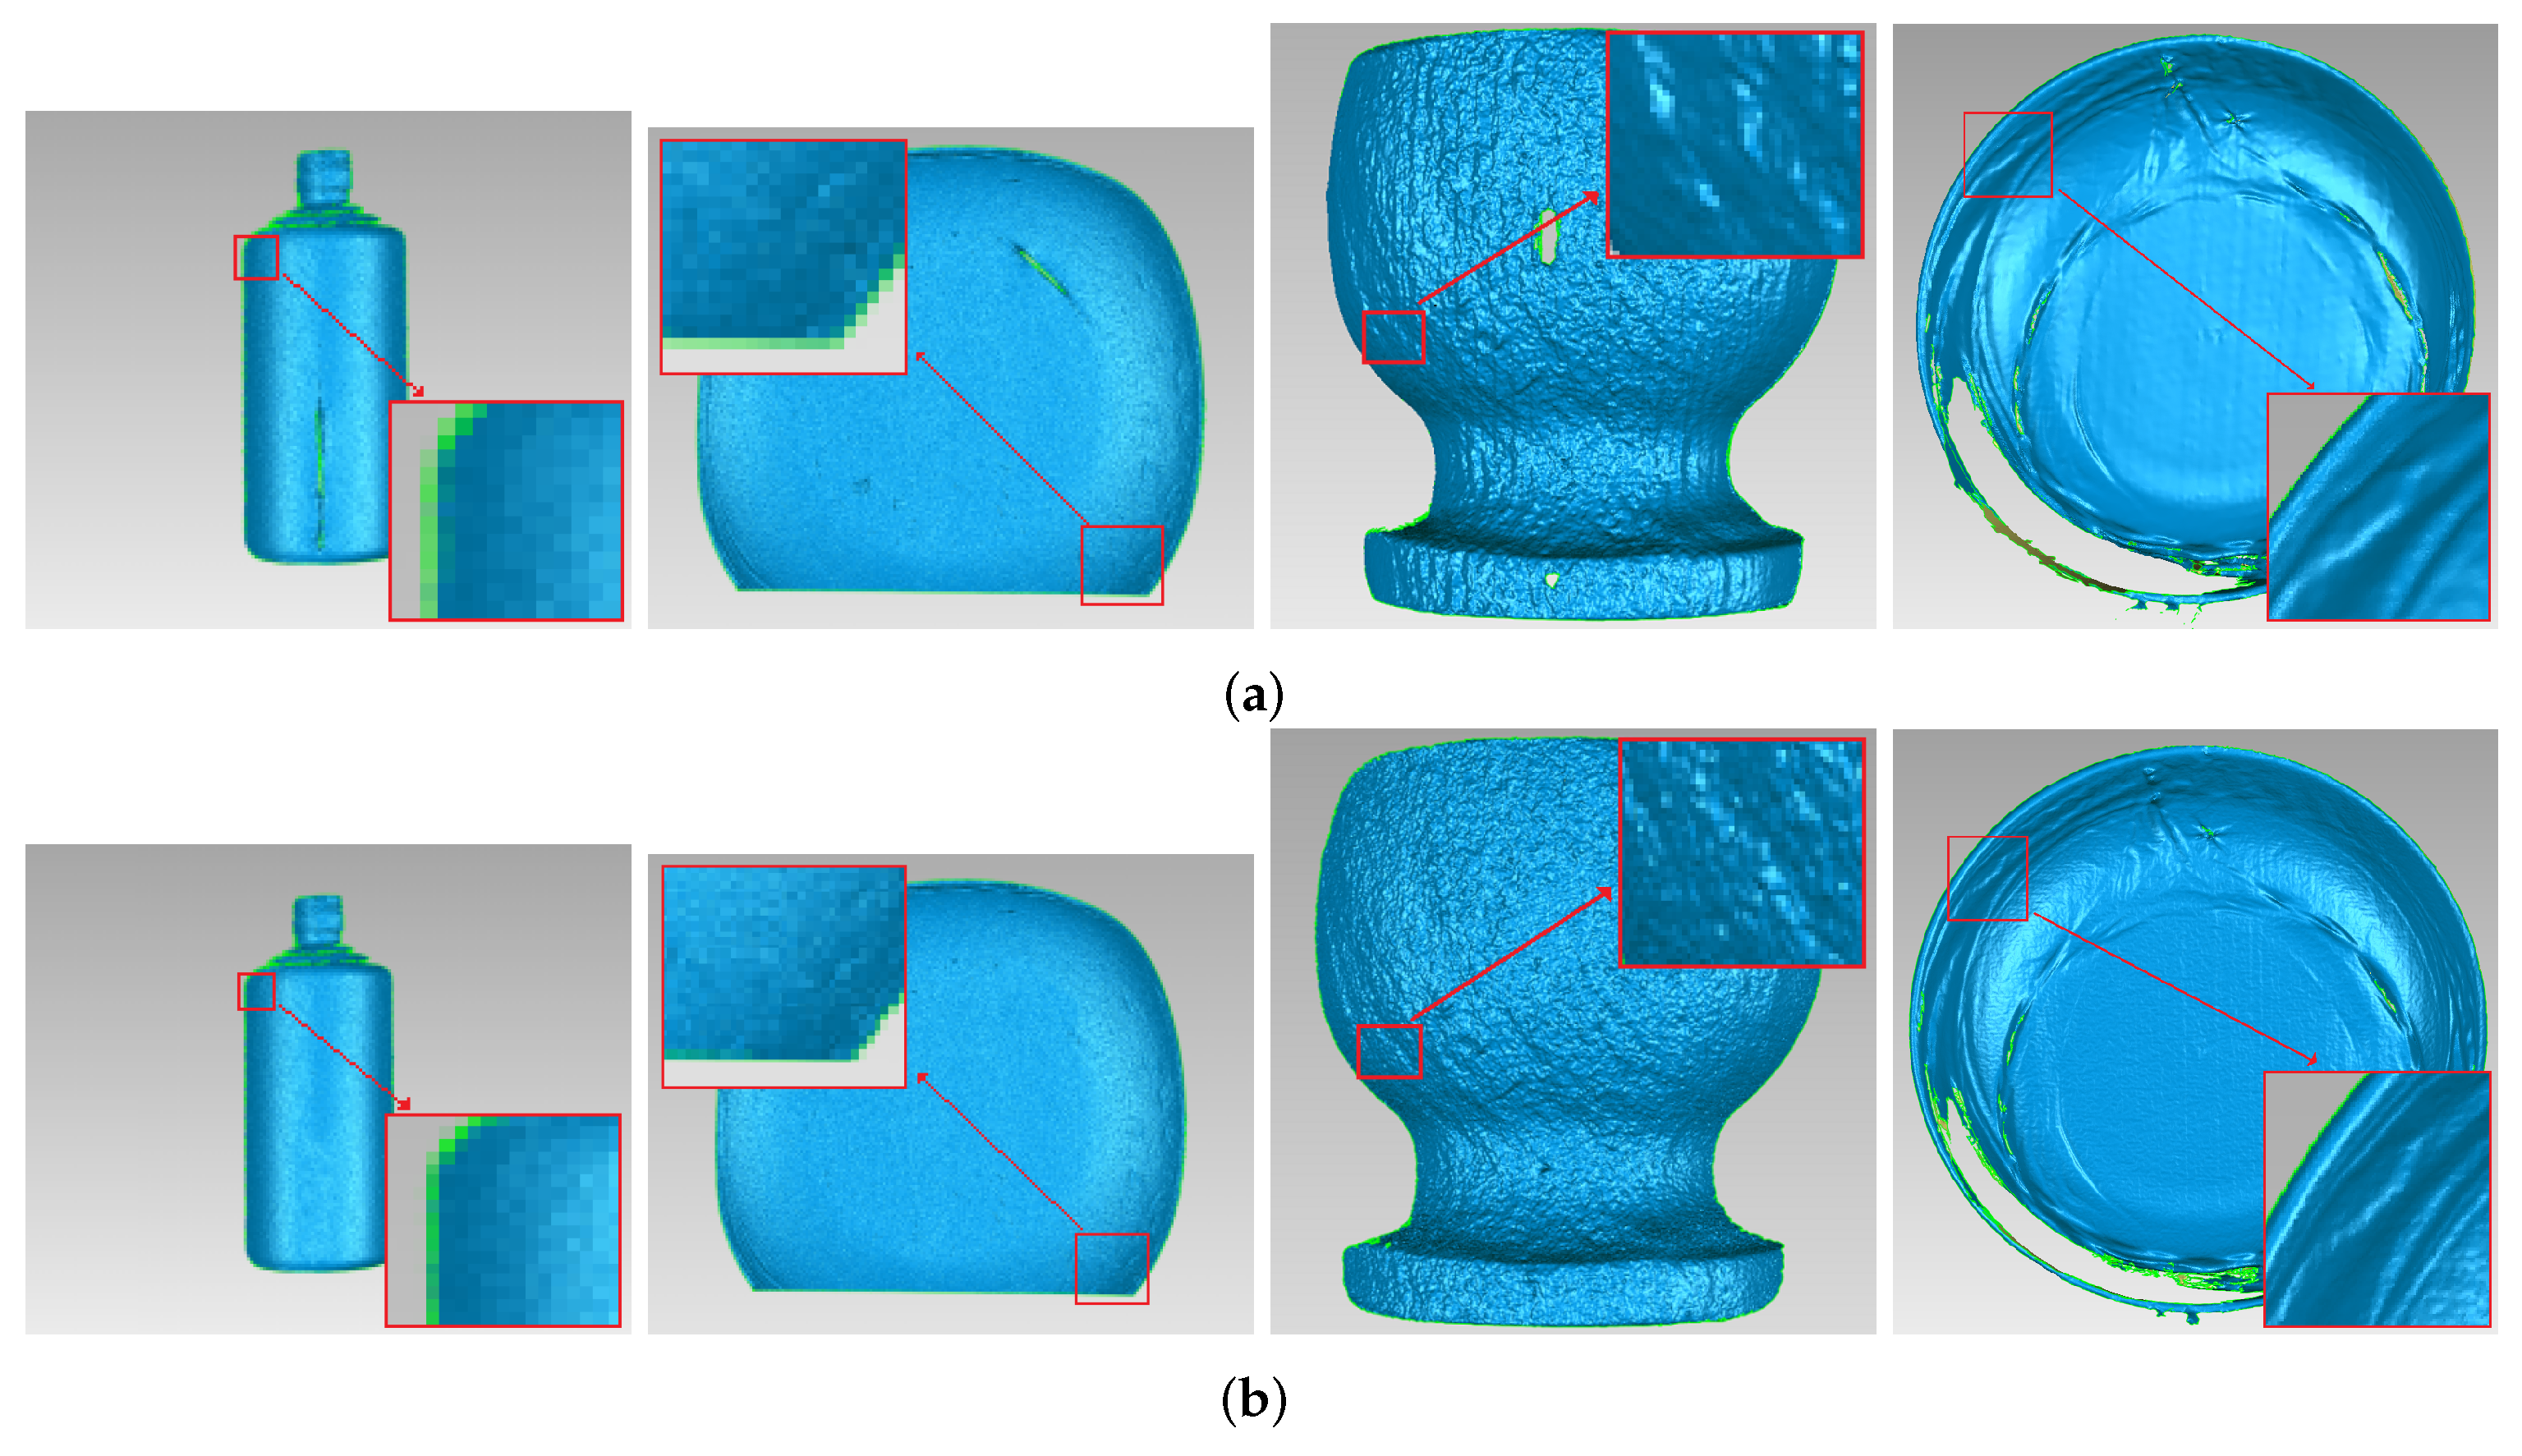
4.2. Visual Comparisons
4.3. Quantitative Analysis
4.4. Objective Performance Comparisons
5. Conclusions
Acknowledgments
Author Contributions
Conflicts of Interest
References
- Bui, L.Q.; Lee, S. Boundary Inheritance Codec for high-accuracy structured light three-dimensional reconstruction with comparative performance evaluation. Appl. Opt. 2013, 52, 5355–5370. [Google Scholar] [CrossRef] [PubMed]
- Chen, F.; Brown, G.M.; Song, M. Overview of three dimensional shape measurement using optical methods. Opt. Eng. 2000, 39, 10–22. [Google Scholar]
- Blais, F. Review of 20 years of range sensor development. Electron Imaging 2004, 13, 231–240. [Google Scholar] [CrossRef]
- Zhang, Z.H. Review of single-shot 3D shape measurement by phase calculation-based fringe projection techniques. Opt. Lasers Eng. 2012, 50, 1097–1106. [Google Scholar] [CrossRef]
- Nayar, S.K.; Gupta, M. Diffuse Structured Light. In Proceedings of the IEEE International Conference on Computational Photography, Seattle, WA, USA, 28–29 April 2012; pp. 1–11.
- Shafer, S. Using color to separate reflection components. Color Res. Appl. 1985, 10, 210–218. [Google Scholar] [CrossRef]
- Klinker, G.J.; Shafer, S.A.; Kanade, T. The measurement of highlights in color images. Int. J. Comput. Vis. 1988, 2, 7–32. [Google Scholar] [CrossRef]
- Mallick, S.P.; Zickler, T.E.; Kriegman, D.J.; Belhumeur, P.N. Beyond lambert: Reconstructing specular surfaces using color. In Proceedings of the 2005 IEEE Computer Society Conference on Computer Vision and Pattern Recognition, San Diego, CA, USA, 20–26 June 2005; pp. 619–626.
- Kokku, R.; Brooksby, G. Improving 3D surface measurement accuracy on metallic surfaces. Proc. SPIE 2005, 5856, 618–624. [Google Scholar]
- Yang, Y.M.; Fan, J.Z.; Zhao, J. Preprocessing for highly reflective surface defect image. Opt. Precis. Eng. 2010, 18, 2288–2296. [Google Scholar]
- Chai, Y.T.; Wang, Z.; Gao, J.M.; Huang, J.H. Highlight Removal Based on Frequency-Domain Filtering. Laser Optoelectron. Prog. 2013, 5, 131–139. [Google Scholar]
- Wolff, L.; Boult, T. Constraining object features using polarization reflectance model. IEEE Trans. Pattern Anal. Mach. Intell. 1991, 13, 635–657. [Google Scholar] [CrossRef]
- Nayar, S.; Fang, X.; Boult, T. Removal of Specularities using Color and Polarization. In Proceedings of the IEEE Computer Society Conference on Computer Vision and Pattern Recognition, New York, NY, USA, 15–18 June 1993.
- Sohn, B.J.; Lee, S. Analytical relationship between polarized reflectivities on the specular surface. Int. J. Remote Sens. 2013, 34, 2368–2374. [Google Scholar] [CrossRef]
- Tsuru, T. Tilt-ellipsometry of object surface by specular reflection for three-dimensional shape Measurement. Opt. Express 2013, 21, 6625–6632. [Google Scholar] [CrossRef] [PubMed]
- Feris, R.; Raskar, R.; Tan, K.H.; Turk, M. Non-photorealistic camera: Depth edge detection and stylized rendering using multi-flash imaging. ACM Trans. Graph. 2004, 23, 679–688. [Google Scholar]
- Liu, Y.K.; Su, X.Y.; Wu, Q.Y. Three Dimensional Shape Measurement for Specular Surface Based on Fringe Reflection. Acta Opt. Sin. 2006, 26, 1636–1640. [Google Scholar]
- Qian, X.P.; Harding, K.G. Computational approach for optimal sensor setup. Opt. Eng. 2003, 42, 1238–1248. [Google Scholar] [CrossRef]
- Hu, Q.; Harding, K.G.; Du, X.; Hamilton, D. Shiny parts measurement using color separation. Proc. SPIE 2005, 6000, 125–132. [Google Scholar]
- Sato, Y.; Ikeuchi, K. Temporal-color space analysis of reflection. J. Opt. Soc. Am. A 2001, 11, 2990–3002. [Google Scholar] [CrossRef]
- Zheng, J.Y.; Fukagawa, Y.; Abe, N. 3D surface estimation and model construction from specular motion in image sequences. IEEE Trans. Pattern Anal. Mach. Intell. 1997, 19, 513–520. [Google Scholar] [CrossRef]
- Liu, G.H.; Liu, X.Y.; Feng, Q.Y. 3D shape measurement of object with high dynamic range of objects with high dynamic range of surface reflectivity. Appl. Opt. 2011, 50, 4557–4565. [Google Scholar] [CrossRef] [PubMed]
- Asundi, A.K. Moiré methods using computer-generated gratings. Opt. Eng. 1993, 32, 107–116. [Google Scholar] [CrossRef]
- Jiang, Y.Z. Acquiring a Complete 3D Model from Specular Motion under the Illumination of Circular-Shaped Light Sources. IEEE Trans. Pattern Anal. Mach. Intell. 2000, 22, 913–920. [Google Scholar] [CrossRef]
- Guo, H.W.; Tao, T. Specular surface measurement by using a moving diffusive structured light source. Proc. SPIE 2007, 6834, 683443E. [Google Scholar]
- Sills, K.; Bone, G.M.; Capson, D. Defect identification on specular machined surfaces. Mach. Vis. Appl. 2014, 25, 377–388. [Google Scholar] [CrossRef]
- Tan, R.T.; Ikeuchi, K. Separating Reflection Components of Textured Surfaces Using a Single Image. IEEE Trans. Pattern Anal. Mach. Intell. 2005, 27, 178–193. [Google Scholar] [CrossRef] [PubMed]
- Criminisi, A.; Perez, P.; Toyama, K. Object removal by exemplar-based inpainting. In Proceedings of the 2003 IEEE Computer Society Conference on Computer Vision and Pattern Recognition, Madison, WI, USA, 16–22 June 2003; pp. 1–8.
- Wang, C.Q.; Zhu, F.W. Remving Highly Illuminated Regions from a Single Image. J. Shanghai University 2007, 13, 151–154. [Google Scholar]


| Measured Object | The Number of Highlight Pixels | Total Number of Pixels in Red Frame | Percentage | Reduction |
|---|---|---|---|---|
| Original image of ceramic bottle | 10,326 | 88,660 | 11.6% | 43.8 |
| Processed image of ceramic bottle | 236 | 0.27% | ||
| original image of ceramic plate | 5637 | 37492 | 15.0% | 41.4 |
| Processed image of ceramic plate | 136 | 0.36% | ||
| original image of marble pot | 3365 | 62,944 | 5.3% | 33.0 |
| Processed image of marble pot | 102 | 0.16% | ||
| original image of yellow plate | 162 | 9183 | 1.76% | 10.1 |
| Processed image of yellow plate | 16 | 0.17% |
© 2017 by the authors; licensee MDPI, Basel, Switzerland. This article is an open access article distributed under the terms and conditions of the Creative Commons Attribution (CC BY) license (http://creativecommons.org/licenses/by/4.0/).
Share and Cite
Sun, X.; Liu, Y.; Yu, X.; Wu, H.; Zhang, N. Three-Dimensional Measurement for Specular Reflection Surface Based on Reflection Component Separation and Priority Region Filling Theory. Sensors 2017, 17, 215. https://doi.org/10.3390/s17010215
Sun X, Liu Y, Yu X, Wu H, Zhang N. Three-Dimensional Measurement for Specular Reflection Surface Based on Reflection Component Separation and Priority Region Filling Theory. Sensors. 2017; 17(1):215. https://doi.org/10.3390/s17010215
Chicago/Turabian StyleSun, Xiaoming, Ye Liu, Xiaoyang Yu, Haibin Wu, and Ning Zhang. 2017. "Three-Dimensional Measurement for Specular Reflection Surface Based on Reflection Component Separation and Priority Region Filling Theory" Sensors 17, no. 1: 215. https://doi.org/10.3390/s17010215
APA StyleSun, X., Liu, Y., Yu, X., Wu, H., & Zhang, N. (2017). Three-Dimensional Measurement for Specular Reflection Surface Based on Reflection Component Separation and Priority Region Filling Theory. Sensors, 17(1), 215. https://doi.org/10.3390/s17010215