
Online Learners’ Reading Ability Detection Based on Eye-Tracking Sensors


Abstract
:1. Introduction
2. Major Eye-Tracking Indicators
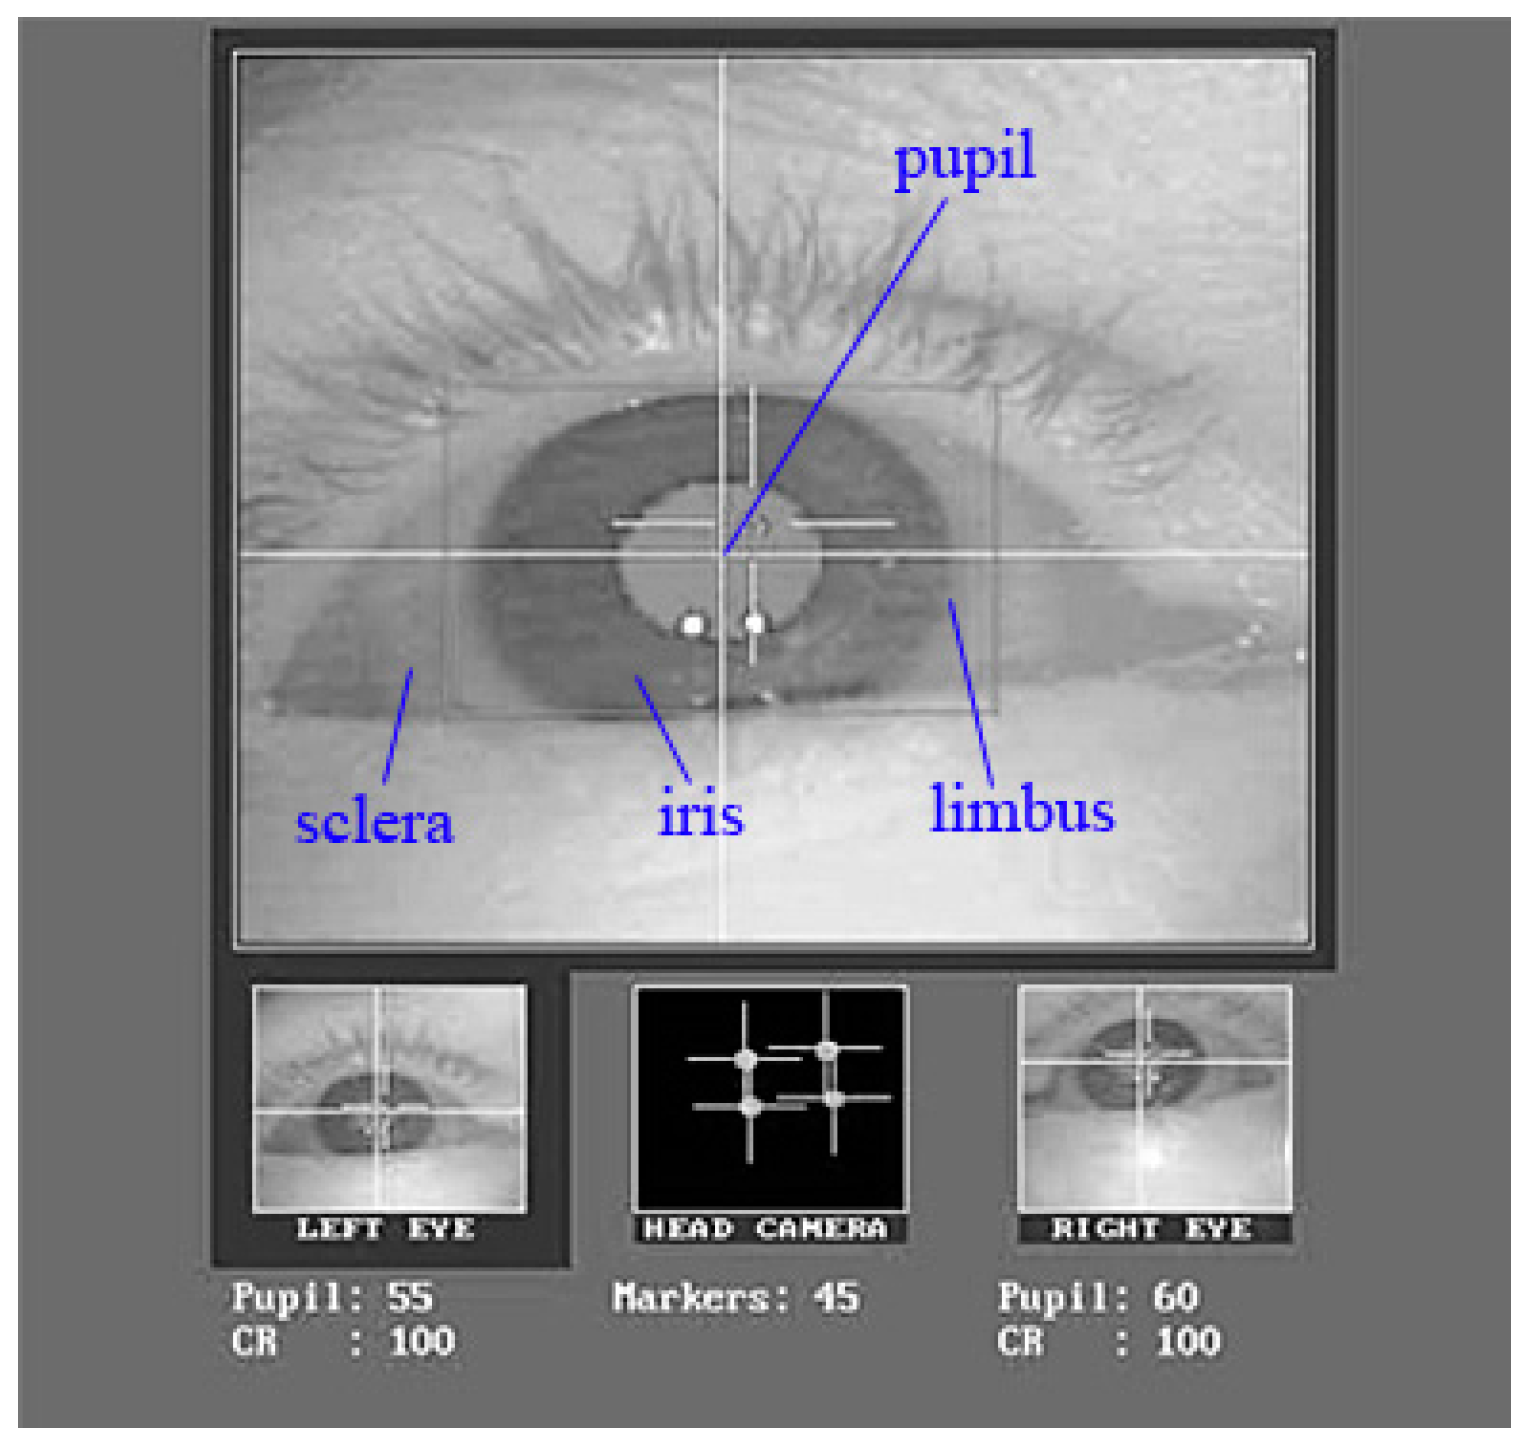
2.1. Pupil
2.2. Blink
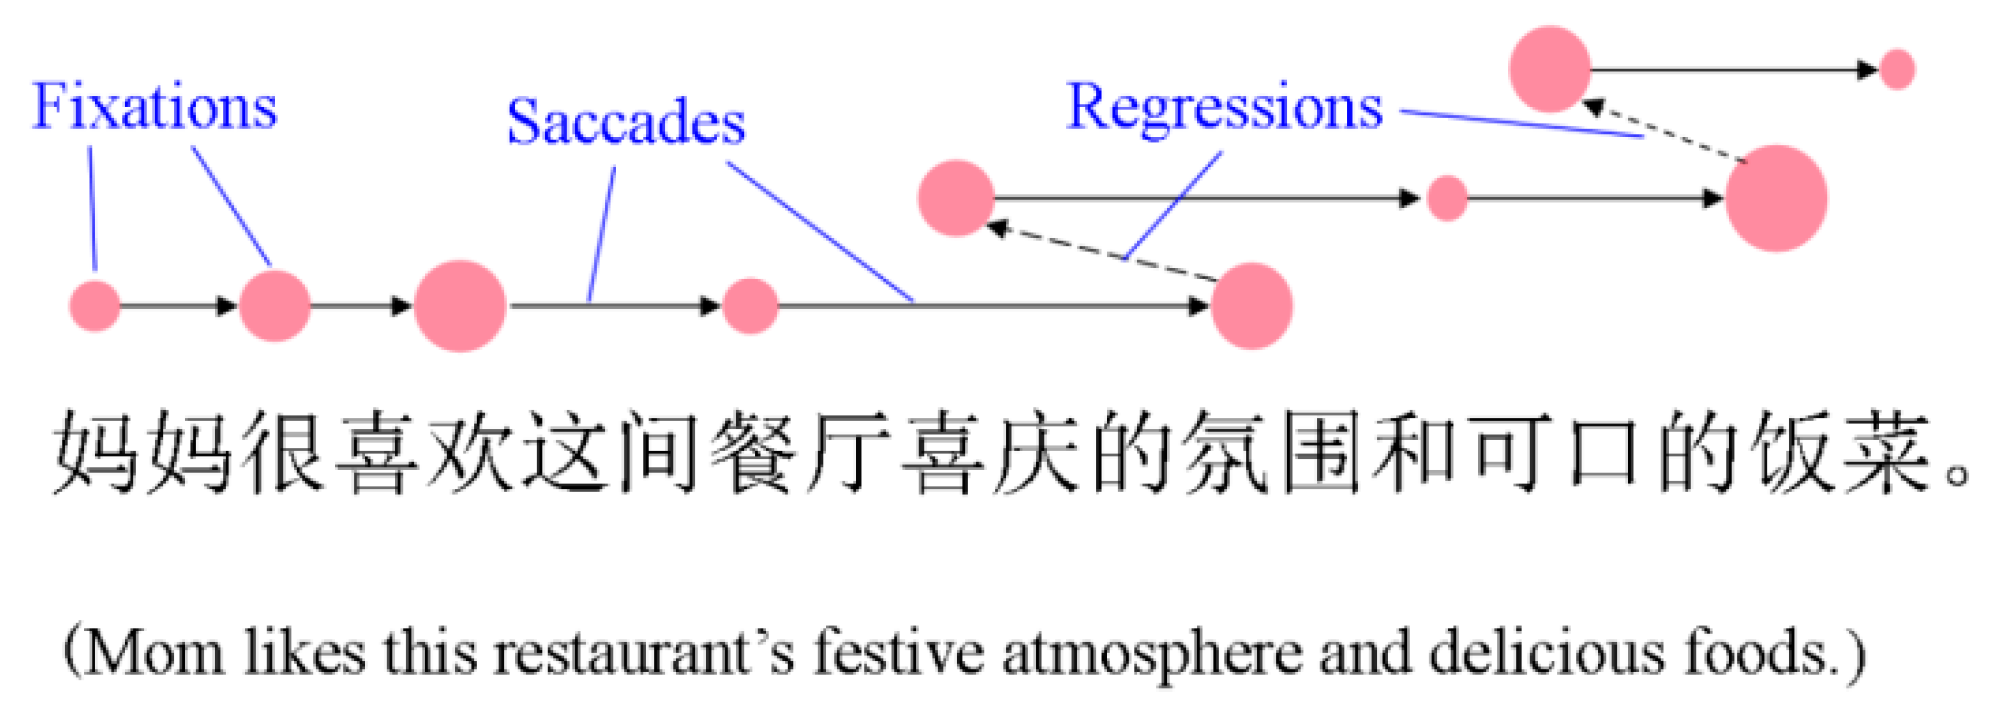
2.3. Fixation
2.4. Saccade
2.5. Regression
3. Research Design
3.1. Purpose of the Study
3.2. Participants
3.3. Research Steps
- Step 1:
- Eye-tracking indicator screening: According to relevant theories and previous research, pupil, blink, fixation, saccade, and regression data were chosen as the major sets of eye-tracking indicators for building the model.
- Step 2:
- Participant screening: A total of 6520 freshmen’s university entrance exam scores were collected, and we chose 300 students as target participants according to their Chinese exam scores, i.e., the 150 with the highest and the 150 with the lowest scores.
- Step 3:
- Reading ability assessment and IQ test: Through reading ability assessment, we identified the 36 participants with the highest reading scores and the 38 students with the lowest reading scores. Using IQ tests, we made sure that all participants had a similar IQ level.
- Step 4:
- Eye-tracking experiment: An eye-tracking experiment was conducted to collect eye movement data from learners with good or poor reading abilities, and then identified these sensitive eye-tracking indicators to assess learners’ reading abilities. This step of the experiment would be described in detail in Section 4.
- Step 5:
- Computational modeling: We built up the computational model with sensitive eye-tracking indicators by using the multi-feature regularization learning mechanism based on Low-rank Constraint. Experimental data was split strategically. Half of the samples were used for model building and the other half for testing the generalization ability of the model. This step of model construction would be described in detail in Section 5.
4. Eye-Tracking Experiments
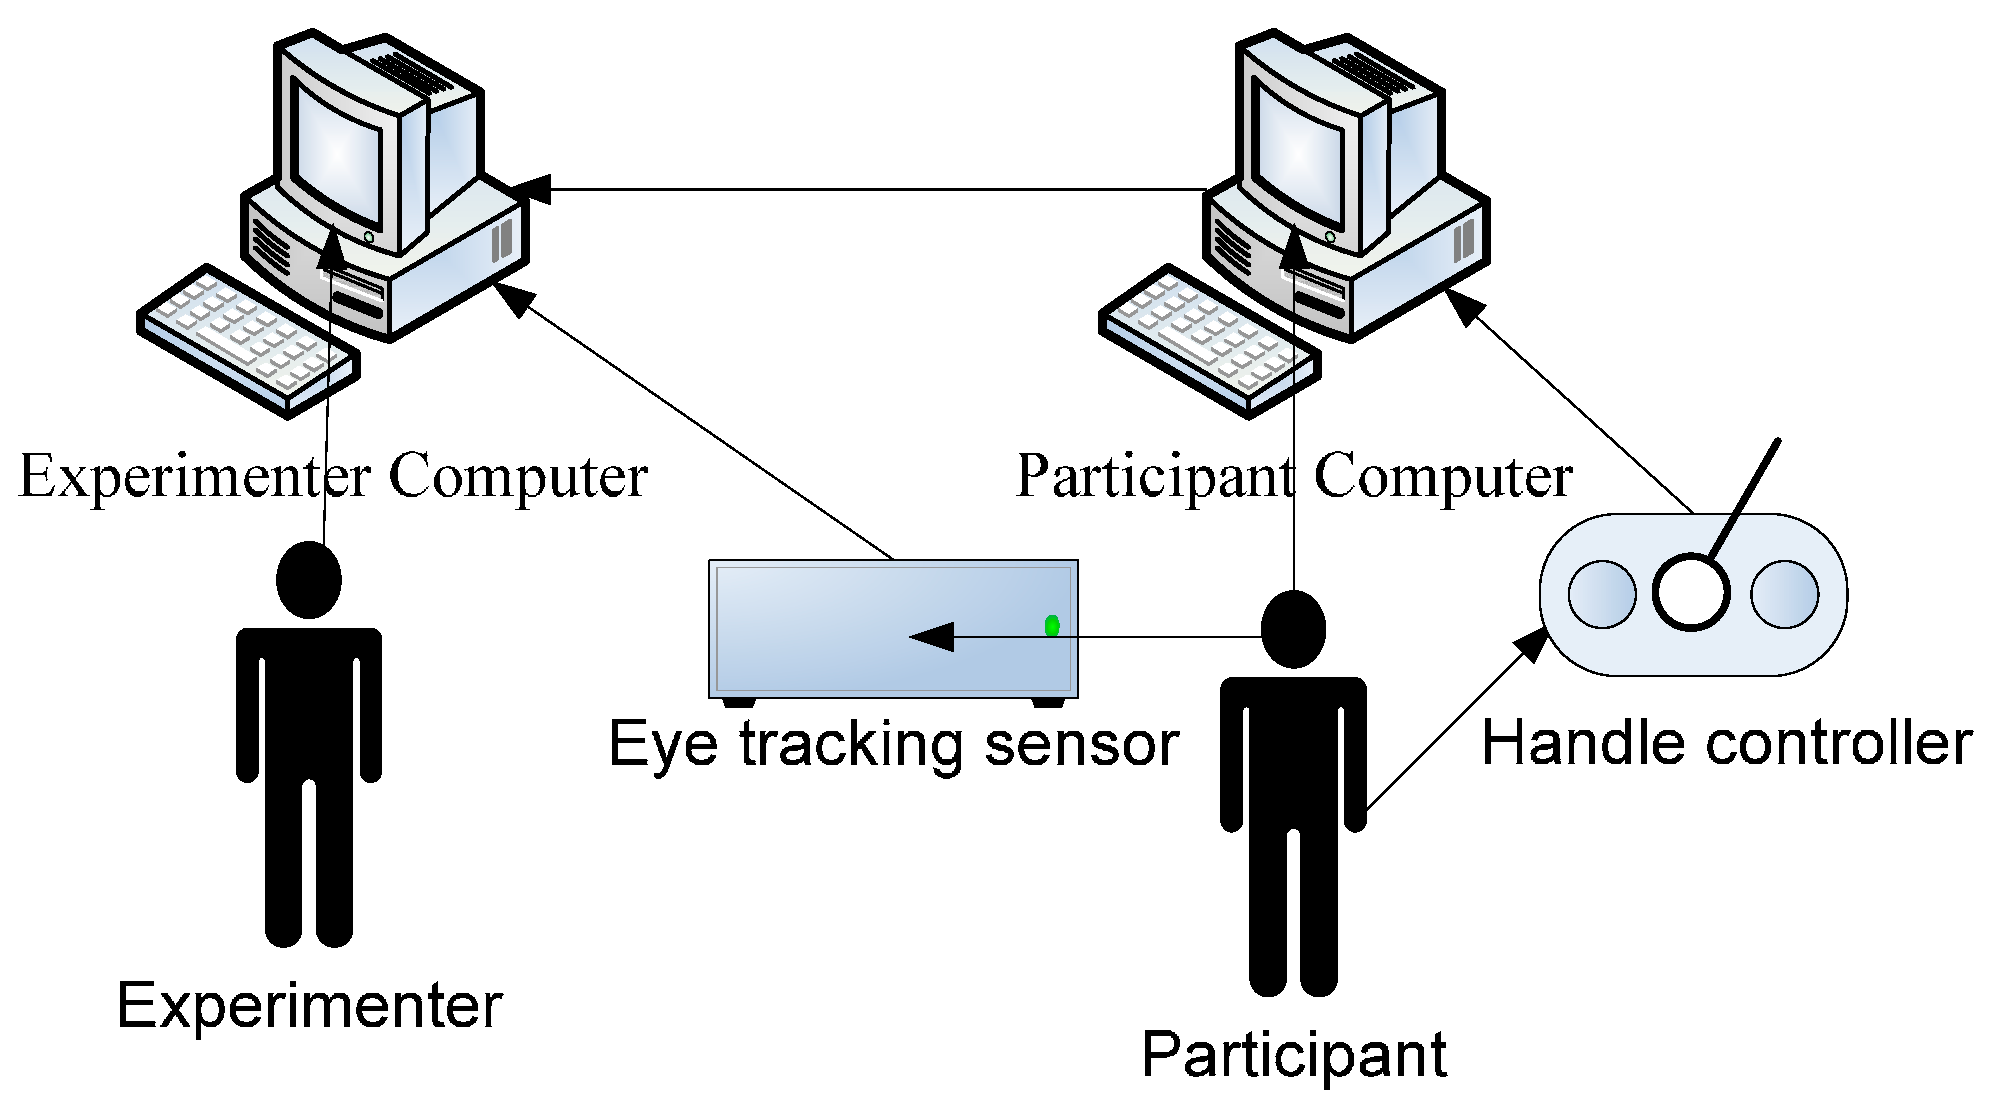
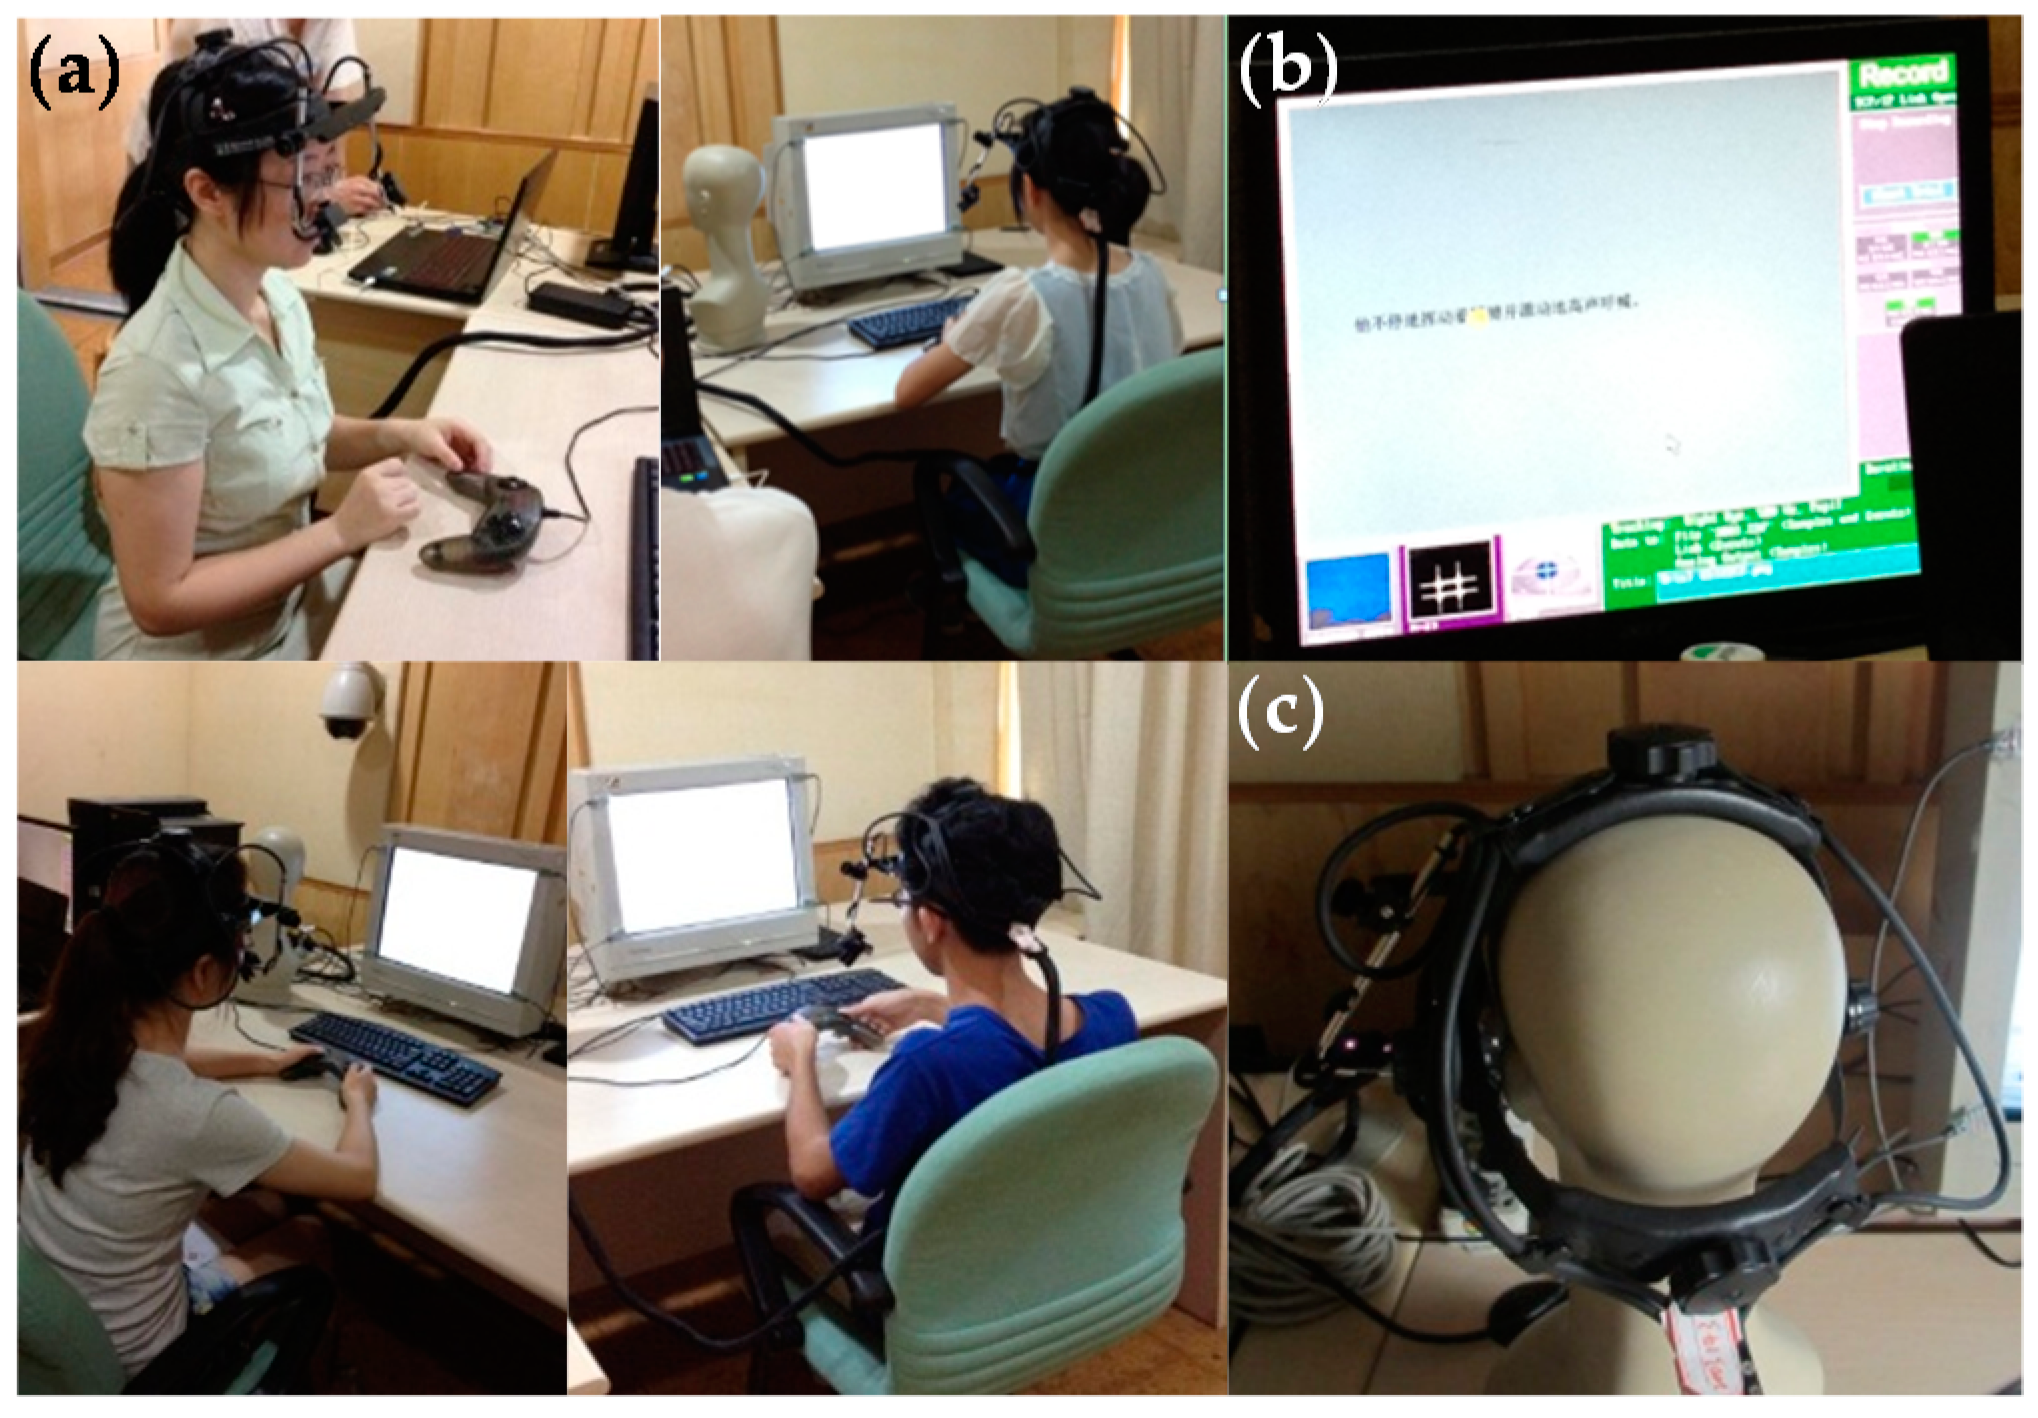
4.1. Experiment Setup
4.2. Experiment Procedures
5. Computational Model and Algorithm
5.1. Model Formulation
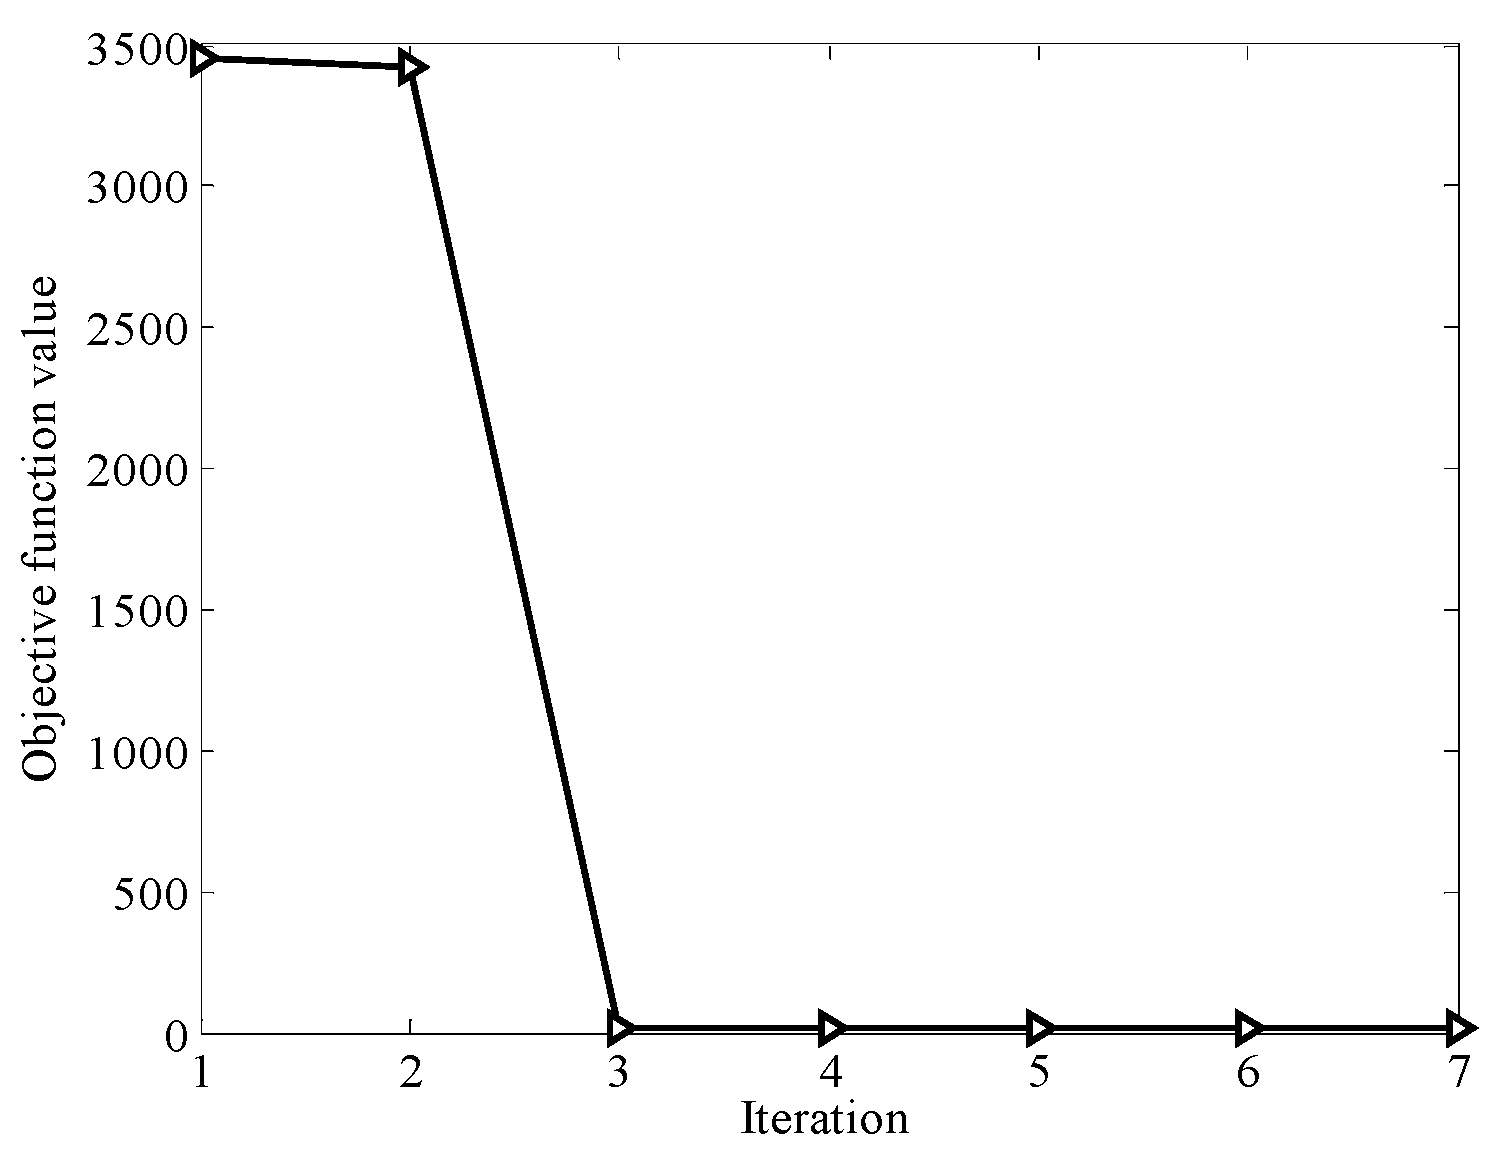
5.2. Optimization Algorithm
| Algorithm 1. MTJL for reading ability prediction |
| Input: |
| Output: w1, w2, …, wm, b. |
| Procedure: |
| Step 1. Initialize wi and bi, I = 1, …, m. |
| Step 2. For iteration t, update , and using (7), (8) and (9), respectively. |
| Step 3. Compute the objective function value J(t) using (3). |
| Step 4. Check convergence. If terminate; else go to step 2, where is a very small positive value. |
5.3. Model Features
6. Results
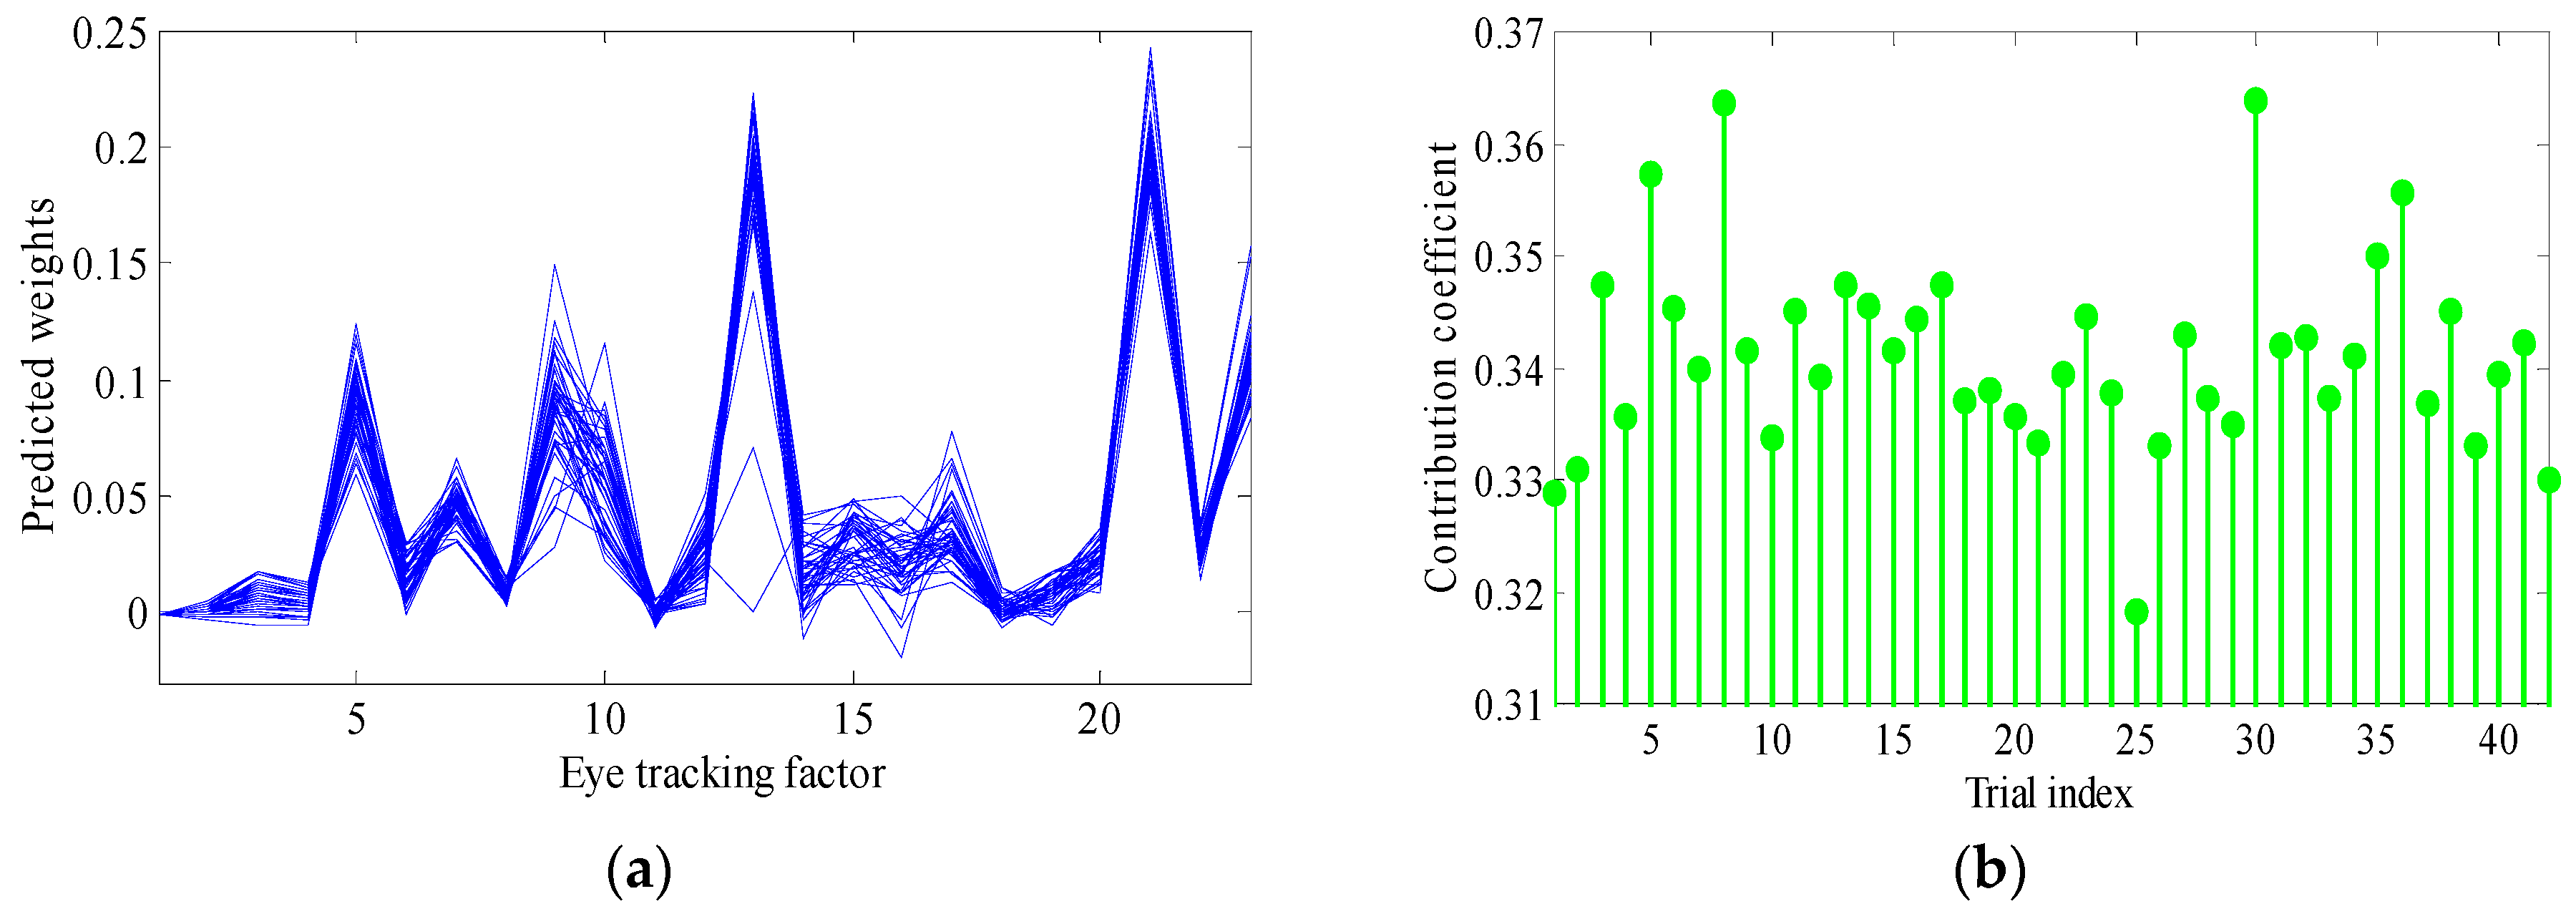
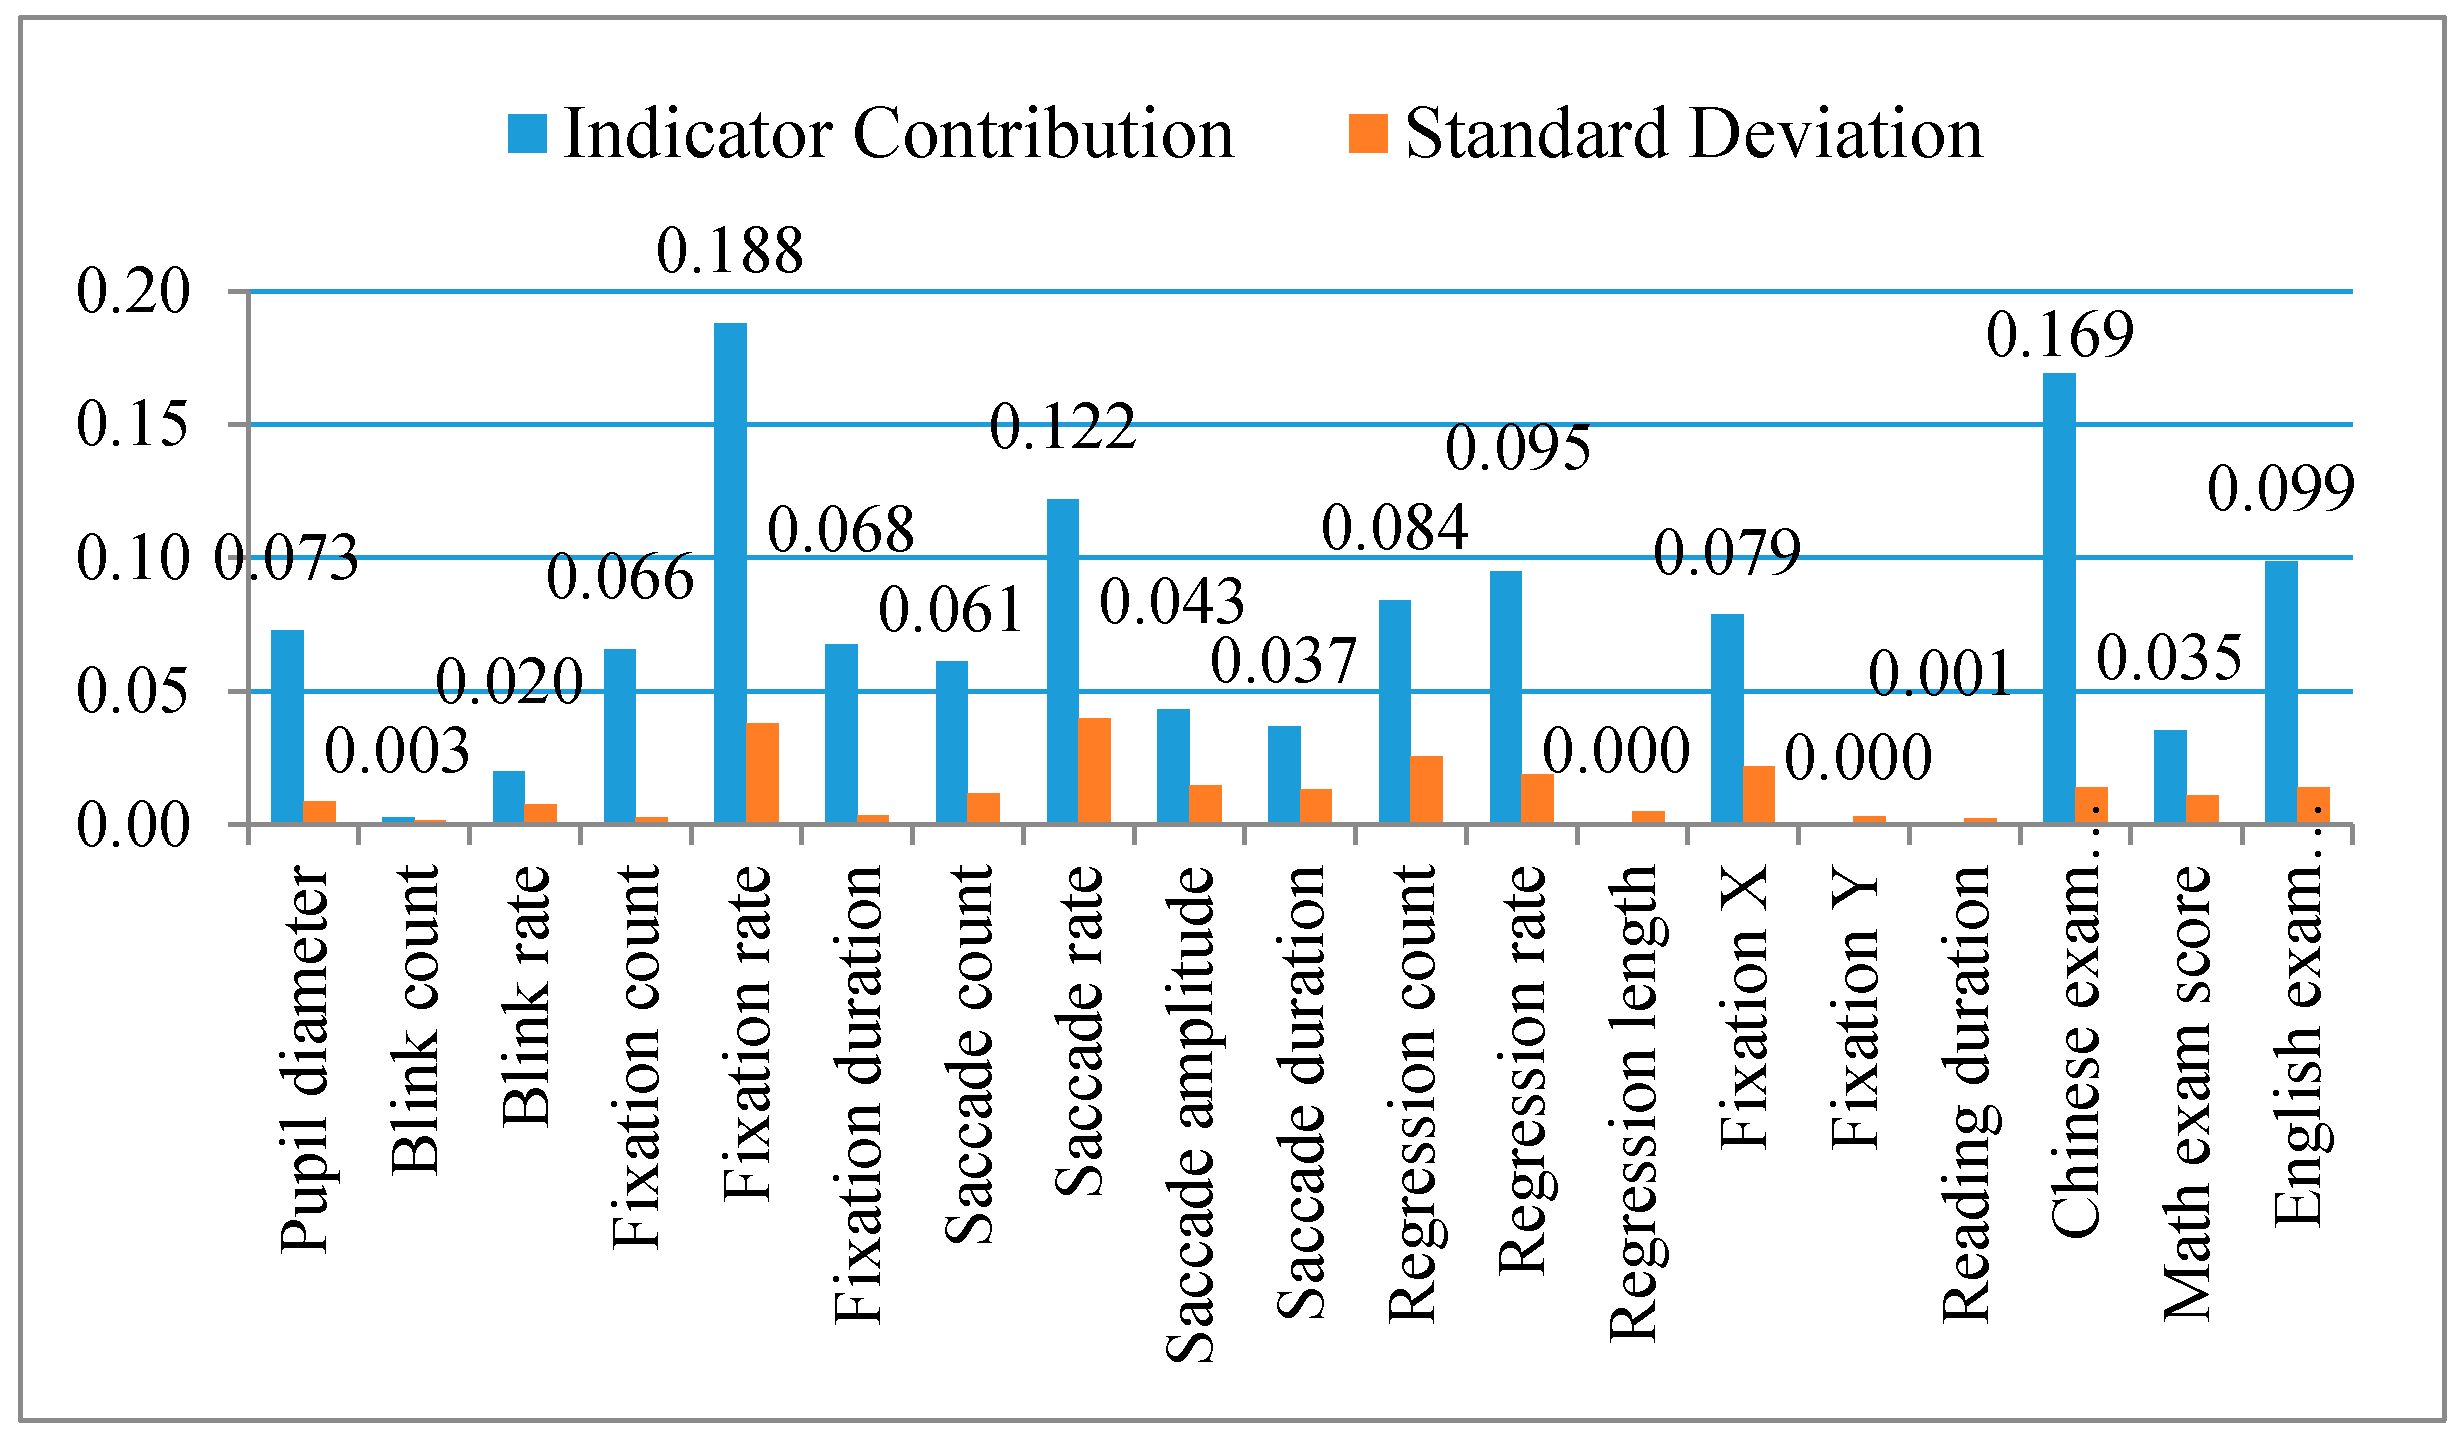
6.1. Sensitive Indicators
6.2. Indicator Weights
6.3. Model Fit and Consistency
7. Discussion
7.1. Model Comparison
7.2. Model Advantages
7.3. Implications and Future Research
Acknowledgments
Author Contributions
Conflicts of Interest
References
- Grubb, M. Predictors of High School Student Success in Online Courses. Ph.D. Thesis, University of Houston, Houston, TX, USA, 2011. [Google Scholar]
- Rayner, K. Eye movements and attention in reading, scene perception, and visual search. Q. J. Exp. Psychol. 2009, 62, 1457–1506. [Google Scholar] [CrossRef] [PubMed]
- Chang, W.; Cha, H.; Im, C. Removing the Interdependency between Horizontal and Vertical Eye-Movement Components in Electrooculograms. Sensors 2016, 16, 227. [Google Scholar] [CrossRef] [PubMed]
- Frutos-Pascual, M.; Garcia-Zapirain, B. Assessing Visual Attention Using Eye Tracking Sensors in Intelligent Cognitive Therapies Based on Serious Games. Sensors 2015, 15, 11092–11117. [Google Scholar] [CrossRef] [PubMed]
- Hyönä, J. The use of eye movements in the study of multimedia learning. Learn. Instr. 2010, 20, 172–176. [Google Scholar] [CrossRef]
- Zhan, Z.H. An emotional and cognitive recognition model for distance learners based on intelligent agent-the coupling of eye tracking and expression recognition techniques. Mod. Dist. Educ. Res. 2013, 5, 100–105. [Google Scholar]
- Zhan, Z.H.; Liang, T.; Ma, Z.C. Distance learning supporting services based on virtual assistant and its technical difficulties. Mod. Dist. Educ. Res. 2014, 6, 95–103. [Google Scholar]
- Cassin, B.; Solomon, S. Dictionary of Eye Terminology; Triad Publishing Company: Gainesville, FL, USA, 1990. [Google Scholar]
- Heo, H.; Lee, W.; Shin, K.; Park, K. Quantitative Measurement of Eyestrain on 3D Stereoscopic Display Considering the Eye Foveation Model and Edge Information. Sensors 2014, 14, 8577–8604. [Google Scholar] [CrossRef] [PubMed]
- Bang, J.; Heo, H.; Choi, J.; Park, K. Assessment of Eye Fatigue Caused by 3D Displays Based on Multimodal Measurements. Sensors 2014, 14, 16467–16485. [Google Scholar] [CrossRef] [PubMed]
- Van Gerven, P.W.M.; Paas, F.G.W.C.; Van Merriënboer, J.J.G.; Schmidt, H.G. Cognitive load theory and aging: Effects of worked examples on training efficiency. Learn. Instr. 2002, 12, 87–105. [Google Scholar] [CrossRef]
- Montés-Micó, R.; Alió, J.L.; Charman, W.N. Dynamic changes in the tear film in dry eyes. Invest. Ophthalmol. Vis. Sci. 2005, 46, 1615–1619. [Google Scholar] [CrossRef] [PubMed]
- Wolkoff, P.; Nøjgaard, J.K.; Troiano, P.; Piccoli, B. Eye complaints in the office environment: Precorneal tear film integrity influenced by eye blinking efficiency. Occup. Environ. Med. 2005, 62, 4–12. [Google Scholar] [CrossRef] [PubMed]
- Tsai, Y.F.; Viirre, E.; Strychacz, C.; Chase, B.; Jung, T.P. Task performance and eye activity: Predicting behavior relating to cognitive workload. Aviat. Space Environ. Med. 2007, 78, B176–B185. [Google Scholar] [PubMed]
- Holmqvist, K.; Nyström, M.; Andersson, R.; Dewhurst, R.; Jarodzka, H.; Van de Weijer, J. Eye Tracking: A Comprehensive Guide to Methods and Measures; Oxford University Press: Oxford, UK, 2011. [Google Scholar]
- Jacob, R.J.K.; Karn, K.S. Commentary on Section 4—Eye Tracking in Human-Computer Interaction and Usability Research: Ready to Deliver the Promises. In The Mind’s Eye: Cognitive and Applied Aspects of Eye Movement Research; Hyona, J., Radach, R., Deubel, H., Eds.; Elsevier: Amsterdam, The Netherlands, 2003; pp. 573–605. [Google Scholar]
- Steichen, B.; Carenini, G.; Conati, C. User-adaptive information visualization: Using eye gaze data to infer visualization tasks and user cognitive abilities. In Proceedings of the 2013 International Conference on Intelligent User Interfaces, Santa Monica, CA, USA, 19–22 March 2013.
- Nakayama, M.; Takahashi, K.; Shimizu, Y. The act of task difficulty and eye-movement frequency for the oculo-motor indices. In Proceedings of the 2002 Symposium on Eye-Tracking Research & Applications, New Orleans, LA, USA, 25–27 March 2002.
- Benedetto, S.; Carbone, A.; Drai-Zerbib, V.; Pedrotti, M.; Baccino, T. Effects of luminance and illuminance on visual fatigue and arousal during digital reading. Comput. Hum. Behav. 2014, 41, 112–119. [Google Scholar] [CrossRef]
- Van Orden, K.F.; Jung, T.P.; Makeig, S. Combined eye activity measures accurately estimate changes in sustained visual task performance. Biol. Psychol. 2000, 52, 221–240. [Google Scholar] [CrossRef]
- Volkmann, F.C. Human visual suppression. Vis. Res. 1986, 26, 1401–1416. [Google Scholar] [CrossRef]
- Rayner, K. Eye movements in reading and information processing: 20 years of research. Psychol. Bull. 1998, 124, 373–422. [Google Scholar] [CrossRef]
- Underwood, G.; Foulsham, T.; Humphrey, K. Saliency and scan patterns in the inspection of real-world scenes: Eye movements during encoding and recognition. Vis. Cognit. 2009, 17, 812–834. [Google Scholar] [CrossRef]
- Beymer, D.; Russell, D.M.; Orton, P.Z. Wide vs. Narrow Paragraphs: An Eye Tracking Analysis. In Human-Computer Interaction-Interact; Springer: Berlin, Germany, 2005; pp. 741–752. [Google Scholar]
- Zhang, L.; Ren, J.; Xu, L.; Qiu, X.J.; Jonas, J.B. Visual comfort and fatigue when watching three-dimensional displays as measured by eye movement analysis. Br. J. Opht. 2013, 97, 941–942. [Google Scholar] [CrossRef] [PubMed]
- Kang, M.J.; Hsu, M.; Krajbich, I.M.; Loewenstein, G.; McClure, S.M.; Wang, J.T.Y.; Camerer, C.F. The wick in the candle of learning epistemic curiosity activates reward circuitry and enhances memory. Psychol. Sci. 2009, 20, 963–973. [Google Scholar] [CrossRef] [PubMed]
- Zekveld, A.A.; Heslenfeld, D.J.; Johnsrude, I.S.; Versfeld, N.J.; Kramer, S.E. The eye as a window to the listening brain: Neural correlates of pupil size as a measure of cognitive listening load. NeuroImage 2014, 101, 76–86. [Google Scholar] [CrossRef] [PubMed]
- Yan, G.; Tian, H.; Bai, X.; Rayner, K. The effect of word and character frequency on the eye movements of Chinese readers. Br. J. Psychol. 2006, 97, 259–268. [Google Scholar] [CrossRef] [PubMed]
- Ehmke, C.; Wilson, C. Identifying web usability problems from eye tracking data. In Proceedings of the 21st British HCI Group Annual Conference on People and Computers, Lancaster, UK, 3–7 September 2007.
- Reingold, E.M.; Charness, N.; Pomplun, M.; Stampe, D.M. Visual span in expert chess players: Evidence from eye movements. Psychol. Sci. 2001, 12, 48–55. [Google Scholar] [CrossRef] [PubMed]
- Tatler, B.W.; Gilchrist, I.D.; Land, M.F. Visual memory for objects in natural scenes: From fixations to object files. Q. J. Exp. Psychol. Sect. A 2005, 58, 931–960. [Google Scholar] [CrossRef] [PubMed]
- Reingold, E.M.; Charness, N. Perception in chess: Evidence from eye movements. In Cognitive Processes in Eye Guidance; Underwood, G., Ed.; Oxford University Press: Oxford, UK, 2005. [Google Scholar]
- Savelsbergh, G.J.; Williams, A.M.; Kamp, J.V.D.; Ward, P. Visual search, anticipation and expertise in soccer goalkeepers. J. Sports Sci. 2002, 20, 279–287. [Google Scholar] [CrossRef] [PubMed]
- Van Orden, K.F.; Limbert, W.; Makeig, S.; Jung, T.P. Eye activity correlates of workload during a visuo spatial memory task. Hum. Factors 2001, 43, 111–121. [Google Scholar] [CrossRef] [PubMed]
- Vuori, T.; Olkkonen, M.; Pölönen, M.; Siren, A.; Häkkinen, J. Can eye movements be quantitatively applied to image quality studies? In Proceedings of the Third Nordic Conference on Human-computer Interaction, Tampere, Finland, 23–27 October 2004.
- Tatler, B.W.; Baddeley, R.J.; Vincent, B.T. The long and the short of it: Spatial statistics at fixation vary with saccade amplitude and task. Vis. Res. 2006, 46, 1857–1862. [Google Scholar] [CrossRef] [PubMed]
- Kuperman, V.; Van Dyke, J.A. Effects of individual differences in verbal skills on eye-movement patterns during sentence reading. J. Mem. Lang. 2011, 65, 42–73. [Google Scholar] [CrossRef] [PubMed]
- Rayner, K.; Ardoin, S.P.; Binder, K.S. Children’s eye movements in reading: A commentary. Sch. Psychol. Rev. 2013, 42, 223–233. [Google Scholar]
- Kasarskis, P.; Stehwien, J.; Hickox, J.; Aretz, A.; Wickens, C. Comparison of expert and novice scan behaviors during VFR flight. In Proceedings of the 11th International Symposium on Aviation Psychology, Columbus, OH, USA, 5–8 March 2001.
- Tamboer, P.; Vorst, H.C.; Oort, F.J. Identifying dyslexia in adults: An iterative method using the predictive value of item scores and self-report questions. Ann. Dyslexia 2014, 64, 34–56. [Google Scholar] [CrossRef] [PubMed]
- Tops, W.; Callens, M.; Lammertyn, J.; Van Hees, V.; Brysbaert, M. Identifying students with dyslexia in higher education. Ann. Dyslexia 2012, 62, 186–203. [Google Scholar] [CrossRef] [PubMed]
- Wen, H. Primary School students’ Chinese Reading Ability Scales: Development, Validity, and Reliability. Master’s Thesis, South China Normal University, Guangzhou, China, June 2005. [Google Scholar]
- Chan, D.W.; Ho, C.S.; Tsang, S.M.; Lee, S.H.; Chung, K.K. Screening for Chinese children with dyslexia in Hong Kong: The use of the teachers’ behaviour checklist. Educ. Psychol. 2004, 24, 811–824. [Google Scholar] [CrossRef]
- Tian, X. Research of Primary School Students’ Reading Ability. Master’s Thesis, Shan Xi University, Shanxi, China, June 2003. [Google Scholar]
- Lopez-Basterretxea, A.; Mendez-Zorrilla, A.; Garcia-Zapirain, B. Eye/Head Tracking Technology to Improve HCI with iPad Applications. Sensors 2015, 15, 2244–2264. [Google Scholar] [CrossRef] [PubMed]
- Paravati, G.; Gatteschi, V. Human-Computer Interaction in Smart Environments. Sensors 2015, 15, 19487–19494. [Google Scholar] [CrossRef]
- Li, Z.; Mao, X. Emotional eye movement generation based on Geneva Emotion Wheel for virtual agents. J. Vis. Lang. Comput. 2012, 23, 299–310. [Google Scholar] [CrossRef]
- D’Mello, S.; Olney, A.; Williams, C.; Hays, P. Gaze tutor: A gaze-reactive intelligent tutoring system. Int. J. Hum. Comput. Stud. 2012, 70, 377–398. [Google Scholar] [CrossRef]


| Indicator Families | Indicators | Scales | F | Sig. |
|---|---|---|---|---|
| Pupil | Pupil diameter | Pixels | 2544.09 | 0 |
| Blink | Blink count | Number of counts | 156.92 | 0 |
| Blink rate | Number of blinks per second | 133.89 | 0 | |
| Fixation | Fixation count | Number of fixations | 15.64 | 0 |
| Fixation rate | Number of fixations per second | 560.07 | 0 | |
| Fixation duration | Milliseconds (ms) | 18.12 | 0 | |
| Fixation position X | Pixels | 14.74 | 0 | |
| Fixation position Y | Pixels | 0.15 | 0.83 | |
| Saccade | Saccade count | Number of times | 50.76 | 0 |
| Saccade rate | Number of saccades per second | 4.28 | 0.04 | |
| Saccade duration | Milliseconds (ms) | 127.73 | 0 | |
| Saccade amplitude | Degrees of visual angle | 34.44 | 0 | |
| Regression | Regression count | Number of regressions | 742.83 | 0 |
| Regression rate | Number of regressions per second | 905.39 | 0 | |
| Regression length | Pixels | 1.71 | 0.19 |
| Reference | Assessment Purpose | Participants | Assessment Approach | Assessment Accuracy |
|---|---|---|---|---|
| Tamboer et al. [40] | Discriminate dyslexia | First-year university students | Questionnaires with 201 items and 10 reading tests with 242 items | Correct classification rate = 89.5% |
| Top et al. [41] | Discriminate dyslexia | First-year university students | Reading tests with three sets of predictors that extracted from the initial 27 indicators. | Correct classification rate = 90.9% |
| Wen [42] | Assess reading ability | Primary school students | Reading ability measurement scales | Average α coefficient = 0.81; composite absolute error = 5.76%; Generalizability coeffcient = 0.81; index of dependability = 0.80; criterion-related validity = 0.71. |
| Chan et al. [43] | Discriminate dyslexia | Primary school students | A 65-item checklist of student reading-related behavioural characteristics | Correct classification rate = 79%; kappa coefficient = 0.56 |
| Tian [44] | Assess reading ability | Primary school students | Reading test with four-perspective structure | Test reliability Cronbach’s α= 0.85; criterion-related validity = 0.883 |
| Our predictive model | Assess reading ability | First-year university students | Eye-tracking experiment for about 20 min | Average error = 4.91%; criterion-related validity = 0.78 |
© 2016 by the authors; licensee MDPI, Basel, Switzerland. This article is an open access article distributed under the terms and conditions of the Creative Commons Attribution (CC-BY) license (http://creativecommons.org/licenses/by/4.0/).
Share and Cite
Zhan, Z.; Zhang, L.; Mei, H.; Fong, P.S.W. Online Learners’ Reading Ability Detection Based on Eye-Tracking Sensors. Sensors 2016, 16, 1457. https://doi.org/10.3390/s16091457
Zhan Z, Zhang L, Mei H, Fong PSW. Online Learners’ Reading Ability Detection Based on Eye-Tracking Sensors. Sensors. 2016; 16(9):1457. https://doi.org/10.3390/s16091457
Chicago/Turabian StyleZhan, Zehui, Lei Zhang, Hu Mei, and Patrick S. W. Fong. 2016. "Online Learners’ Reading Ability Detection Based on Eye-Tracking Sensors" Sensors 16, no. 9: 1457. https://doi.org/10.3390/s16091457
APA StyleZhan, Z., Zhang, L., Mei, H., & Fong, P. S. W. (2016). Online Learners’ Reading Ability Detection Based on Eye-Tracking Sensors. Sensors, 16(9), 1457. https://doi.org/10.3390/s16091457