
Analysis and Compensation for Lateral Chromatic Aberration in a Color Coding Structured Light 3D Measurement System


Abstract
:1. Introduction
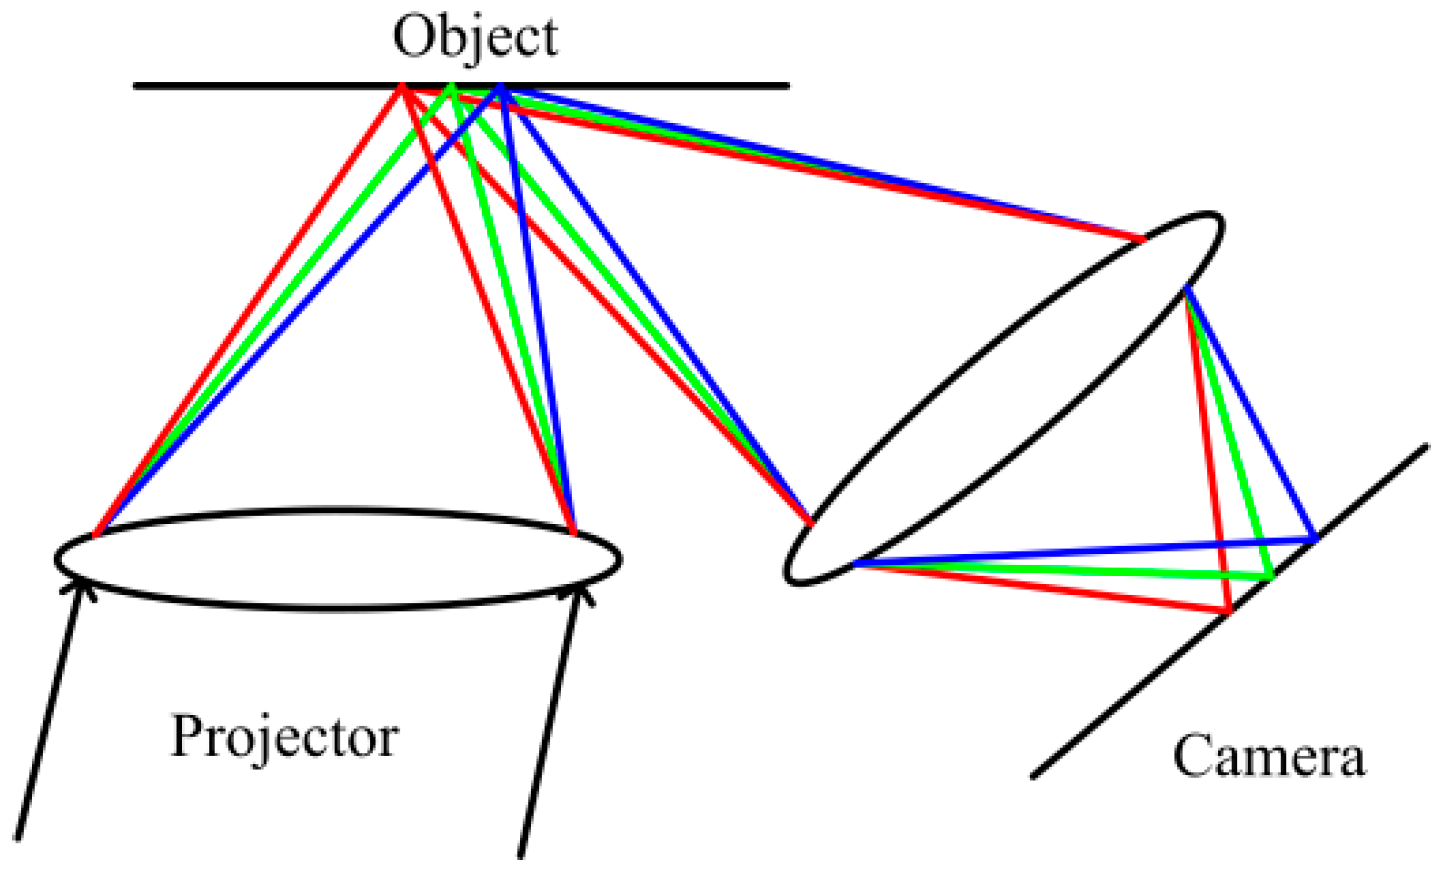
2. Lateral Chromatic Aberration of a Structured Light System
3. Principle and Analysis of the LCA Compensation Method
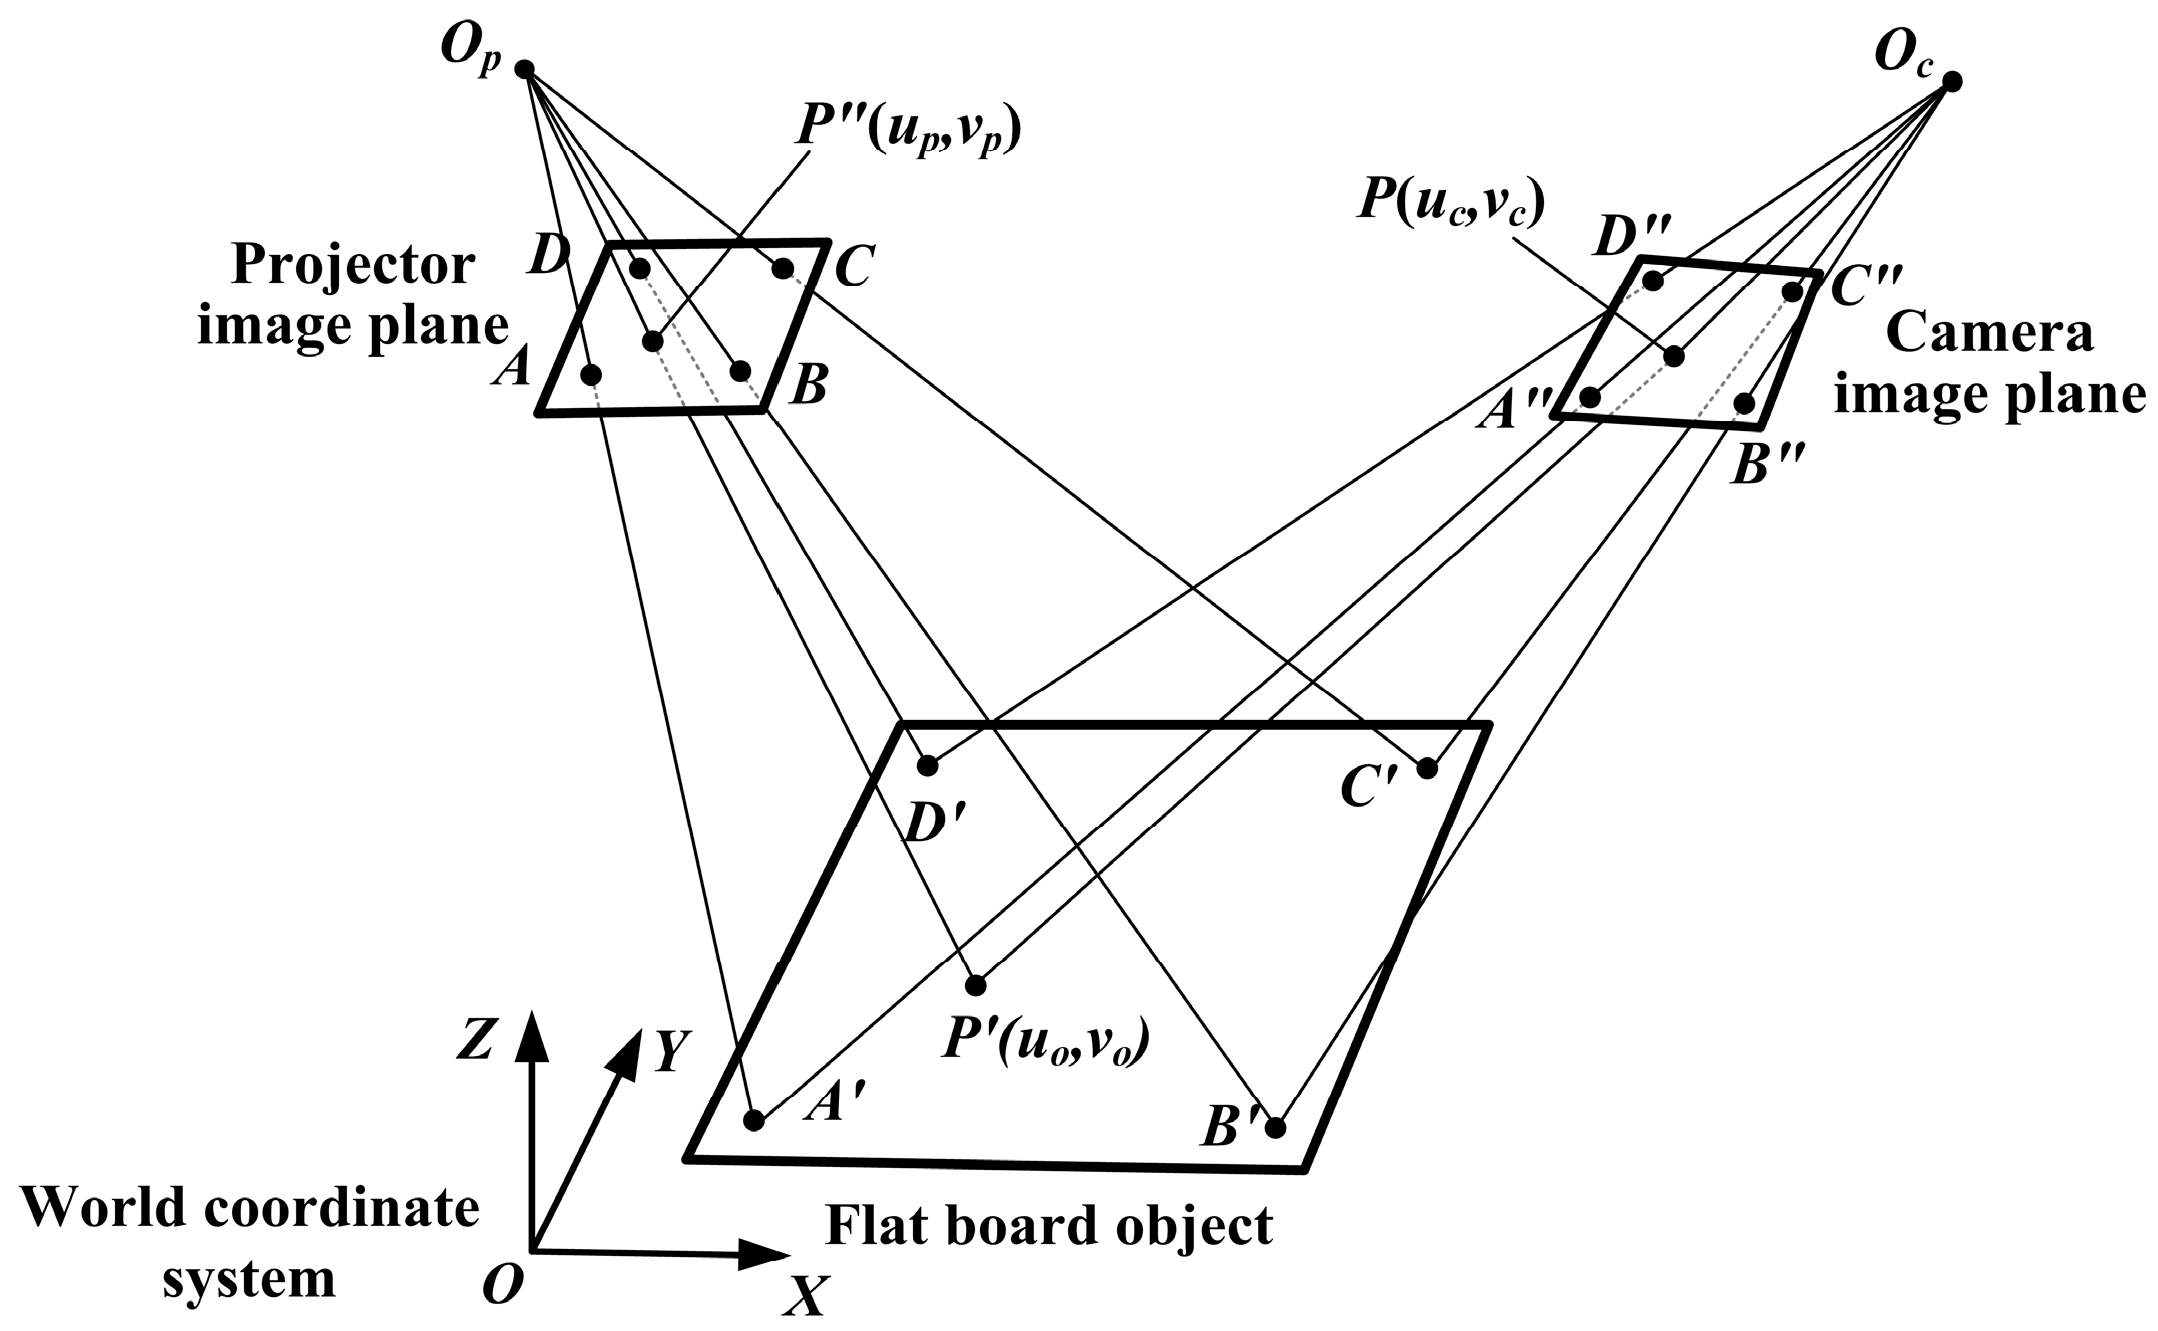
3.1. Coordinate Mapping of Projection Patterns
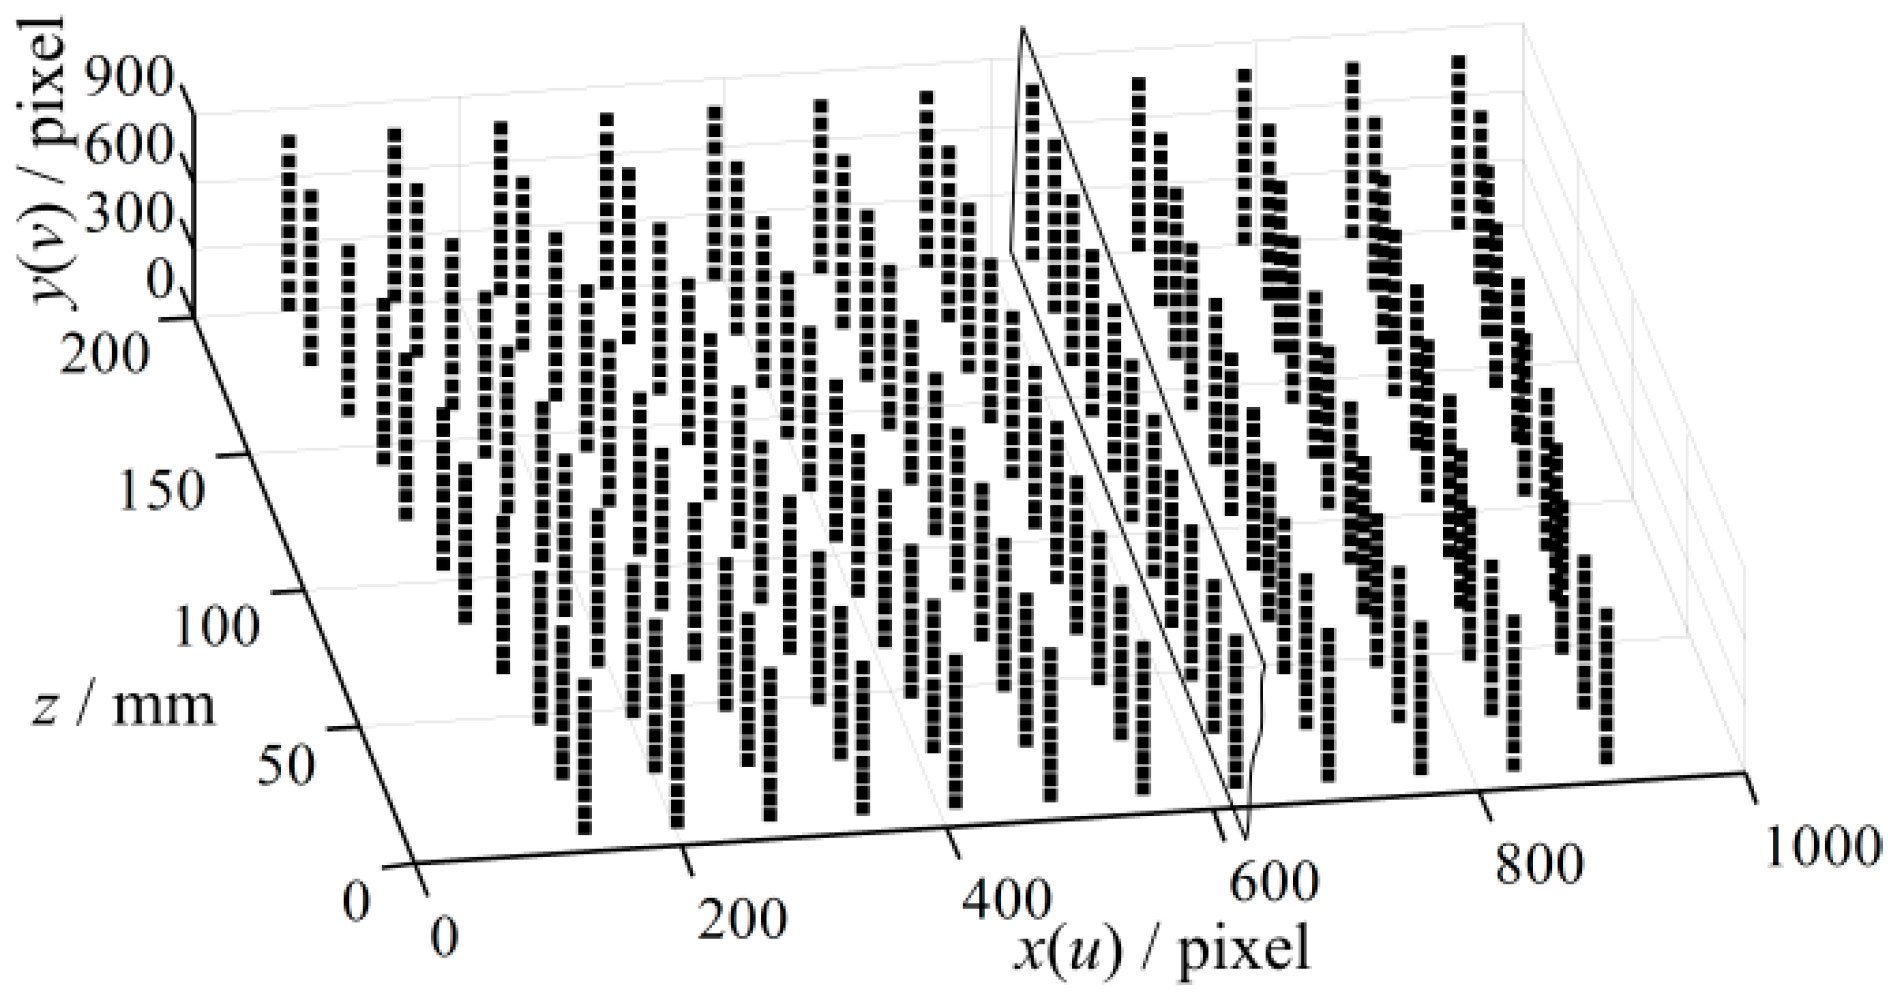
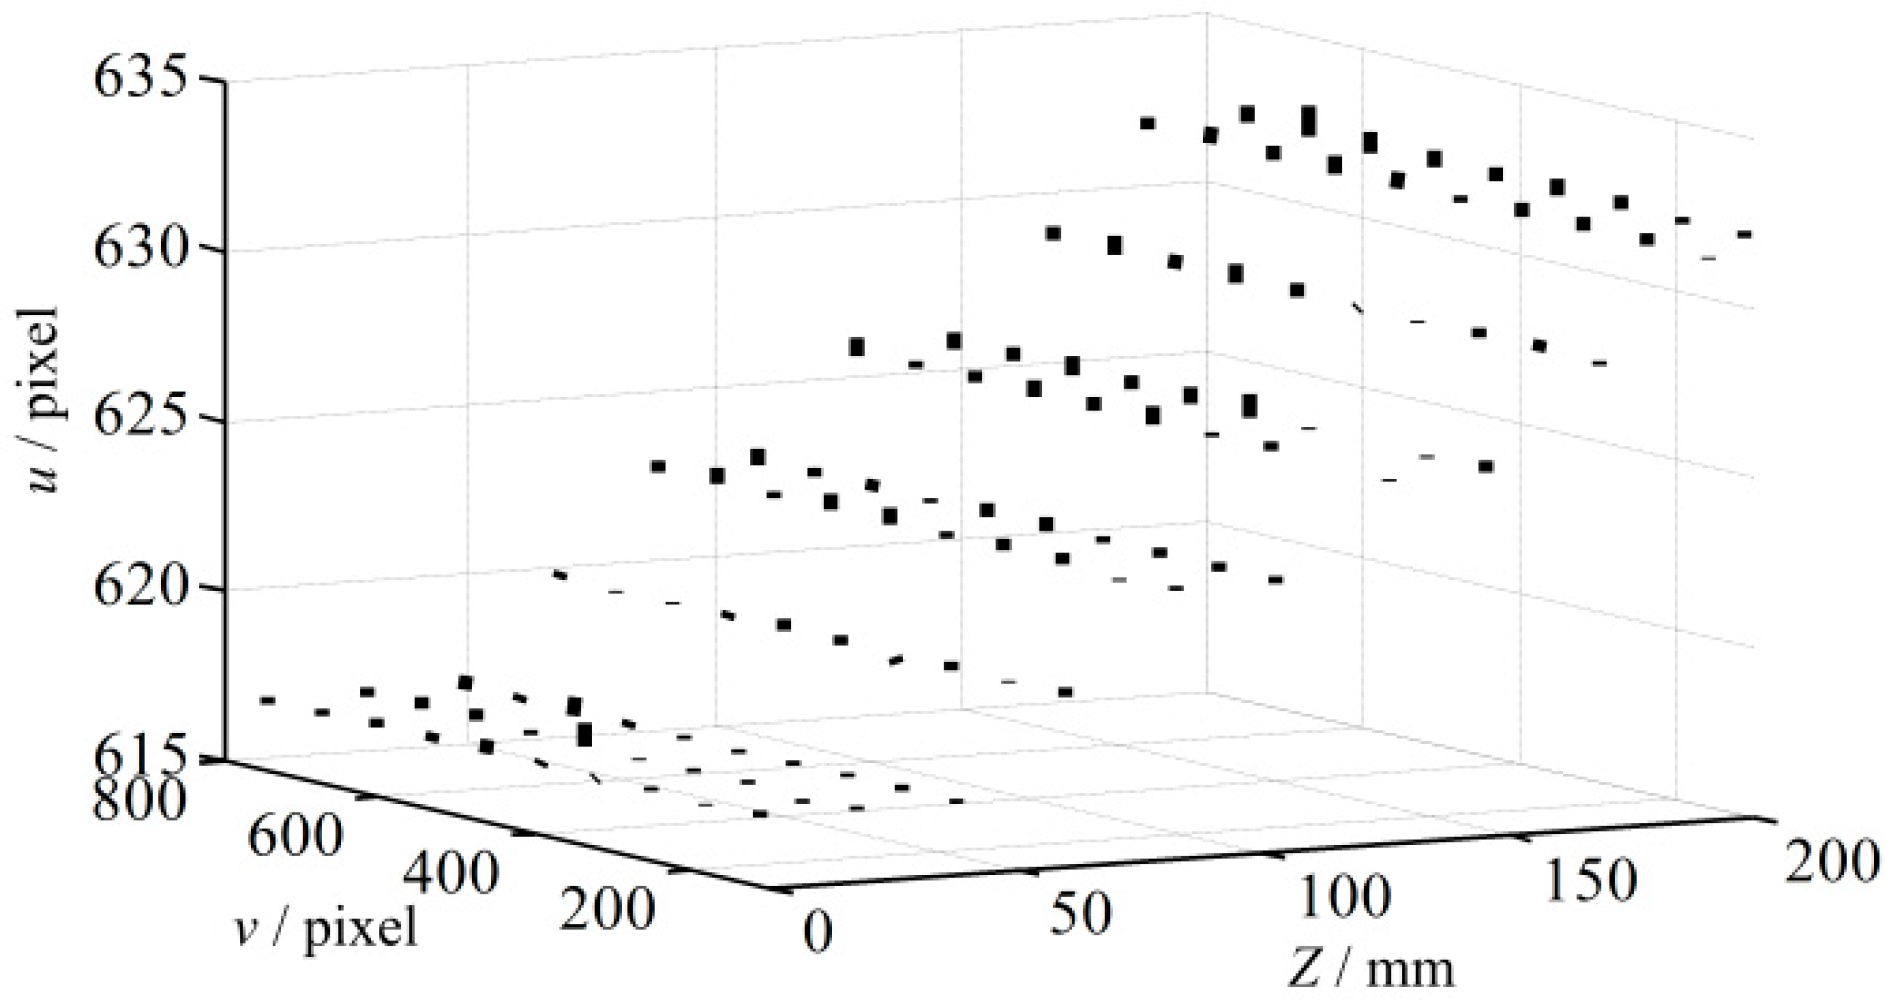
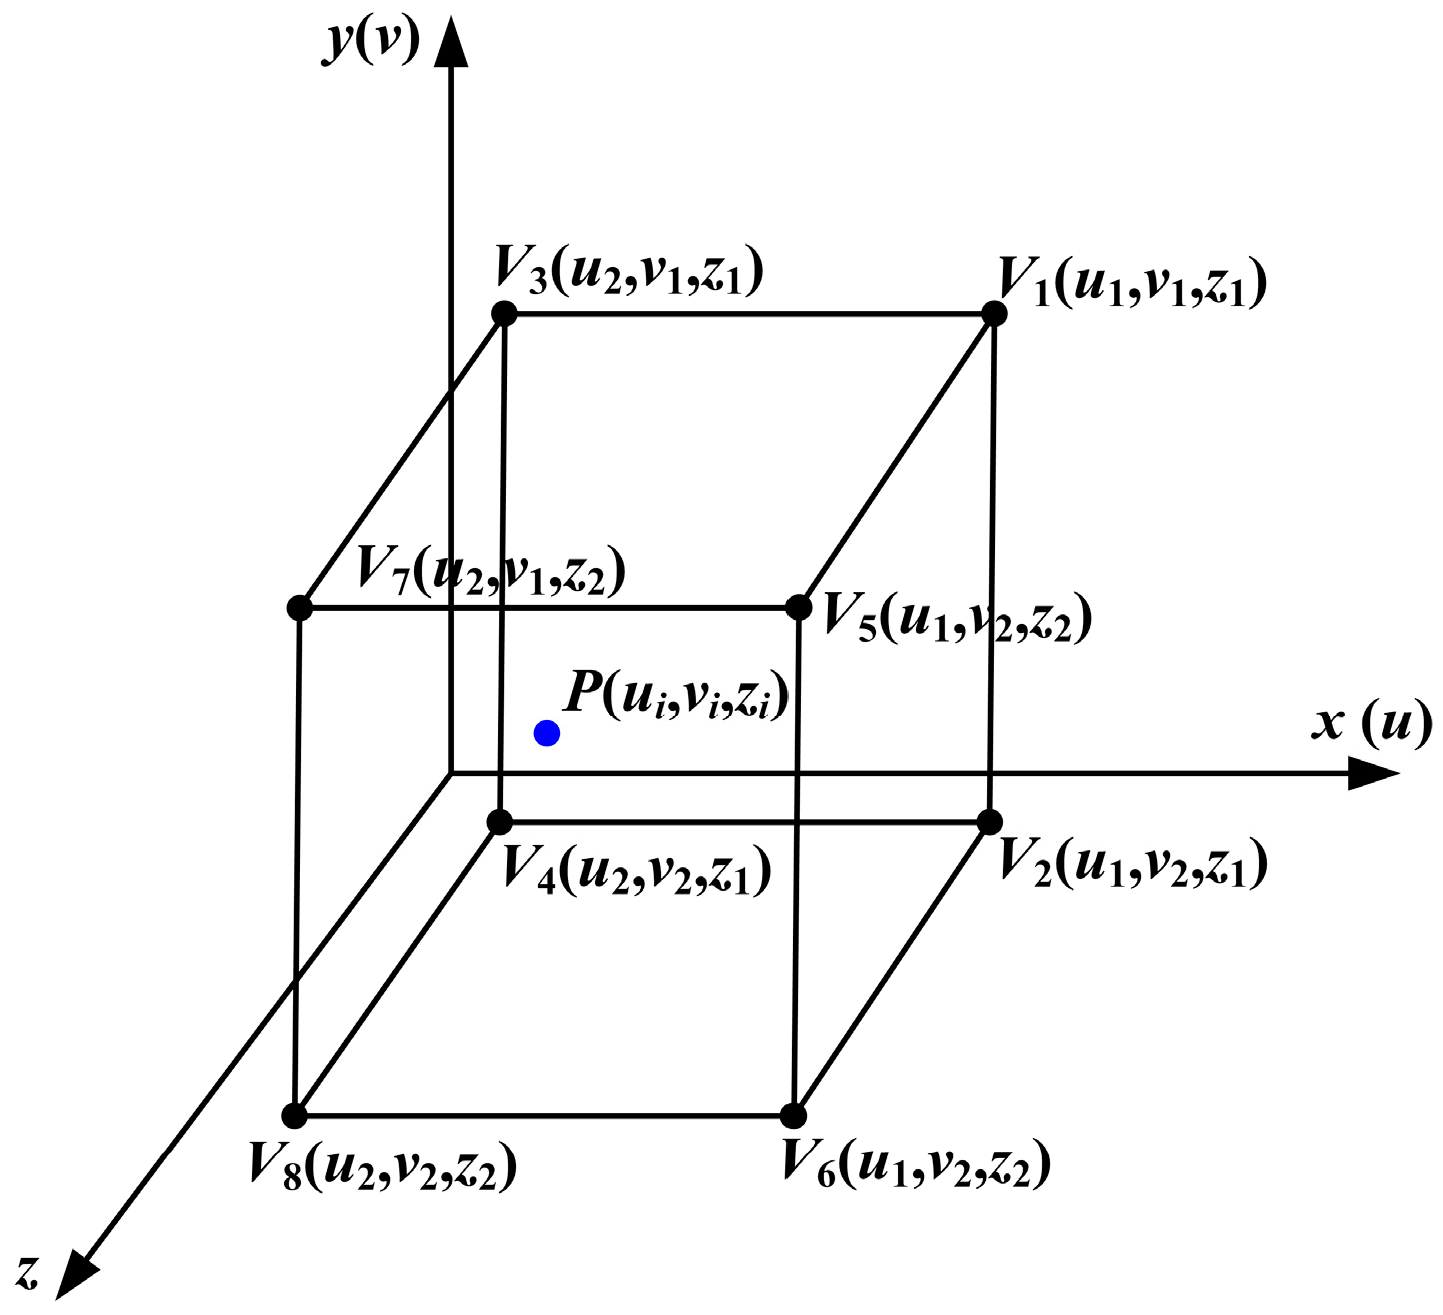
3.2. Construction of 3D Error Map
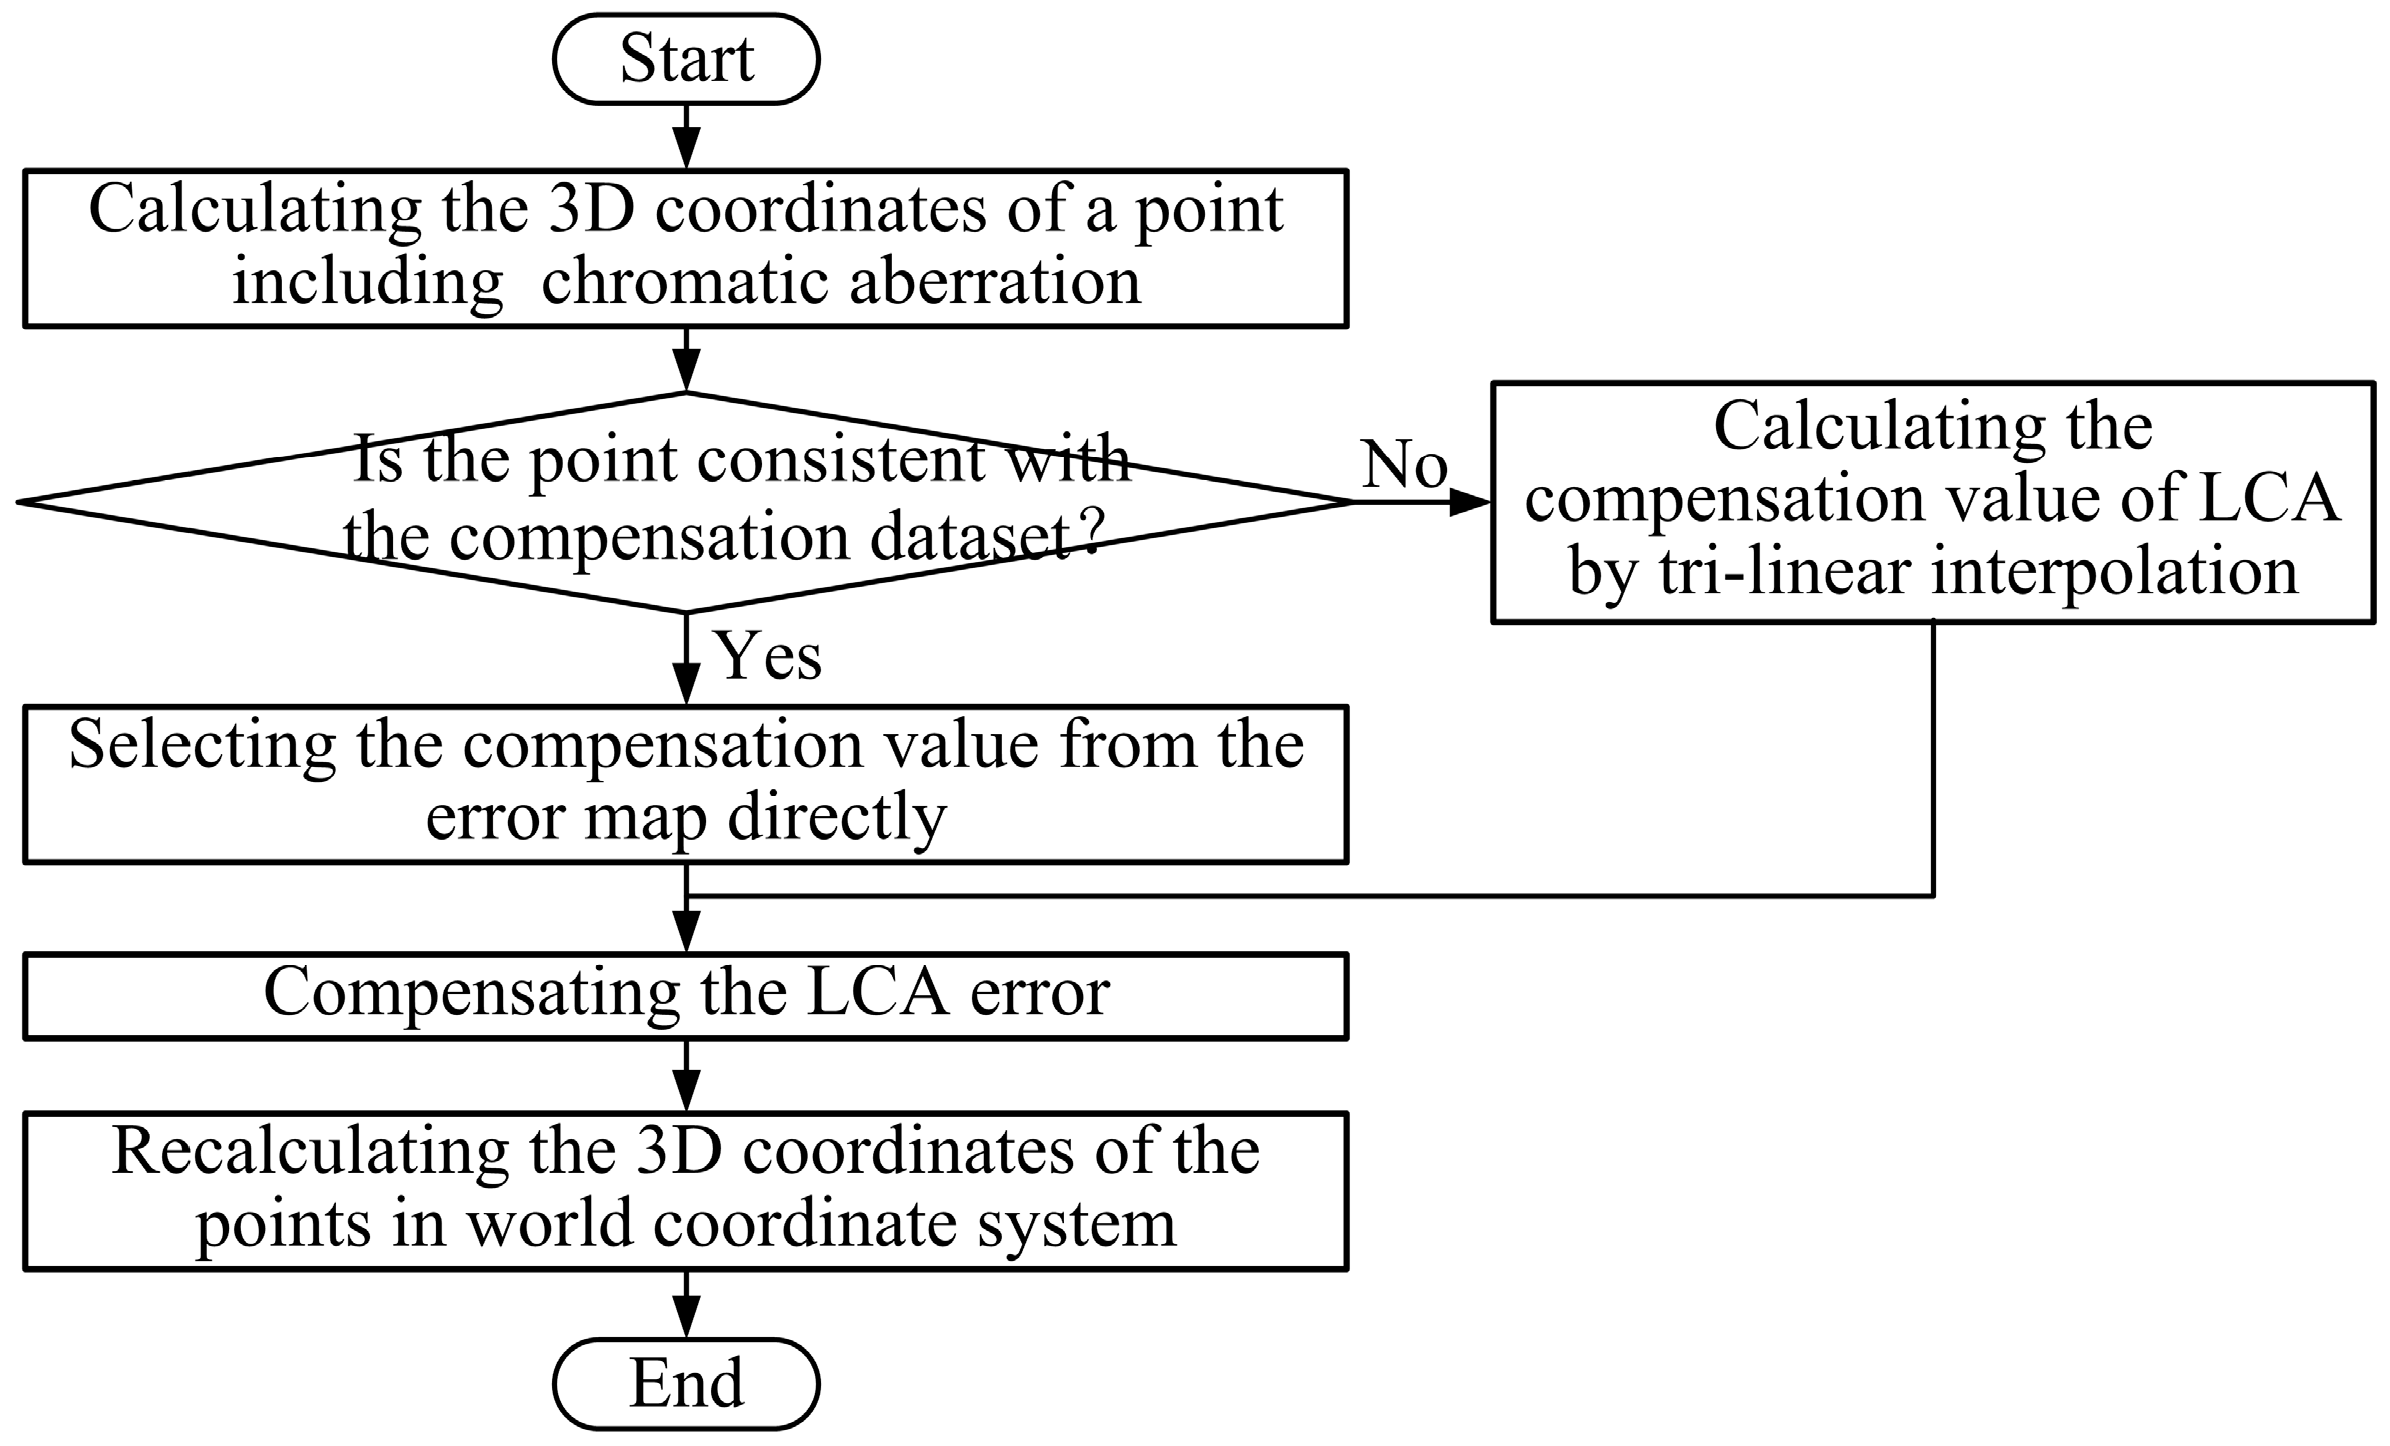
3.3. Compensation of LCA Error
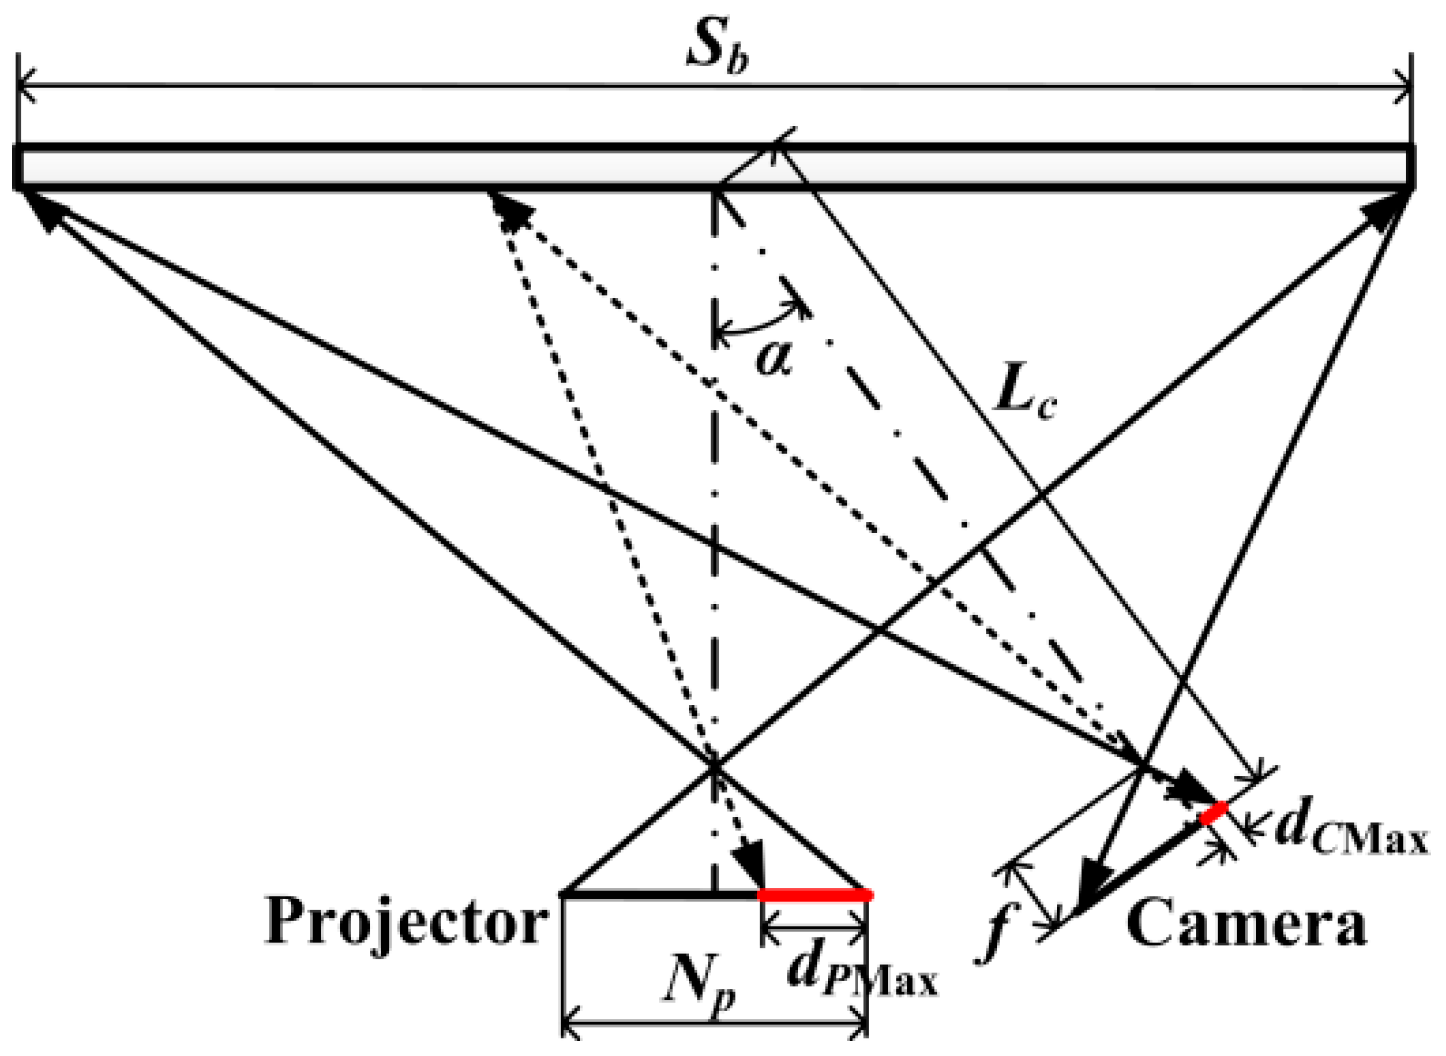
3.4. Analysis of Influence Factors
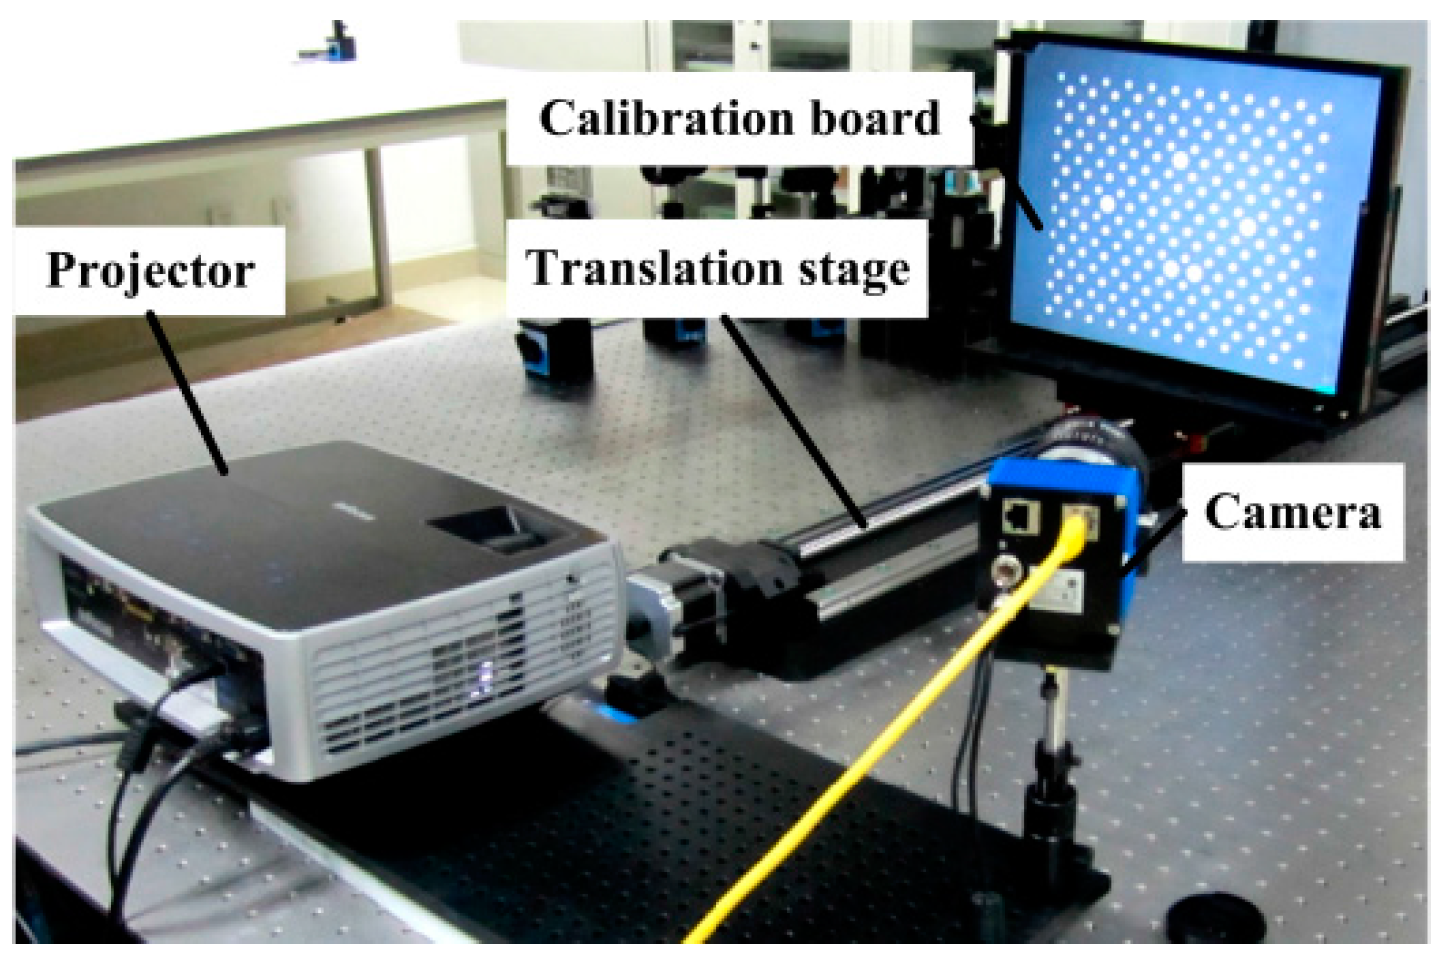
4. Experiments and Analysis
5. Conclusions
Acknowledgments
Author Contributions
Conflicts of Interest
Abbreviations
| LCA | Lateral Chromatic Aberration |
| 3D | Three-Dimensional |
| 1D | One-Dimensional |
| CMM | Coordinates Measuring Machine |
| CSEM | Coordinate System of the 3D Error Map |
References
- Song, L.; Yang, Y.; Chen, Y.; Ye, S. Application of structured lighting sensor for online measurement. Opt. Lasers Eng. 2005, 43, 1118–1126. [Google Scholar] [CrossRef]
- D’Apuzzo, N. Overview of 3D surface digitization technologies in Europe. Proc. SPIE 2006, 6056. [Google Scholar] [CrossRef]
- Ma, L.; Lin, J. Validation of a three-dimensional facial scanning system based on structured light techniques. Comput. Methods Programs Biomed. 2009, 94, 290–298. [Google Scholar] [CrossRef] [PubMed]
- Su, W. Color-encoded fringe projection for 3D shape measurements. Opt. Express 2007, 15, 13167–13181. [Google Scholar] [CrossRef] [PubMed]
- Chen, H.; Zhang, J.; Fang, J. Surface height retrieval based on fringe shifting of color-encoded structured light pattern. Opt. Lett. 2008, 33, 1801–1803. [Google Scholar] [CrossRef] [PubMed]
- Chang, S. 3D imager using dual color-balanced lights. Opt. Lasers Eng. 2008, 46, 62–68. [Google Scholar] [CrossRef]
- Chen, X.; Lu, C.; Ma, M.; Mao, X.; Mei, T. Color-coding and phase-shift method for absolute phase measurement. Opt. Commun. 2013, 298, 54–58. [Google Scholar] [CrossRef]
- Xue, Q.; Wang, Z.; Huang, J.; Gao, J.; Qi, Z. A two-level space-time color-coding method for 3D measurements using structured light. Meas. Sci. Technol. 2015, 26, 115204. [Google Scholar] [CrossRef]
- Hariharan, P. Apochromatic lens combinations: A novel design approach. Opt. Laser Technol. 1997, 29, 217–219. [Google Scholar] [CrossRef]
- Willson, R.; Shafer, S. Active lens control for high precision computer imaging. In Proceedings of the 1991 IEEE International Conference on Robotics and Automation, Sacramento, CA, USA, 9–11 April 1991; pp. 2063–2070.
- Erwan, D.; Christine, P.; Tunneguy, R. 3D triangulation system based on out-of-axis for micro-scaled objects shape measurement. Proc. SPIE 2011, 7932, 79320F. [Google Scholar]
- Barone, S.; Razionale, A. A coded structured light system based on primary color stripe projection and monochrome imaging. Sensors 2013, 13, 13802–13819. [Google Scholar] [CrossRef] [PubMed]
- Chung, S.; Kim, B.; Song, W. Remove chromatic aberration by digital image processing. Opt. Eng. 2010, 49, 067002. [Google Scholar] [CrossRef]
- Lluis-Gomez, A.; Edirisinghe, E. Chromatic aberration correction in RAW domain for image quality enhancement in image sensor processors. In Proceedings of the 2012 IEEE International Conference on Intelligent Computer Communication and Processing, Cluj-Napoca, Romania, 30 August–1 September 2012; pp. 241–244.
- Chang, J.; Kang, H.; Kang, M. Correction of axial and lateral chromatic aberration with false color filtering. IEEE Trans. Image Process. 2013, 22, 1186–1198. [Google Scholar] [CrossRef] [PubMed]
- Korneliussen, J.; Hirakawa, K. Camera Processing With Chromatic Aberration. IEEE Trans. Image Process. 2014, 23, 4539–4552. [Google Scholar] [CrossRef] [PubMed]
- Zhang, L.; Curless, B.; Seitz, S. Rapid shape acquisition using color structured light and multi-pass dynamic programming. In Proceedings of the First International Symposium on 3D Data Processing Visualization and Transmission, Padova, Italy, 19–21 June 2002; pp. 24–36.
- Pagès, J.; Collewetb, C.; Forest, J. Optimised debruijn patterns for one-shot shape acquisition. Image Vis. Comput. 2005, 23, 707–702. [Google Scholar] [CrossRef]
- Zhang, Z.; Towers, C.; Towers, D. Compensating lateral chromatic aberration of a colour fringe projection system for shape metrology. Opt. Lasers Eng. 2010, 48, 159–165. [Google Scholar] [CrossRef]
- Li, W.; Duan, S. Color calibration and correction applying linear interpolation technique for color fringe projection system. Optik Int. J. Light Electron Opt. 2016, 127, 2074–2082. [Google Scholar] [CrossRef]
- Huang, J.; Wang, Z.; Xue, Q.; Gao, J. Projector calibration with error surface compensation method in the structured light three dimensional measurement system. Opt. Eng. 2013, 52, 043602. [Google Scholar] [CrossRef]
- Da, F. Sub-pixel edge detection based on an improved moment. Image Vis. Comput. 2010, 28, 1645–1658. [Google Scholar] [CrossRef]


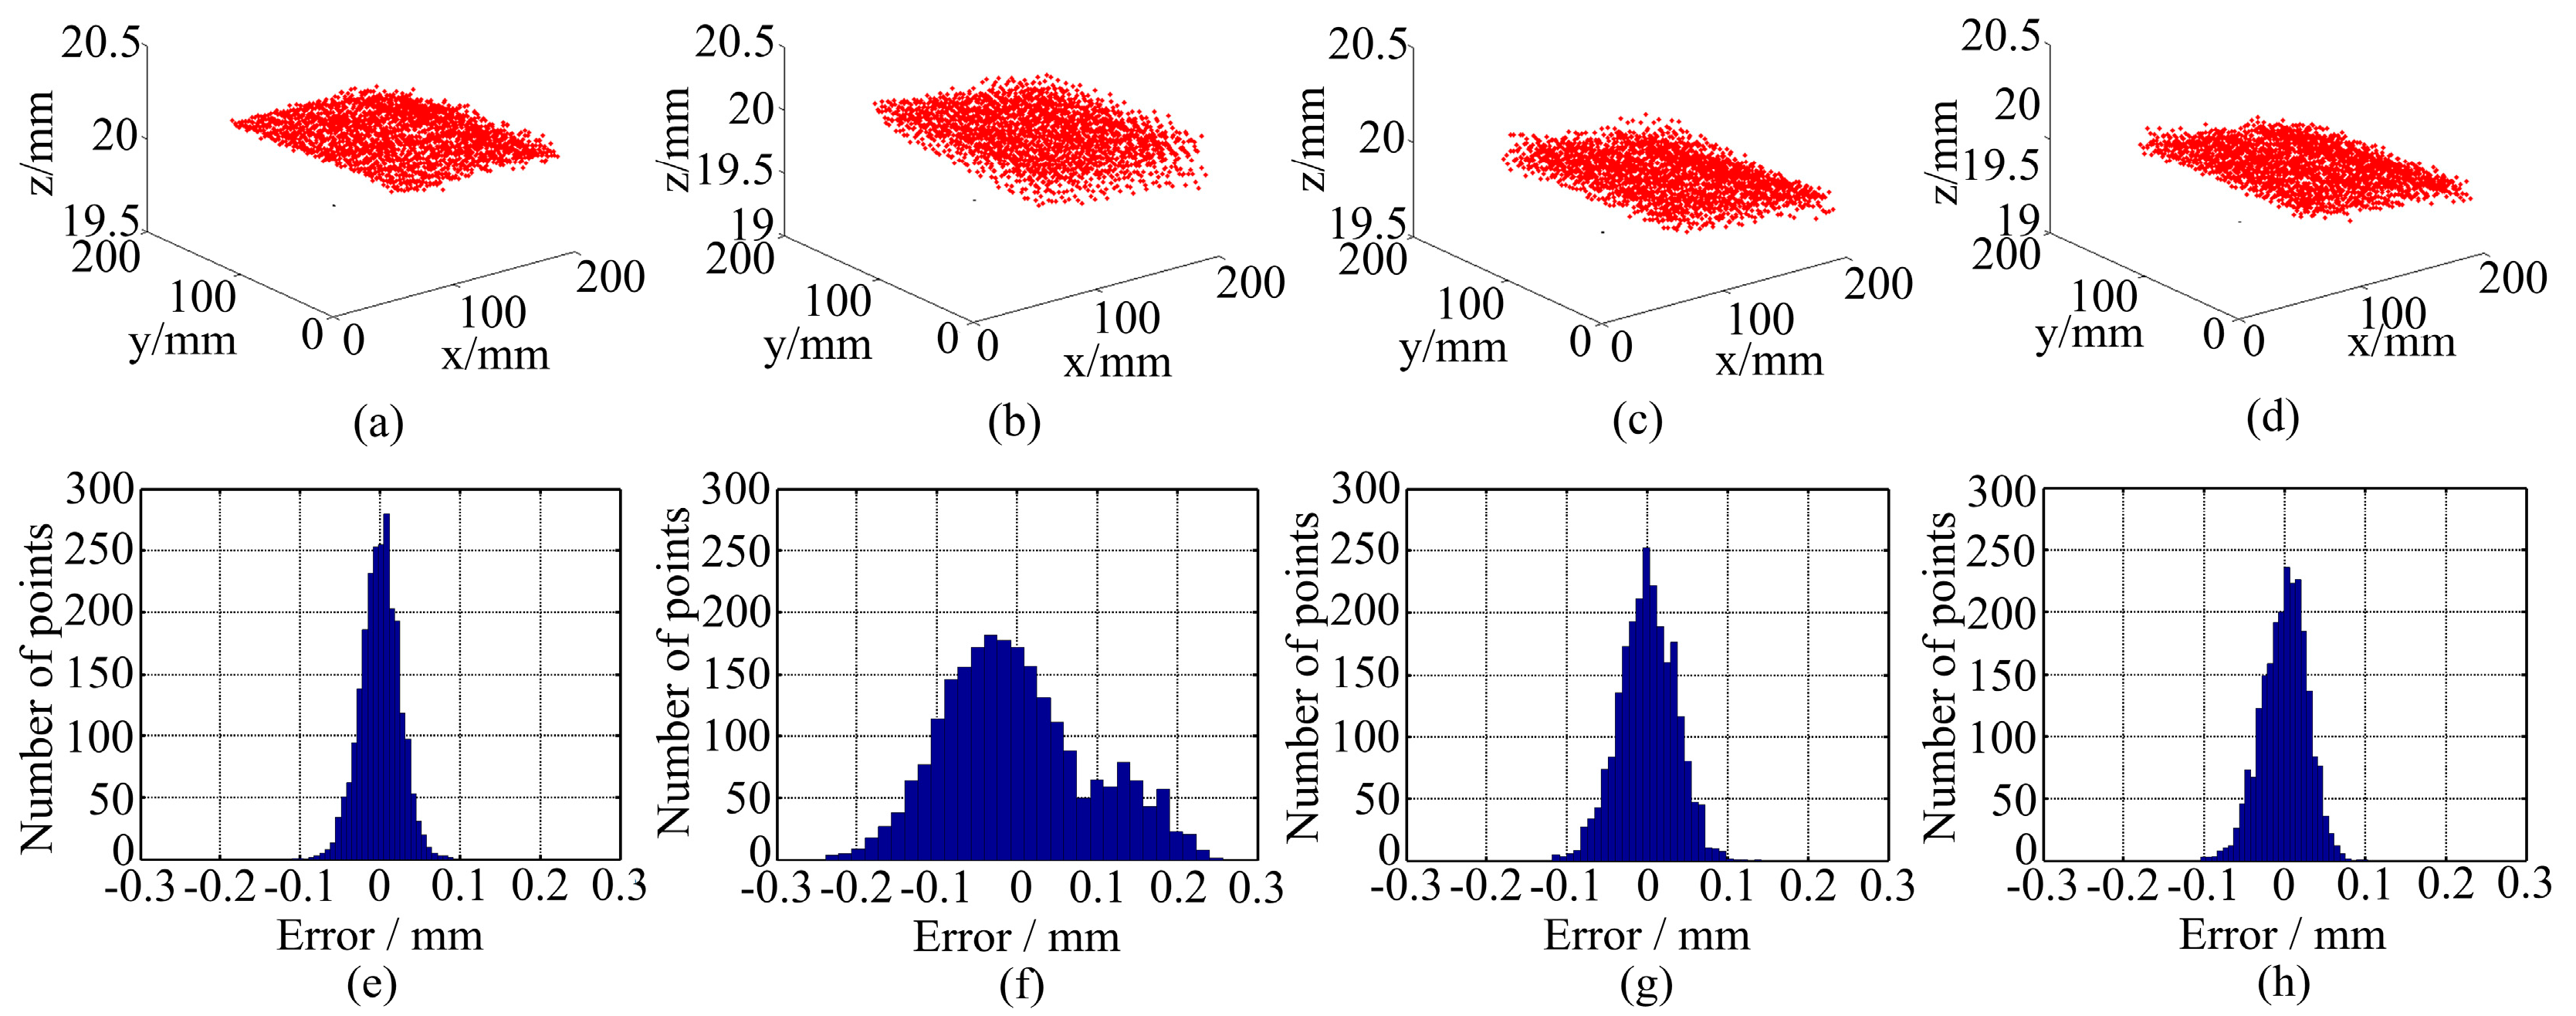
| Statistics | Monochromatic Fringes | WRGB Fringes | Results of the Method in Reference [18] | Results of the Method in This Research |
|---|---|---|---|---|
| Max error | 0.105 mm | 0.258 mm | 0.142 mm | 0.110 mm |
| Std. dev. | 0.025 mm | 0.092 mm | 0.036 mm | 0.028 mm |
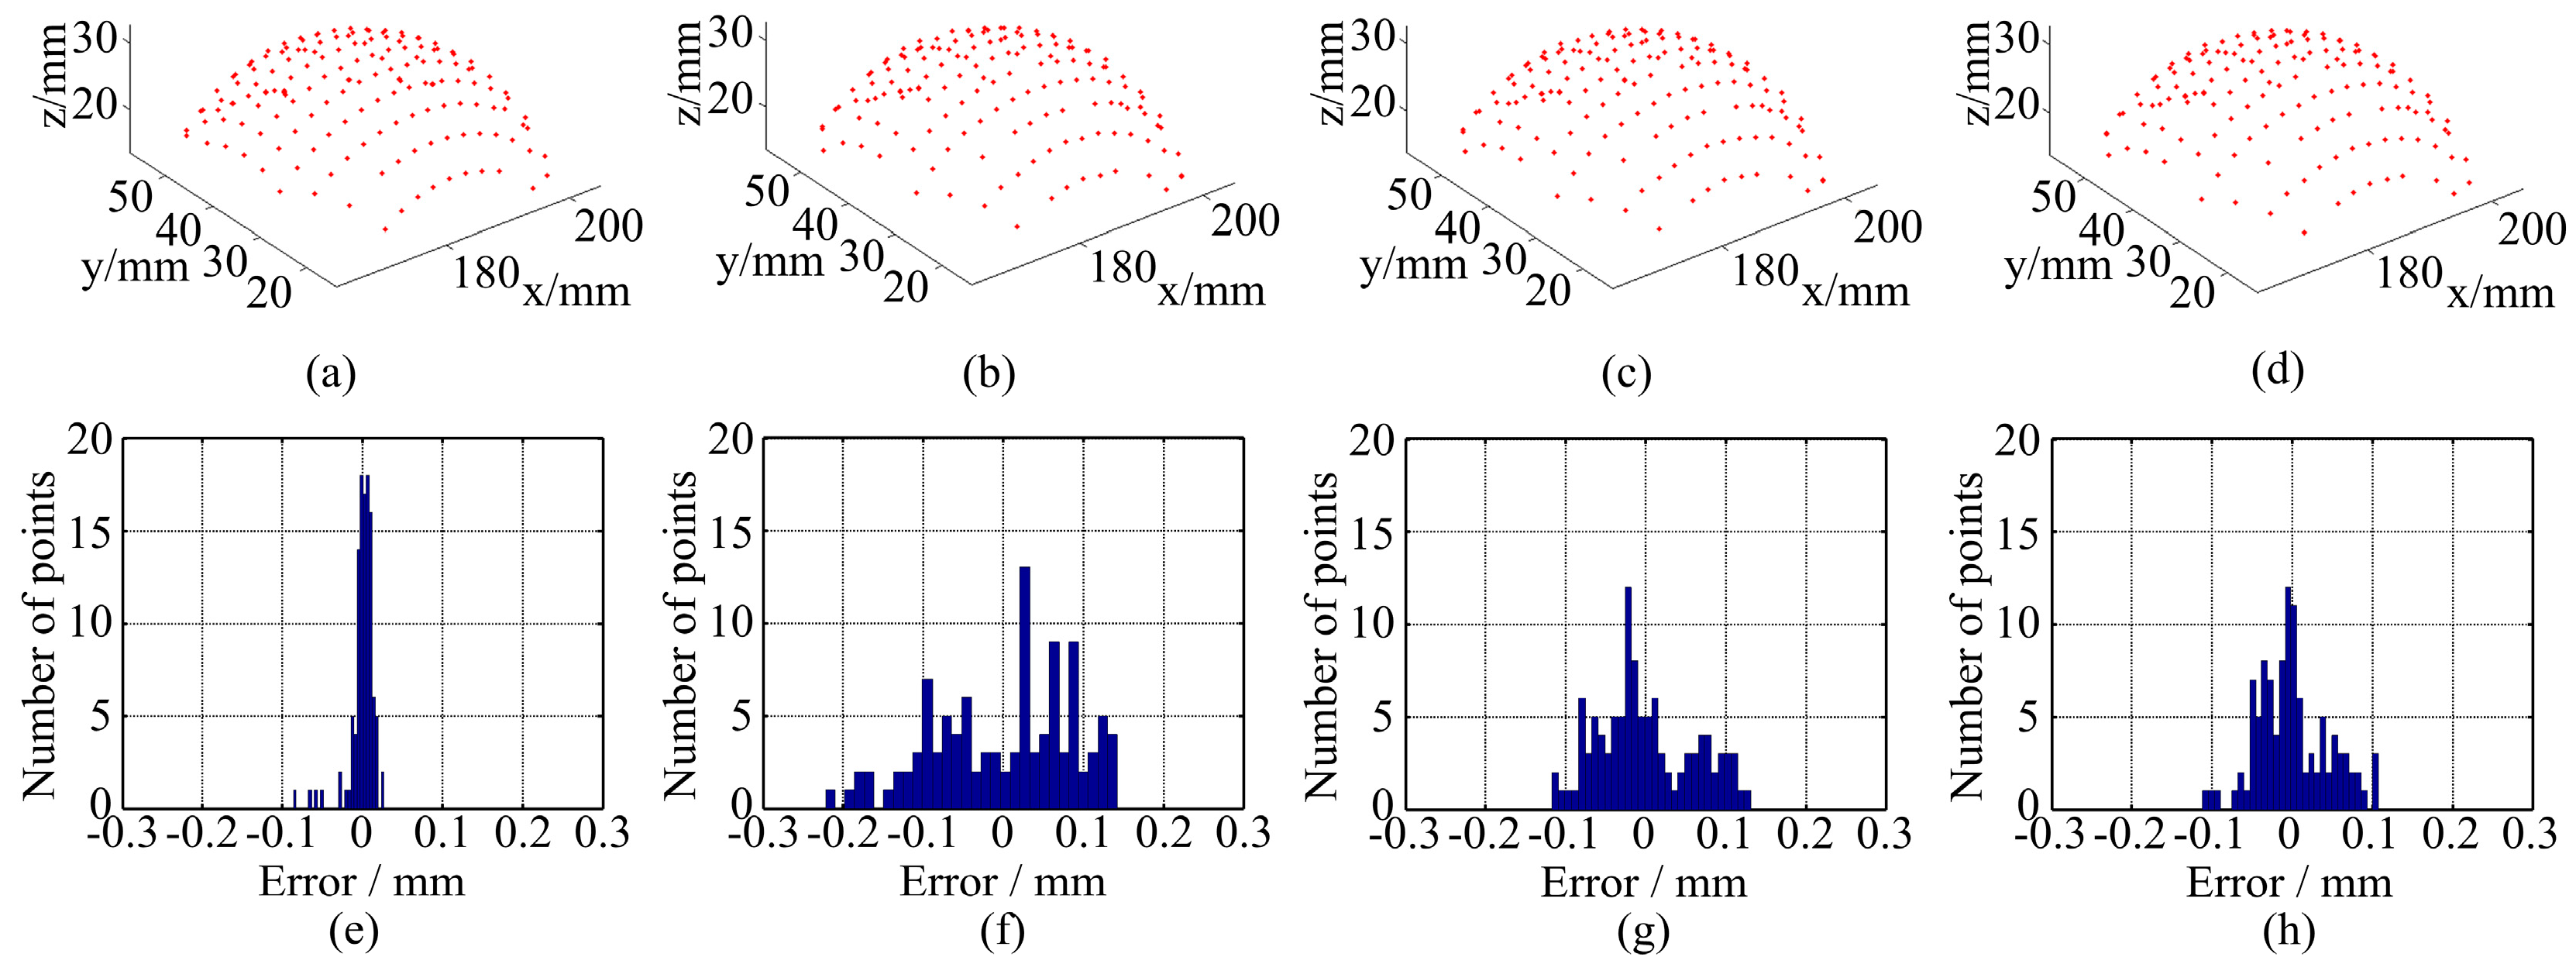
| Statistics | Monochromatic Fringes | WRGB Fringes | Results of the Method in Reference [18] | Results of the Method in This Research |
|---|---|---|---|---|
| Max error | 0.124 mm | 0.229 mm | 0.155 mm | 0.150 mm |
| Std. dev. | 0.021 mm | 0.045 mm | 0.036 mm | 0.027 mm |
| Radius error | 0.100 mm | 0.110 mm | 0.103 mm | 0.100 mm |
© 2016 by the authors; licensee MDPI, Basel, Switzerland. This article is an open access article distributed under the terms and conditions of the Creative Commons Attribution (CC-BY) license (http://creativecommons.org/licenses/by/4.0/).
Share and Cite
Huang, J.; Xue, Q.; Wang, Z.; Gao, J. Analysis and Compensation for Lateral Chromatic Aberration in a Color Coding Structured Light 3D Measurement System. Sensors 2016, 16, 1426. https://doi.org/10.3390/s16091426
Huang J, Xue Q, Wang Z, Gao J. Analysis and Compensation for Lateral Chromatic Aberration in a Color Coding Structured Light 3D Measurement System. Sensors. 2016; 16(9):1426. https://doi.org/10.3390/s16091426
Chicago/Turabian StyleHuang, Junhui, Qi Xue, Zhao Wang, and Jianmin Gao. 2016. "Analysis and Compensation for Lateral Chromatic Aberration in a Color Coding Structured Light 3D Measurement System" Sensors 16, no. 9: 1426. https://doi.org/10.3390/s16091426
APA StyleHuang, J., Xue, Q., Wang, Z., & Gao, J. (2016). Analysis and Compensation for Lateral Chromatic Aberration in a Color Coding Structured Light 3D Measurement System. Sensors, 16(9), 1426. https://doi.org/10.3390/s16091426