
CO Gas Sensing Properties of Pure and Cu-Incorporated SnO2 Nanoparticles: A Study of Cu-Induced Modifications

 ,
, 

Abstract
:
1. Introduction
2. Experimental Procedure
2.1. Homogeneous Precipitation of Tin Oxide Powders
2.2. Cu-Incorporated SnO2 (Cu:SnO2) Powders
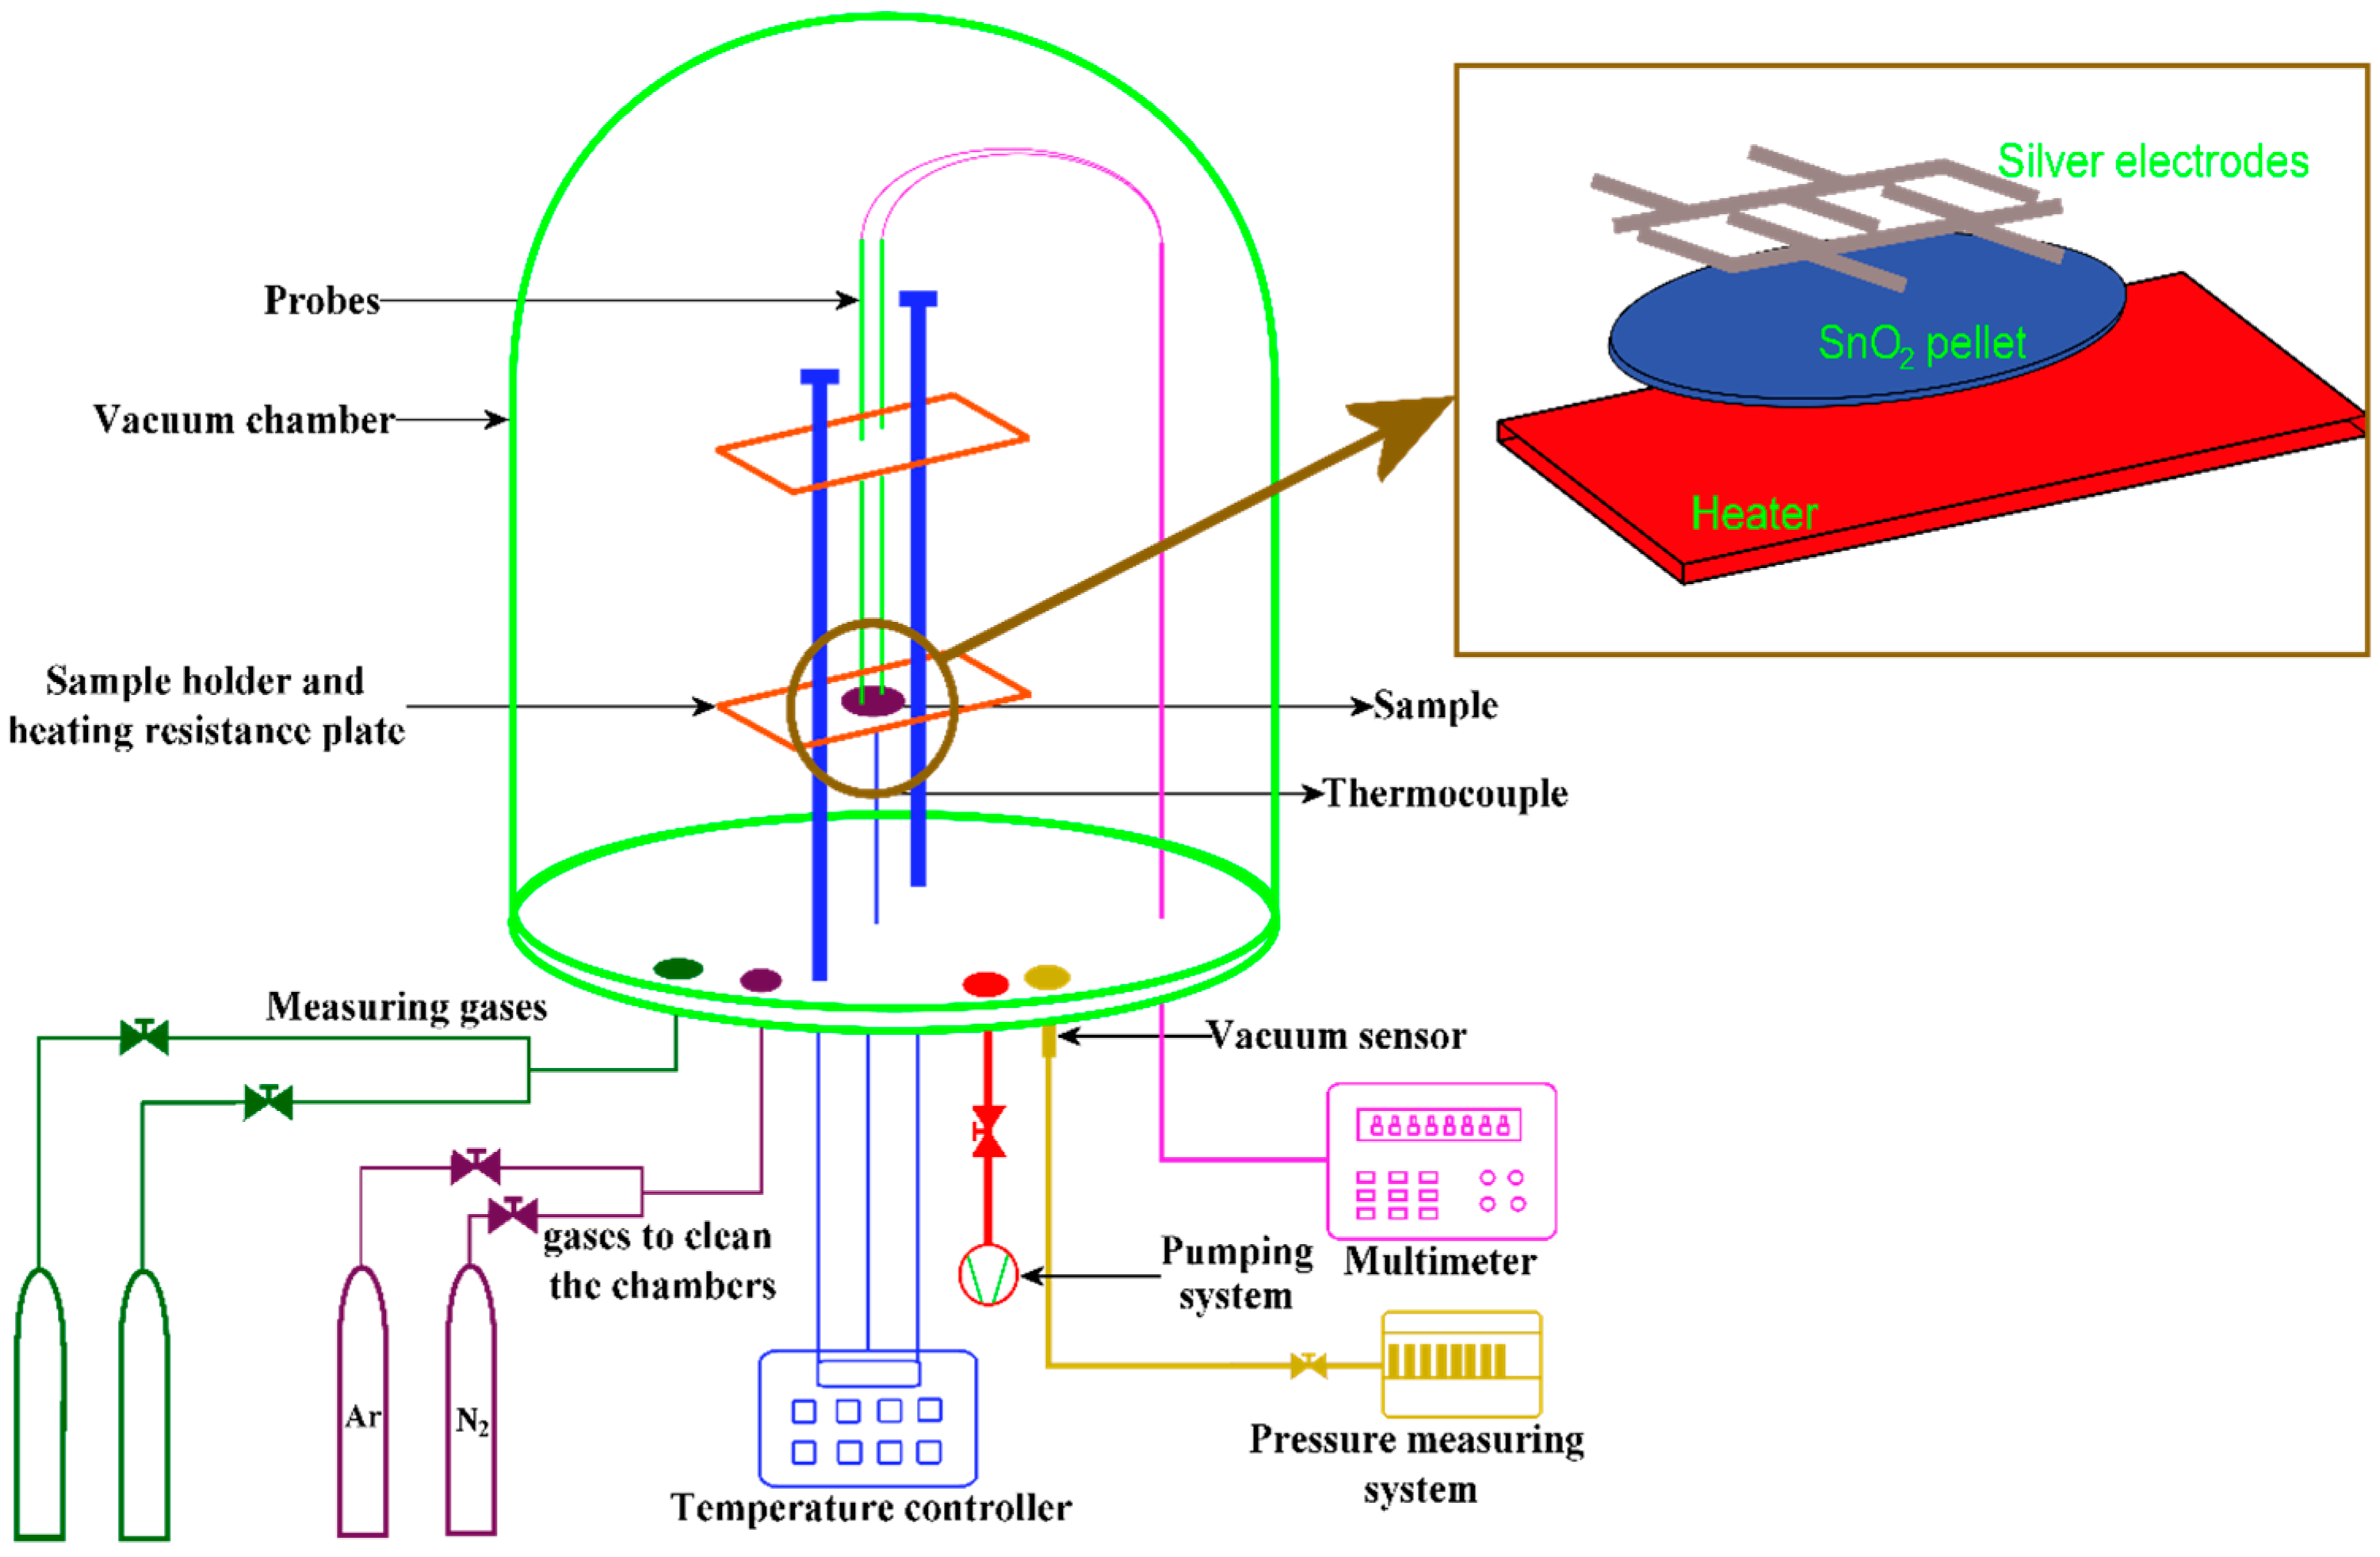
3. Characterization
4. Results and Discussion
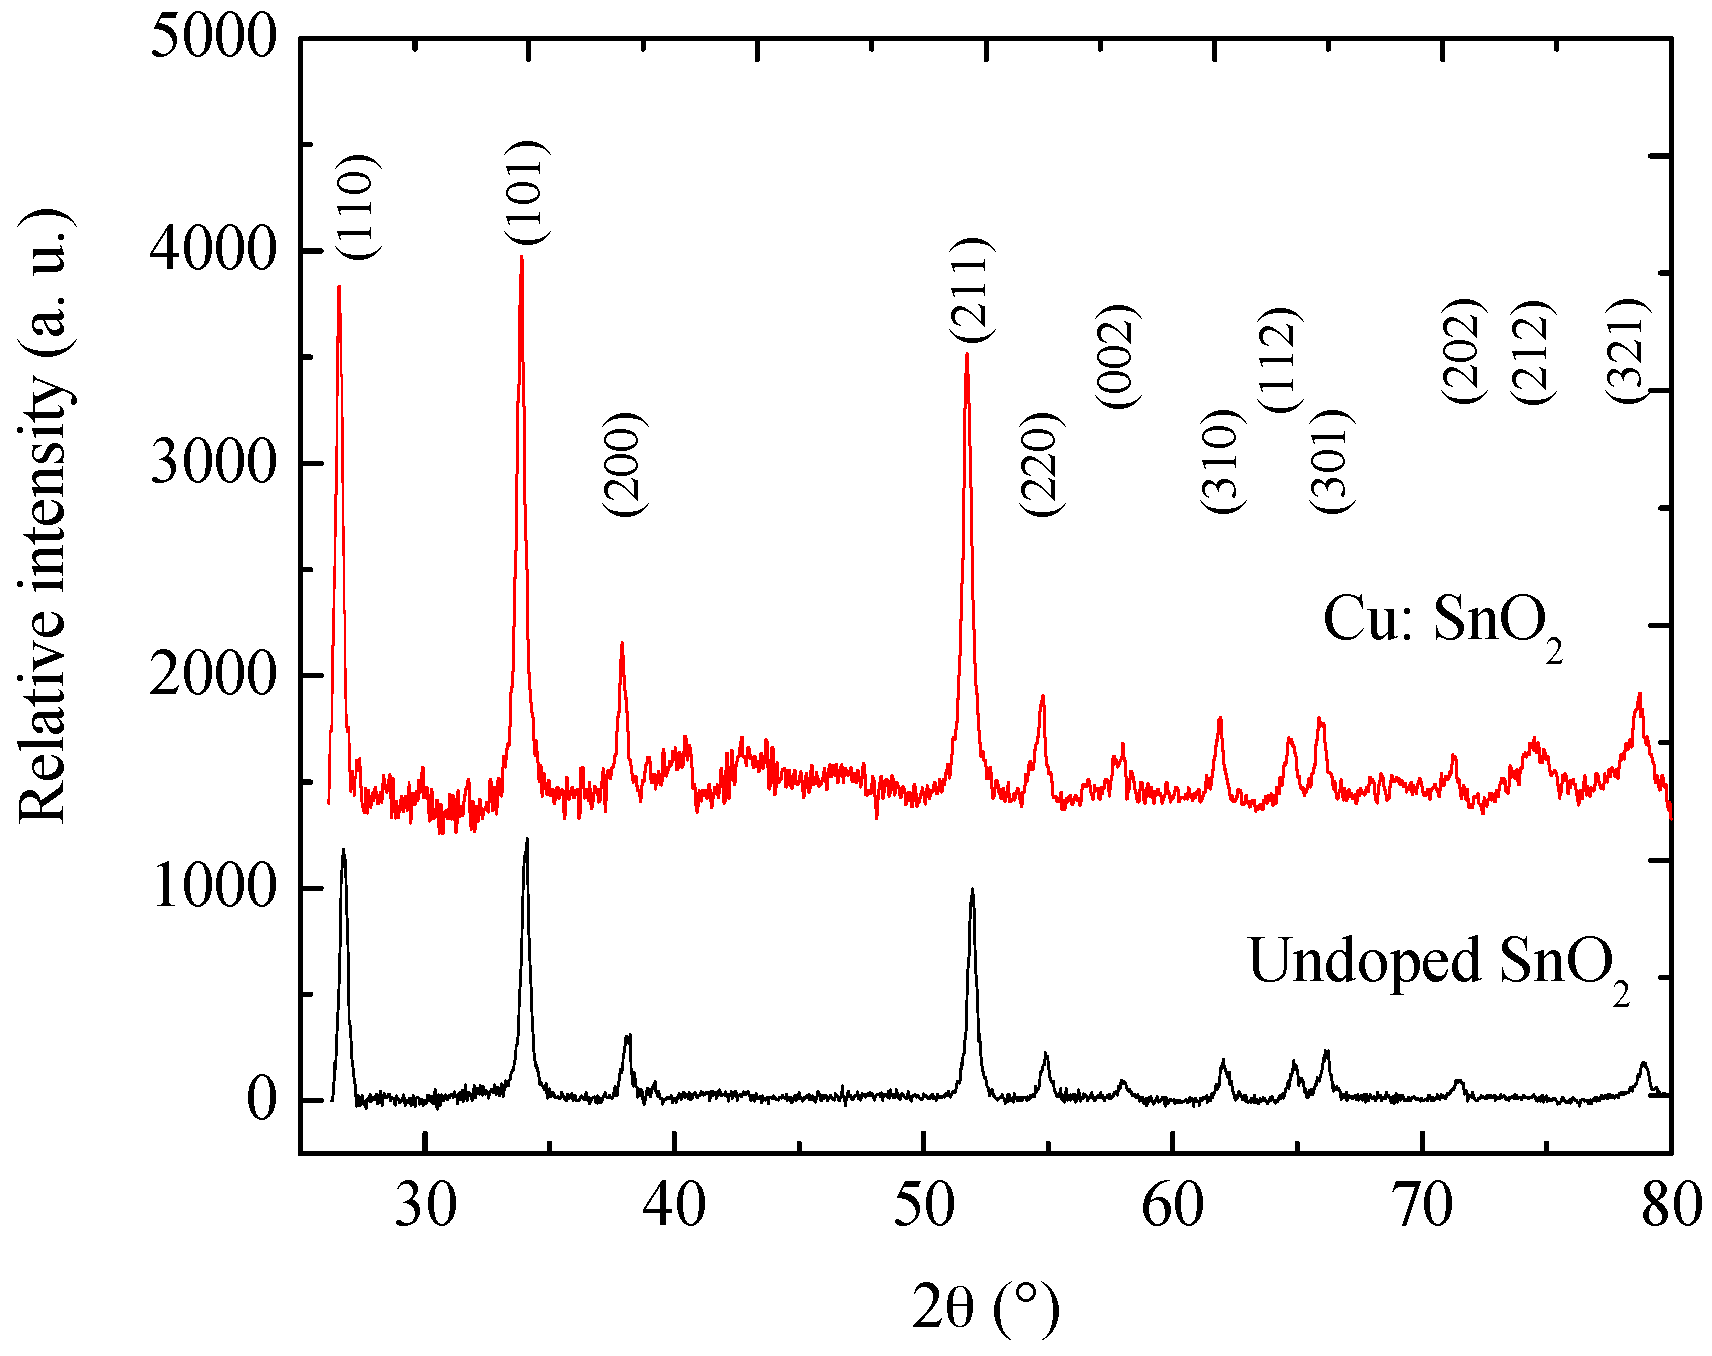
4.1. X-ray Diffraction Analysis
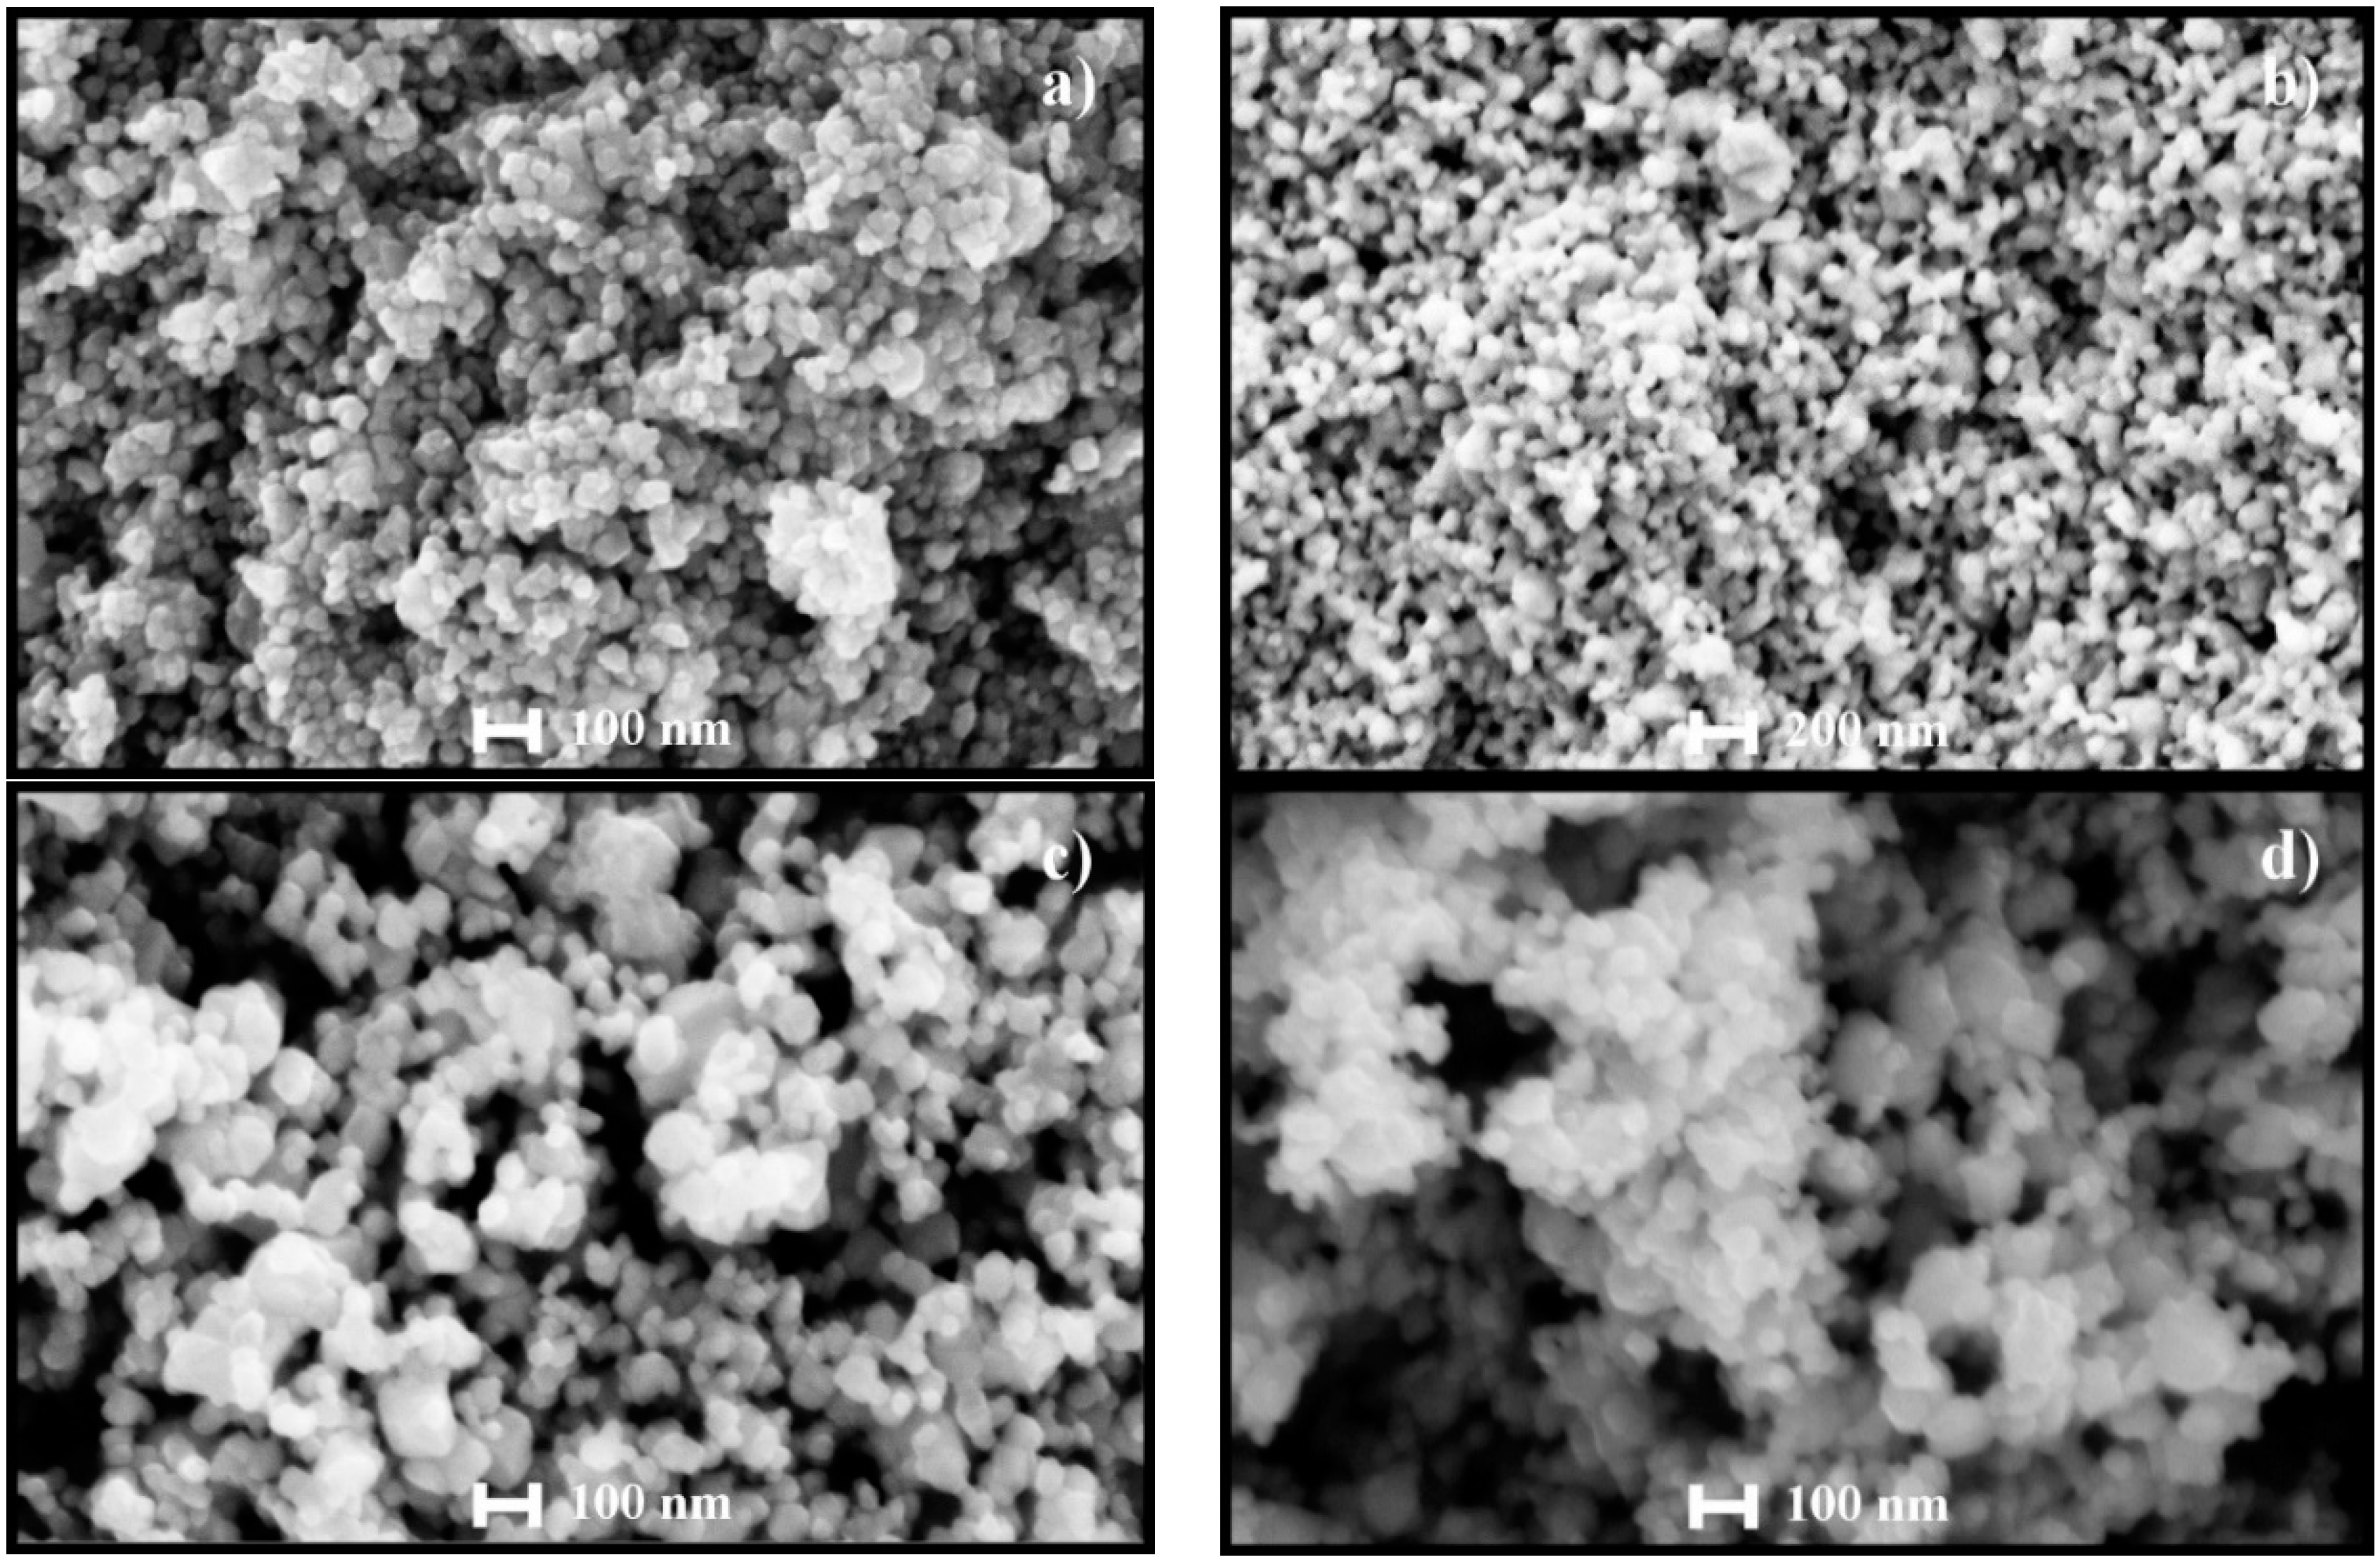
4.2. SEM Analysis
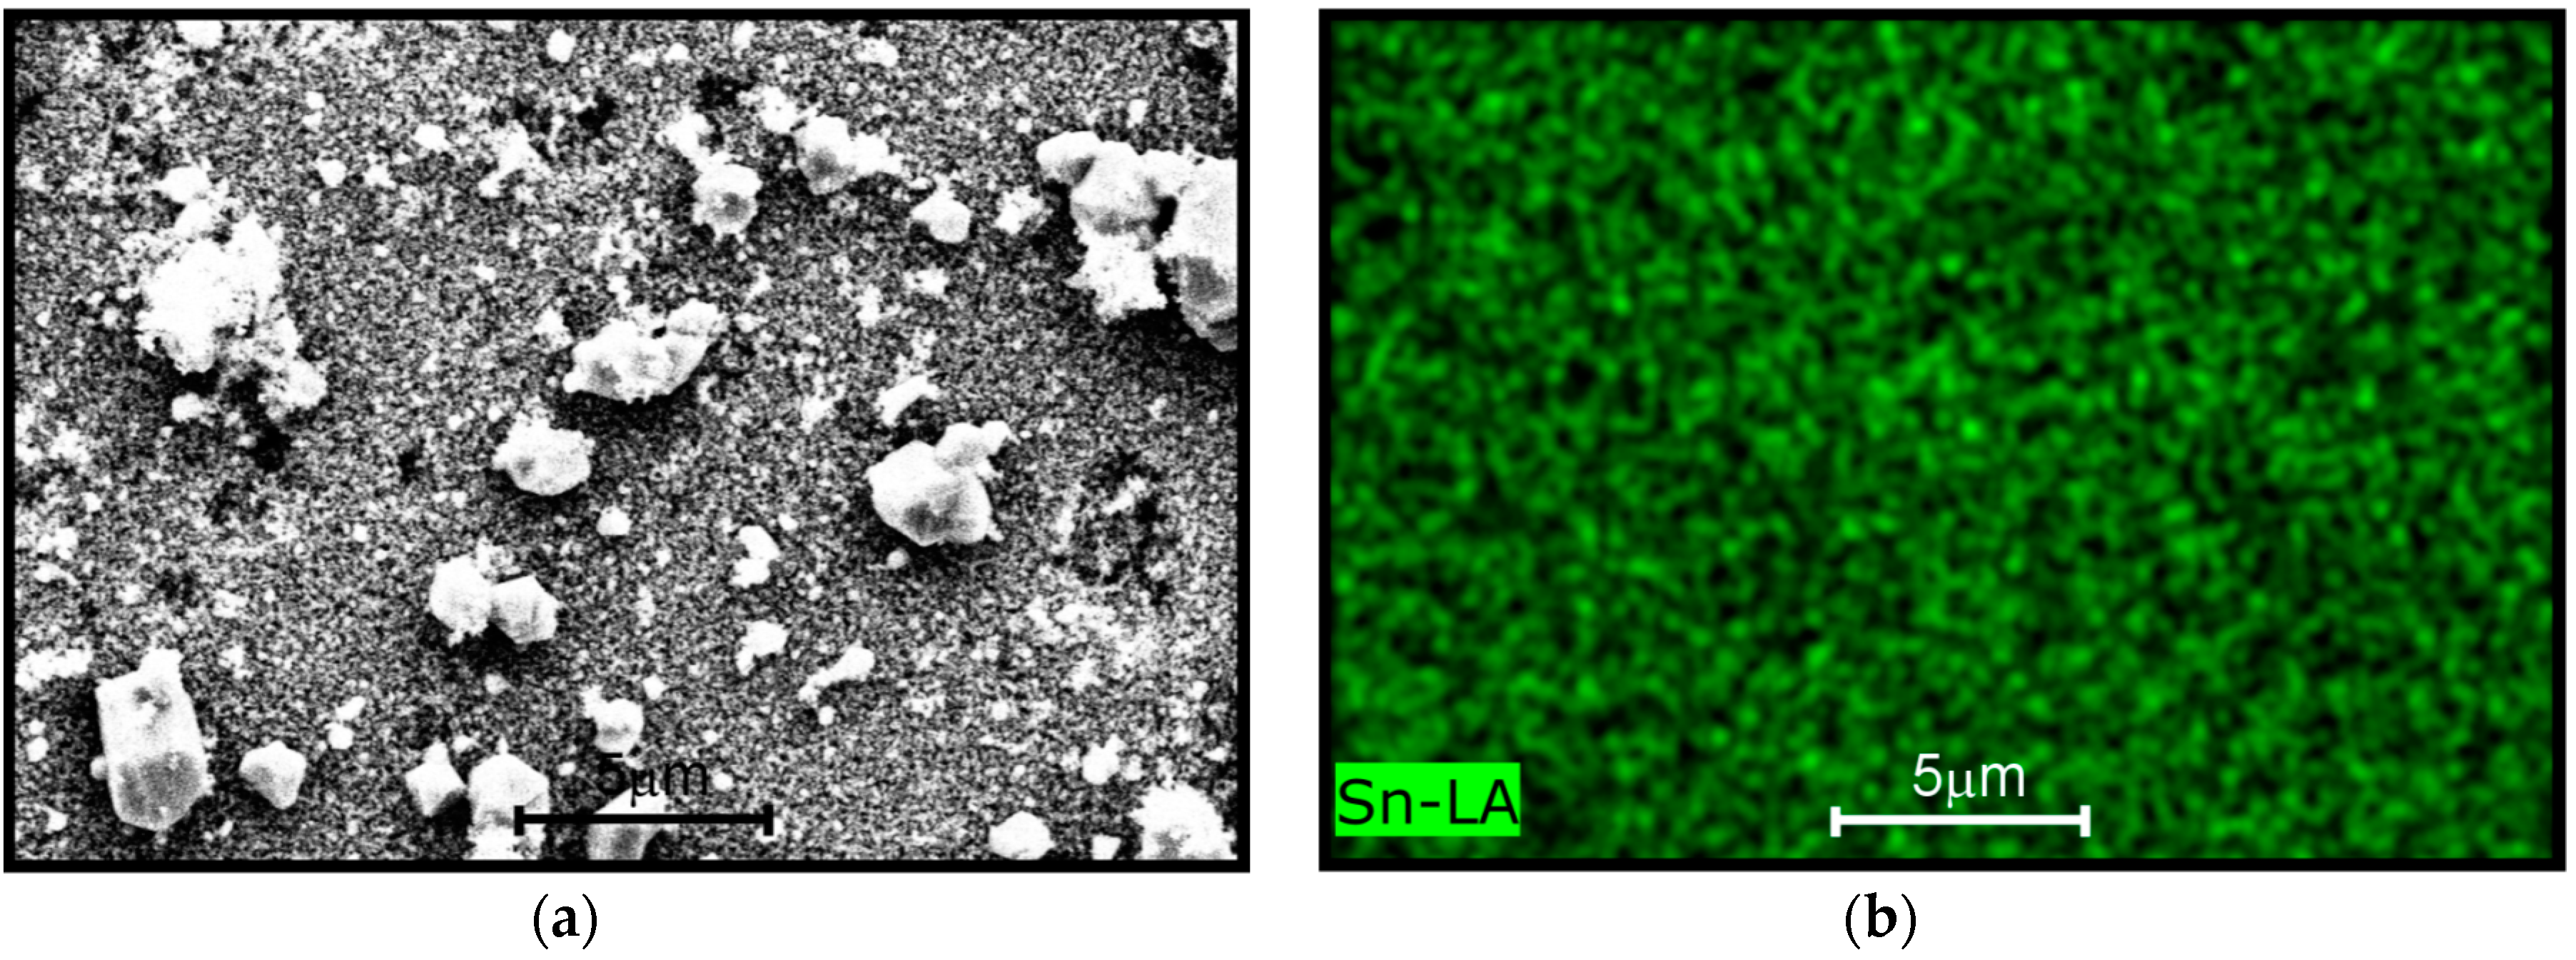
4.3. EDAX Analysis
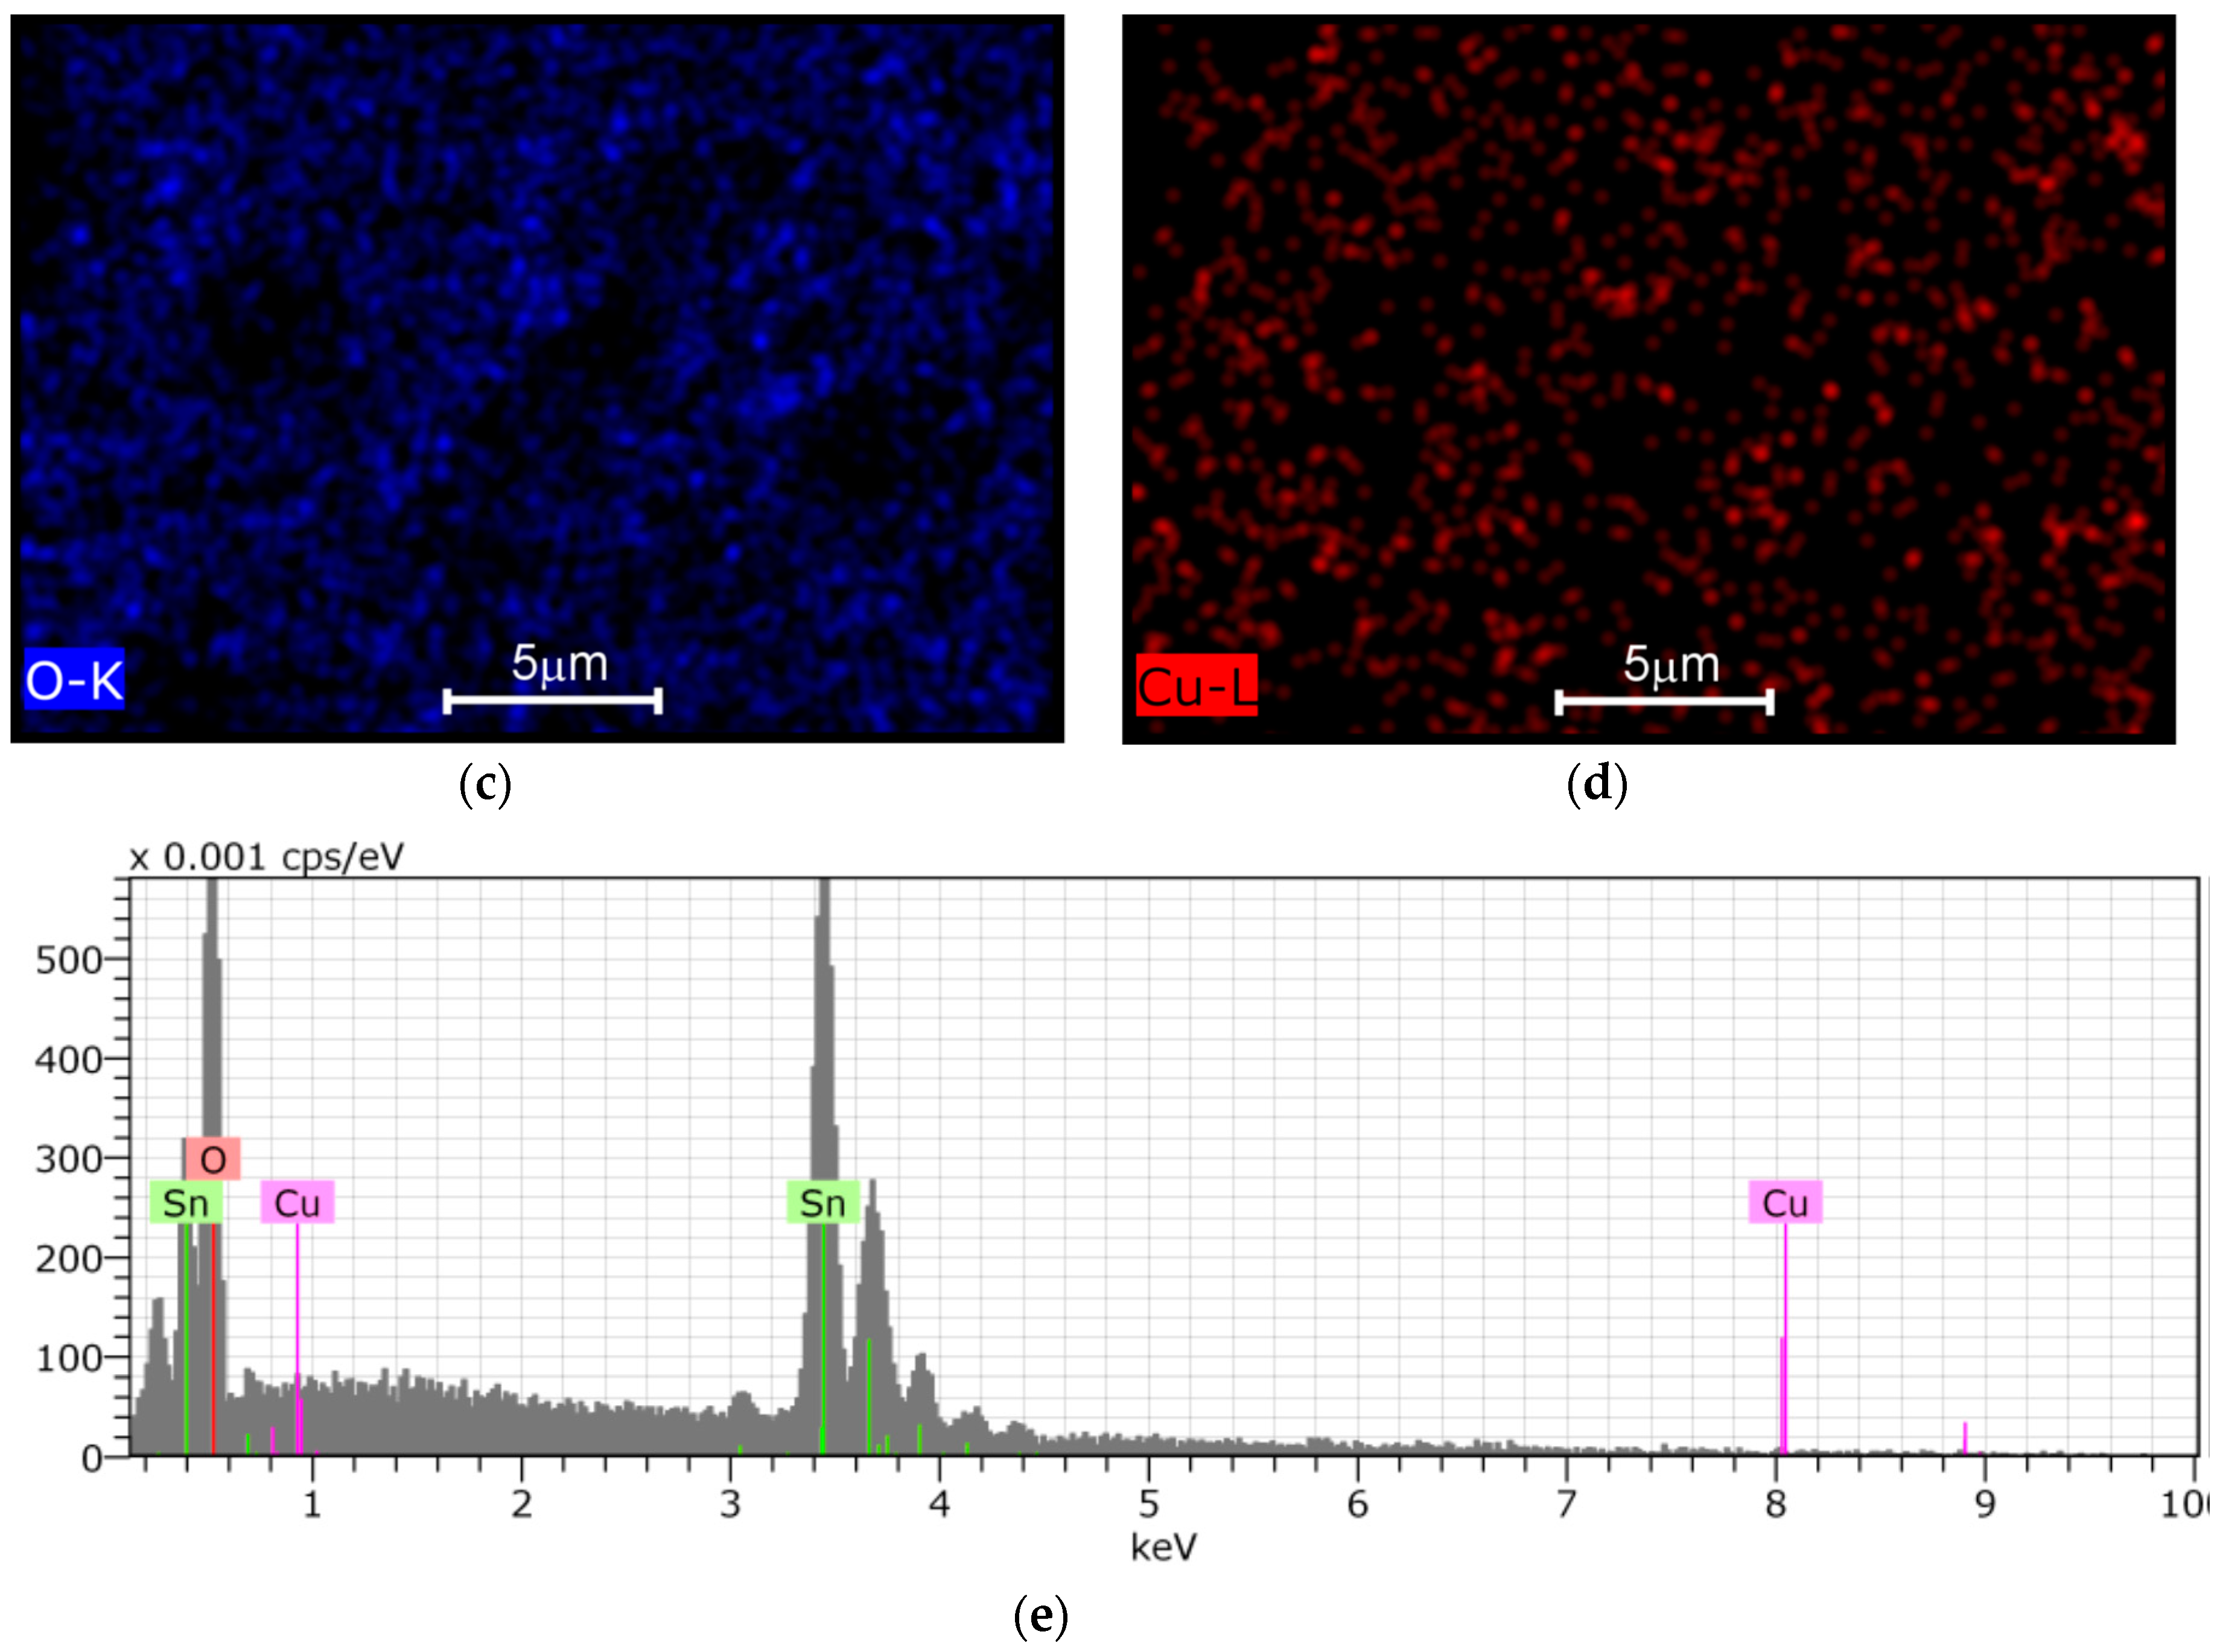
4.4. XPS Analysis
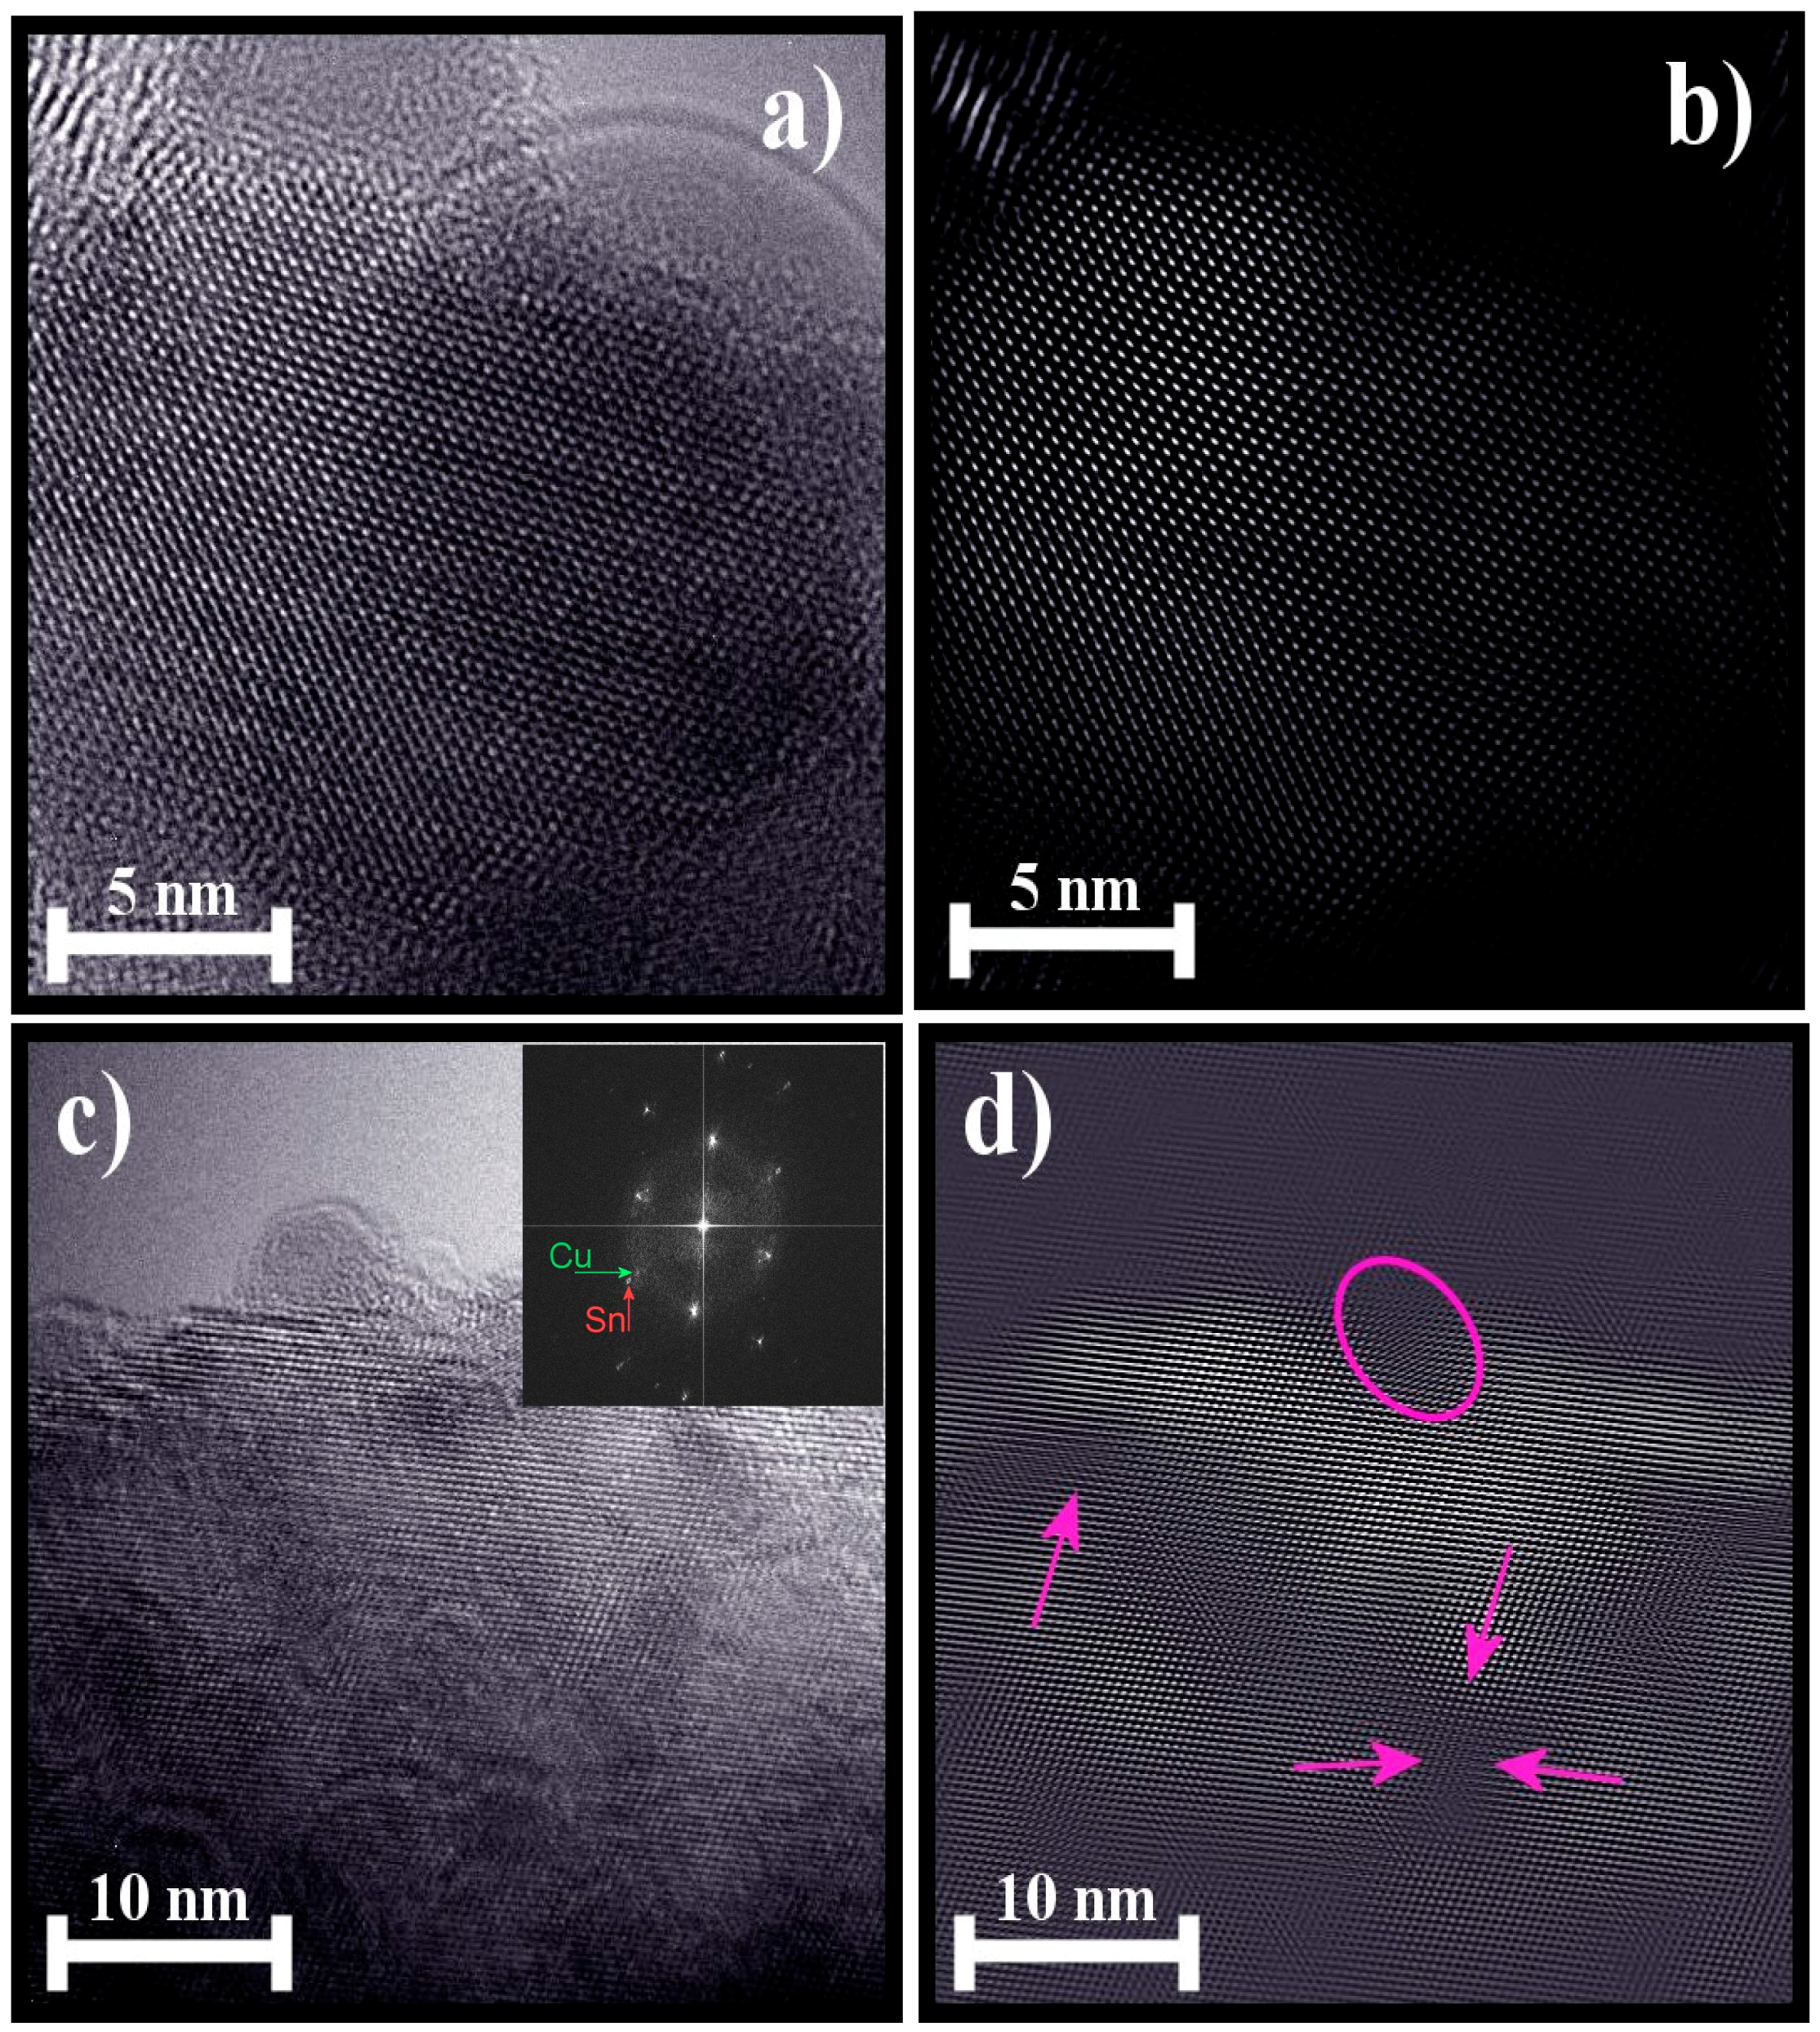
4.5. HRTEM Analysis
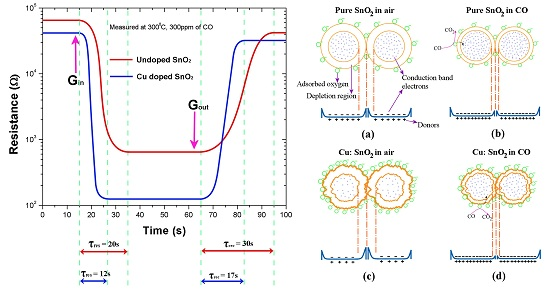
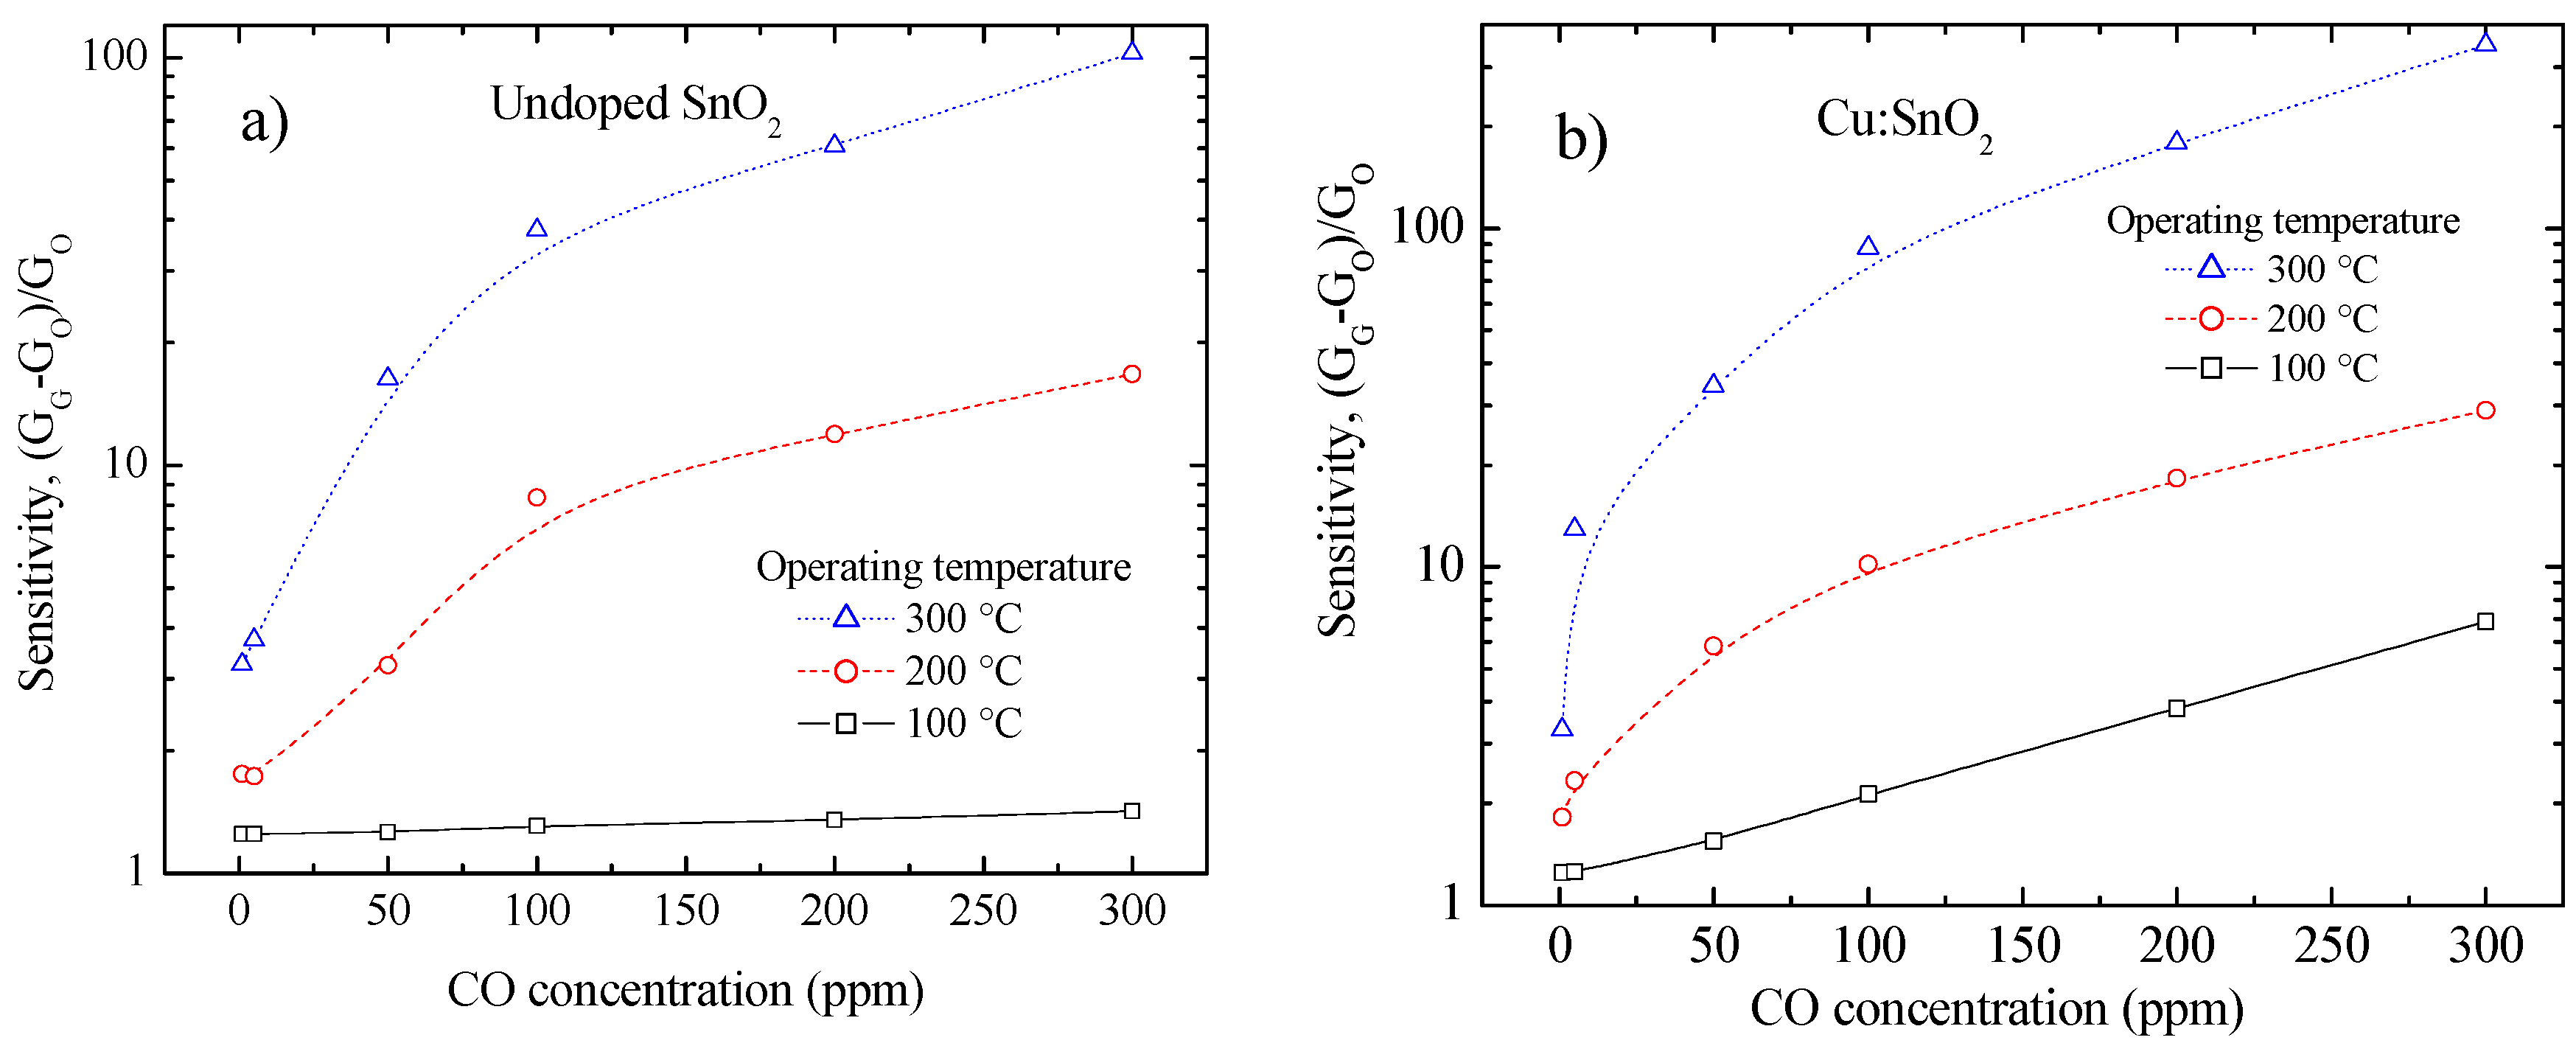
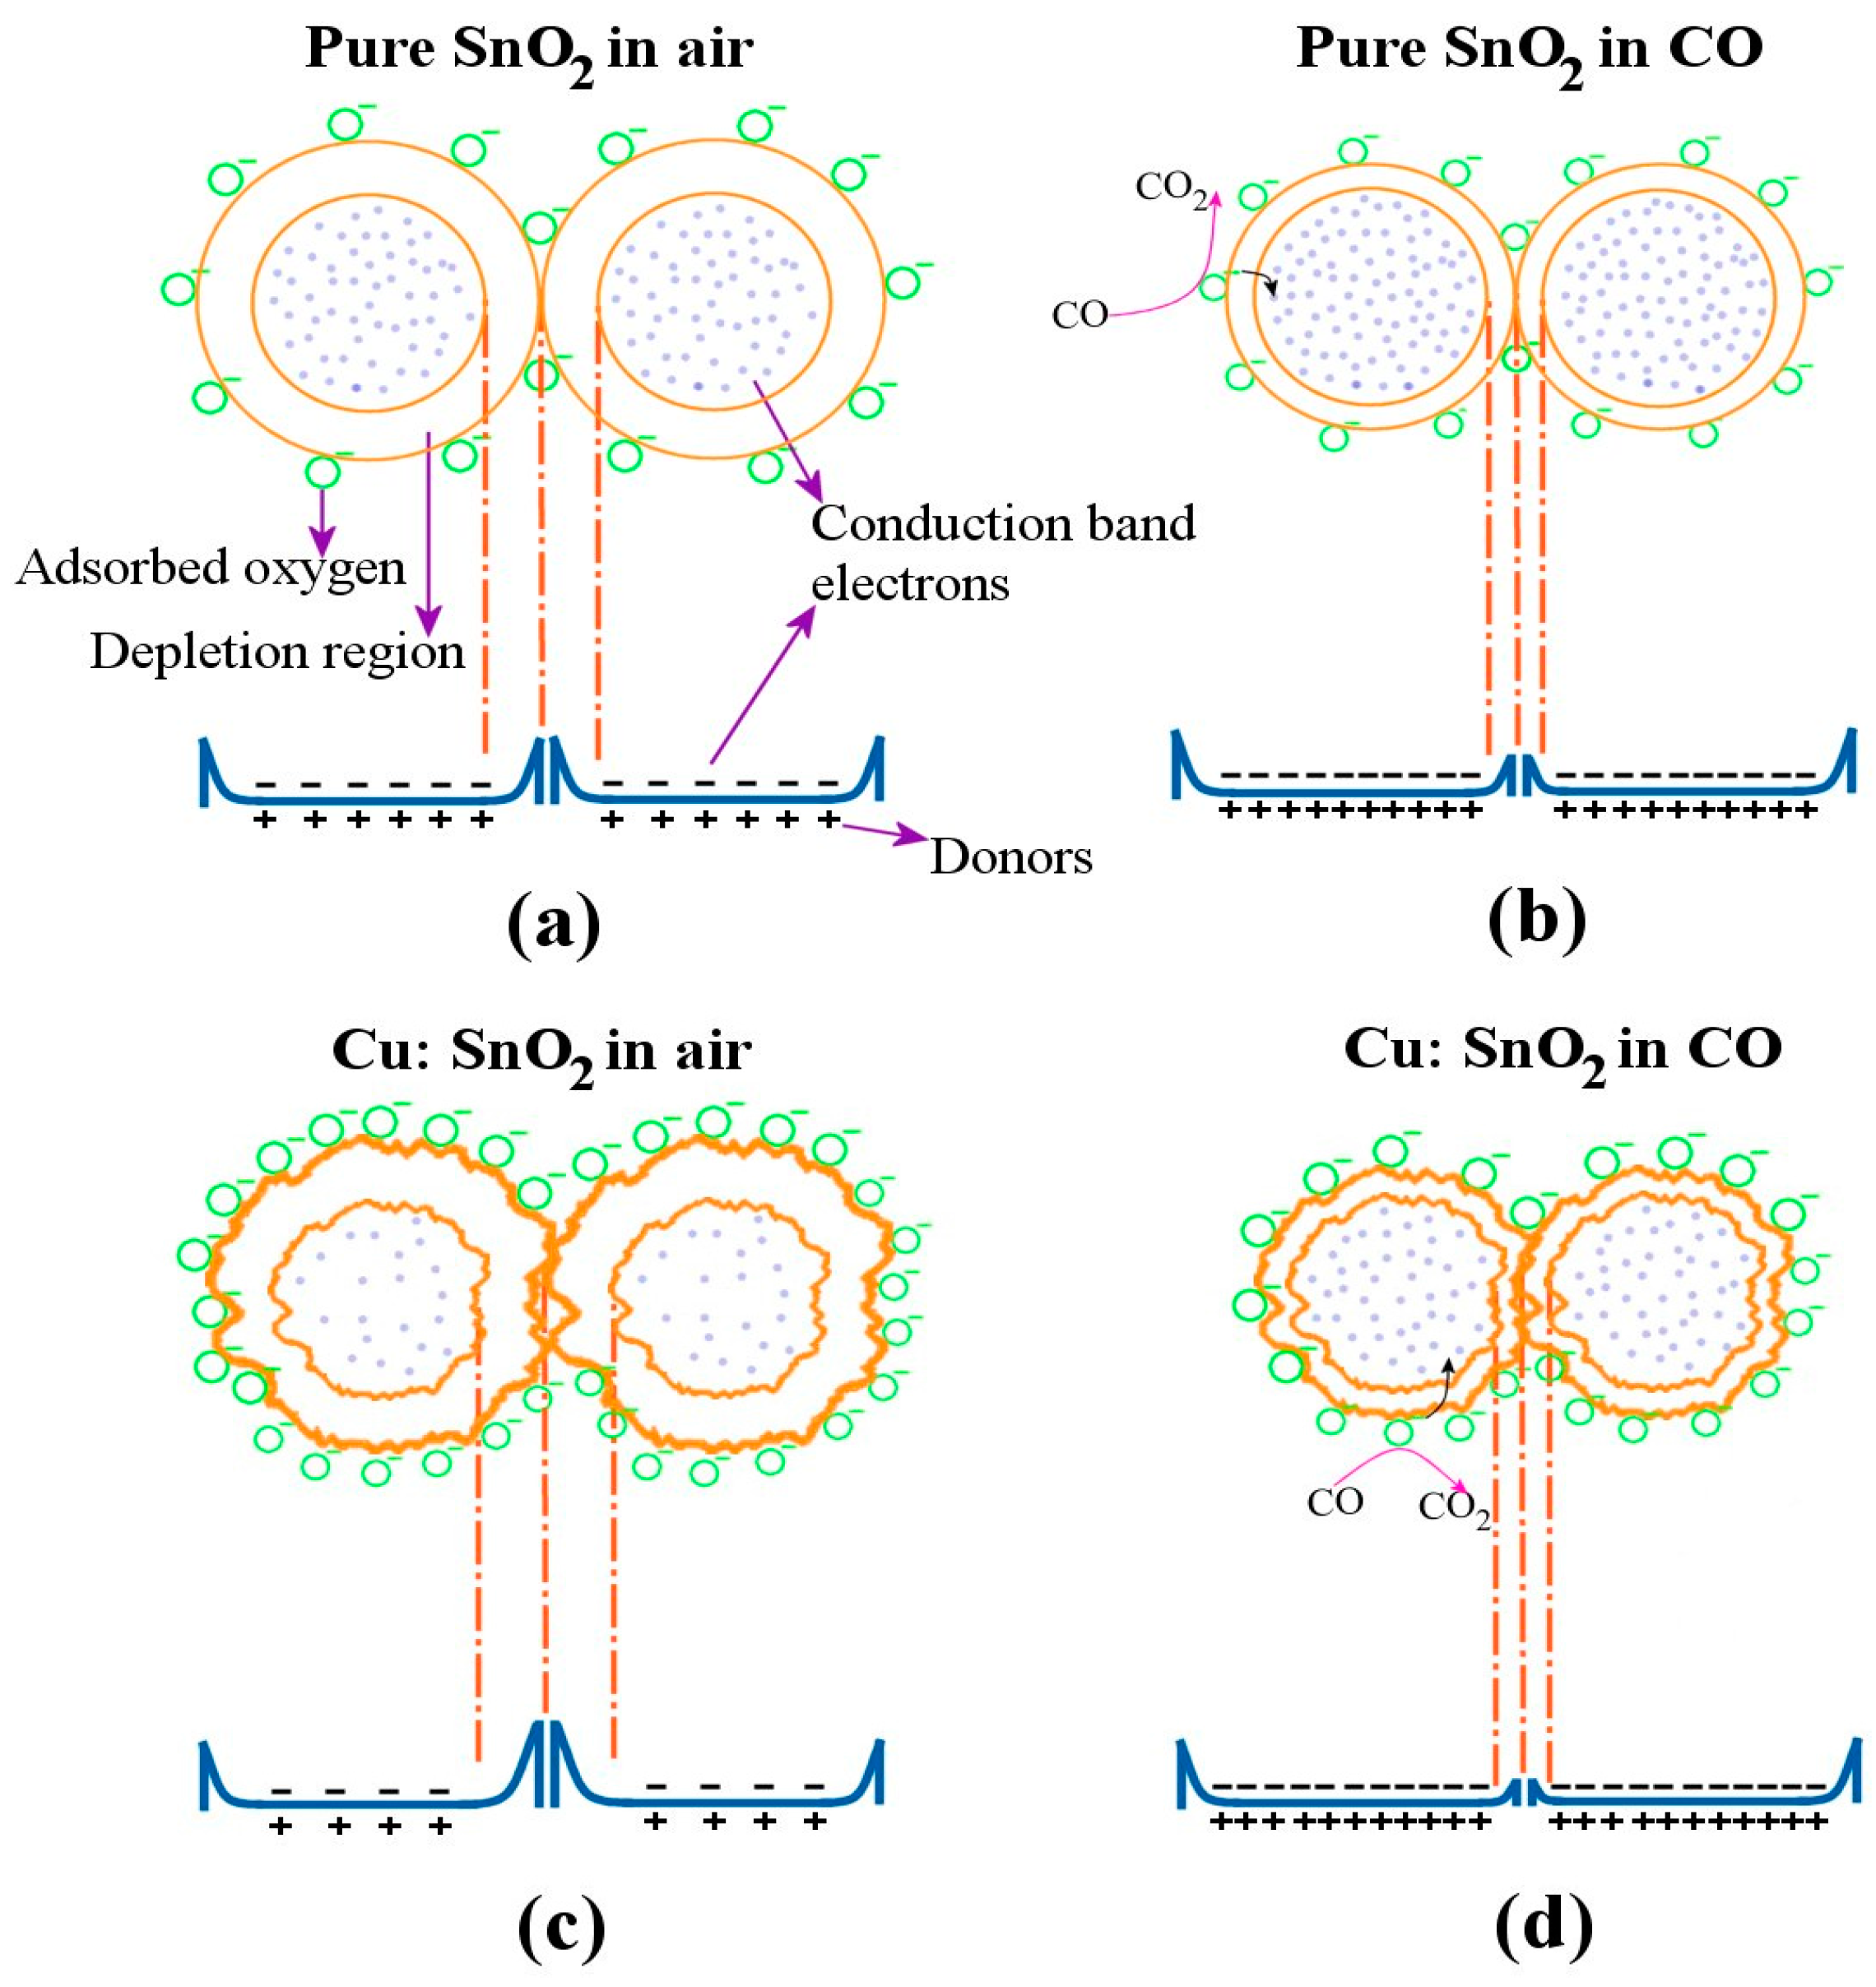
4.6. Gas Sensing Properties
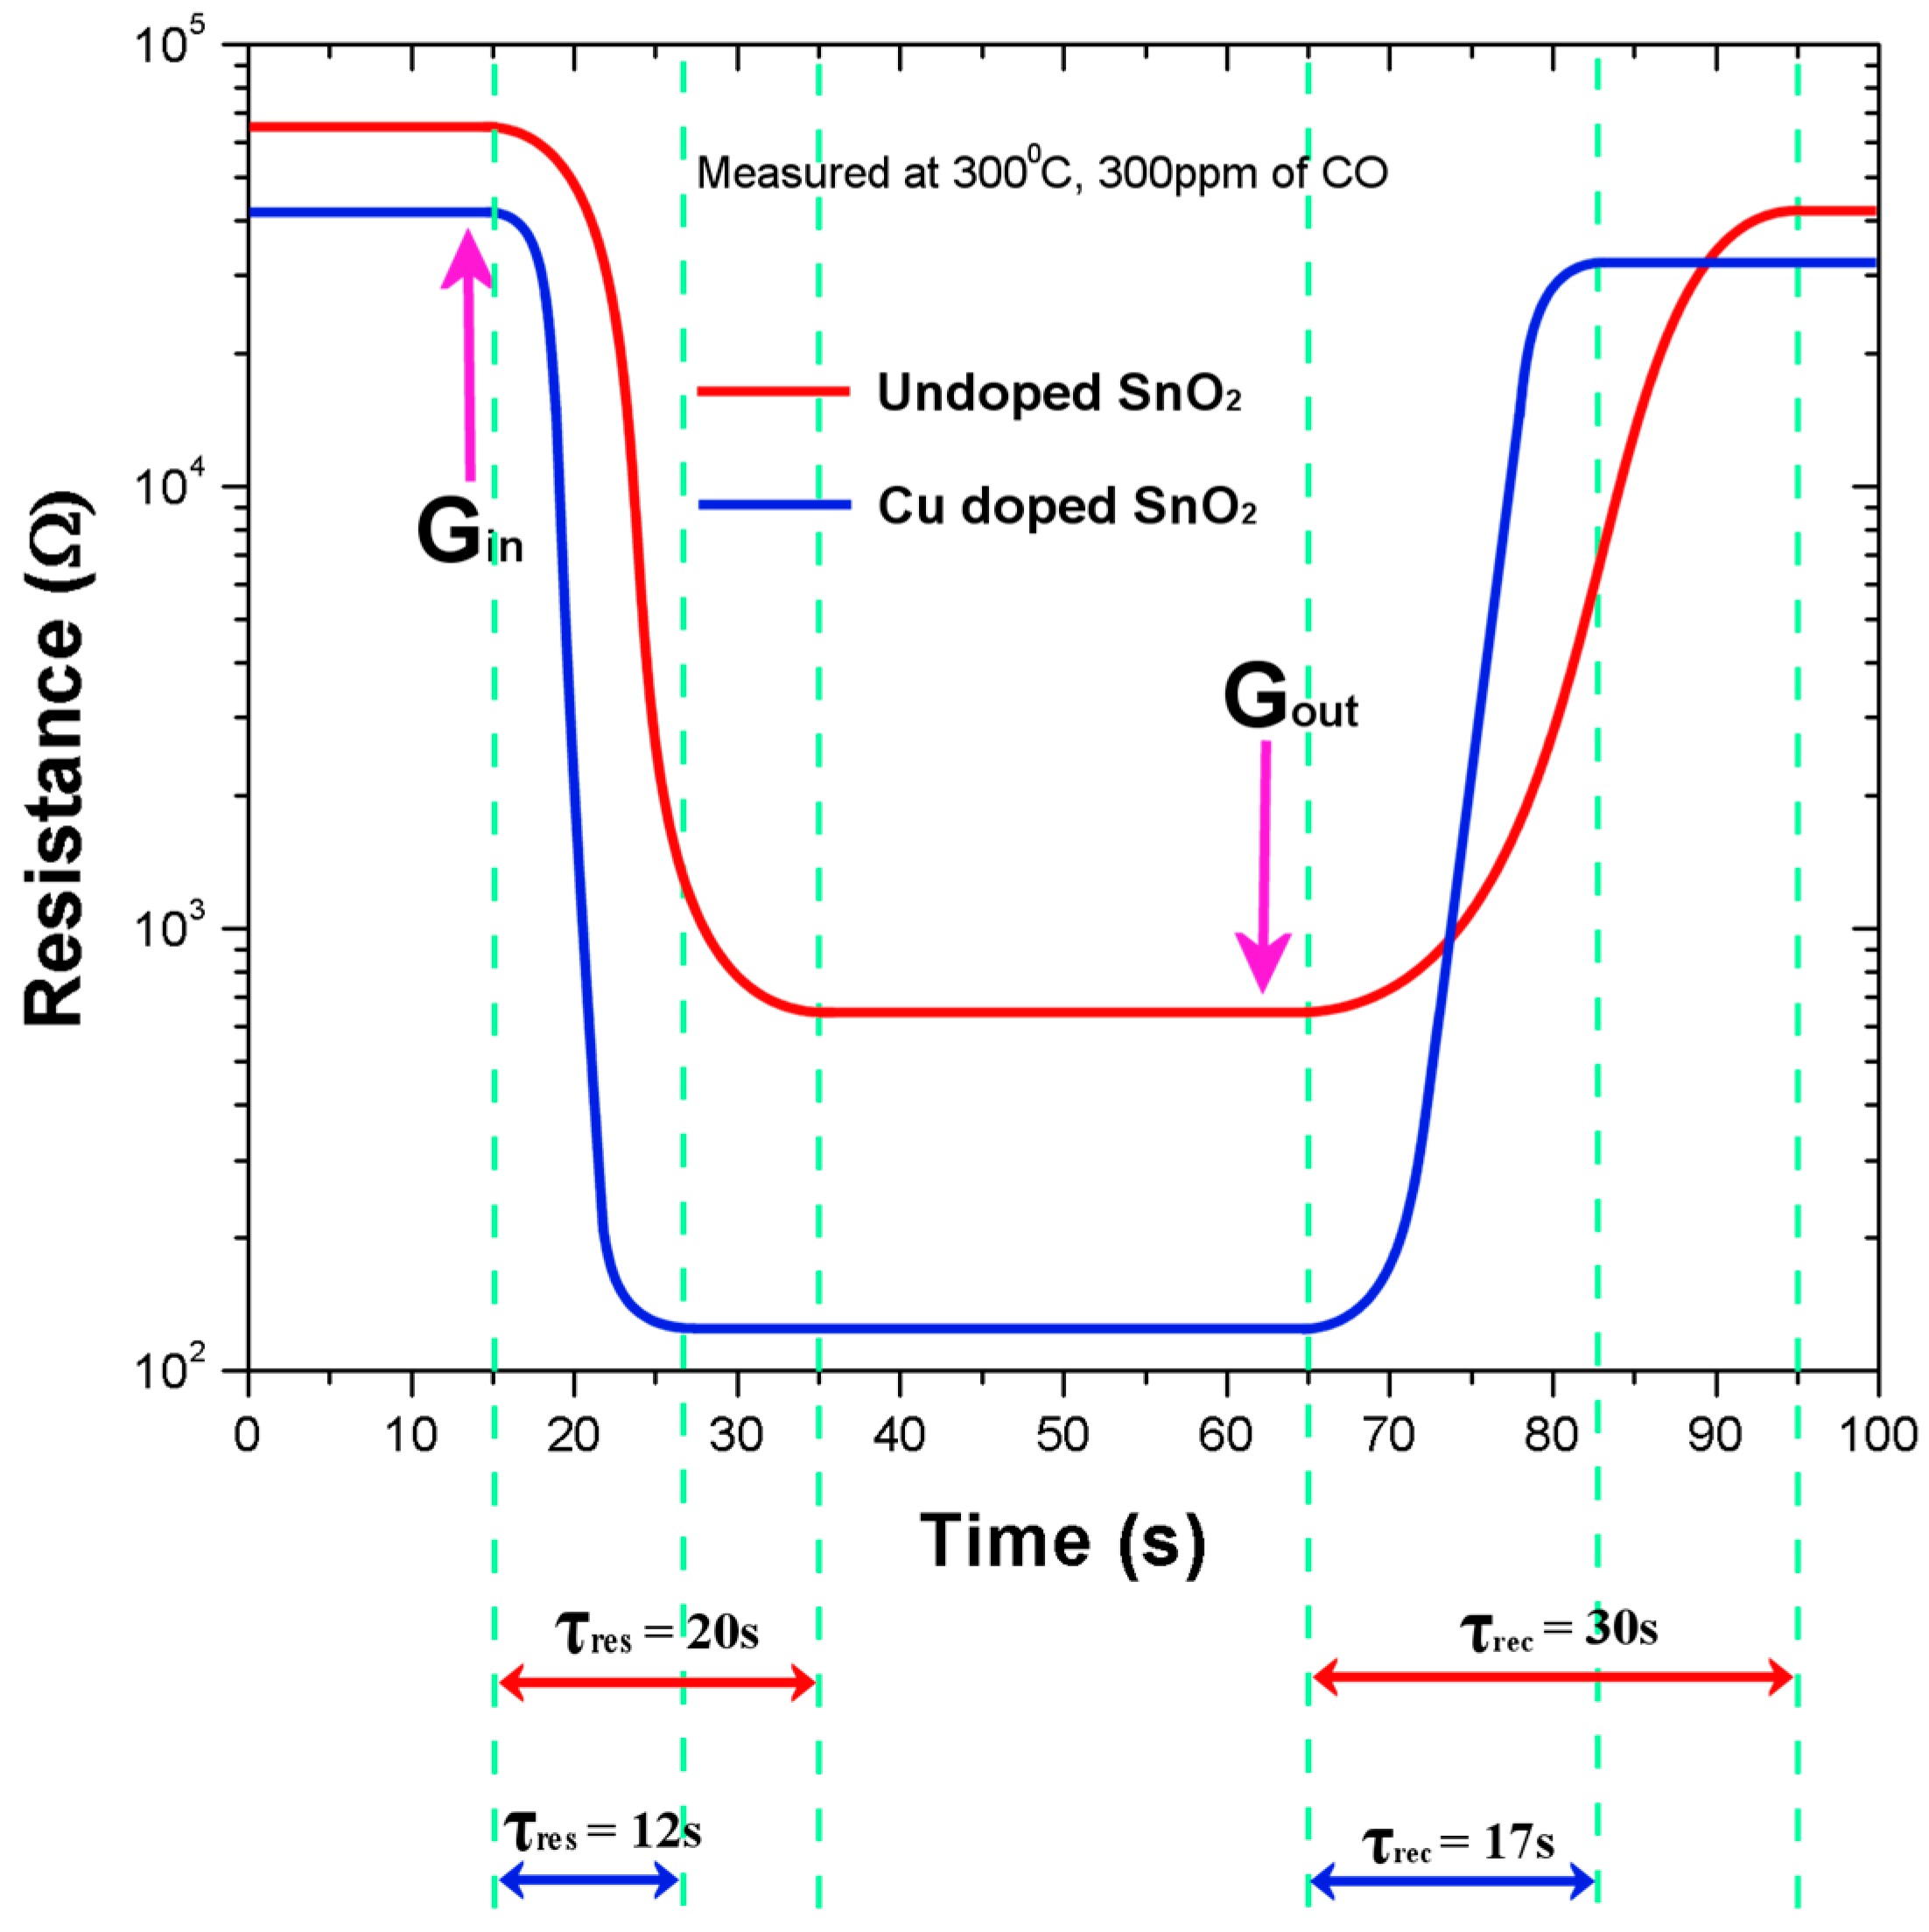
4.7. Response and Recovery Times
5. Conclusions
Author Contributions
Conflicts of Interest
References
- Luiz, O. Advice and Guidance on Carbon Monoxide (CO), and the Prevention, Diagnosis and Treatment of CO Poisoning; Publications Gateway Number: 2015496; Public Health England: London, UK, 2009. [Google Scholar]
- Wang, C.; Yin, L.; Zhang, L.; Xiang, D.; Gao, R. Metal Oxide Gas Sensors: Sensitivity and Influencing Factors. Sensors 2010, 10, 2088–2106. [Google Scholar] [CrossRef] [PubMed]
- Das, S.; Jayaraman, V. SnO2: A comprehensive review on structures and gas sensors. Prog. Mater. Sci. 2014, 66, 112–255. [Google Scholar] [CrossRef]
- Yamazoe, N. Toward innovations of gas sensor technology. Sens. Actuators B Chem. 2005, 108, 2–14. [Google Scholar] [CrossRef]
- Cirera, A.; Vilà, A.; Diéguez, A.; Cabot, A.; Cornet, A.; Morante, J.R. Microwave processing for the low cost, mass production of undoped and in situ catalytic doped nanosized SnO2 gas sensor powders. Sens. Actuators B Chem. 2000, 64, 65–69. [Google Scholar] [CrossRef]
- Cobianu, C.; Savaniu, C.; Buiu, O.; Dascalu, D.; Zaharescu, M.; Parlog, C.; Berg, A.V.D.; Pecz, B. Tin dioxide sol-gel derived thin films deposited on porous silicon. Sens. Actuators B Chem. 1997, 43, 114–120. [Google Scholar] [CrossRef]
- Song, K.C.; Kang, Y. Preparation of high surface area tin oxide powders by a homogeneous precipitation method. Mater. Lett. 2000, 42, 283–289. [Google Scholar] [CrossRef]
- Heiland, G. Homogeneous semiconducting gas sensors. Sens. Actuators B Chem. 1981, 2, 343–361. [Google Scholar] [CrossRef]
- Zhang, G.; Liu, M. Effect of particle size and dopant on properties of SnO2-based gas sensors. Sens. Actuators B Chem. 2000, 69, 144–152. [Google Scholar] [CrossRef]
- Fliegel, W.; Behr, G.; Werner, J.; Krabbes, G. Preparation, development of microstructure, electrical and gas-sensitive properties of pure and doped SnO2 powders. Sens. Actuators B Chem. 1994, 19, 474–477. [Google Scholar] [CrossRef]
- Fang, G.; Liu, Z.; Zhang, Z.; Hu, Y.; Ashur, I.A.; Yao, K.L. Preparation of SnO2-CuO nanocrystalline powders in two different ways by the sol-gel method. Phys. Status Solidi A 1996, 156, 15–22. [Google Scholar] [CrossRef]
- Korotcenkov, G. Practical aspects in design of one-electrode semiconductor gas sensors: Status report. Sens. Actuators B Chem. 2007, 121, 664–678. [Google Scholar] [CrossRef]
- Haines, J.; Léger, J.M. X-ray diffraction study of the phase transitions and structural evolution of tin dioxide at high pressure: Relationships between structure types and implications for other rutile-type dioxides. Phys. Rev. B 1997, 55, 11144–11154. [Google Scholar] [CrossRef]
- Giri, P.K.; Bhattacharyya, S.; Singh, D.K.; Kesavamoorthy, R.; Panigrahi, B.K.; Nair, K.G.M. Correlation between microstructure and optical properties of ZnO nanoparticles synthesized by ball milling. J. Appl. Phys. 2007, 102, 093515-1–093515-8. [Google Scholar] [CrossRef]
- Cullity, B.D.; Stock, S.R. Elements of X-ray Diffraction, 3rd ed.; Prentice Hall Inc.: Upper Saddle River, NJ, USA, 2001. [Google Scholar]
- Barret, C.S.; Massalski, F.B. Structure of Metals; Pergamon Press: Oxford, UK, 1980. [Google Scholar]
- Weaver, M.L.; Stevenson, M.E. Introduction to the Mechanical Behavior of Nonmetallic Materials—Heat Treating Society. In ASM Handbook; Heat Treating Society: Materials Park, OH, USA, 2015. [Google Scholar]
- Matsuura, Y.; Takahata, K. Stabilization of SnO2 sintered gas sensors. Sens. Actuators B Chem. 1991, 5, 205–209. [Google Scholar] [CrossRef]
- Zhang, Y.; Li, J.; Zhang, M.; Dionysiou, D. Size-tunable hydrothermal synthesis of SnS2 nanocrystals with high performance in visible light-driven photocatalytic reduction of aqueous Cr(VI). Environ. Sci. Technol. 2011, 45, 9324–9331. [Google Scholar] [CrossRef] [PubMed]
- Larciprete, R.; Borsella, E.; De Padova, P.; Perfetti, P.; Faglia, G.; Sberveglieri, G. Organotin films deposited by laser-induced CVD as active layers in chemical gas sensors. Thin Solid Films 1998, 323, 291–295. [Google Scholar] [CrossRef]
- Kwoka, M.; Ottaviano, L.; Passacantando, M.; Santucci, S.; Czempik, G.; Szuber, J. XPS study of the surface chemistry of L-CVD SnO2 thin films after oxidation. Thin Solid Films 2005, 490, 36–42. [Google Scholar] [CrossRef]
- Habraken, F.H.P.M.; Kieffer, E.P.; Bootsma, G.A. Study of the kinetics of the interactions of O2 and N2O with a Cu(111) surface and of the reaction of CO with adsorbed oxygen using aes, LEED and ellipsometry. Surf. Sci. 1979, 83, 45–59. [Google Scholar] [CrossRef]
- Batzill, M.; Katsiev, K.; Diebold, U. Surface morphologies of SnO2. Surf Sci. 2003, 529, 295–311. [Google Scholar] [CrossRef]
- Zheng, J.G. Dislocations in nanocrystalline SnO2 thin films. Philos. Mag. Lett. 1996, 73, 93–100. [Google Scholar] [CrossRef]
- Brinzari, V.; Korotcenkov, G.; Schwank, J.; Boris, Y. Chemisorptional approach to kinetic analysis of SnO2:Pd-based thin film gas sensors. J. Optoelectron. Adv. Mater. 2002, 4, 147–150. [Google Scholar]
- Gong, J.; Chen, Q.; Lian, M.R.; Liu, N.C.; Stevenson, R.G.; Adami, F. Micro-machined Nanocrystalline Silver Doped SnO2 H2S sensor. Sens. Actuators B Chem. 2006, 114, 32–39. [Google Scholar] [CrossRef]
- Chang, B.W.; Ding, S.J.; Chen, R.L.C. A sensing properties study on miniature Au/SnO2 gas sensor for hydrogen sulfide detection. In Nanotech 2012; Nano Science and Technology Institute: Danville, CA, USA, 2012; Chapter 1; Volume 3, pp. 25–28. [Google Scholar]
- Gao, F.; Qin, G.; Li, Y.; Jiang, Q.; Luo, L.; Zhao, K.; Liuc, Y.; Zhao, H. One-pot synthesis of La-doped SnO2 layered nanoarrays with an enhanced gas-sensing performance toward acetone. RSC Adv. 2016, 6, 10298–10310. [Google Scholar] [CrossRef]
- Wollenstein, J.; Bottner, H.; Jaegle, M.; Becker, W.J.; Wagner, E. Material properties and the influence of metallic catalysis at the surface of highly dense SnO2 films. Sens. Actuators B Chem. 2000, 70, 196–202. [Google Scholar] [CrossRef]


| SnO2 Type | a (nm) | c (nm) | D (nm) | V (10−24 cm3) | P (%) | TC (101) |
|---|---|---|---|---|---|---|
| Pure | 0.4749 | 0.3185 | 26.27 | 71.40 | 32.30 | 0.921 |
| Cu incorporated | 0.4756 | 0.3192 | 26.32 | 71.66 | 58.35 | 0.136 |
| SnO2 Pellet | Maximum Sensitivity | Response Time (s) | Recovery Time (s) |
|---|---|---|---|
| Pure SnO2 | 102.8 | 18 | 27 |
| Cu:SnO2 | 348.4 | 10.8 | 15.3 |
© 2016 by the authors; licensee MDPI, Basel, Switzerland. This article is an open access article distributed under the terms and conditions of the Creative Commons Attribution (CC-BY) license (http://creativecommons.org/licenses/by/4.0/).
Share and Cite
Karthik, T.V.K.; Olvera, M.D.l.L.; Maldonado, A.; Gómez Pozos, H. CO Gas Sensing Properties of Pure and Cu-Incorporated SnO2 Nanoparticles: A Study of Cu-Induced Modifications. Sensors 2016, 16, 1283. https://doi.org/10.3390/s16081283
Karthik TVK, Olvera MDlL, Maldonado A, Gómez Pozos H. CO Gas Sensing Properties of Pure and Cu-Incorporated SnO2 Nanoparticles: A Study of Cu-Induced Modifications. Sensors. 2016; 16(8):1283. https://doi.org/10.3390/s16081283
Chicago/Turabian StyleKarthik, Tangirala Venkata Krishna, María De la Luz Olvera, Arturo Maldonado, and Heberto Gómez Pozos. 2016. "CO Gas Sensing Properties of Pure and Cu-Incorporated SnO2 Nanoparticles: A Study of Cu-Induced Modifications" Sensors 16, no. 8: 1283. https://doi.org/10.3390/s16081283
APA StyleKarthik, T. V. K., Olvera, M. D. l. L., Maldonado, A., & Gómez Pozos, H. (2016). CO Gas Sensing Properties of Pure and Cu-Incorporated SnO2 Nanoparticles: A Study of Cu-Induced Modifications. Sensors, 16(8), 1283. https://doi.org/10.3390/s16081283