An Improved Simulated Annealing Technique for Enhanced Mobility in Smart Cities
Abstract
:1. Introduction
- A large portion of the previous or current vehicle routing algorithms attempt to identify the minimum TD or TT. Generally, they cannot attain an active trade-off.
- Utilizing just individual traffic information or a single cost function for the vehicle routing problem is not satisfactory. Different navigation criteria should be considered to find the optimal path of the driver. This will help drivers to have different navigation options, which can be the fastest route, the least congested, the least fuel consumption and the least air pollution.
2. Related Work
- ISATOPSIS allows transition from a good solution to a worse solution under a strict condition. This allows the algorithm to find the global optimal solution and avoid becoming stuck in local optimal solutions.
- ISATOPSIS can work for dynamic path planning by collecting real-time traffic data from IoV and efficiently finding alternative routes for the driver.
- ISATOPSIS can optimize more than one criteria using the MADM TOPSIS method, which allows alternative routes to be judged on different criteria.
- ISATOPSIS periodically detects and avoids congestion by selecting the paths that have the minimum traffic, CO2 emissions, fuel consumption, as well as travel time. This is due to combining different navigation attributes in the cost function.
3. System Description
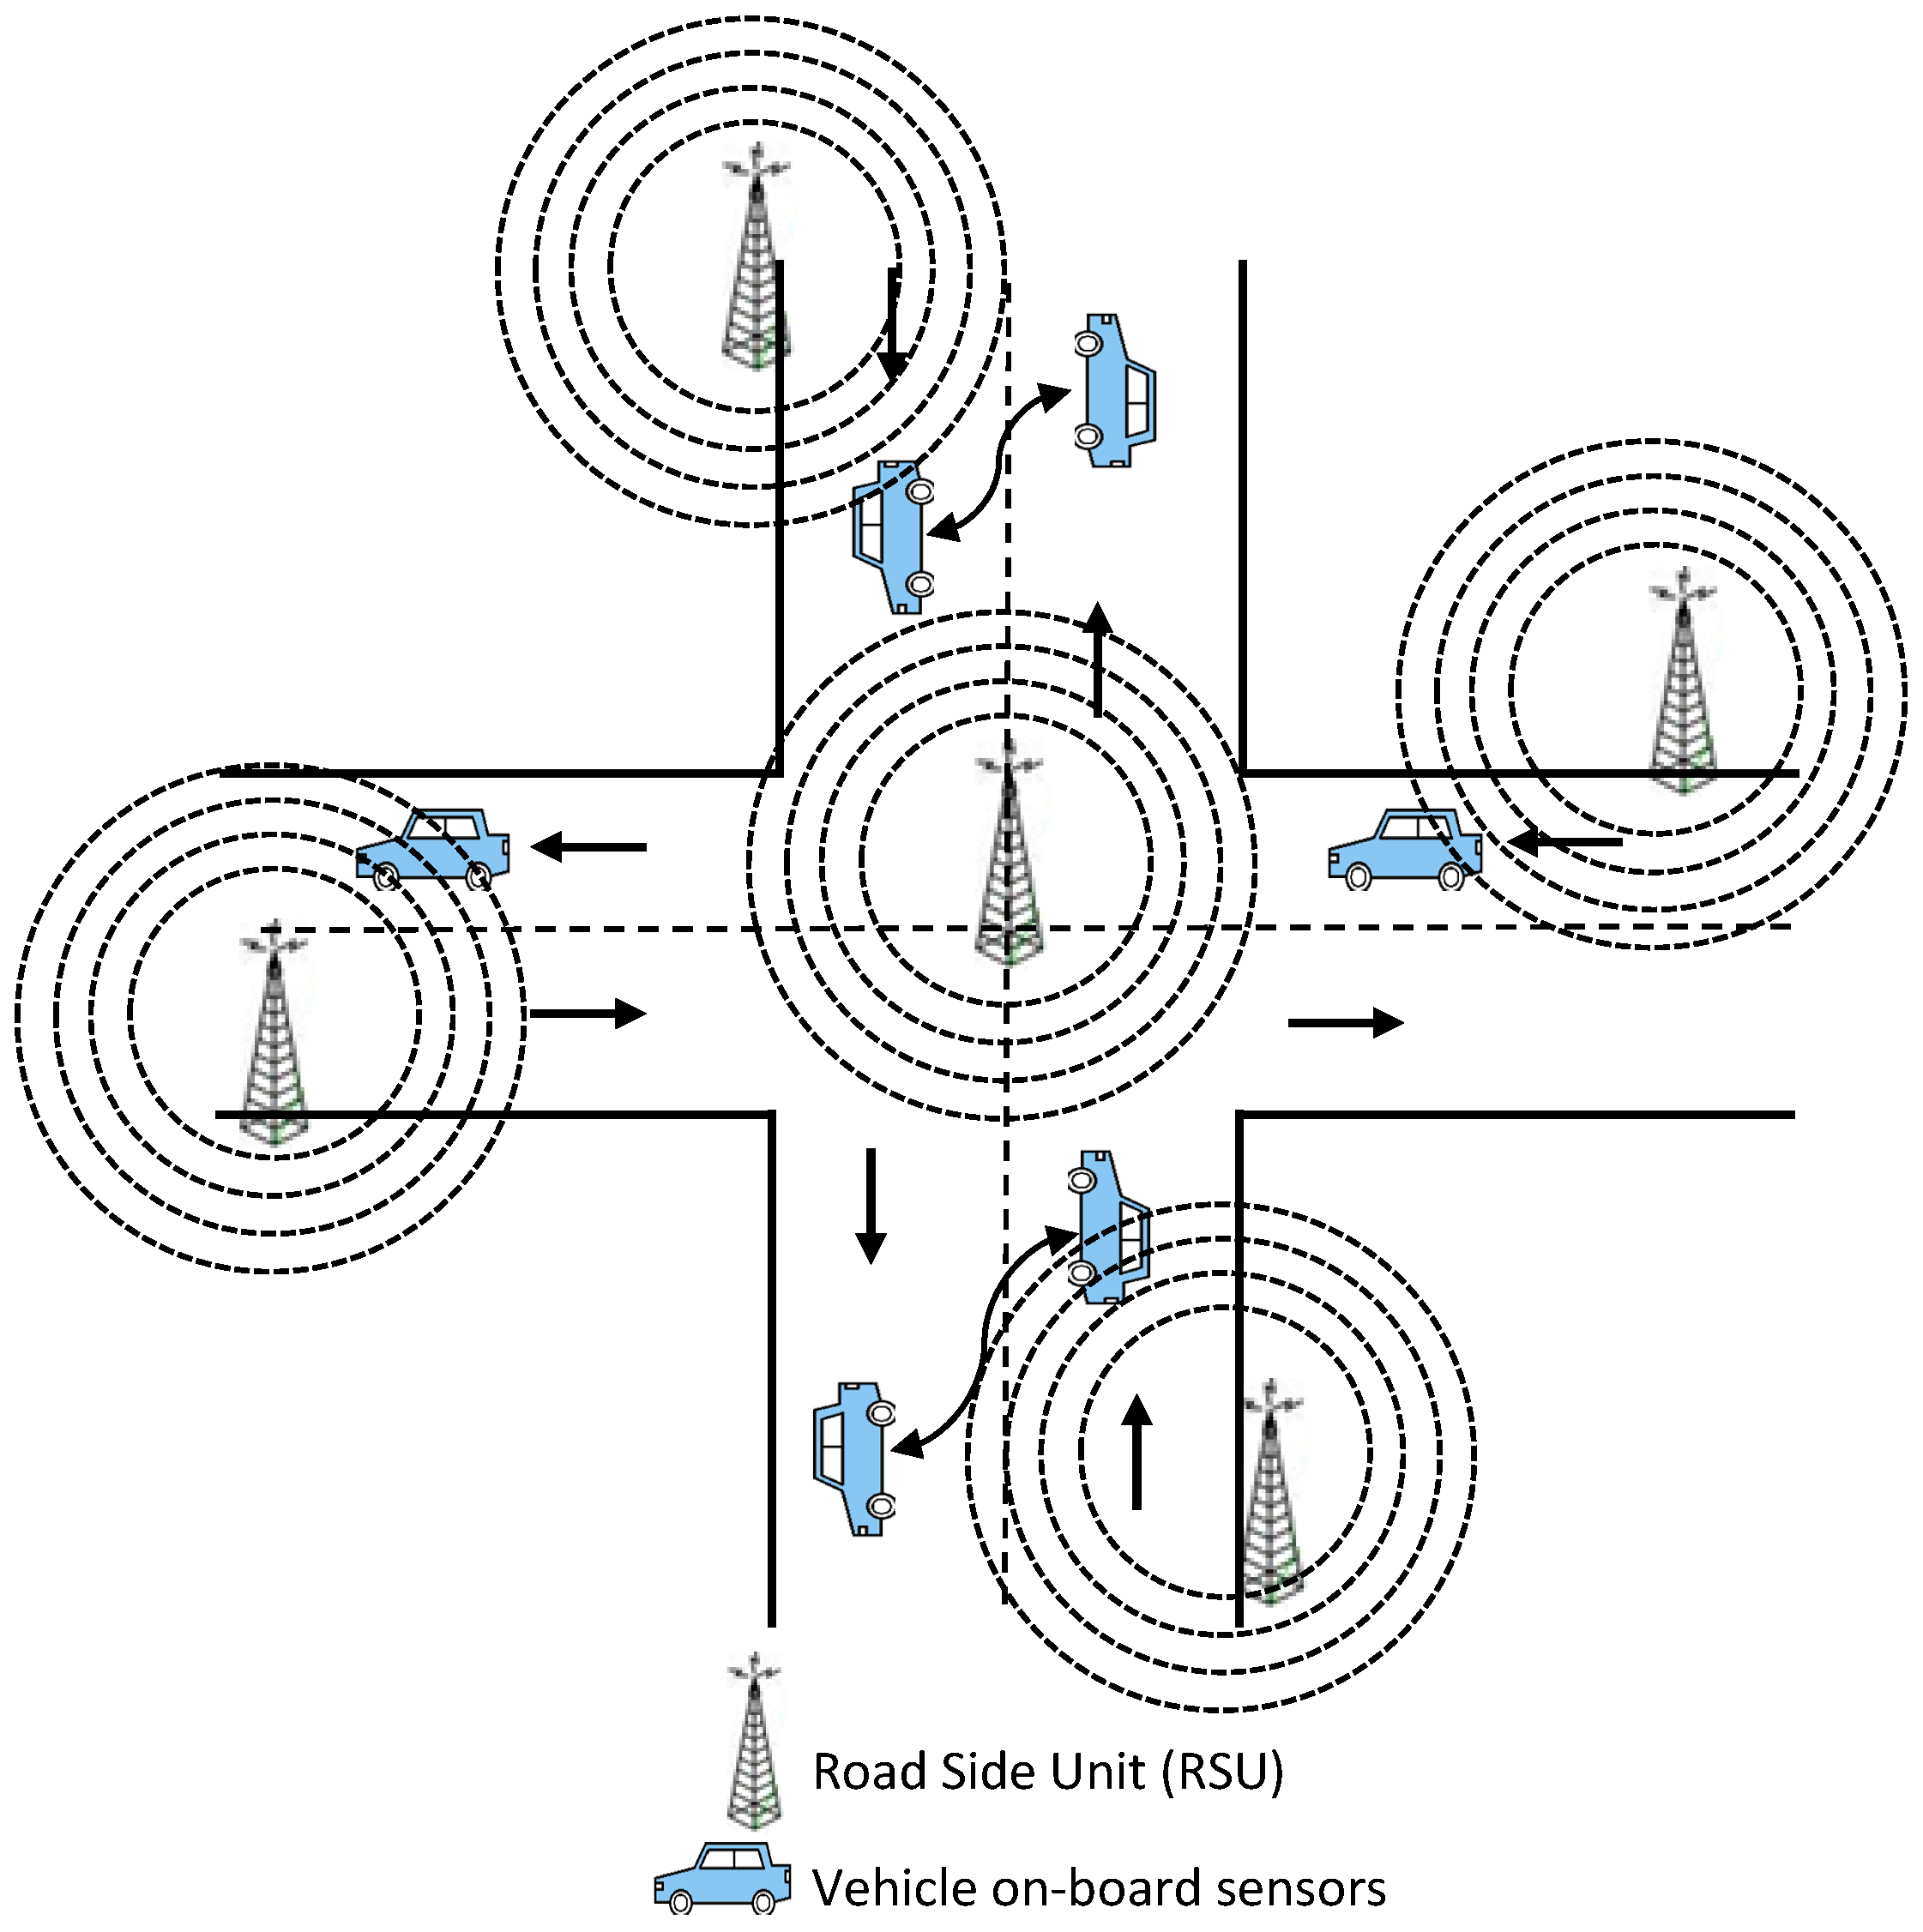
3.1. Data Dissemination
3.2. Road Network
- Road length represents the normalized length in a directed graph G for each alternative in A.
- Average velocity represents the normalized average speed of each vehicle at a certain period in A.
3.3. Simulated Annealing of SAWS and SATOPSIS
| Algorithm 1 The simulated annealing algorithm for enhancing mobility. | |
| 1: | Initial random solution |
| 2: | An initial temperature |
| 3: | α = Cooling rate |
| 4: | = Current best solution |
| 5: | ← |
| 6: | While where is the minimum temperature |
| 7: | Generate a random neighbour solution from |
| 8: | If |
| 9: | Move to |
| 10: | Accept change |
| 11: | Else If Then |
| 12: | Move to with transition probability |
| 13: | |
| 14: | Endif |
| 15: | |
| 16: | Endwhile (if ) |
| 17: | Return |
3.4. An Improved Simulated Annealing TOPSIS Algorithm
3.4.1. Off-Line Computation of Path Planning
- An initial optimal path where means the i-th road segment.
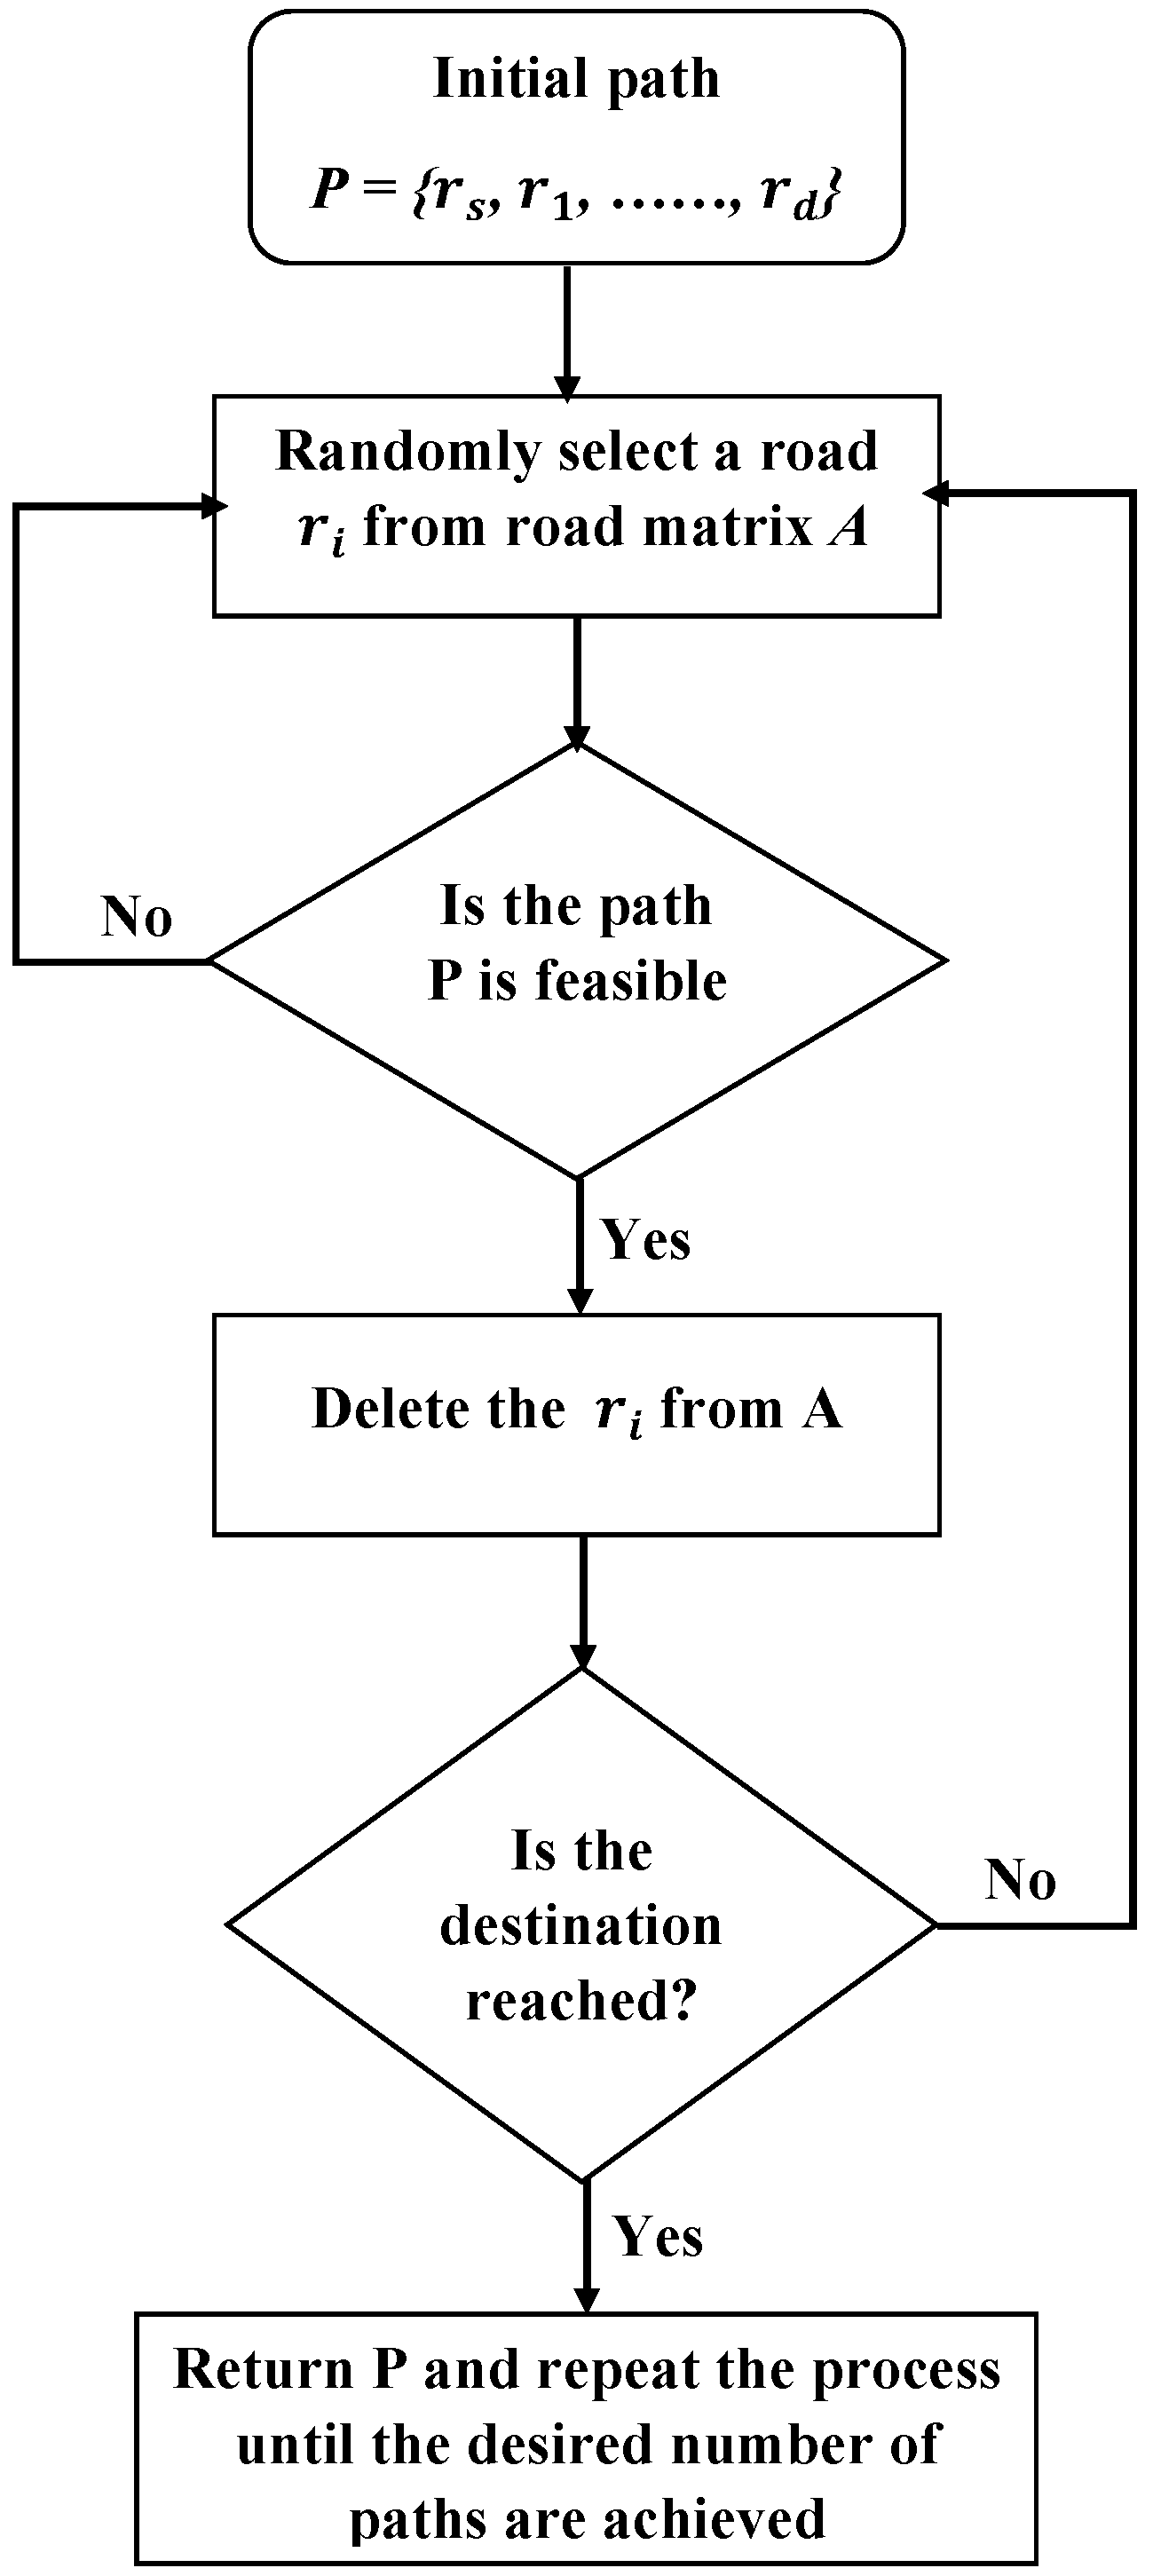
- The perturbation (see Figure 3) consists of the following three steps.
- (a)
- Two roads and , called base roads, are chosen randomly in the path.
- (b)
- A path is constructed, using as an origin and as a destination.
- (c)
- The path is replaced by (, , ⋯, ) to give a new path .
- Check the feasibility of the new path.
- If its not feasible, then repeat the process. Otherwise, use SA as in Algorithm 1 and compare the cost of the new path to the previous path.
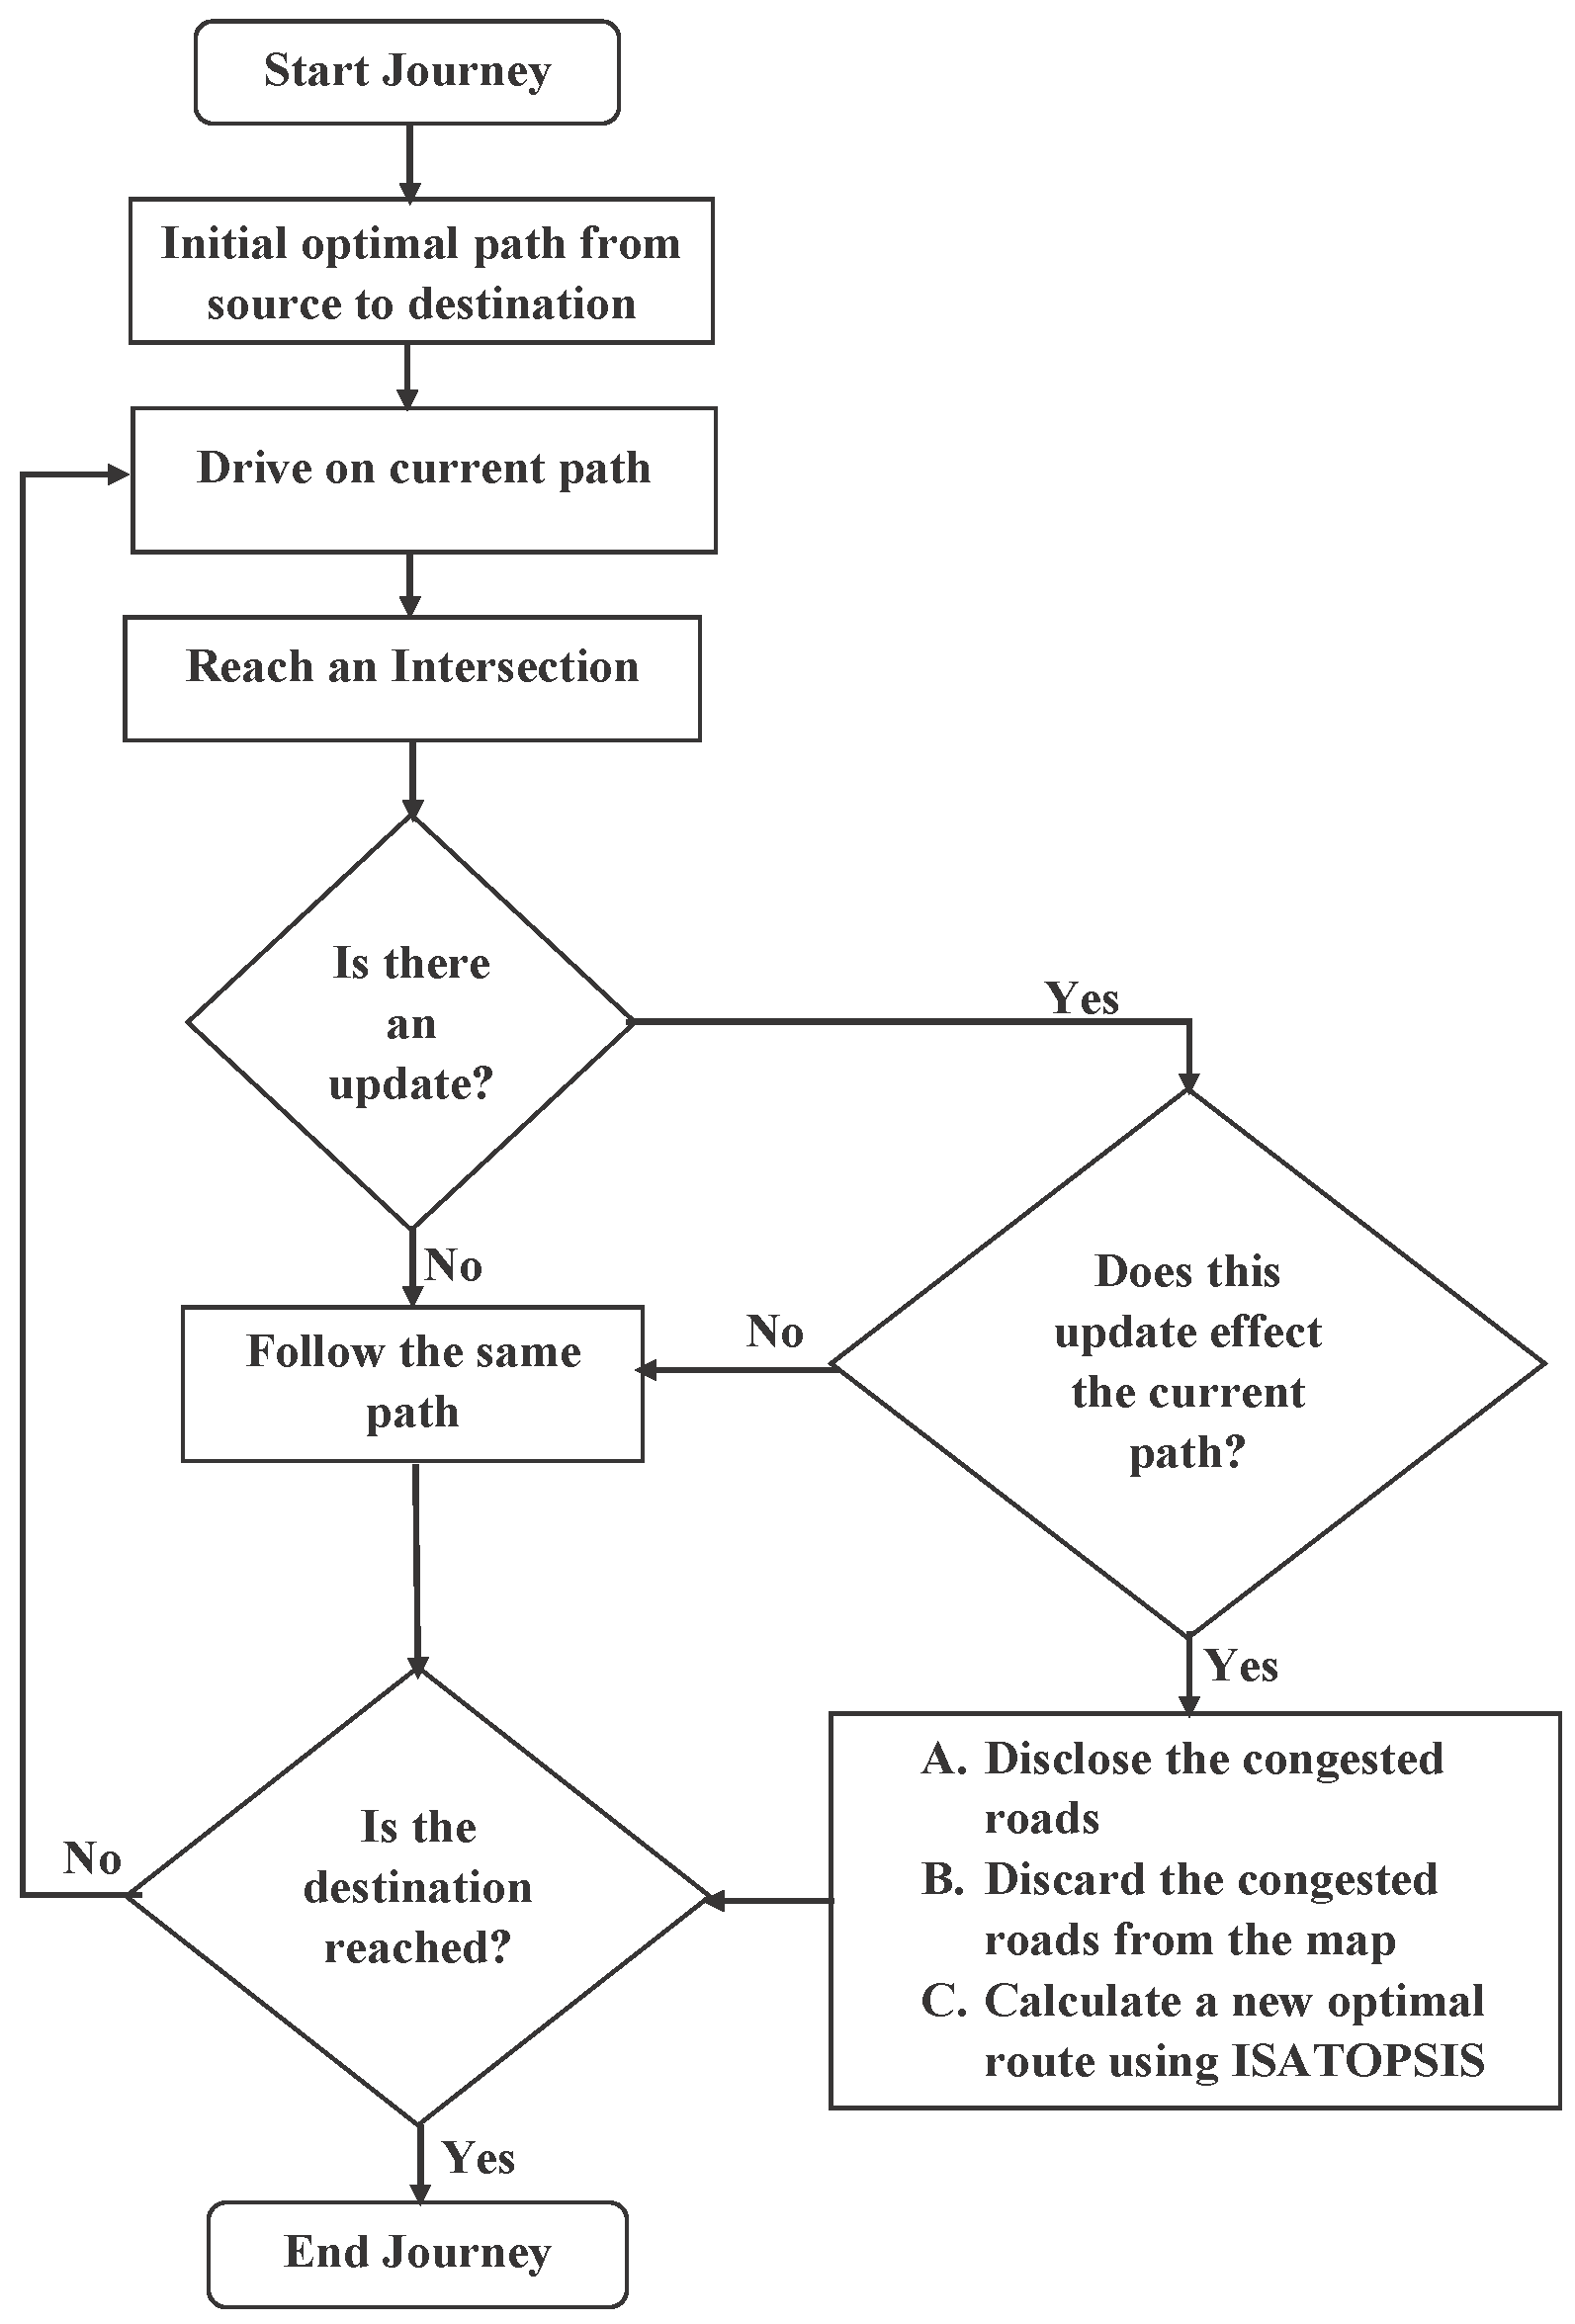
3.4.2. On-Line Computation of Path Planning
3.5. Calculate the Weights of SAWS, SATOPSIS and ISATOPSIS
3.6. Simulated Annealing Weighted Sum Method
3.7. TOPSIS Cost Function of SATOPSIS and ISATOPSIS
- Calculate the weighted normalized ratings by using the normalized matrix from Equations (1) and (2):
- Calculate the positive and negative ideal solutions (PIS and NIS), which are the maximum and the minimum values of the criterion (j) in and , respectively. We can formulate the normalized road matrix and obtain the positive and negative ideal solutions as follows:
- Calculate the separation ( and ) from PIS () and NIS () for the alternative paths as follows:
- Calculate the cost function of SA by finding the similarities to PIS using:
4. Performance Evaluation
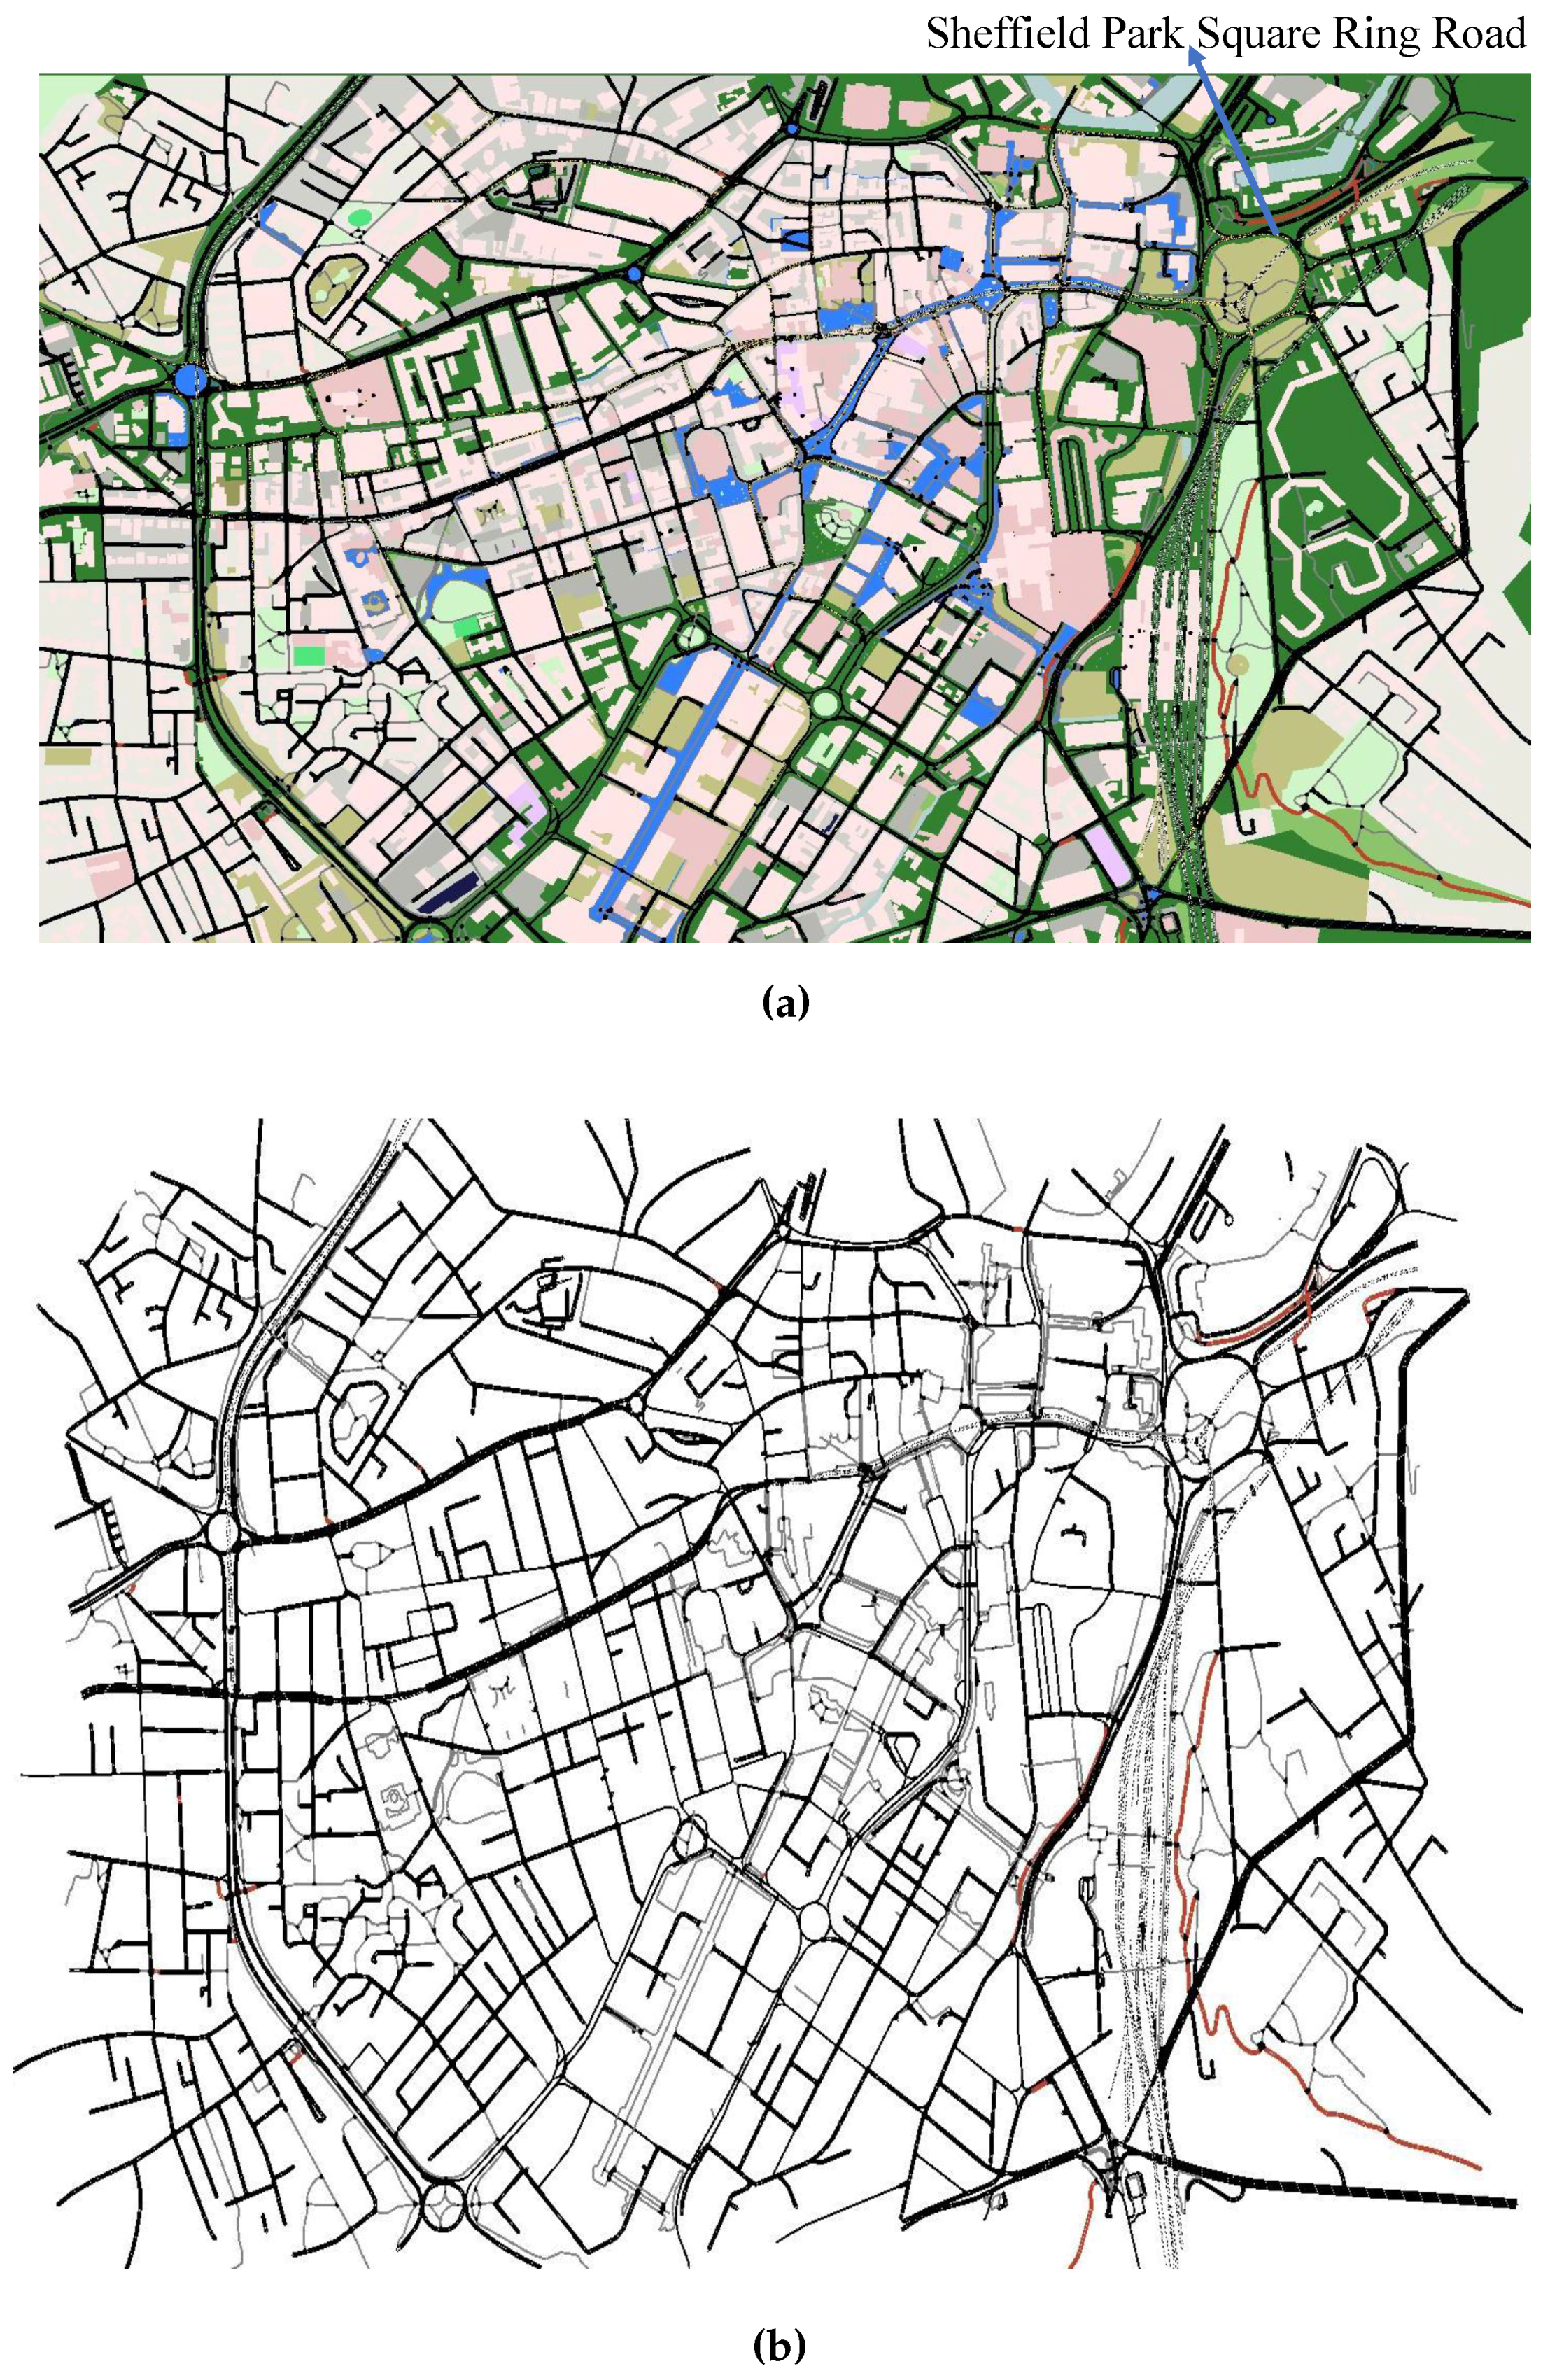
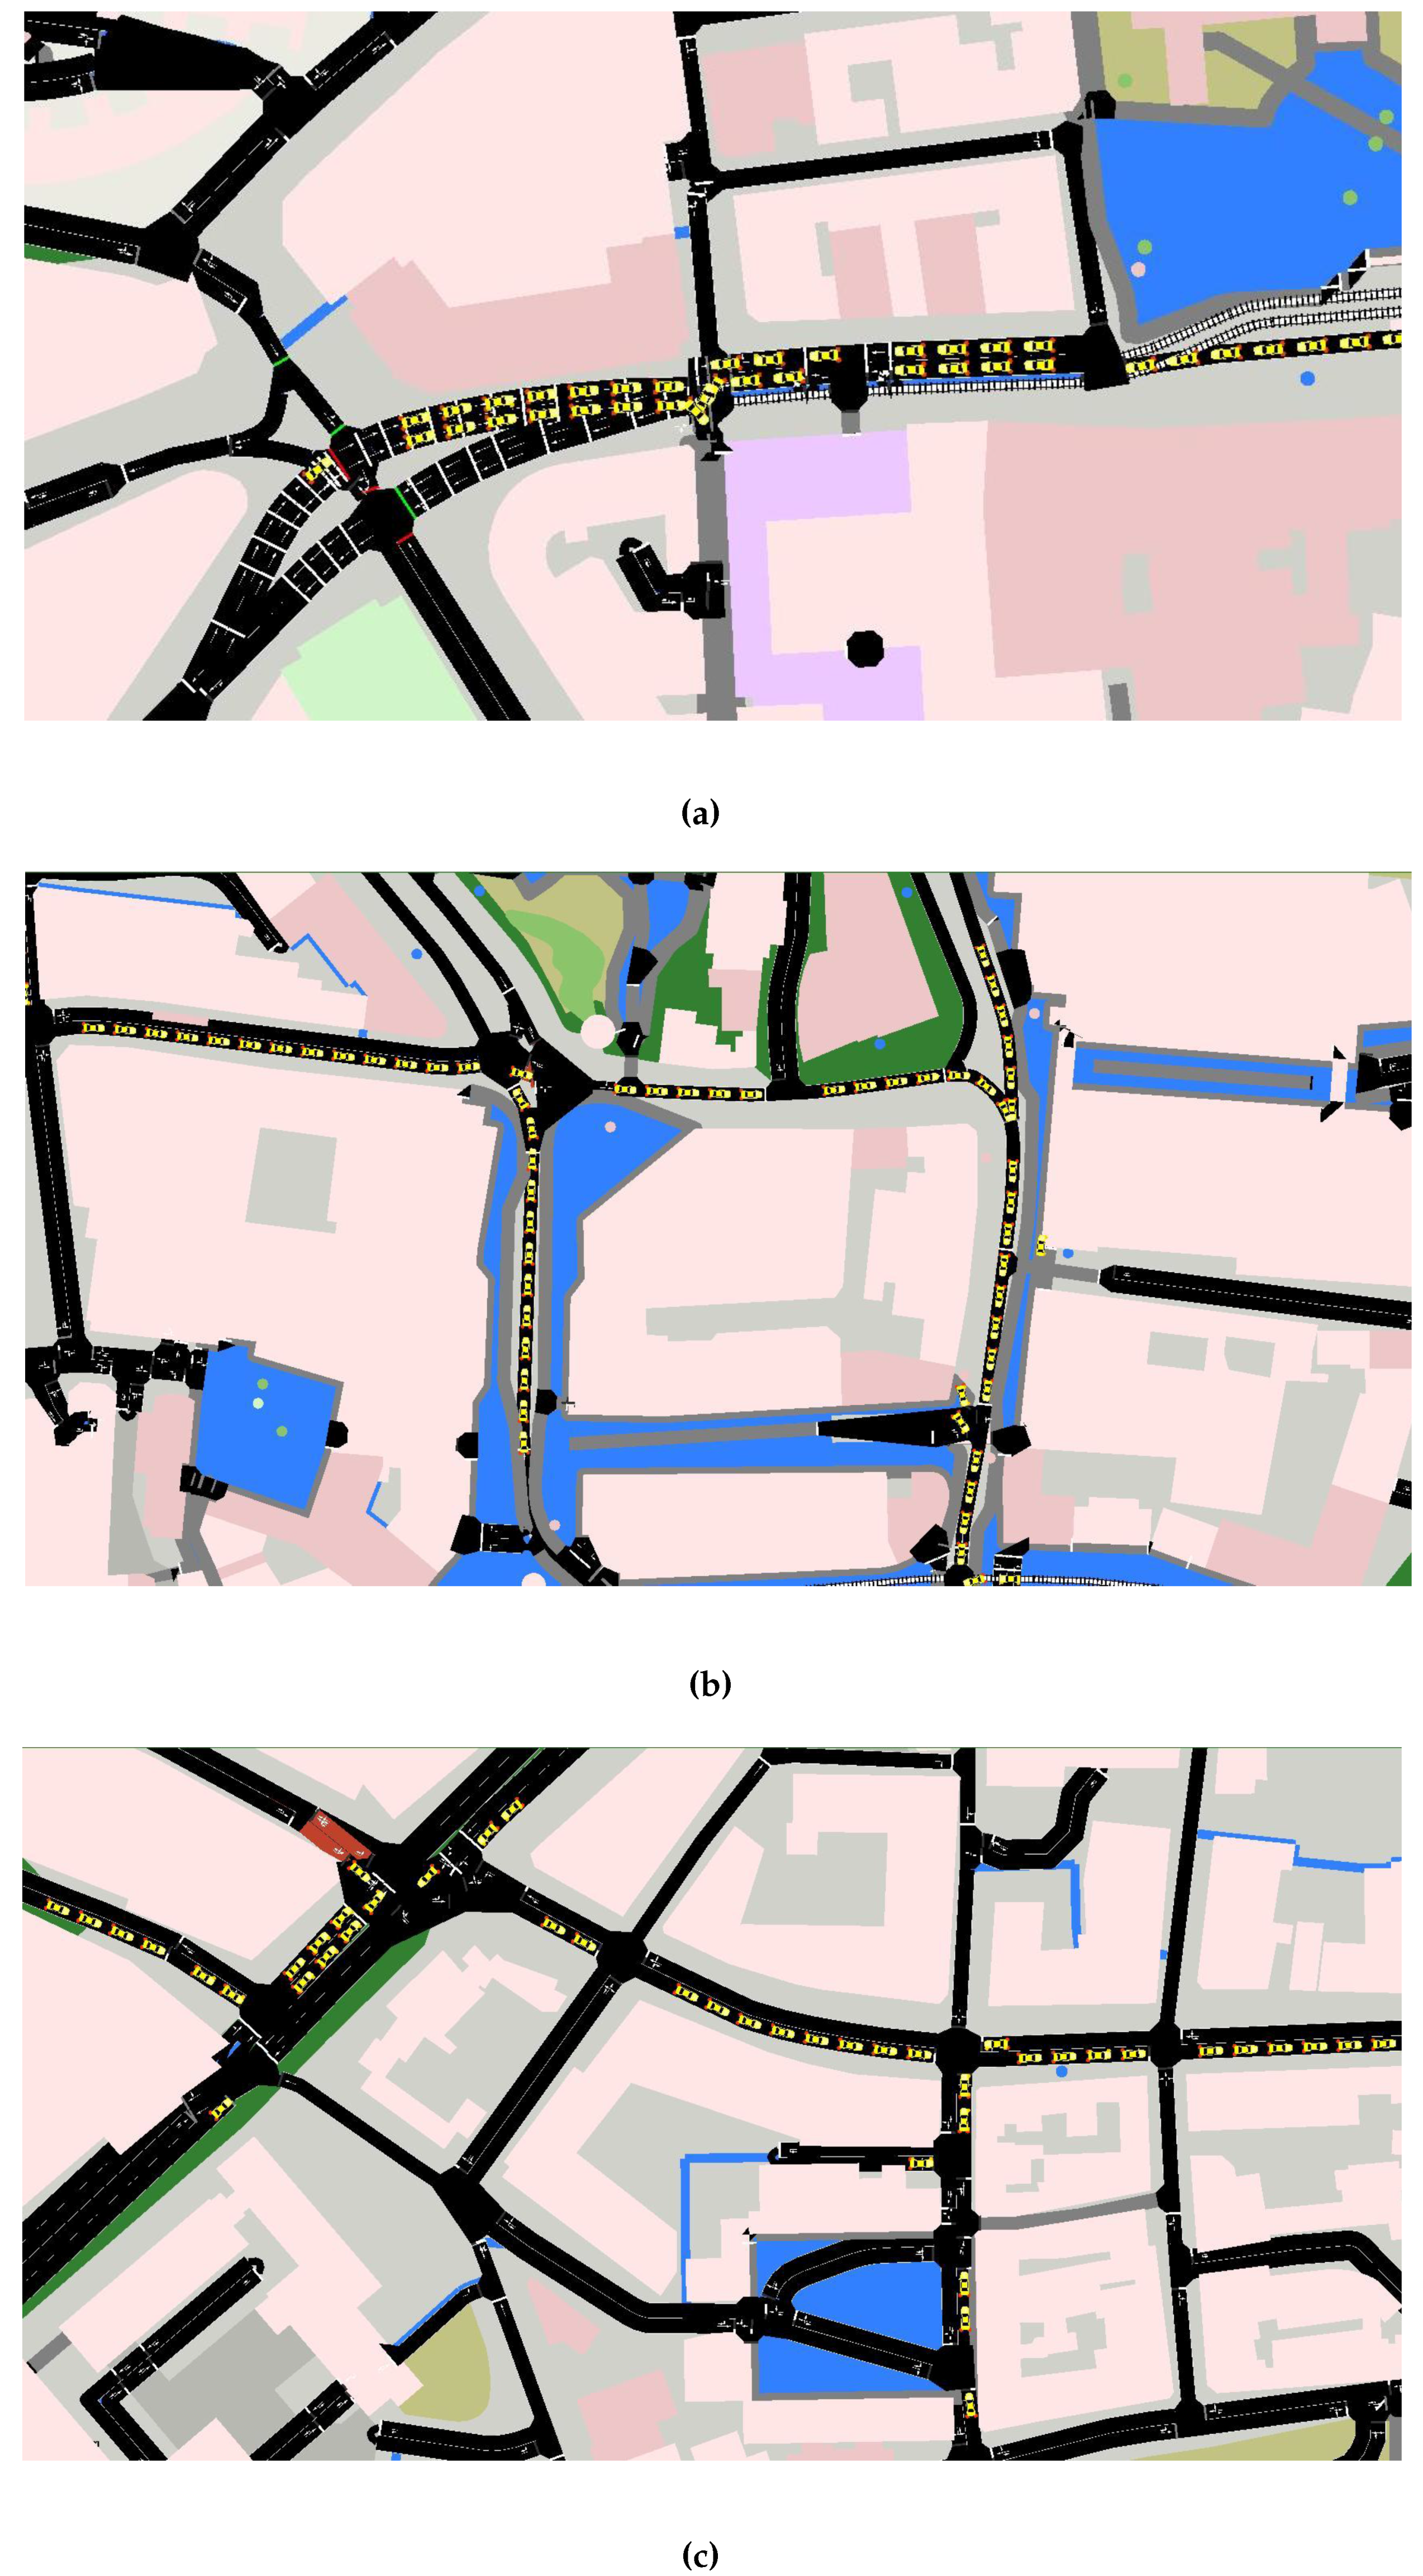
4.1. Scenario of Sheffield City
- A large initial temperature T allows for an exhaustive search, but leads to a large computation time. Reducing this initial value will reduce the computation time required at the expense of making it less likely that the globally optimal solution will be achieved.
- As the value of α controls the rate at which Tdecreases, a larger value gives a quicker decrease. This results in a shorter computation. However, this will also result in the algorithm running for fewer iterations, making it less likely to reach the truly optimal solution.
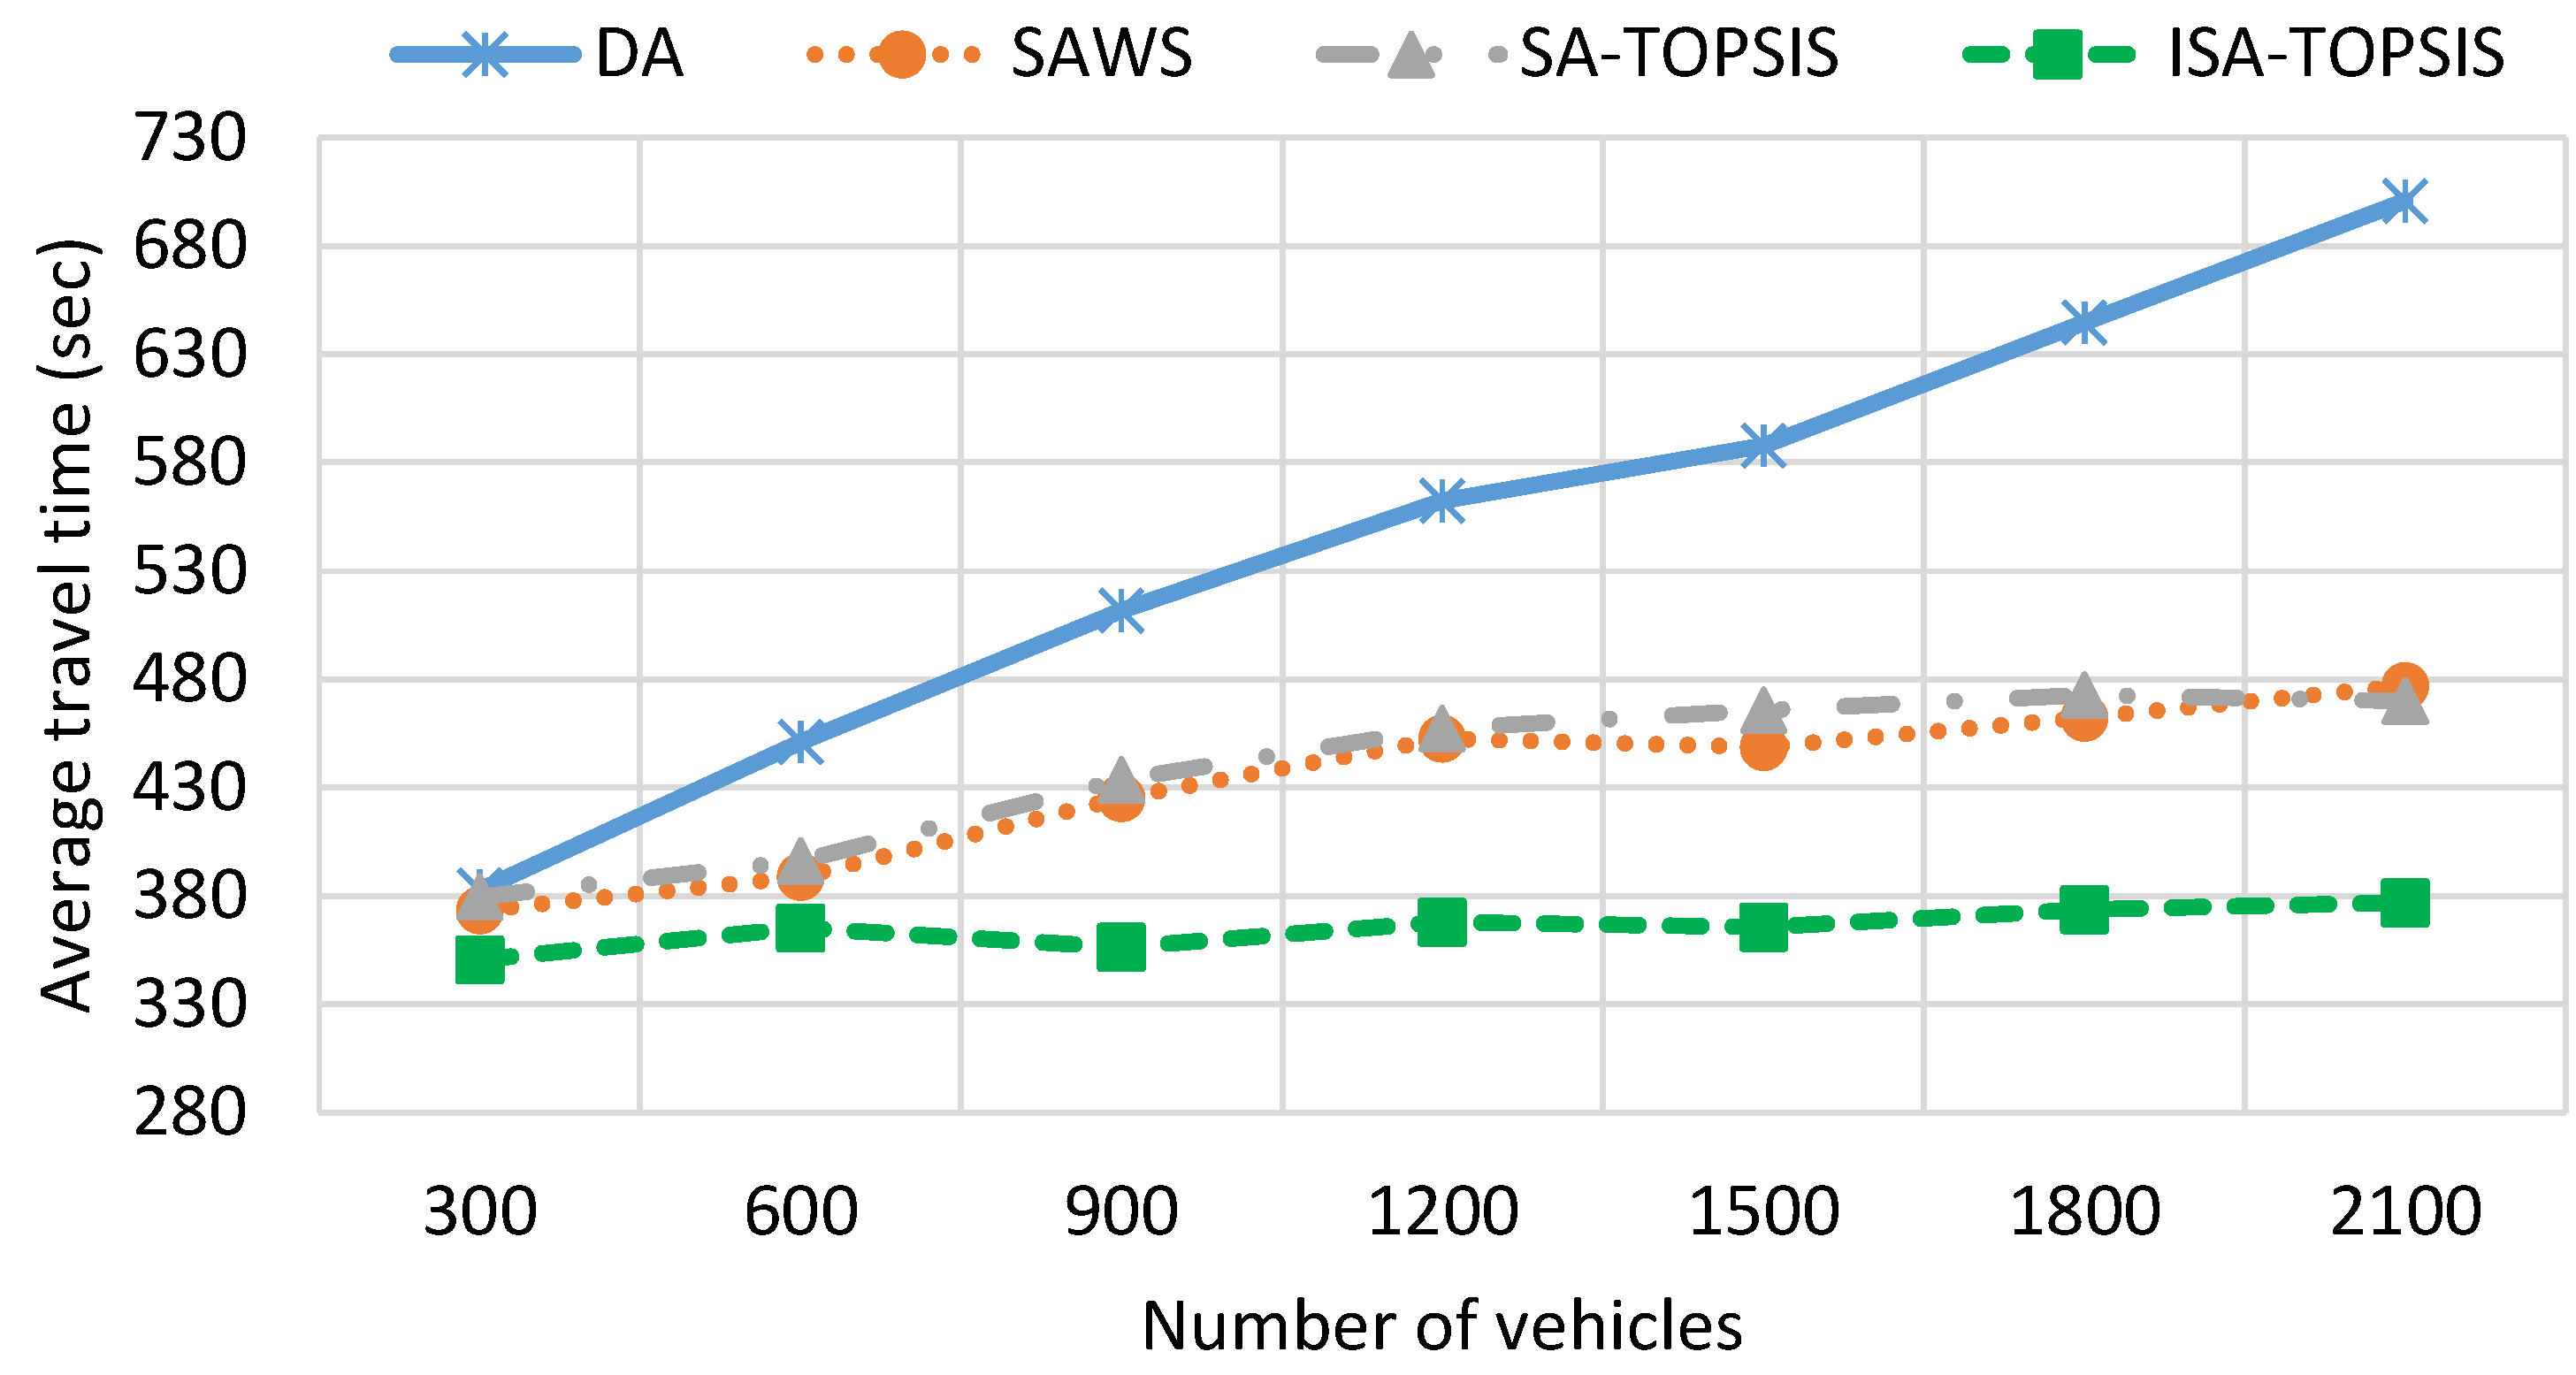
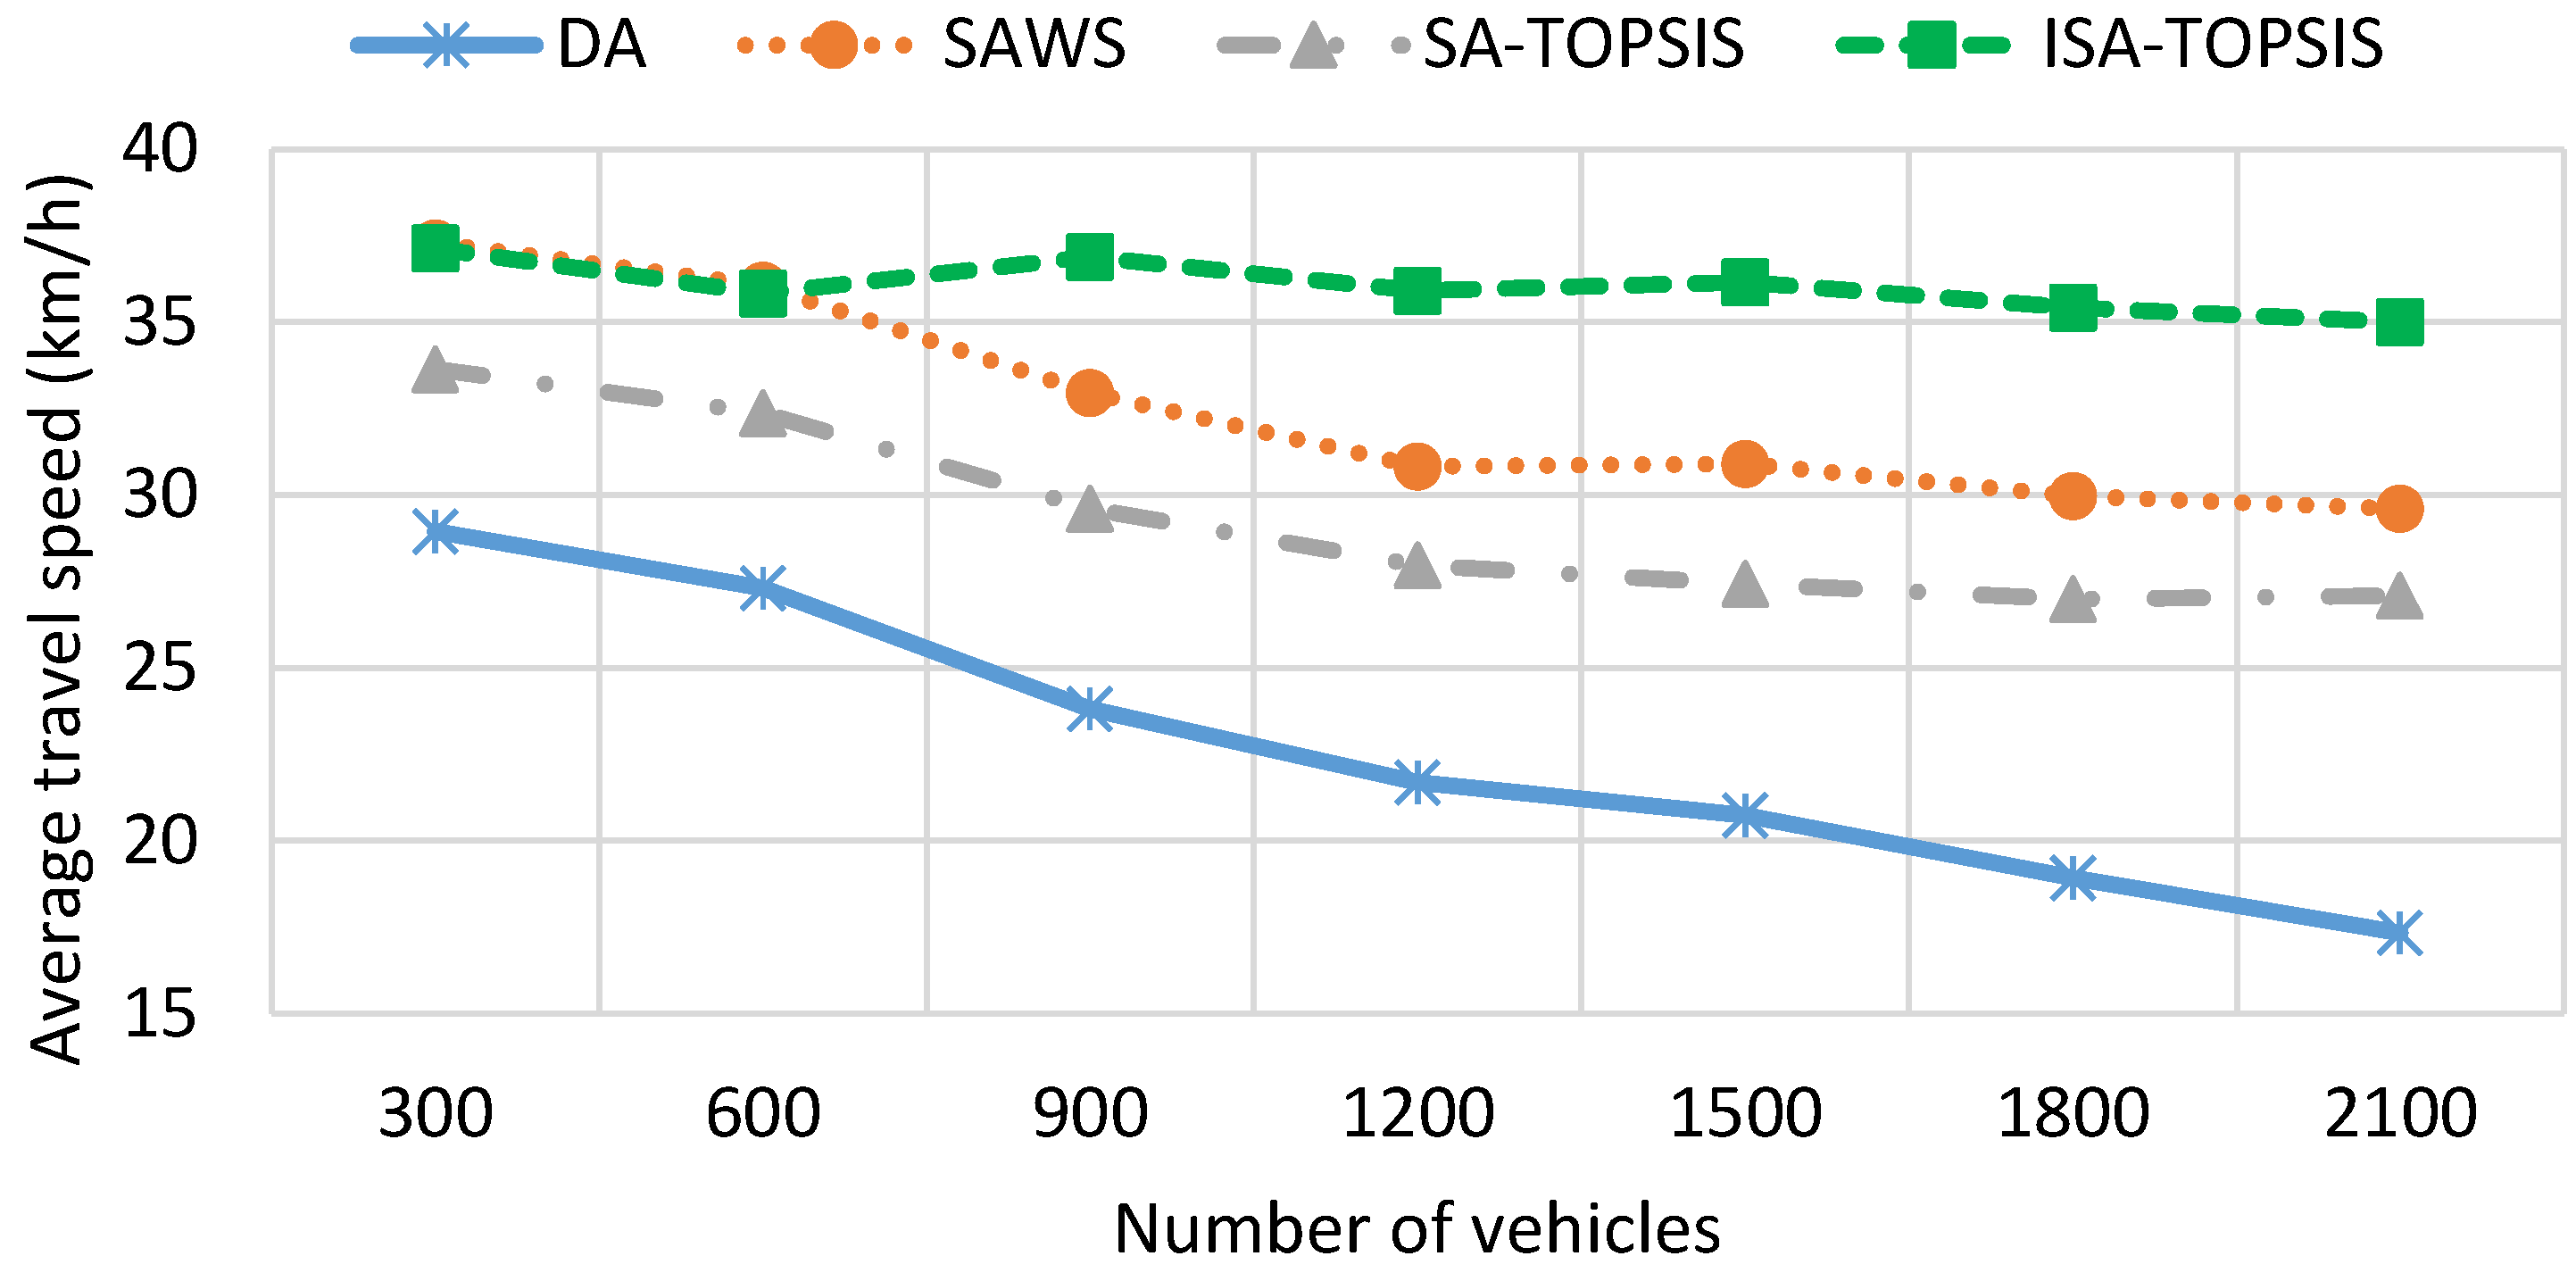
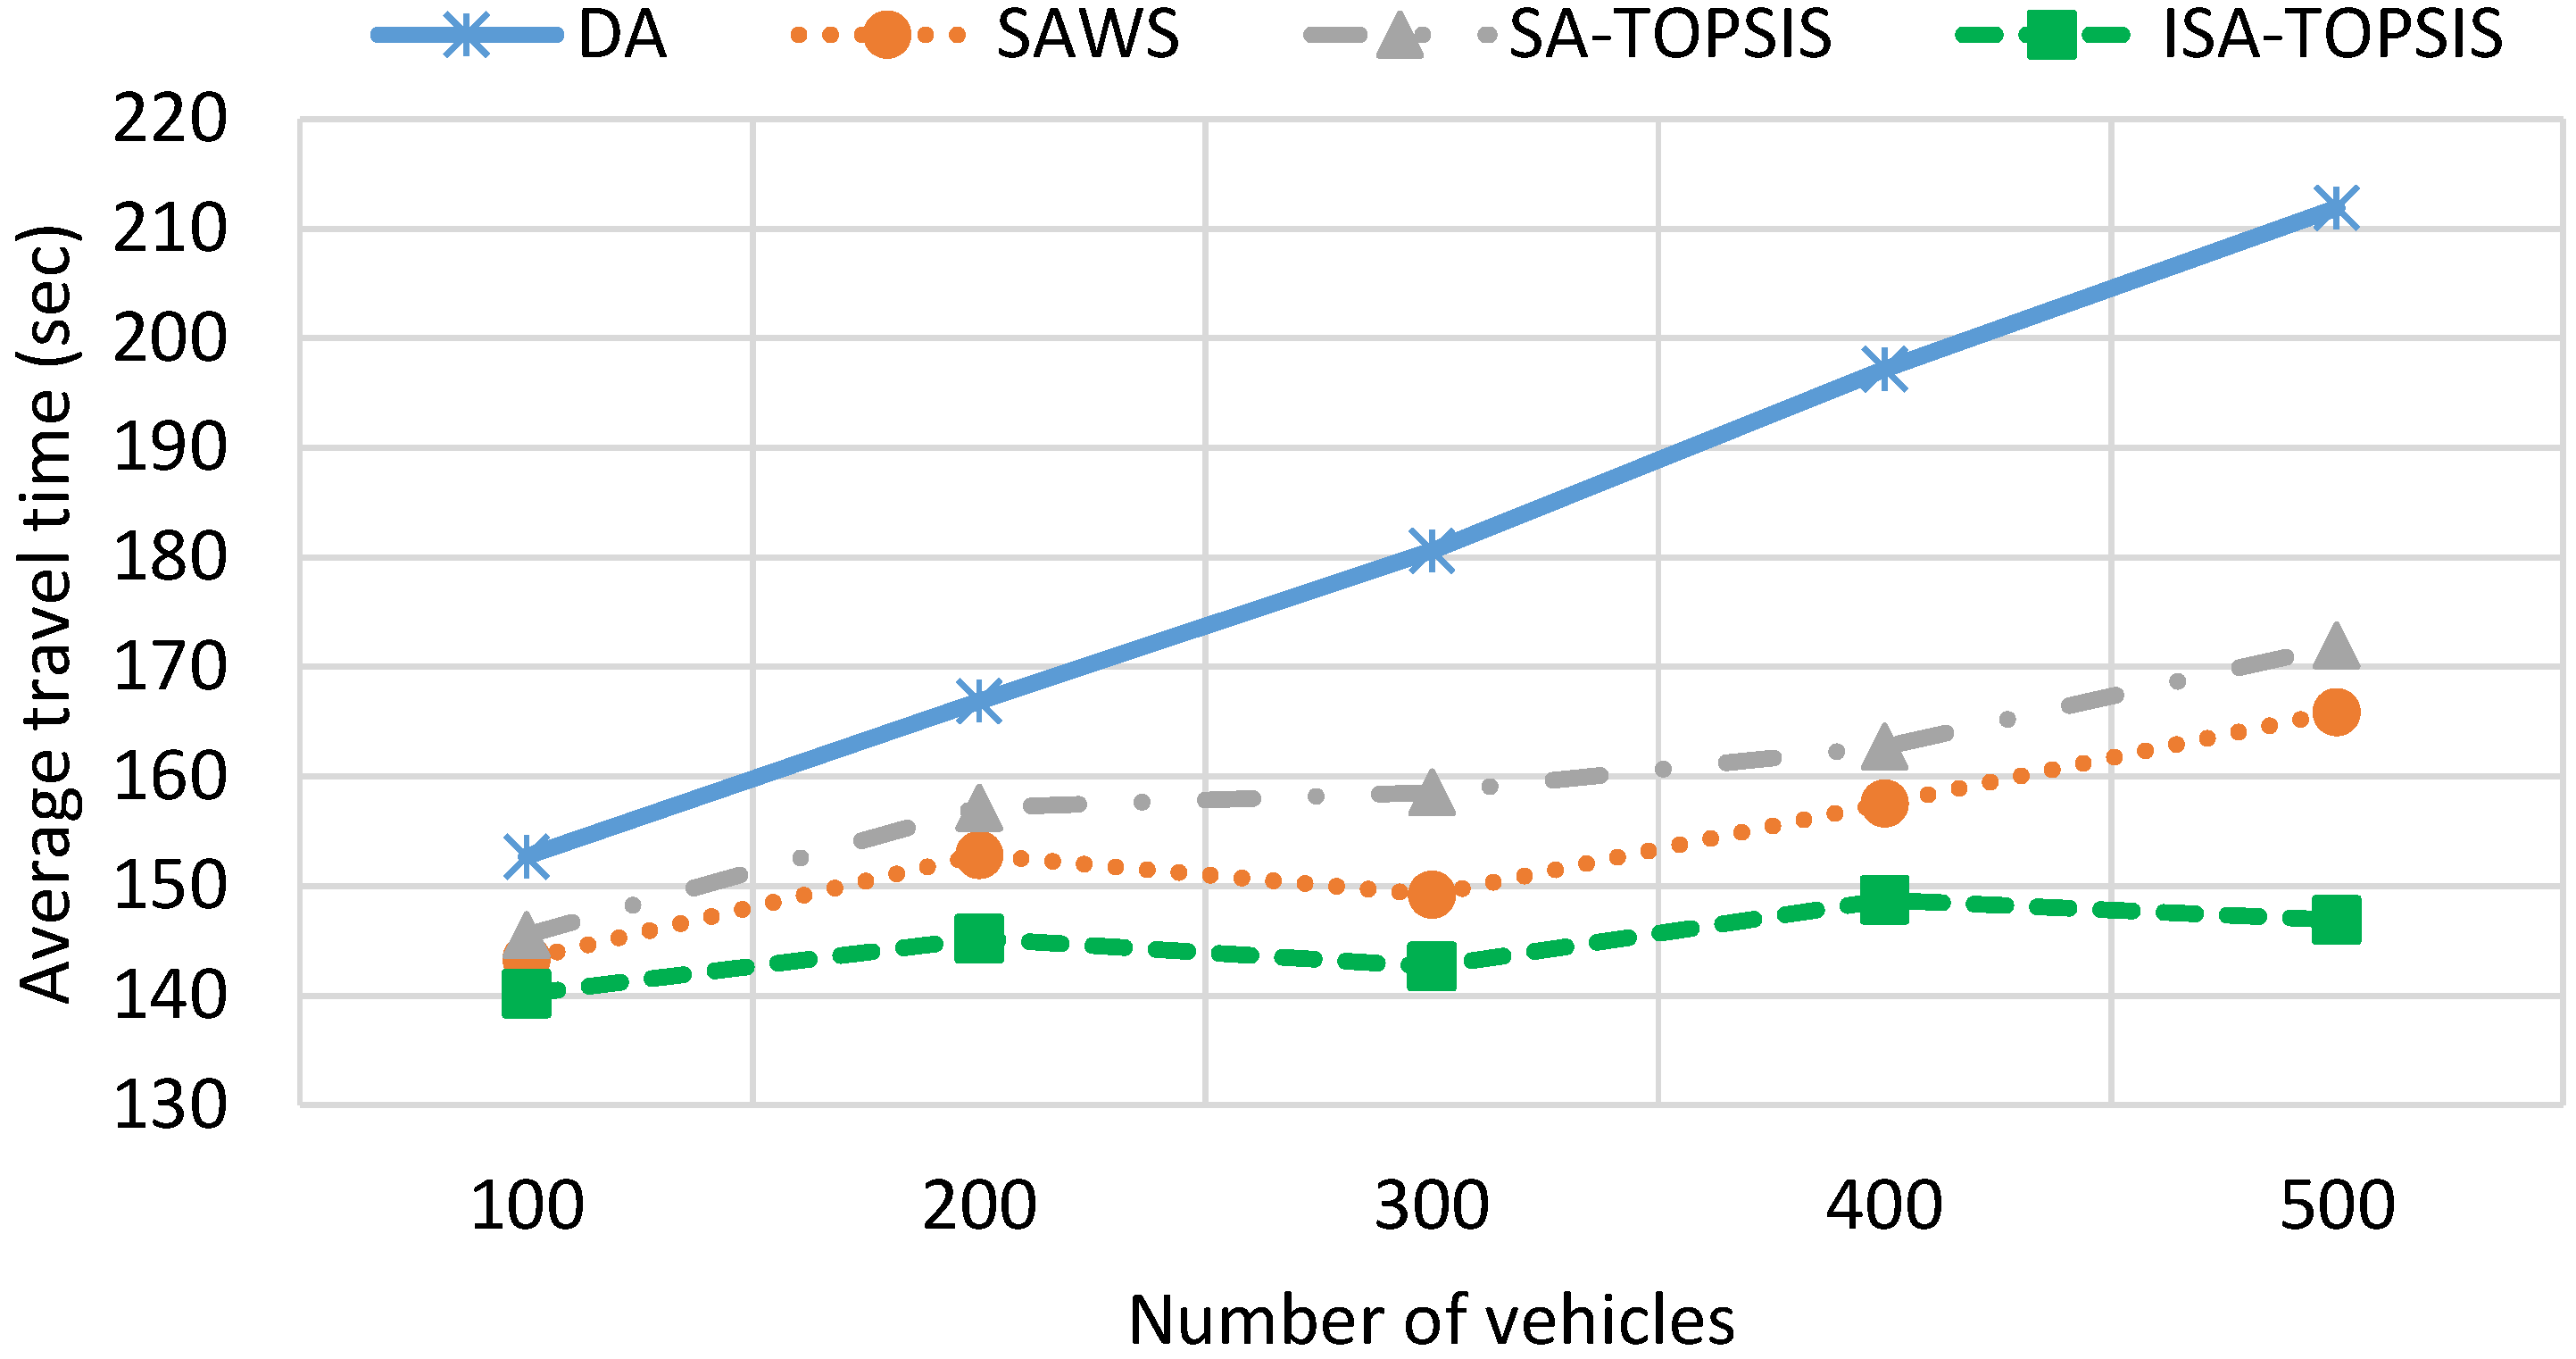
- Mean travel time (MTT): the average travel time of all vehicles.
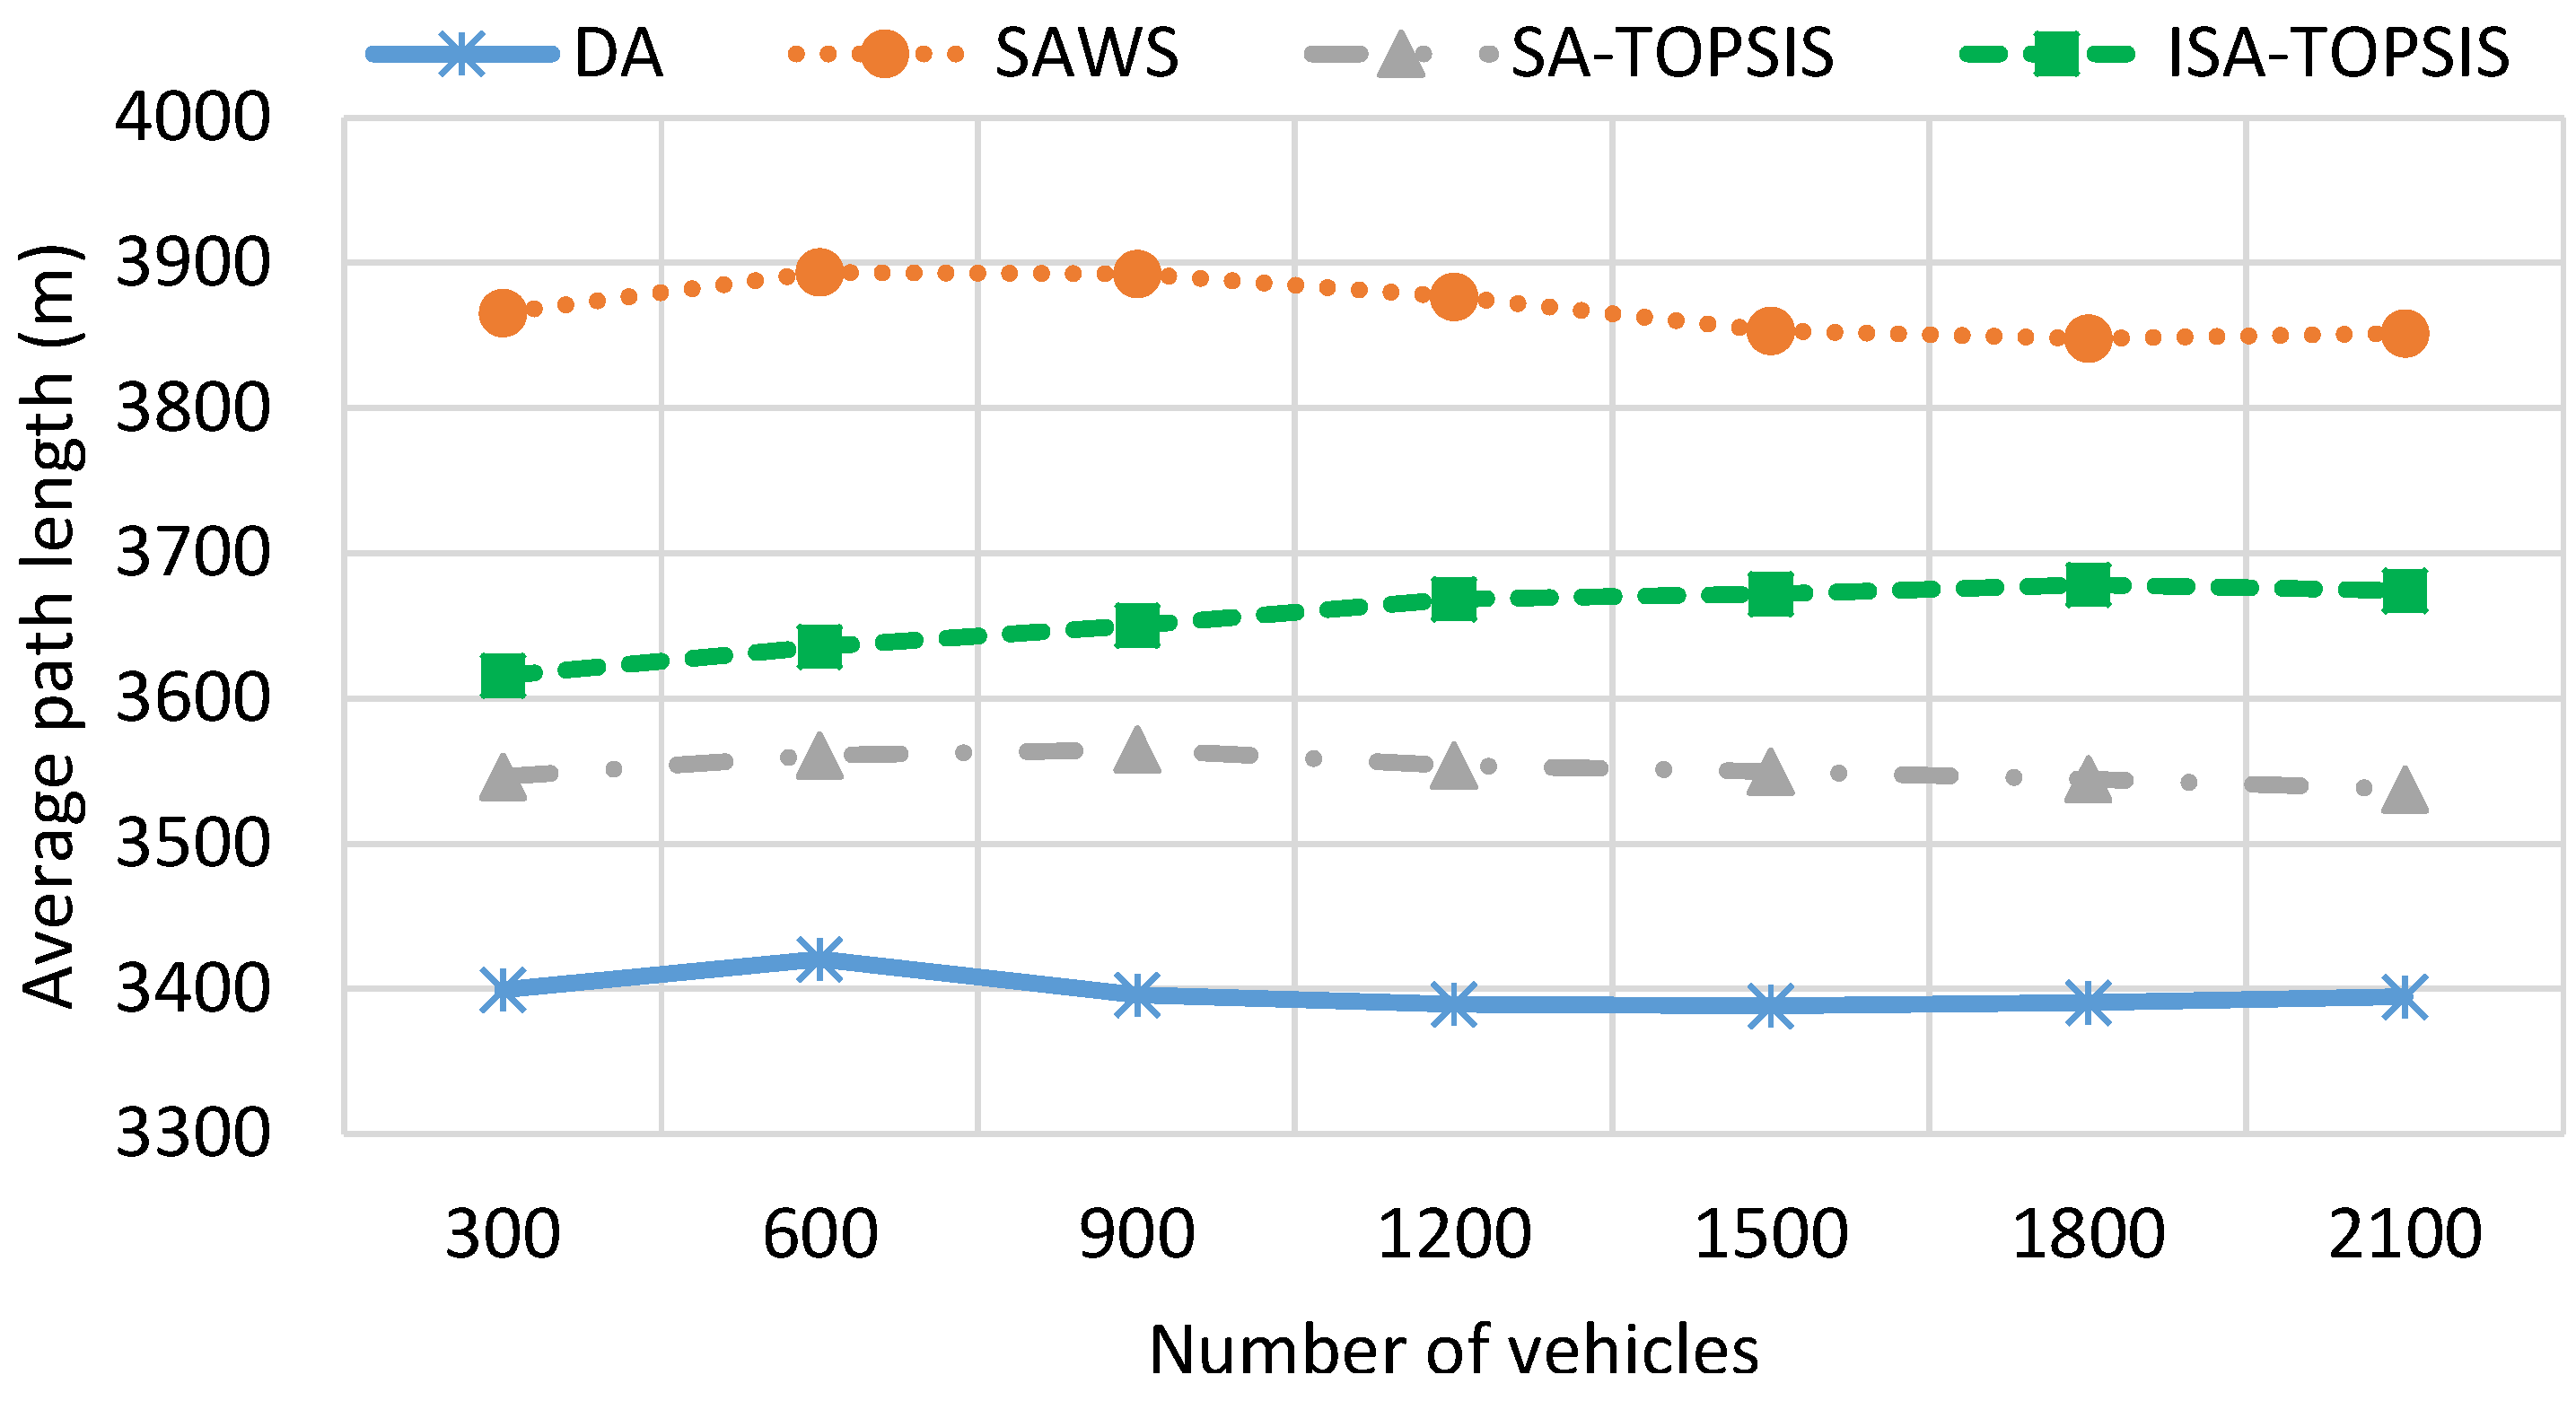
- Mean travel distance (MTD): the average travel distance taken by vehicles.
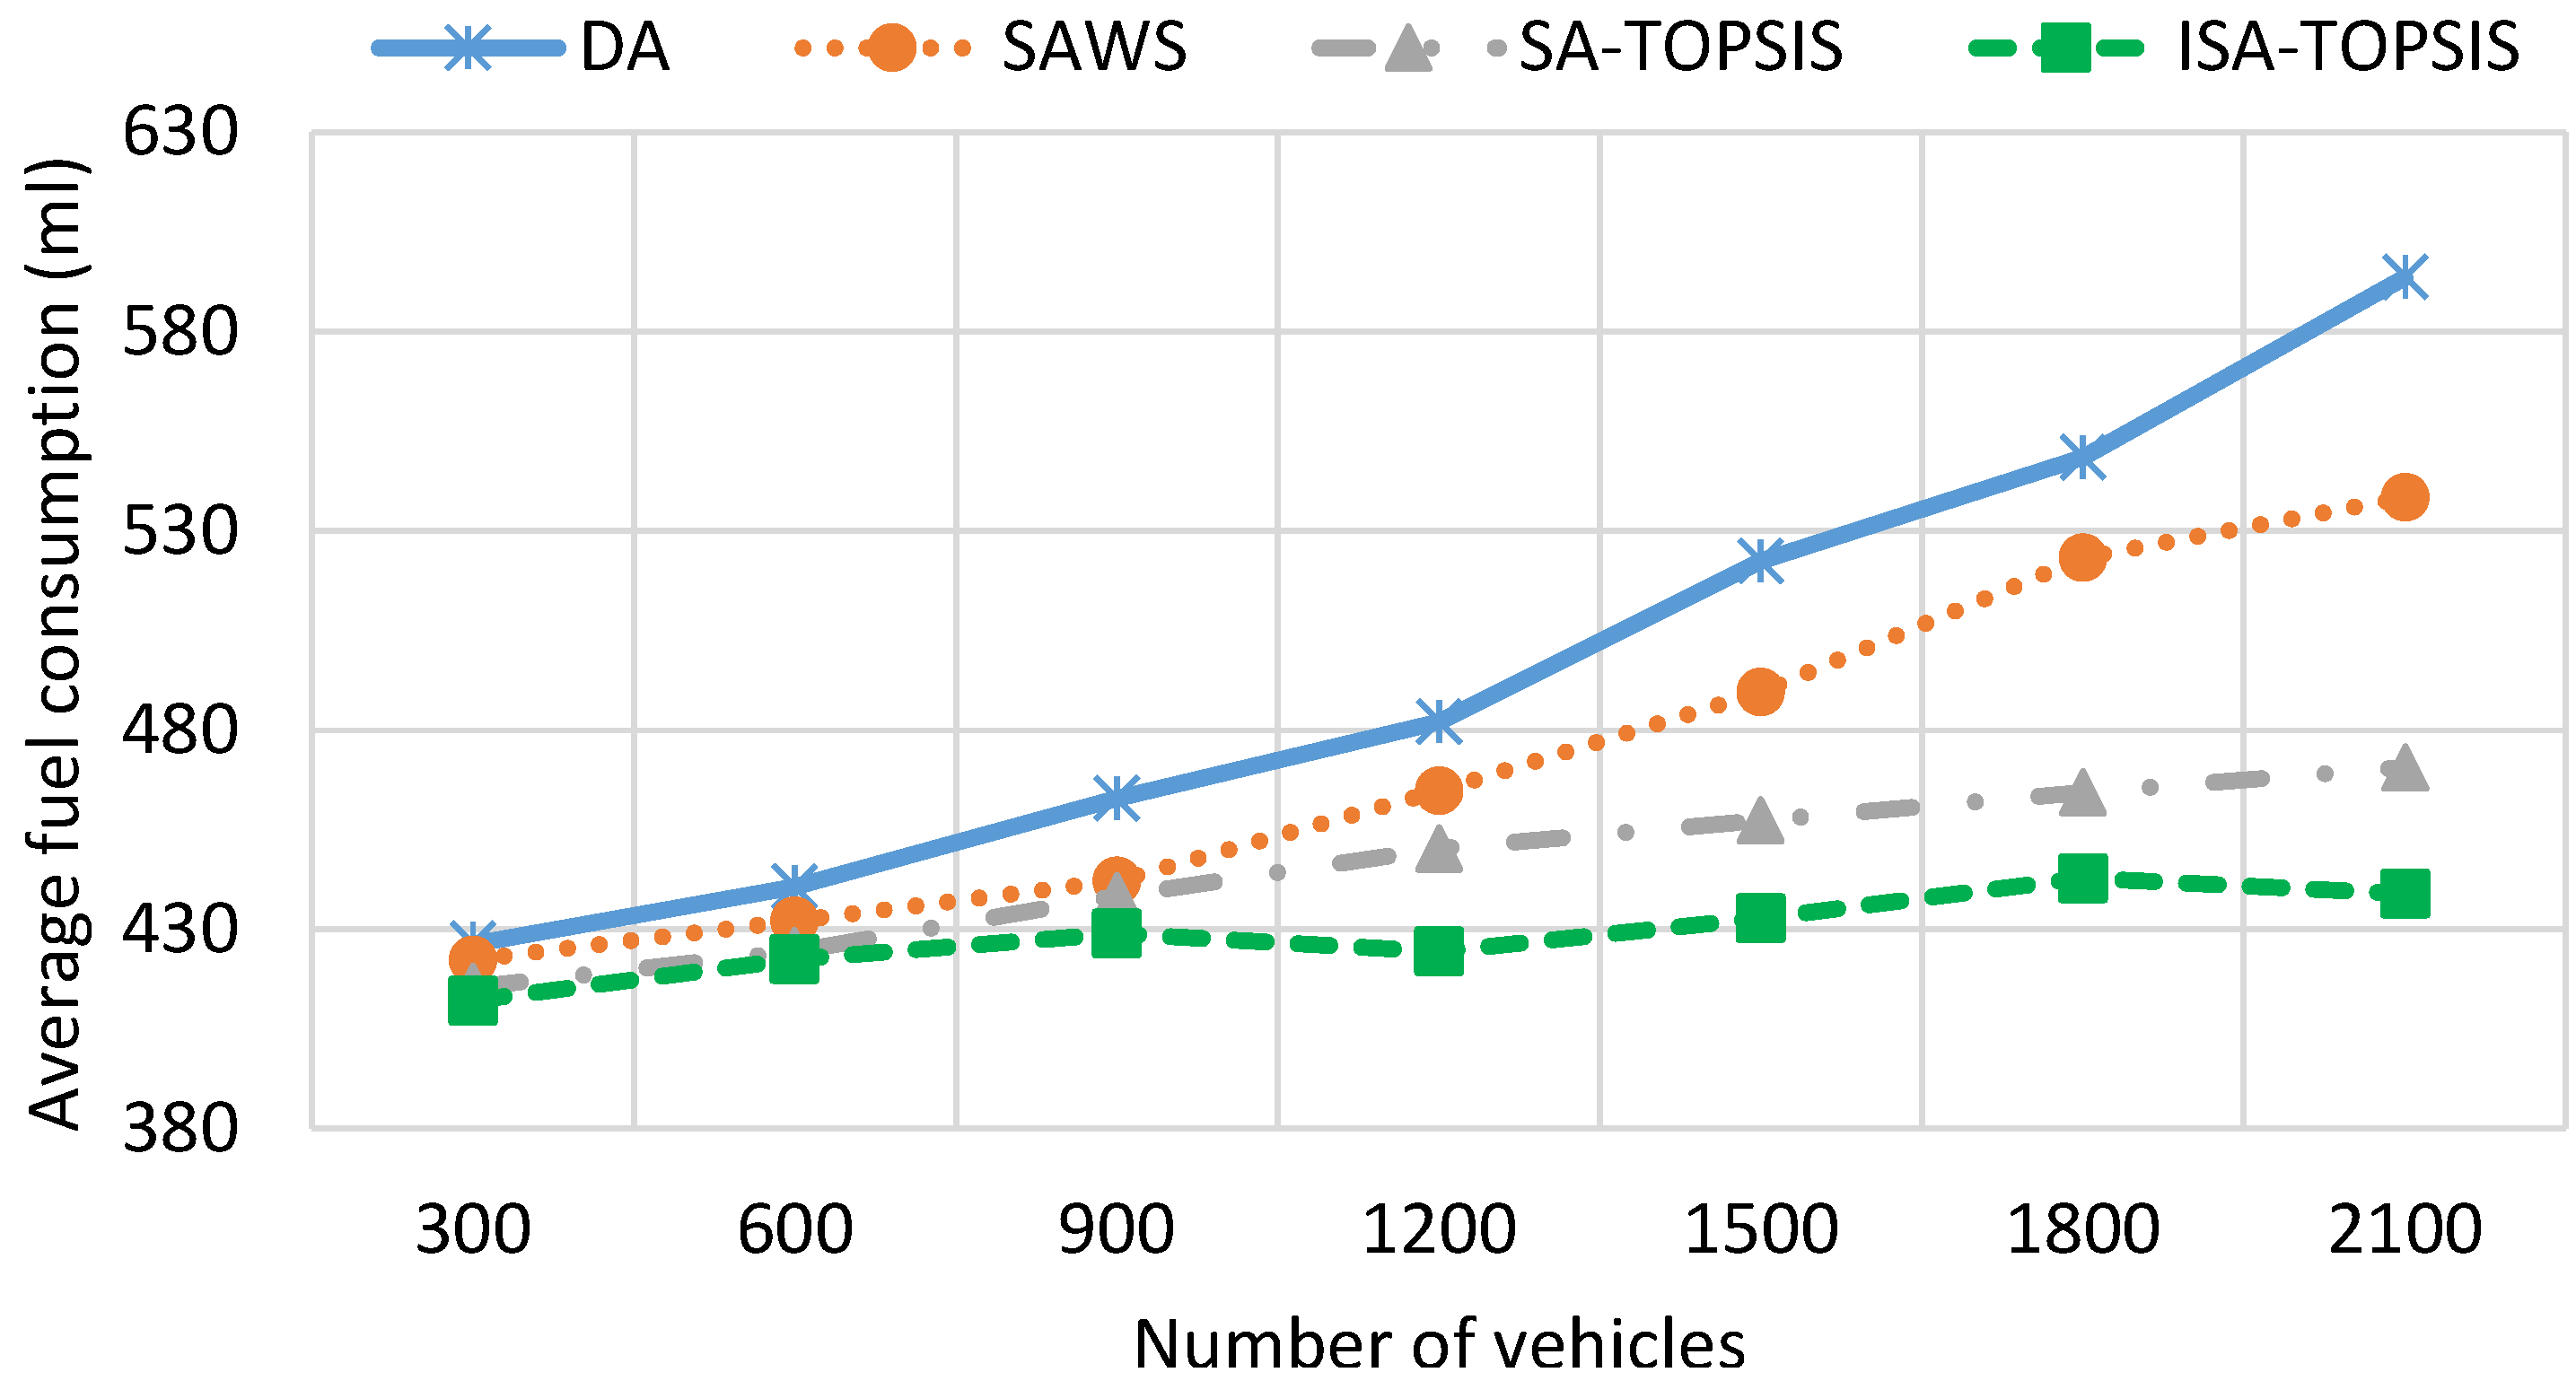
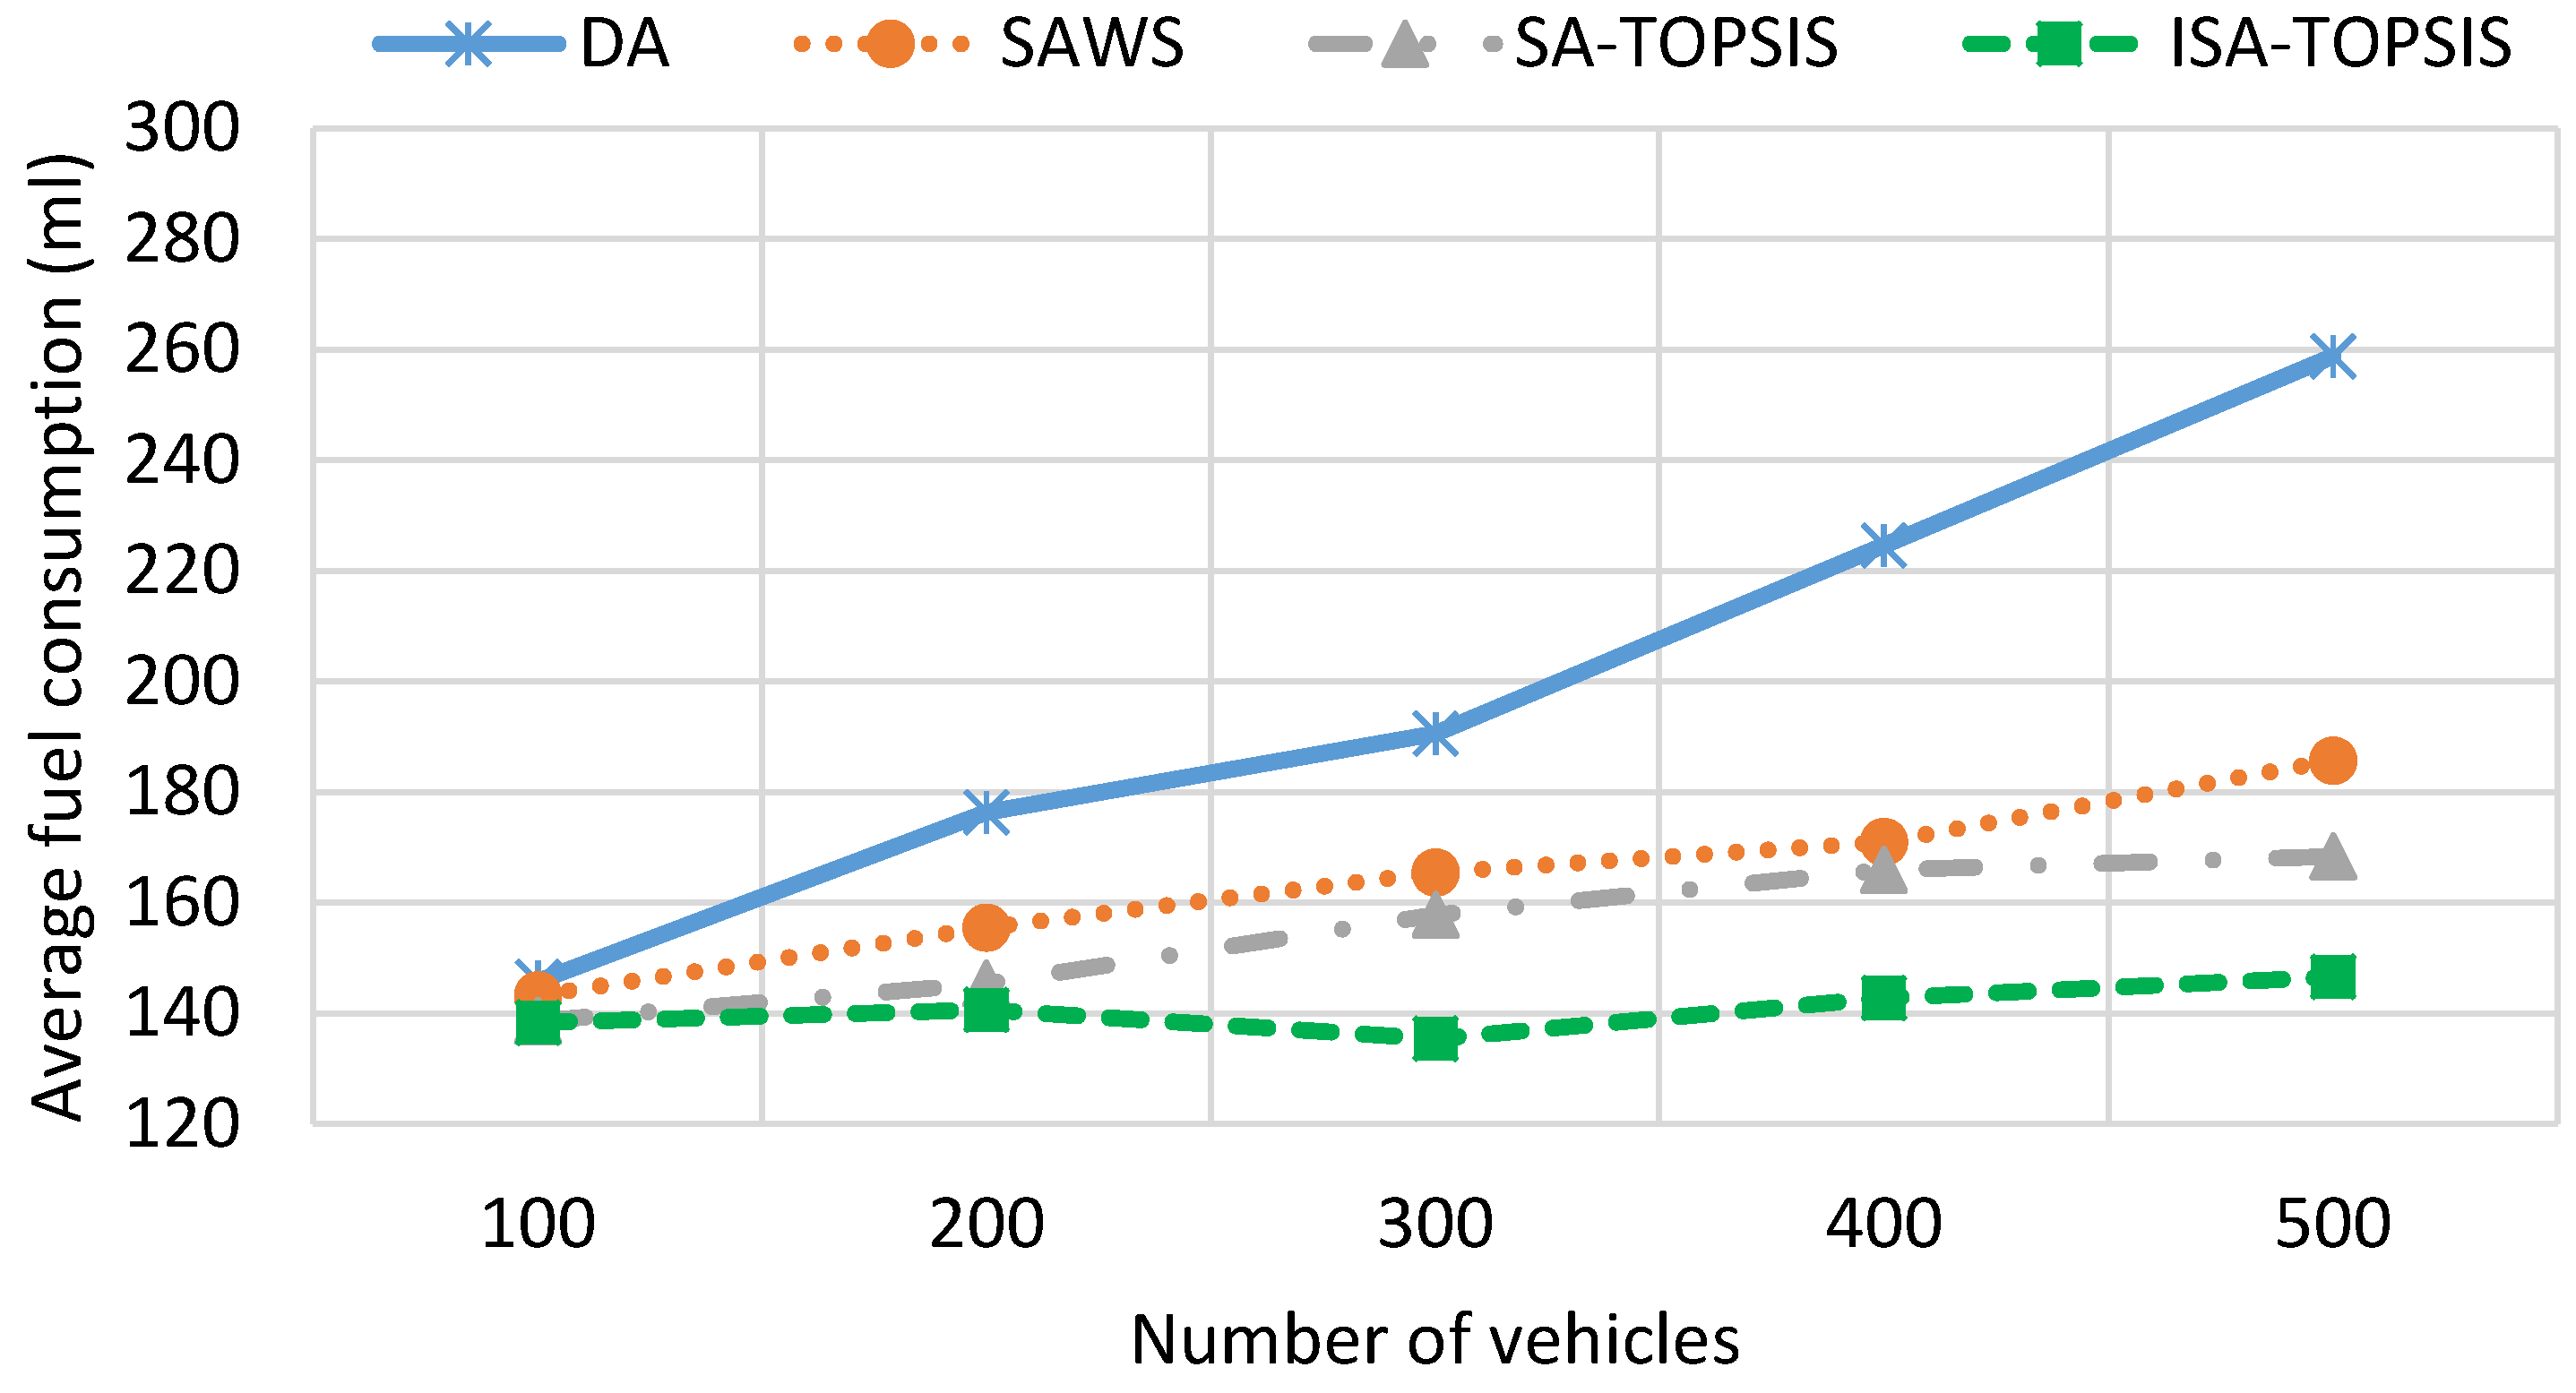
- Fuel consumption (FC): the average fuel consumption of vehicles.
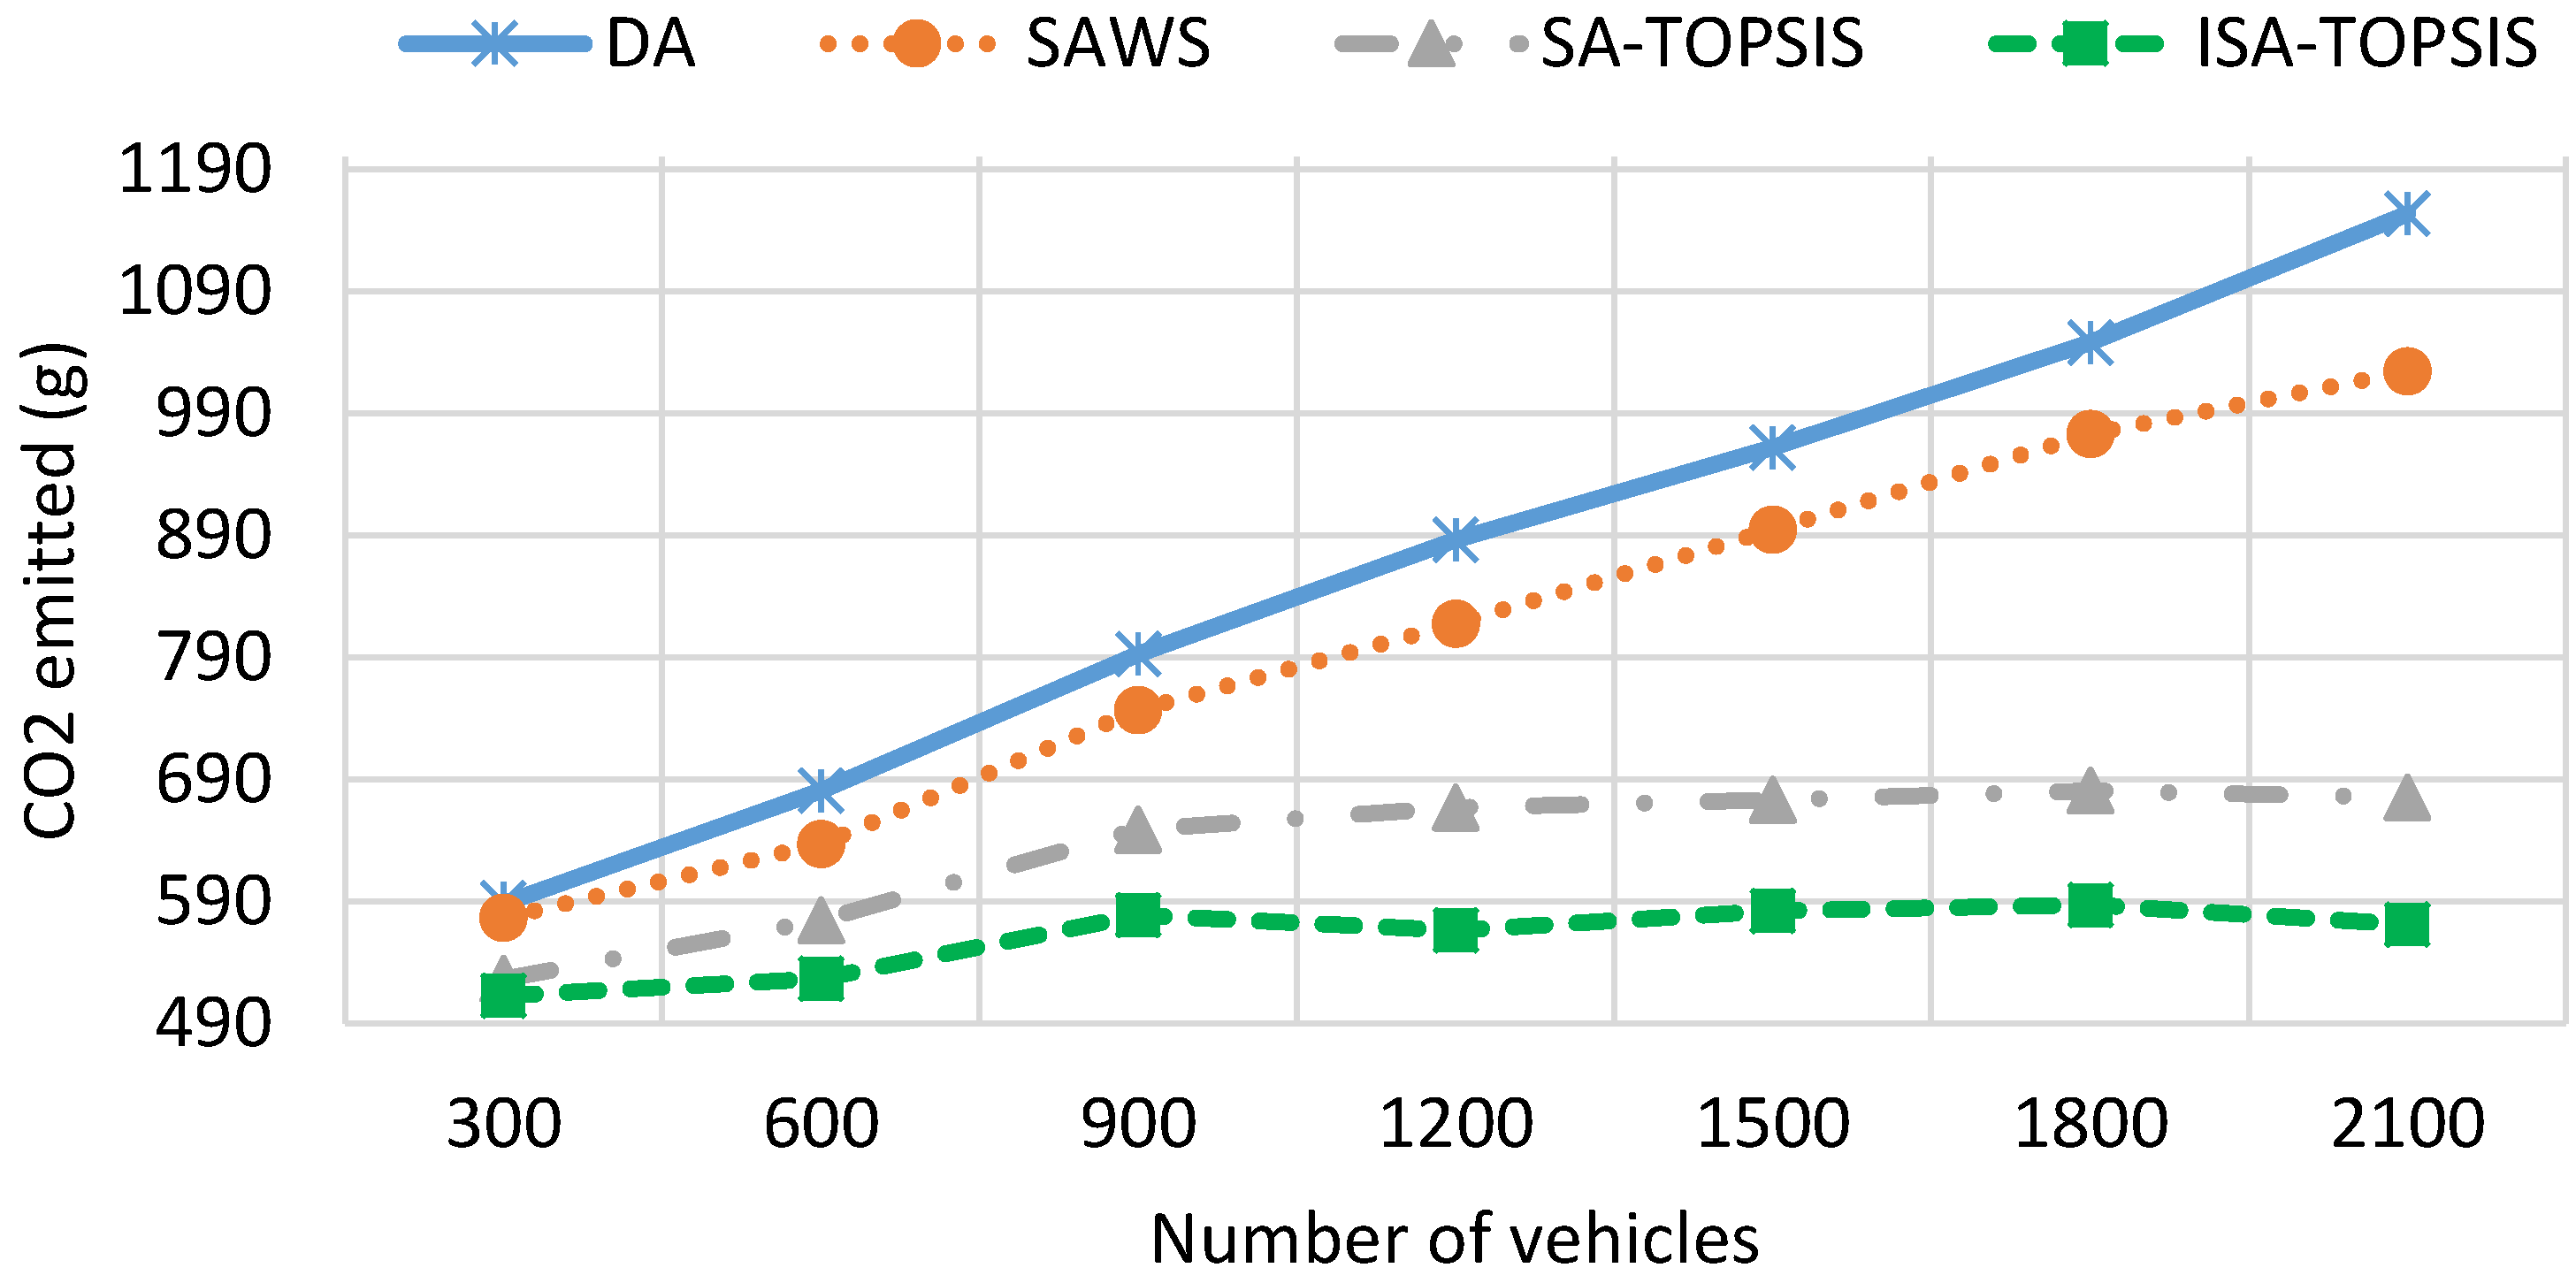
- CO2 emission: the average CO2 emission of all vehicles.
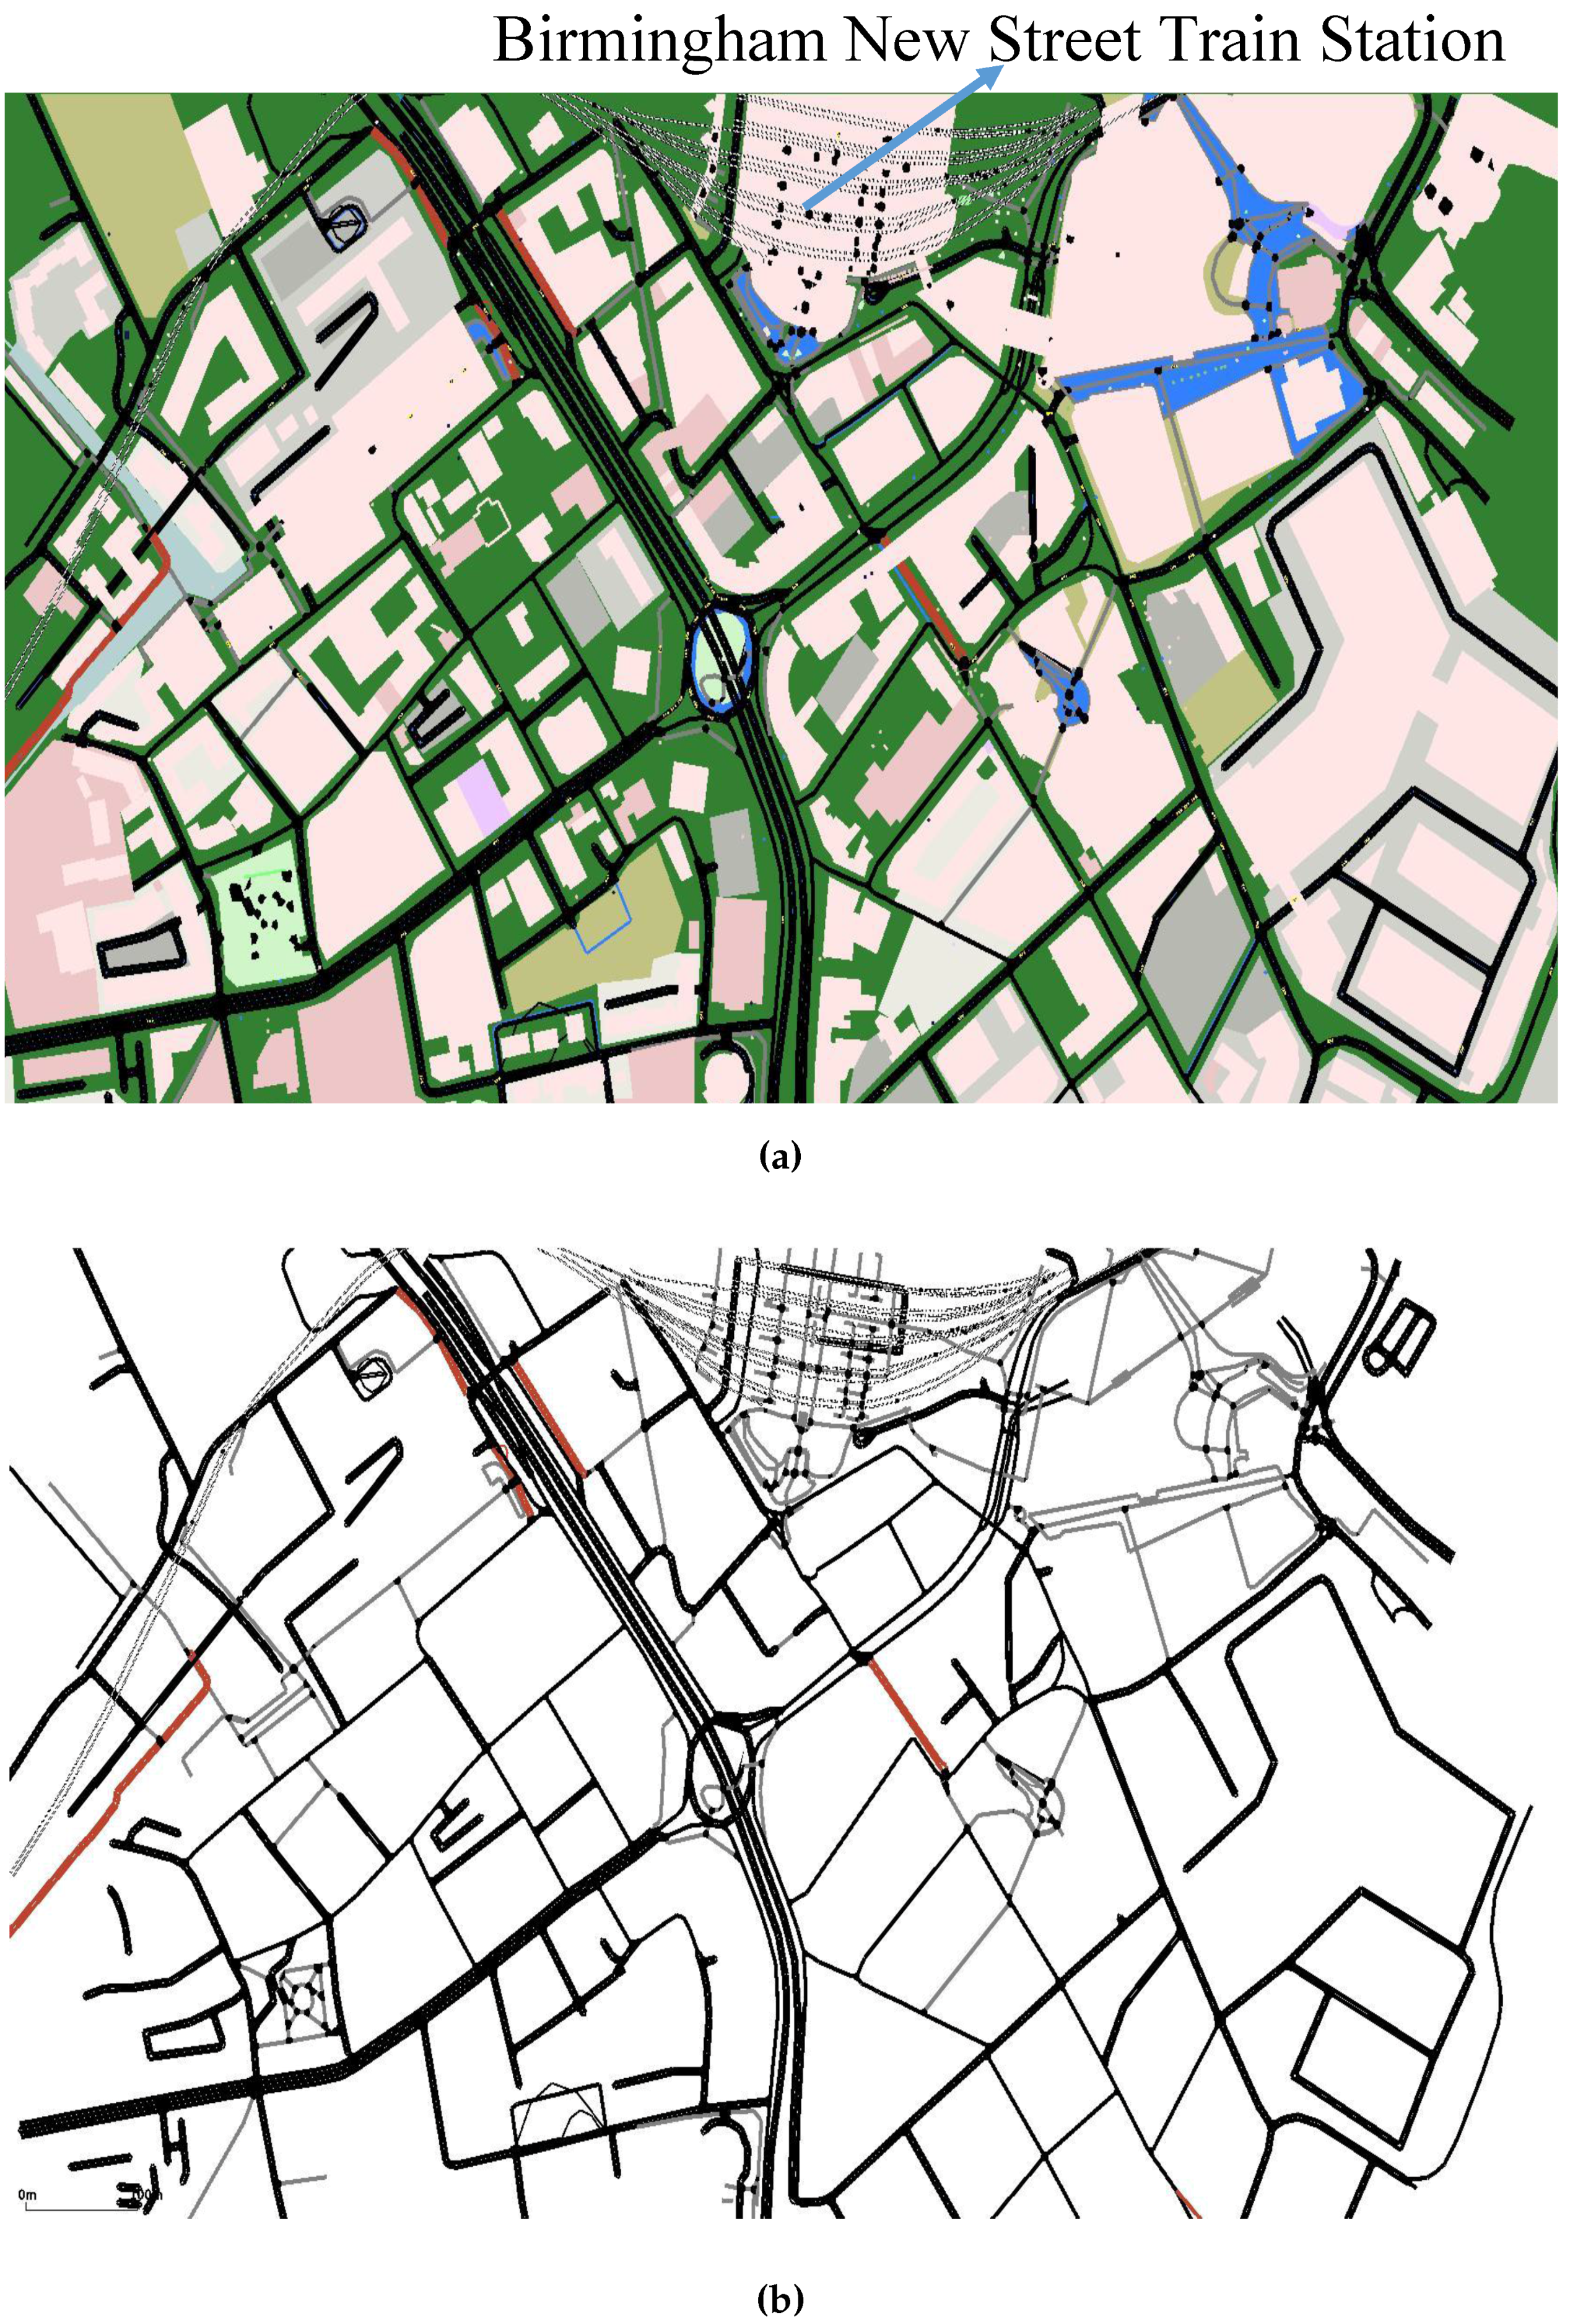
4.2. Scenario of Birmingham City
5. Conclusions
Acknowledgments
Author Contributions
Conflicts of Interest
References
- Chen, L.W.; Sharma, P.; Tseng, Y.C. Dynamic traffic control with fairness and throughput optimization using vehicular communications. IEEE J. Sel. Areas Commun. 2013, 9, 504–512. [Google Scholar] [CrossRef]
- Dijkstra, E.W. A note on two problems in connexion with graphs. Numer. Math. 1959, 1, 269–271. [Google Scholar] [CrossRef]
- Hart, P.E.; Nilsson, N.J.; Raphael, B. A formal basis for the heuristic determination of minimum cost paths. IEEE Trans. Sci. 1968, 4, 100–107. [Google Scholar]
- Dorigo, M.; Caro, G.D.; Gambardella, L.M. Ant algorithms for discrete optimization. Artif. Life 1999, 5, 137–172. [Google Scholar] [CrossRef] [PubMed]
- Fox, B.L. Integrating and accelerating tabu search, simulated annealing, and genetic algorithms. Ann. Oper. Res. 1993, 41, 47–67. [Google Scholar] [CrossRef]
- Kanoh, H.; Hara, K. Hybrid genetic algorithm for dynamic multi objective route planning with predicted traffic in a real-world road network. In Proceedings of the 10th Annual Conference on Genetic and Evolutionary Computation, Atlanta, GA, USA, 12–16 July 2008; pp. 657–664.
- Kan, C.; Miles, J.C. Its Handbook 2000: Recommendations from the World Road Associations (Piarc); Artech House: London, UK, 1999. [Google Scholar]
- Toor, Y.; Muhlethaler, P.; Laouiti, A. Vehicle ad hoc networks: Applications and related technical issues. IEEE Tutor. Commun. Surv. 2008, 10, 74–88. [Google Scholar] [CrossRef]
- Alcaraz, C.; Najera, P.; Lopez, J.; Roman, R. Wireless sensor networks and the internet of things: Do we need a complete integration? In Proceedings of the 1st International Workshop on the Security of the Internet of Things (SecIoT’10), Tokyo, Japan, 29 November–1 December 2010.
- Da Cunha, F.D.; Boukerche, A.; Villas, L.; Viana, A.C.; Loureiro, A. Data Communication in VANETs: A Survey, Challenges and Applications. Ph.D. Dissertation, INRIA Saclay, Paris, France, 15 March 2014. [Google Scholar]
- Hwang, C.-L.; Yoon, K. Multiple Attribute Decision Making: Methods and Applications a State-of-the-Art Survey; Springer-Verlag: Berlin/Heidelberg, Germany, 1981; Volume 186. [Google Scholar]
- Bauza, R.; Gozalvez, J.; Sanchez-Soriano, J. Road traffic congestion detection through cooperative vehicle-to-vehicle communications. In Proceedings of the 35th IEEE Conference on Local Computer Networks (LCN), Denver, CO, USA, 10–14 October 2010; pp. 606–612.
- Fukumoto, J.; Sirokane, N.; Ishikawa, Y.; Wada, T.; Ohtsuki, K.; Okada, H. Analytic method for real-time traffic problems by using Contents Oriented Communications in VANET. In Proceedings of the IEEE Telecommunications 7th International Conference on ITS ITST’07, Sophia Antipolis, France, 6–8 June 2007; pp. 1–6.
- Nha, V.T.N.; Djahel, S.; Murphy, J.A. Comparative study of vehicles’ routing algorithms for route planning in smart cities. In Proceedings of the First International Workshop on the Vehicular Traffic Management for Smart Cities (VTM), Dublin, UK, 20 November 2012.
- Wang, S.; Djahel, S.; McManis, J.; McKenna, C.; Murphy, L. Performance Analysis and Comparison of Vehicles Routing Algorithms in Smart Cities. In Proceedings of the Comprehensive (IEEE GIIS), Trento, Italy, 28–31 October 2013.
- Bauza, R.; Gozálvez, J. Traffic congestion detection in large-scale scenarios using vehicle-to-vehicle communications. Netw. Comput. Appl. 2013, 36, 1295–1307. [Google Scholar] [CrossRef]
- Pan, J.; Khan, M.A.; Popa, I.S.; Zeitouni, K.; Borcea, C. Proactive vehicle re-routing strategies for congestion avoidance. In Proceedings of the 8th IEEE International Conference on Distributed Computing in Sensor Systems (DCOSS), Hangzhou, China, 16–18 May 2012; pp. 265–272.
- Jabbarpour, M.R.; Jalooli, A.; Shaghaghi, E.; Noor, R.; Rothkrantz, L.; Khokhar, R.H.; Anuar, N.B. Ant-based vehicle congestion avoidance system using vehicular networks. Eng. Appl. Artif. Intell. 2014, 36, 303–319. [Google Scholar] [CrossRef]
- Garip, M.T.; Gursoy, M.E.; Reiher, P.; Gerla, M. Scalable reactive vehicle-to-vehicle congestion avoidance mechanism. In Proceedings of the 12th Annual IEEE Consumer Communications and Networking Conference (CCNC), Las Vegas, NV, USA, 9–12 January 2015; pp. 943–948.
- De Souza, A.M.; Yokoyama, R.; Maia, G.; Loureiro, A.A.; Villas, L.A. Minimizing traffic jams in urban Centers using vehicular ad hoc networks. In Proceedings of 7th International Conference on New Technologies, Mobility and Security (NTMS), Paris, France, 27–29 July 2015; pp. 1–5.
- De Souza, A.M.; Yokoyama, R.; Maia, G.; Loureiro, A.A.; Villas, L.A. GARUDA: A New Geographical Accident Aware Solution to Reduce Urban Congestion. In Proceedings of the IEEE International Conference on Computer and Information Technology; Ubiquitous Computing and Communications; Dependable, Autonomic and Secure Computing; Pervasive Intelligence and Computing (CIT/IUCC/DASC/PICOM), Liverpool, UK, 26–28 October 2015; pp. 596–602.
- De Souza, A.M.; Yokoyama, R.; Maia, G.; Loureiro, A.A.; Villas, L.A. SCORPION: A Solution using Cooperative Rerouting to Prevent Congestion and Improve traffic Condition. In Proceedings of the IEEE International Conference on Computer and Information Technology; Ubiquitous Computing and Communications; Dependable, Autonomic and Secure Computing; Pervasive Intelligence and Computing (CIT/IUCC/DASC/PICOM), Liverpool, UK, 26–28 October 2015; pp. 497–503.
- Jindal, V.; Dhankani, H.; Garg, R.; Bedi, P. MACO: Modified ACO for reducing travel time in VANETs. In Proceedings of the Third International Symposium on Women in Computing and Informatics, Kochi, India, 10–13 August 2015; pp. 97–102.
- Zhao, P.; Zhao, P.; Zhang, X. A new ant colony optimization for the knapsack problem. In Proceedings of 7th International Conference on Computer-Aided Industrial Design and Conceptual Design CAIDCD’06, Hangzhou, China, 17–19 November 2006; pp. 1–3.
- Yu, Y.; Govindan, R.; Estrin, D. Geographical and energy aware routing: A recursive data dissemination protocol for wireless sensor networks. Mar. Pollut. Bull. 2001, 20, 48. [Google Scholar]
- Kirkpatrick, S.; Vecchi, M.P. Optimization by simmulated annealing. Science 1983, 220, 671–680. [Google Scholar] [CrossRef] [PubMed]
- Behrisch, M.; Bieker, L.; Erdmann, J.; Krajzewicz, D. Sumo–simulation of urban mobility. In Proceedings of the Third International Conference on Advances in System Simulation (SIMUL), Barcelona, Spain, 23–29 October 2011.
- Wegener, A.; Piórkowski, M.; Raya, M.; Hellbrück, H.; Fischer, S.; Hubaux, J.-P. TraCI: An interface for coupling road traffic and network simulators. In Proceedings of the 11th Communications and Networking Simulation Symposium, ACM, Ottawa, ON, Canada, 13–16 April 2008; pp. 155–163.
- Haklay, M.; Weber, P. Openstreetmap: User-generated street maps. IEEE Pervasive Comput. 2008, 7, 12–18. [Google Scholar] [CrossRef]
- Cappiello, A.; Chabini, I.; Nam, E.K.; Lue, A.; Abou Zeid, M. A statistical model of vehicle emissions and fuel consumption. In Proceedings of the 5th IEEE International Conference on Intelligent Transportation Systems, Singapore, Singapore, 3–6 September 2002; pp. 801–809.

| Simulation Parameters | Value |
|---|---|
| Map dimension | 4 km × 3.5 km |
| Simulation time | 2500 sec |
| Vehicle speed | 0–15 m/s |
| Velocity threshold | 7 m/s |
| MAC/PHY | IEEE 802.11p |
| Vehicle density | 300–2100 Vehicle |
| Route generator | SUMO |
| Parameters | Values |
|---|---|
| T off-line | 500 °C |
| α off-line | 0.998 |
| T on-line | 25 °C |
| α on-line | 0.992 |
| Method | MTT (s) | MTD (m) | FC (mL) | CO2 (g) |
|---|---|---|---|---|
| DA | 544.45 | 3396.84 | 496.603 | 873.206 |
| SAWS | 432.55 | 3868.76 | 473.194 | 809.957 |
| SATOPSIS | 439.29 | 3551.15 | 445.629 | 635.079 |
| ISATOPSIS | 365.153 | 3656.367 | 428.904 | 560.668 |
| Method | Var MTT (s) | Var MTD (m) | Var FC (mL) | Var CO2 (g) |
|---|---|---|---|---|
| DA | 88.202 | 248.59 | 96.83 | 85.47 |
| SAWS | 65.65 | 185.819 | 73.61 | 61.77 |
| SATOPSIS | 44.157 | 136.46 | 67.408 | 39.0625 |
| ISATOPSIS | 26.86 | 88.25 | 60.79 | 32.49 |
| Simulation Parameters | Value |
|---|---|
| map dimension | 2 km × 1.5 km |
| Simulation time | 1000 sec |
| Vehicle speed | 0–15 m/s |
| Velocity threshold | 7 m/s |
| MAC/PHY | IEEE 802.11p |
| Vehicle density | 100–500 |
| Route generator | SUMO |
© 2016 by the authors; licensee MDPI, Basel, Switzerland. This article is an open access article distributed under the terms and conditions of the Creative Commons Attribution (CC-BY) license (http://creativecommons.org/licenses/by/4.0/).
Share and Cite
Amer, H.; Salman, N.; Hawes, M.; Chaqfeh, M.; Mihaylova, L.; Mayfield, M. An Improved Simulated Annealing Technique for Enhanced Mobility in Smart Cities. Sensors 2016, 16, 1013. https://doi.org/10.3390/s16071013
Amer H, Salman N, Hawes M, Chaqfeh M, Mihaylova L, Mayfield M. An Improved Simulated Annealing Technique for Enhanced Mobility in Smart Cities. Sensors. 2016; 16(7):1013. https://doi.org/10.3390/s16071013
Chicago/Turabian StyleAmer, Hayder, Naveed Salman, Matthew Hawes, Moumena Chaqfeh, Lyudmila Mihaylova, and Martin Mayfield. 2016. "An Improved Simulated Annealing Technique for Enhanced Mobility in Smart Cities" Sensors 16, no. 7: 1013. https://doi.org/10.3390/s16071013
APA StyleAmer, H., Salman, N., Hawes, M., Chaqfeh, M., Mihaylova, L., & Mayfield, M. (2016). An Improved Simulated Annealing Technique for Enhanced Mobility in Smart Cities. Sensors, 16(7), 1013. https://doi.org/10.3390/s16071013


