Performance Assessment of a New Variable Stiffness Probing System for Micro-CMMs
Abstract
:1. Introduction
2. The Variable Stiffness Micro-Scale Probing System
2.1. Operating Sequence for the Variable Stiffness Probing System
2.2. Control Strategy for the Variable Stiffness Probing System
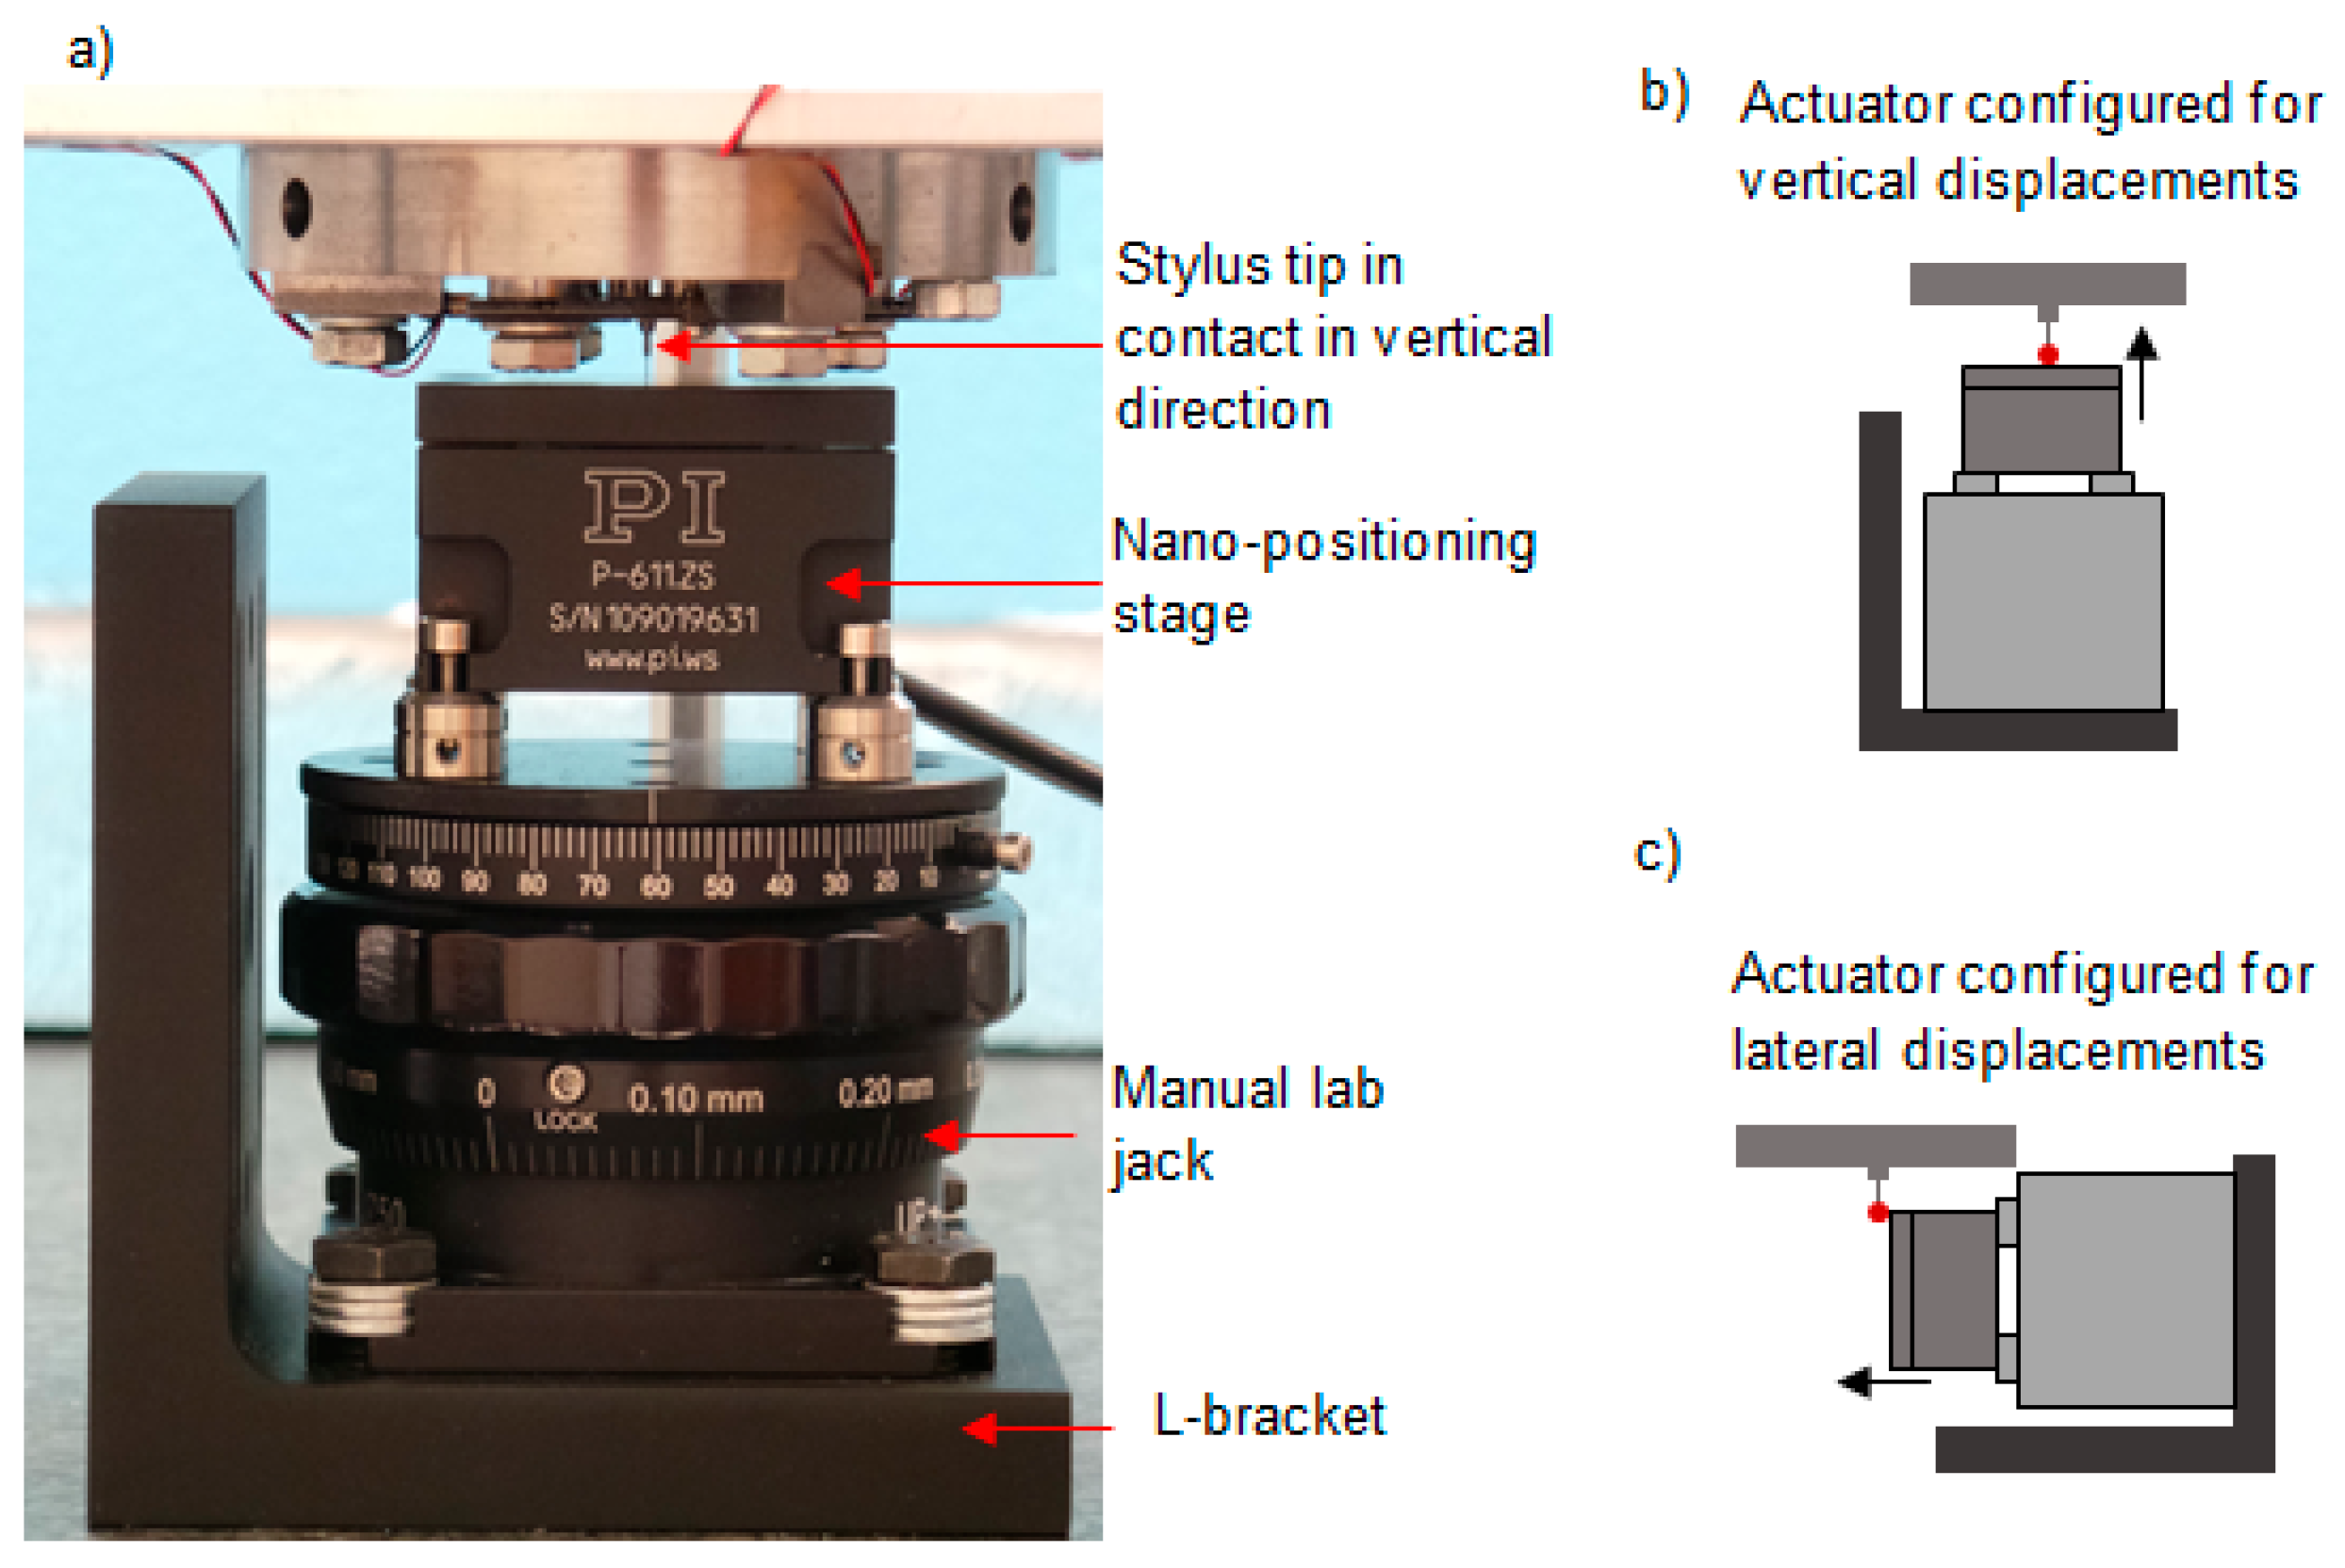
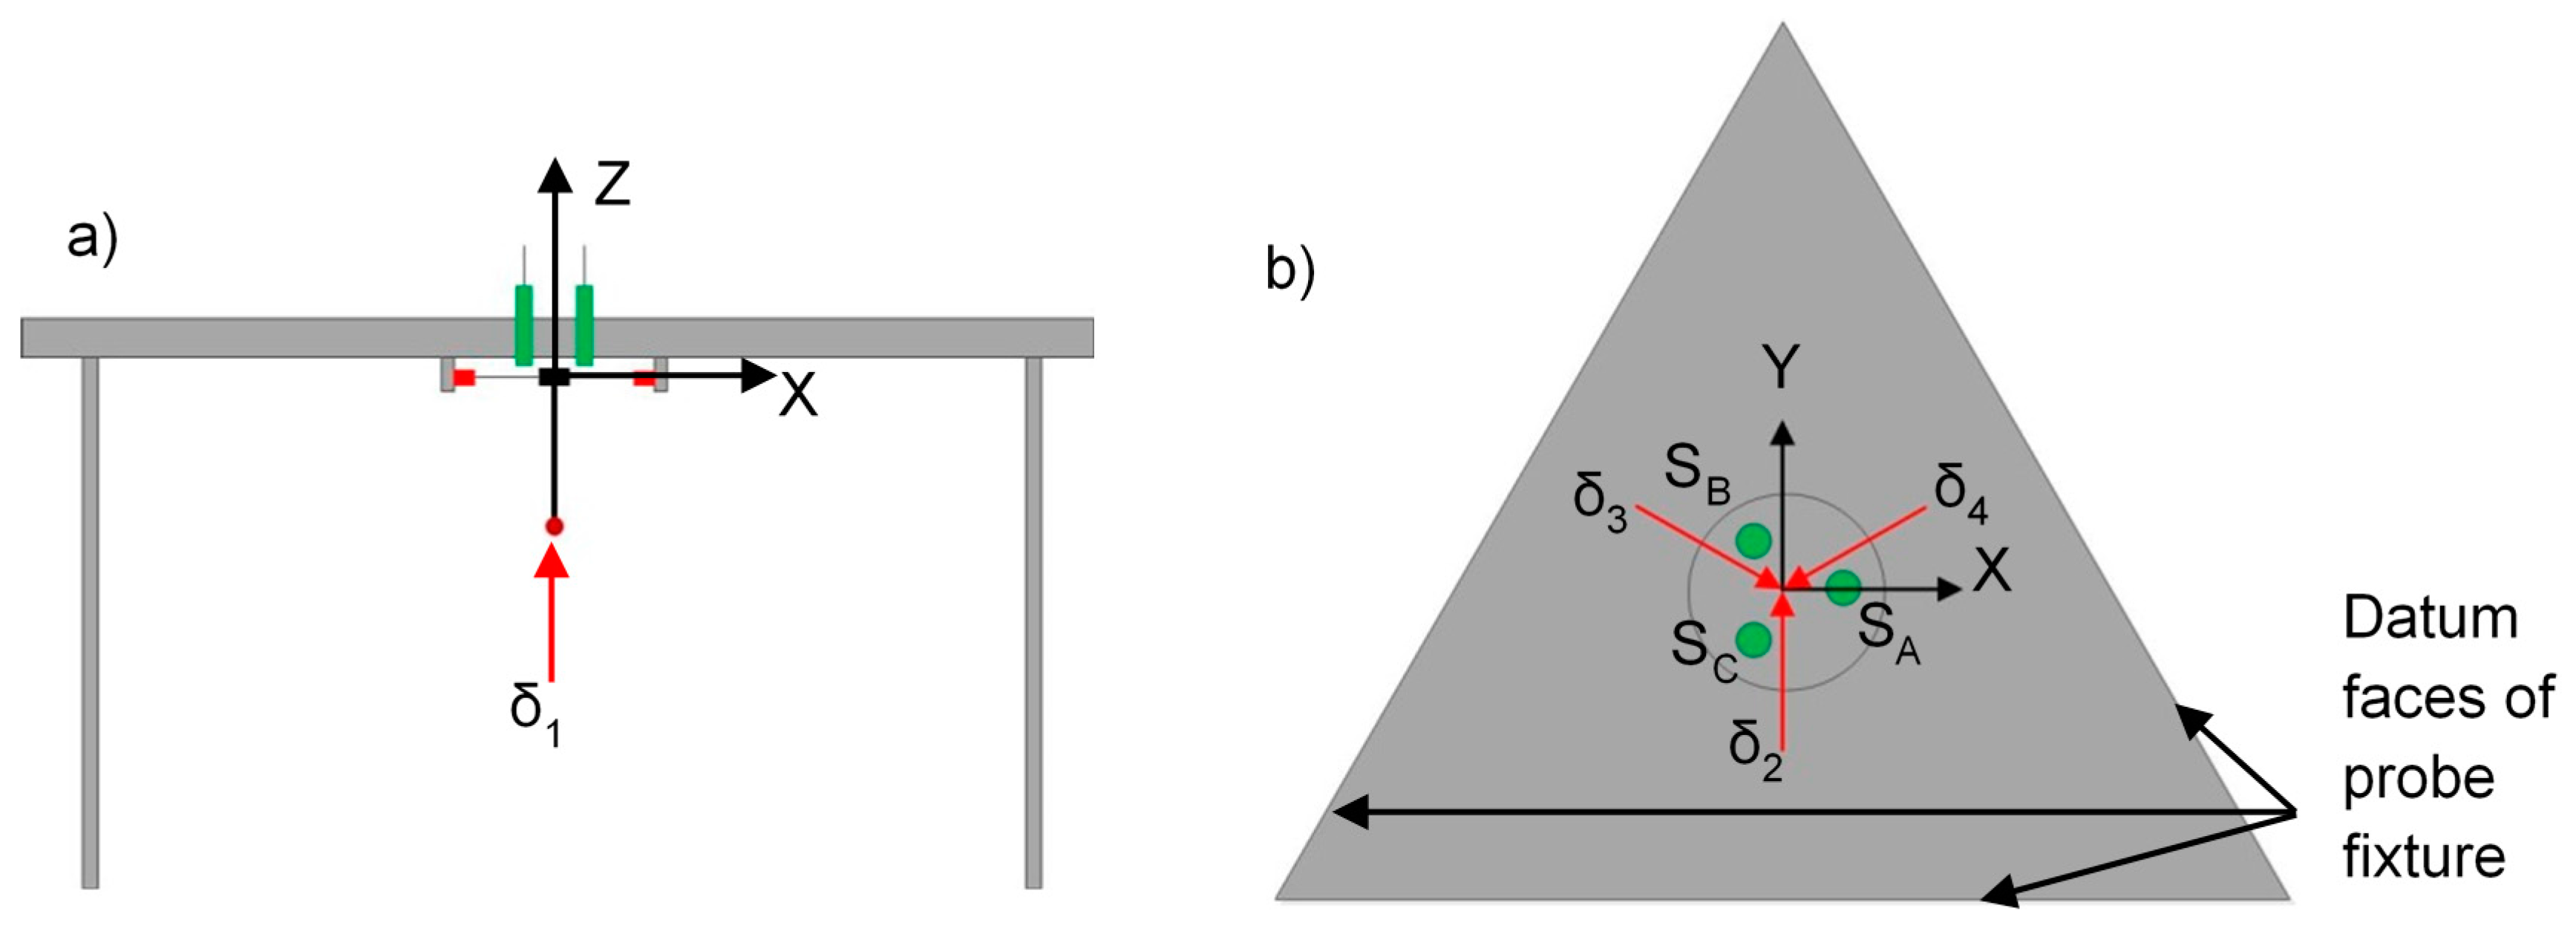
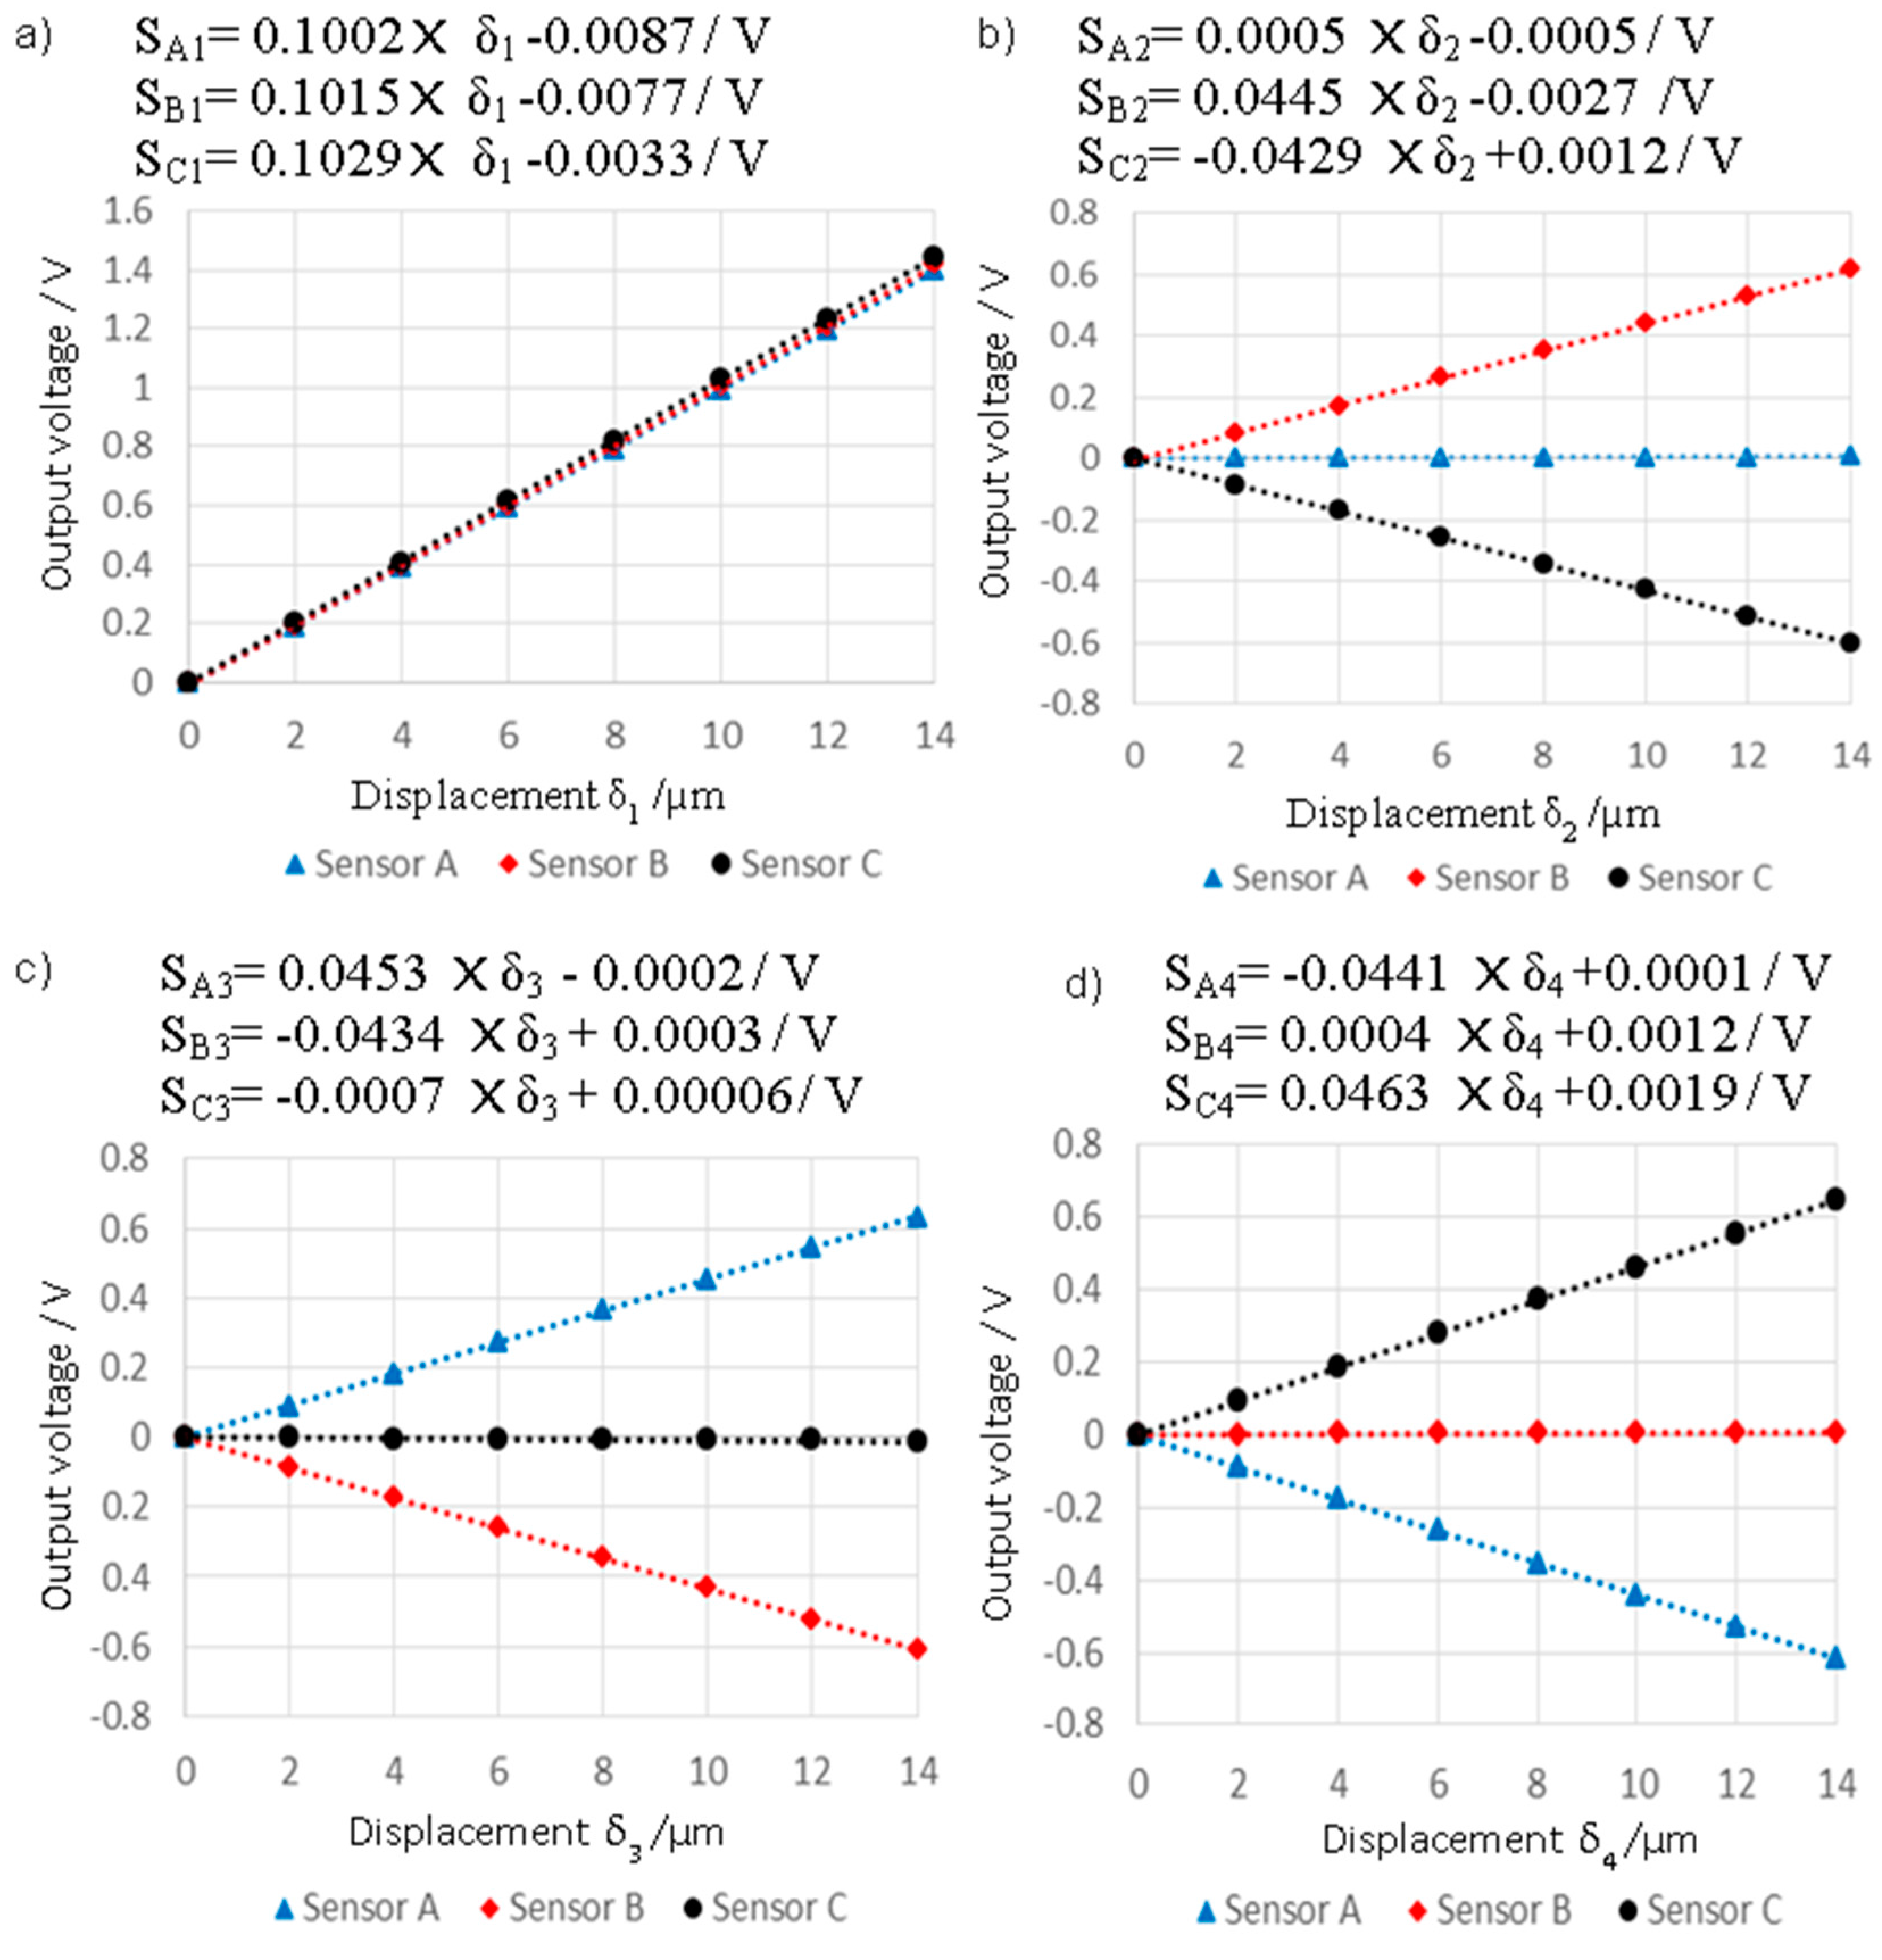
3. Experimental Setup for the Probing System Characterisation
4. Suspension Structure Performance Evaluation
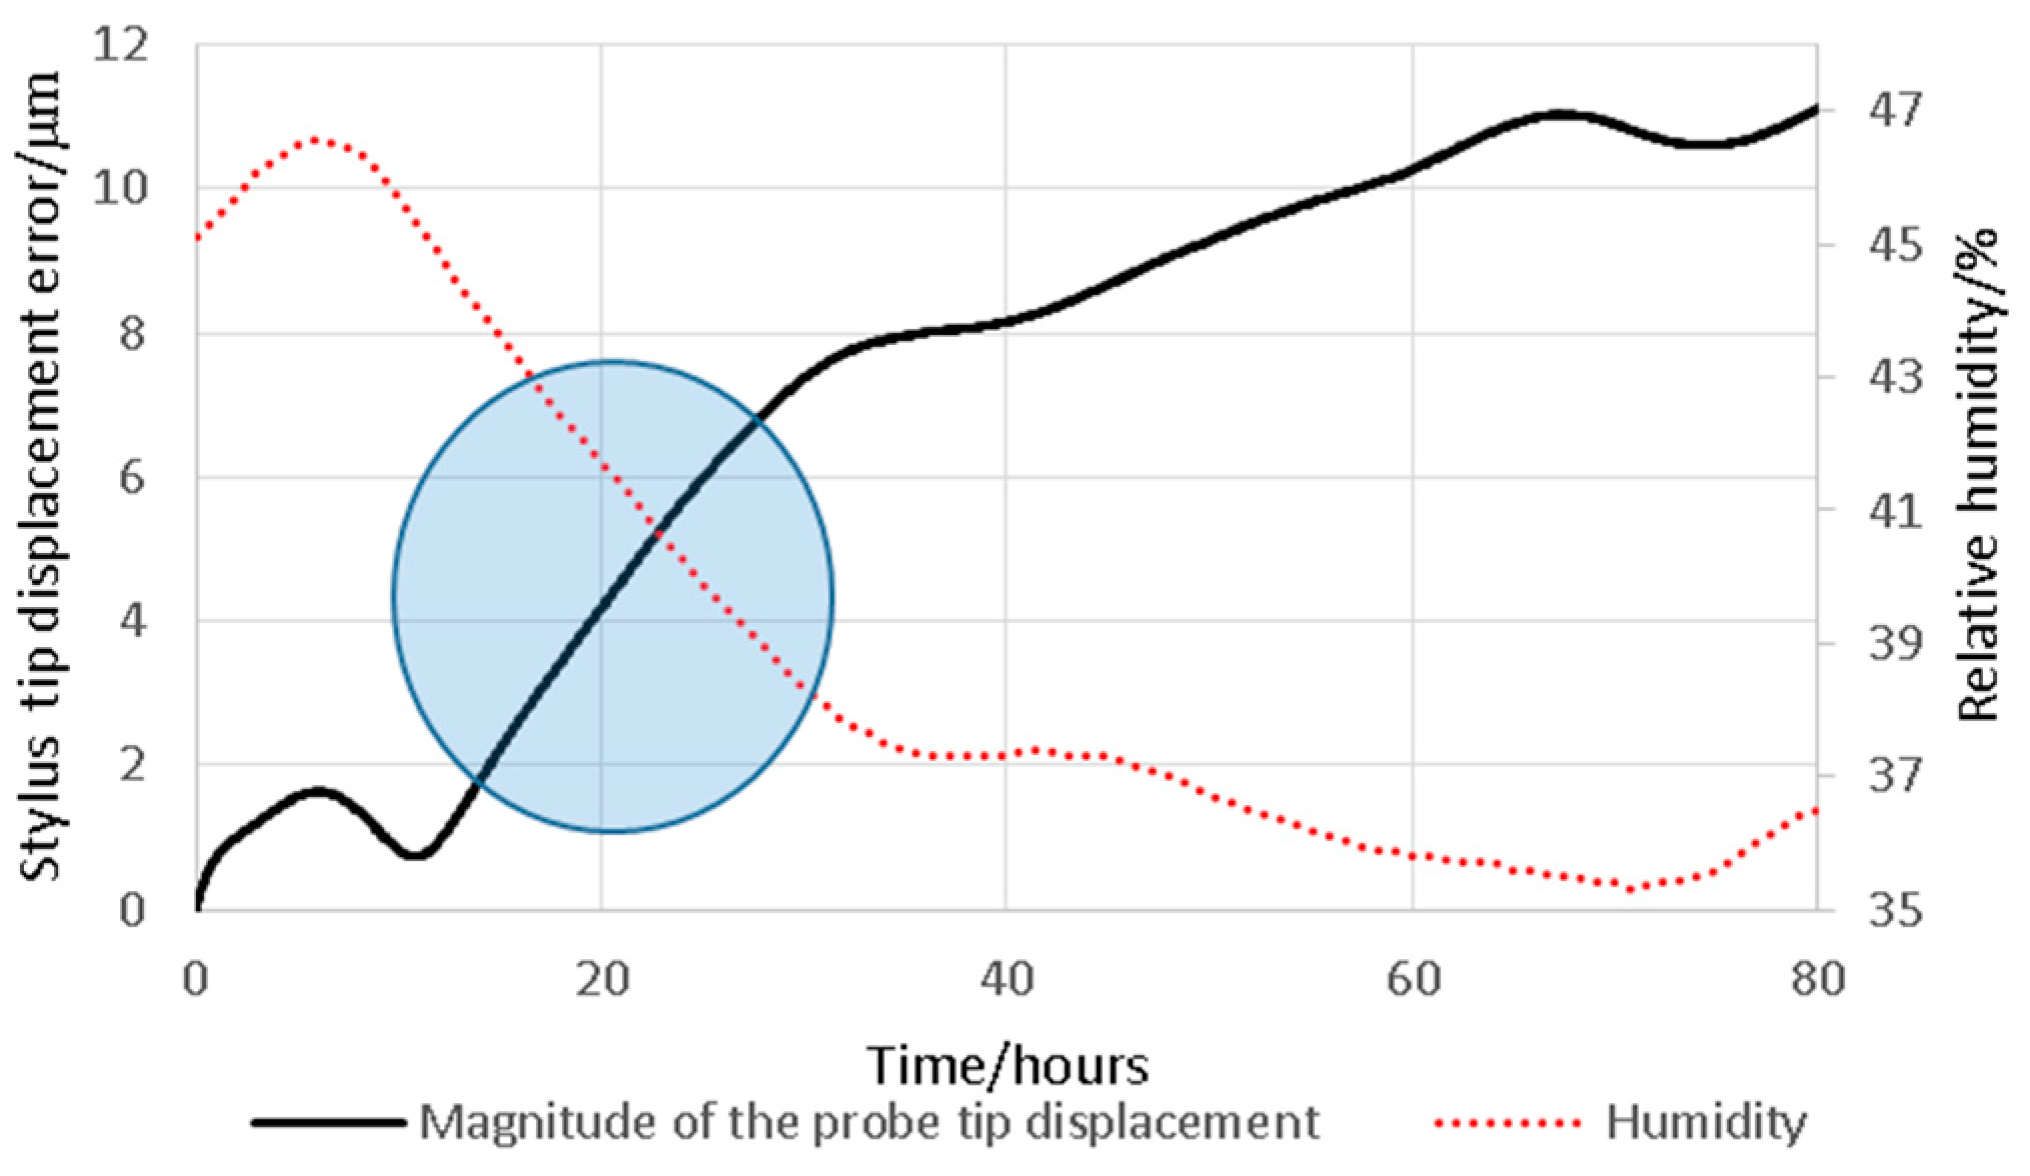
4.1. Environmental Long-Term Stability
4.2. Performance in Stiff Mode
4.3. Repeatability in the Stiff Mode
4.4. Performance in Flexible Mode
4.5. Repeatability of Flexible Mode Probing
5. Discussion
6. Outlook and Future Work
Acknowledgments
Author Contributions
Conflicts of Interest
References
- Claverley, J.D.; Leach, R.K. A review of the existing performance verification infrastructure for micro-CMMs. Precis. Eng. 2015, 39, 1–15. [Google Scholar] [CrossRef]
- Flack, D.; Claverley, J.; Leach, R. Chapter 9—Coordinate Metrology. In Fundamental Principles of Engineering Nanometrolog, 2nd ed.; Leach, R., Ed.; William Andrew Publishing: Oxford, UK, 2014; pp. 295–325. [Google Scholar]
- Bos, E.J.C. Aspects of tactile probing on the micro scale. Precis. Eng. 2011, 35, 228–240. [Google Scholar] [CrossRef]
- Murakami, H.; Katsuki, A.; Sajima, T.; Suematsu, T. Study of a vibrating fiber probing system for 3-D micro-structures: Performance improvement. Meas. Sci. Technol. 2014, 25, 094010. [Google Scholar] [CrossRef]
- Weckenmann, A.; Peggs, G.; Hoffmann, J. Probing systems for dimensional micro- and nano-metrology. Meas. Sci. Technol. 2006, 17, 504. [Google Scholar] [CrossRef]
- Küng, A.; Meli, F. Comparison of three independent calibration methods applied to an ultra-precision micro-CMM. In Proceedings of the International Conference of the European Society for Precision Engineering & Nanotechnology, Bremen, Germany, 20–24 May 2007.
- Lei, L.; Deng, L.; Fan, G.; Cai, X.; Li, Y.; Li, T. A 3D micro tactile sensor for dimensional metrology of micro structure with nanometer precision. Measurement 2014, 48, 155–161. [Google Scholar] [CrossRef]
- Li, R.-J.; Fan, K.-C.; Miao, J.-W.; Huang, Q.-X.; Tao, S.; Gong, E.-M. An analogue contact probe using a compact 3D optical sensor for micro/nano coordinate?measuring machines. Meas. Sci. Technol. 2014, 25, 094008. [Google Scholar] [CrossRef]
- Claverley, J.; Leach, R. A vibrating micro-scale CMM probe for measuring high aspect ratio structures. Microsyst. Technol. 2010, 16, 1507–1512. [Google Scholar] [CrossRef]
- Claverley, J.D.; Leach, R.K. Development of a three-dimensional vibrating tactile probe for miniature CMMs. Precis. Eng. 2013, 37, 491–499. [Google Scholar] [CrossRef]
- Alblalaihid, K.; Kinnell, P.; Lawes, S. Fabrication and characterisation of a novel smart suspension for micro-CMM probes. Sens. Actuators A Phys. 2015, 232, 368–375. [Google Scholar] [CrossRef] [Green Version]
- Alblalaihid, K.; Lawes, S.; Kinnell, P. Variable stiffness probing systems for micro-coordinate measuring machines. Precis. Eng. 2016, 43, 262–269. [Google Scholar] [CrossRef] [Green Version]
- Main, J.A.; Garcia, E.; Newton, D.V. Precision position control of piezoelectric actuators using charge feedback. J. Guid. Control Dyn. 1995, 18, 1068–1073. [Google Scholar] [CrossRef]
- Goldfarb, M.; Celanovic, N. Behavioral implications of piezoelectric stack actuators for control of micromanipulation. In Proceedings of the IEEE International Conference on Robotics and Automation, Minneapolis, MN, USA, 22–28 April 1996; pp. 226–231.
- Physik Instrumente. P-611.Z Piezo Z Stage. Available online: http://www.physikinstrumente.com/download/PI_Datasheet_P-611_Z_20150122.pdf (accessed on 6 April 2016).
- Lipscomb, I.P.; Weaver, P.M.; Swingler, J.; McBride, J.W. The effect of relative humidity, temperature and electrical field on leakage currents in piezo-ceramic actuators under dc bias. Sens. Actuators A Phys. 2009, 151, 179–186. [Google Scholar] [CrossRef]
- Lazarus, N.; Bedair, S.S.; Lo, C.C.; Fedder, G.K. CMOS-MEMS Capacitive Humidity Sensor. J. Microelectromech. Syst. 2010, 19, 183–191. [Google Scholar] [CrossRef]
- Jae-jun, P.; Kihwan, K.; Nahmgyoo, C. Development of a coordinate measuring machine (CMM) touch probe using a multi-axis force sensor. Meas. Sci. Technol. 2006, 17, 2380. [Google Scholar]
- Bos, E.J.C. Tactile 3D Probing System for Measuring MEMS with Nanometer Uncertainty. Ph.D. Thesis, Eindhoven University of Technology, Eindhoven, The Netherlands, 2008. [Google Scholar]
- Henmi, N. An Open-Loop Positioning Method for Reduction of Influence of Nonlinearities in Piezoelectric Actuator. J. Adv. Mech. Des. Syst. Manuf. 2011, 5, 70–79. [Google Scholar] [CrossRef]
- Kinnell, P.; Alblalaihid, K.; Lawes, S. Variable Stiffness Micro-Scale Tactile Probing System. Figshare. Available online: https://dx.doi.org/10.17028/rd.lboro.2061846 (accessed on 6 April 2016).

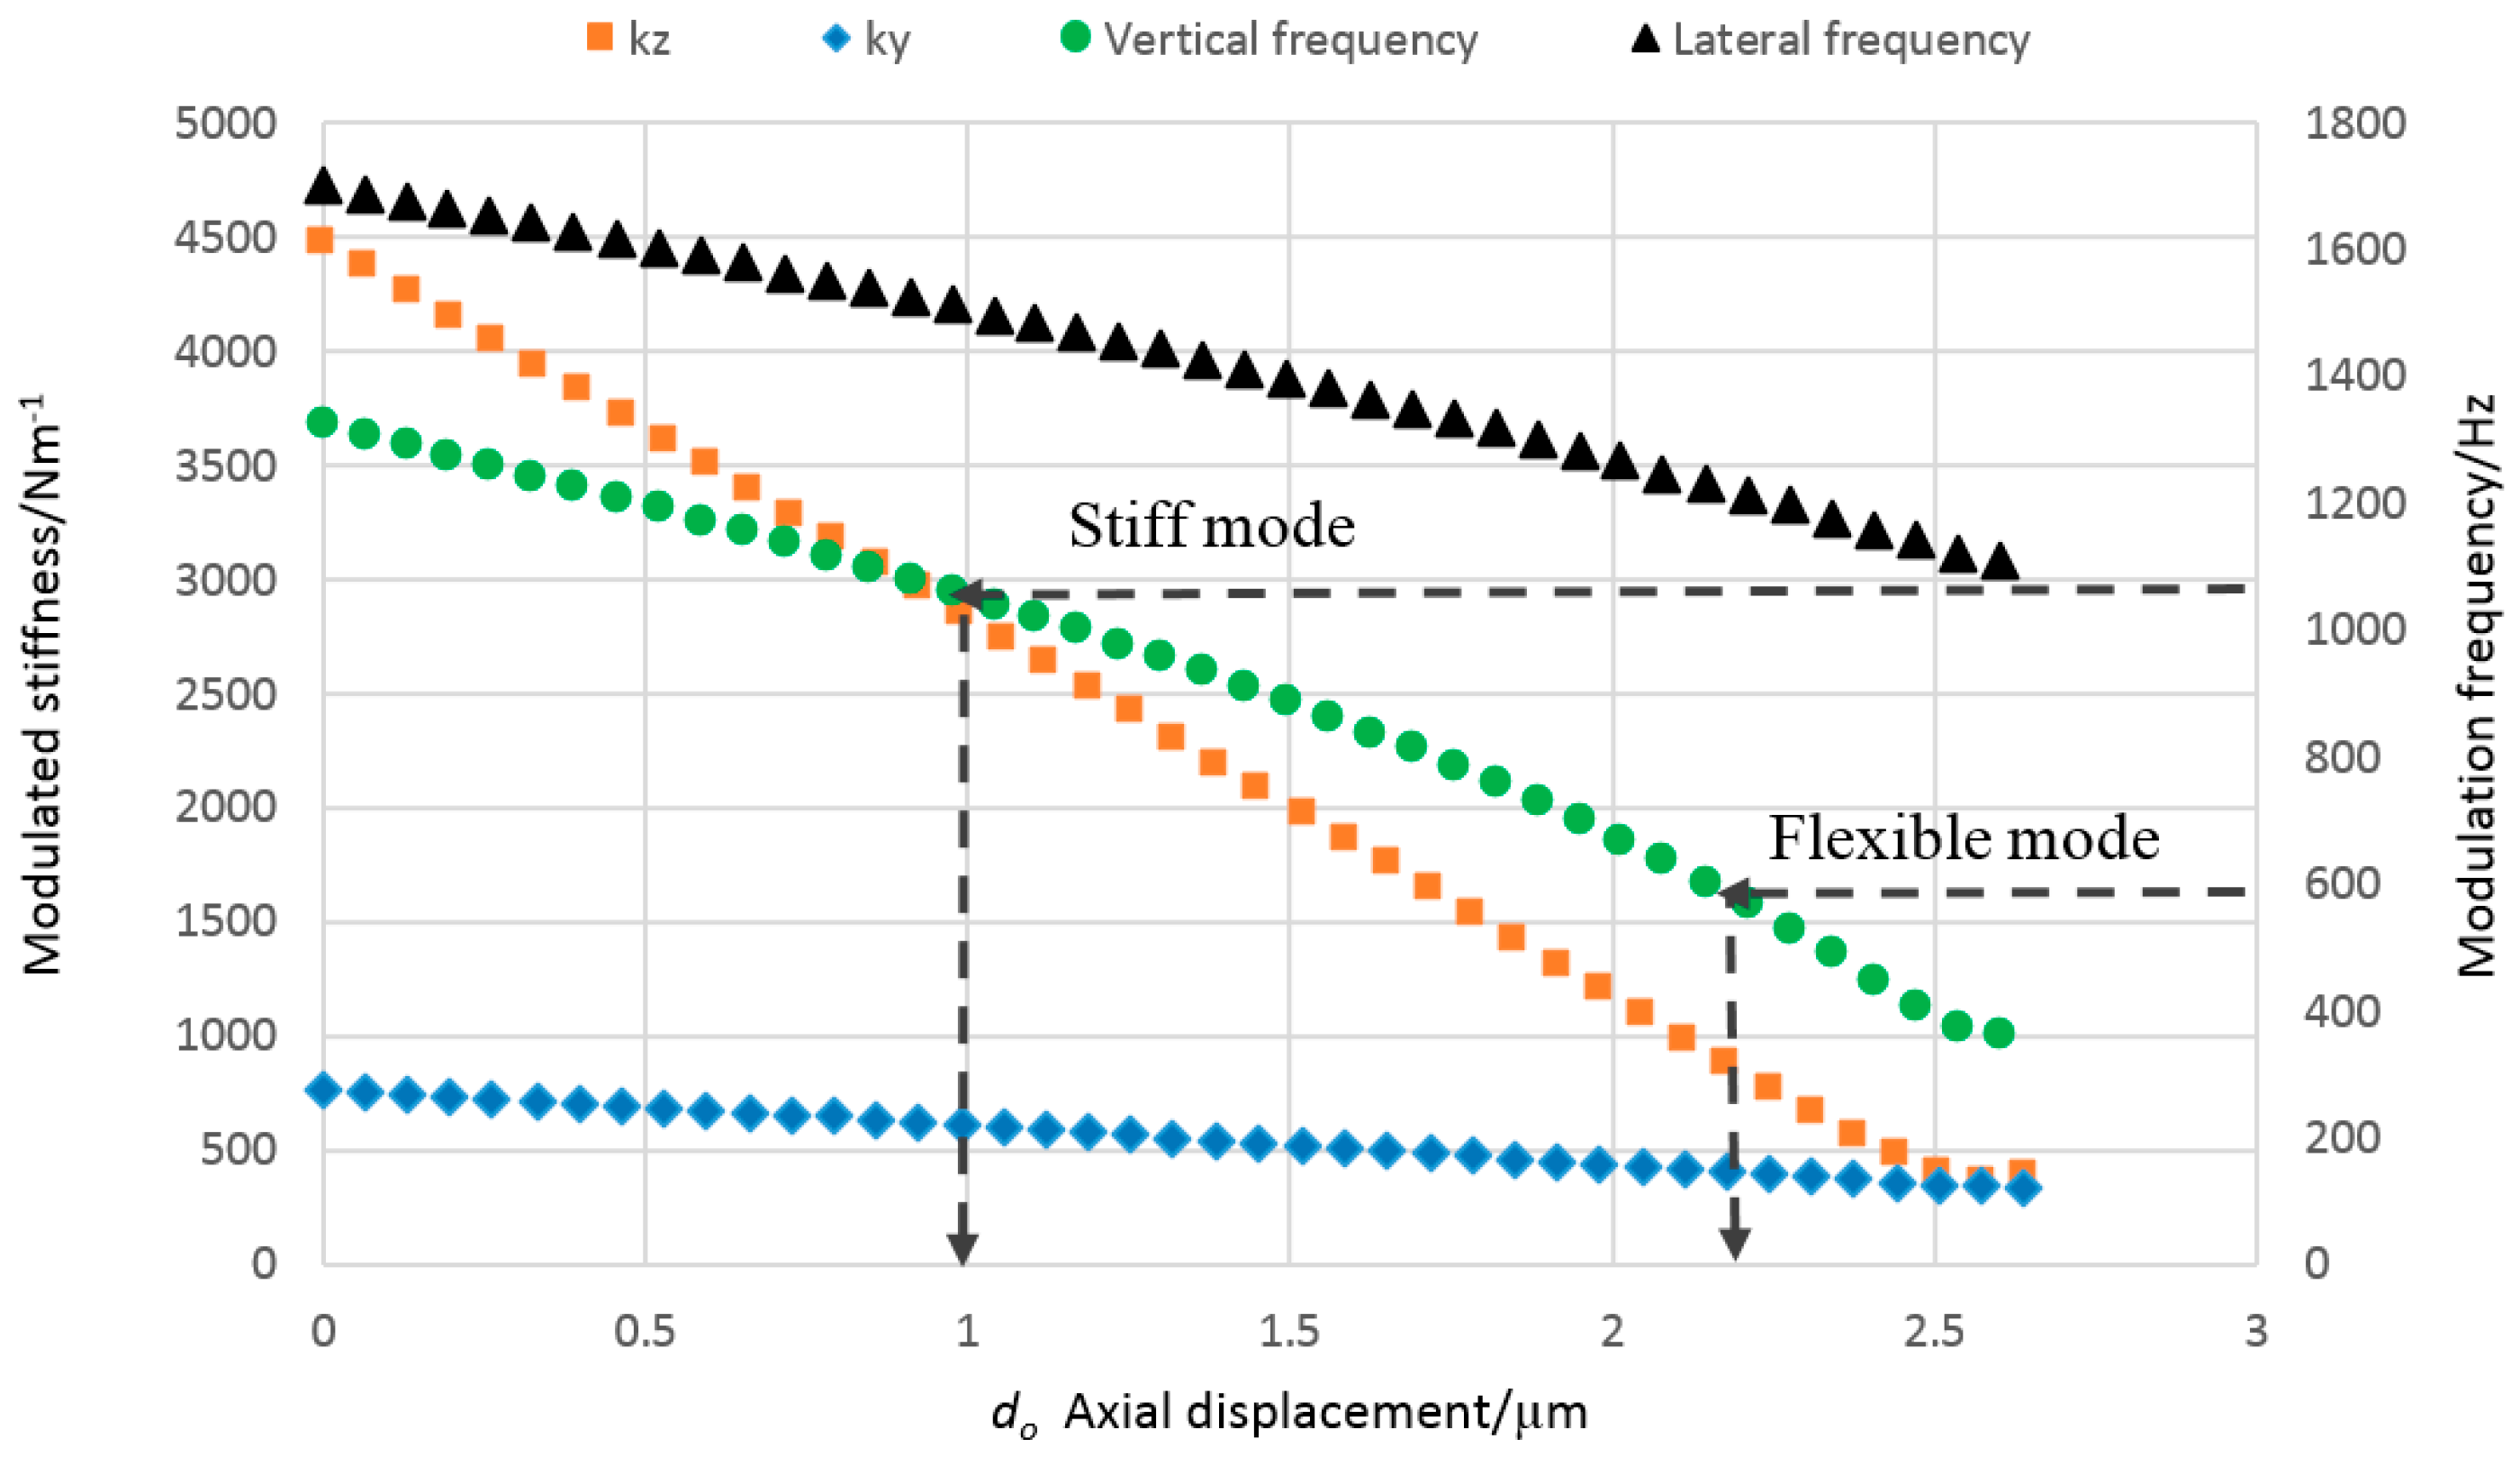



| Mode | Time Period/ms | DC Voltage Range/V | AC Voltage/V | Tuned Frequency/Hz | Sweeping Frequency Range/Hz |
|---|---|---|---|---|---|
| Stiff | 51 | 5–10 | 0.3 | 1057 | 1050–1060 |
| Flexible | 51 | 41–55 | 0.1 | 600 | 595–605 |
| Item | Calibration Coefficients for Direction 1 (mV·µm−1) | Calibration Coefficients for Direction 2 (mV·µm−1) | ||
|---|---|---|---|---|
| First trial | Second trial | First trial | Second trial | |
| Sensor A | ||||
| Sensor B | ||||
| Sensor C | ||||
| Axis | x | y | z | |||
|---|---|---|---|---|---|---|
| Mode | Stiff | Flexible | Stiff | Flexible | Stiff | Flexible |
| Standard deviation/nm | 3 | 2 | 3 | 1 | 6 | 12 |
| Axis | y | z | ||
|---|---|---|---|---|
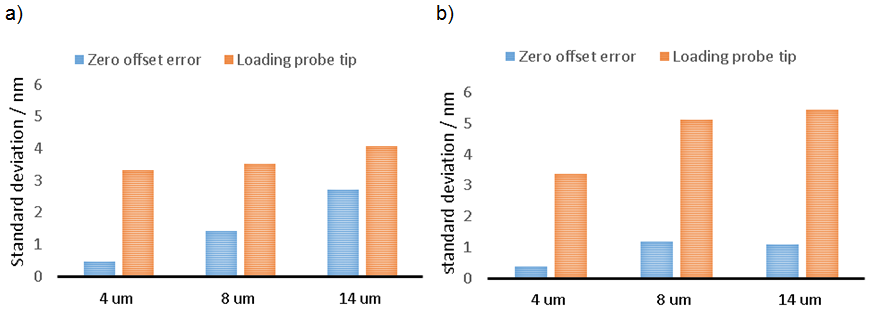
| Type of error | Zero off-set position | Nominal 4 µm displacement position | Zero off-set position | Nominal 4 µm displacement position |
| Standard deviation/nm | 1 | 3 | 2 | 3 |
© 2016 by the authors; licensee MDPI, Basel, Switzerland. This article is an open access article distributed under the terms and conditions of the Creative Commons by Attribution (CC-BY) license (http://creativecommons.org/licenses/by/4.0/).
Share and Cite
Alblalaihid, K.; Kinnell, P.; Lawes, S.; Desgaches, D.; Leach, R. Performance Assessment of a New Variable Stiffness Probing System for Micro-CMMs. Sensors 2016, 16, 492. https://doi.org/10.3390/s16040492
Alblalaihid K, Kinnell P, Lawes S, Desgaches D, Leach R. Performance Assessment of a New Variable Stiffness Probing System for Micro-CMMs. Sensors. 2016; 16(4):492. https://doi.org/10.3390/s16040492
Chicago/Turabian StyleAlblalaihid, Khalid, Peter Kinnell, Simon Lawes, Dorian Desgaches, and Richard Leach. 2016. "Performance Assessment of a New Variable Stiffness Probing System for Micro-CMMs" Sensors 16, no. 4: 492. https://doi.org/10.3390/s16040492
APA StyleAlblalaihid, K., Kinnell, P., Lawes, S., Desgaches, D., & Leach, R. (2016). Performance Assessment of a New Variable Stiffness Probing System for Micro-CMMs. Sensors, 16(4), 492. https://doi.org/10.3390/s16040492


