The effect of different types of interference sources and array processing approaches are now studied through simulations. Simulations were carried out considering different interference types. In order to evaluate the effect of different kinds of interference and different beamforming methods, it is assumed that only one interference source is present at the time in each simulation scenario. The interference sources considered are Continuous Wave (CW) interference, chirp interference, and band-limited additive white Gaussian noise. The effect of these interference sources on GNSS receiver operation differs due to their spectral characteristics. Therefore, it is of interest to check the performance of the array based receiver under different interference types. Even though the power and the number of interference sources eventually affect beamformer performance, the main goal here is to compare PM and MPDR beamformers for high precision applications.
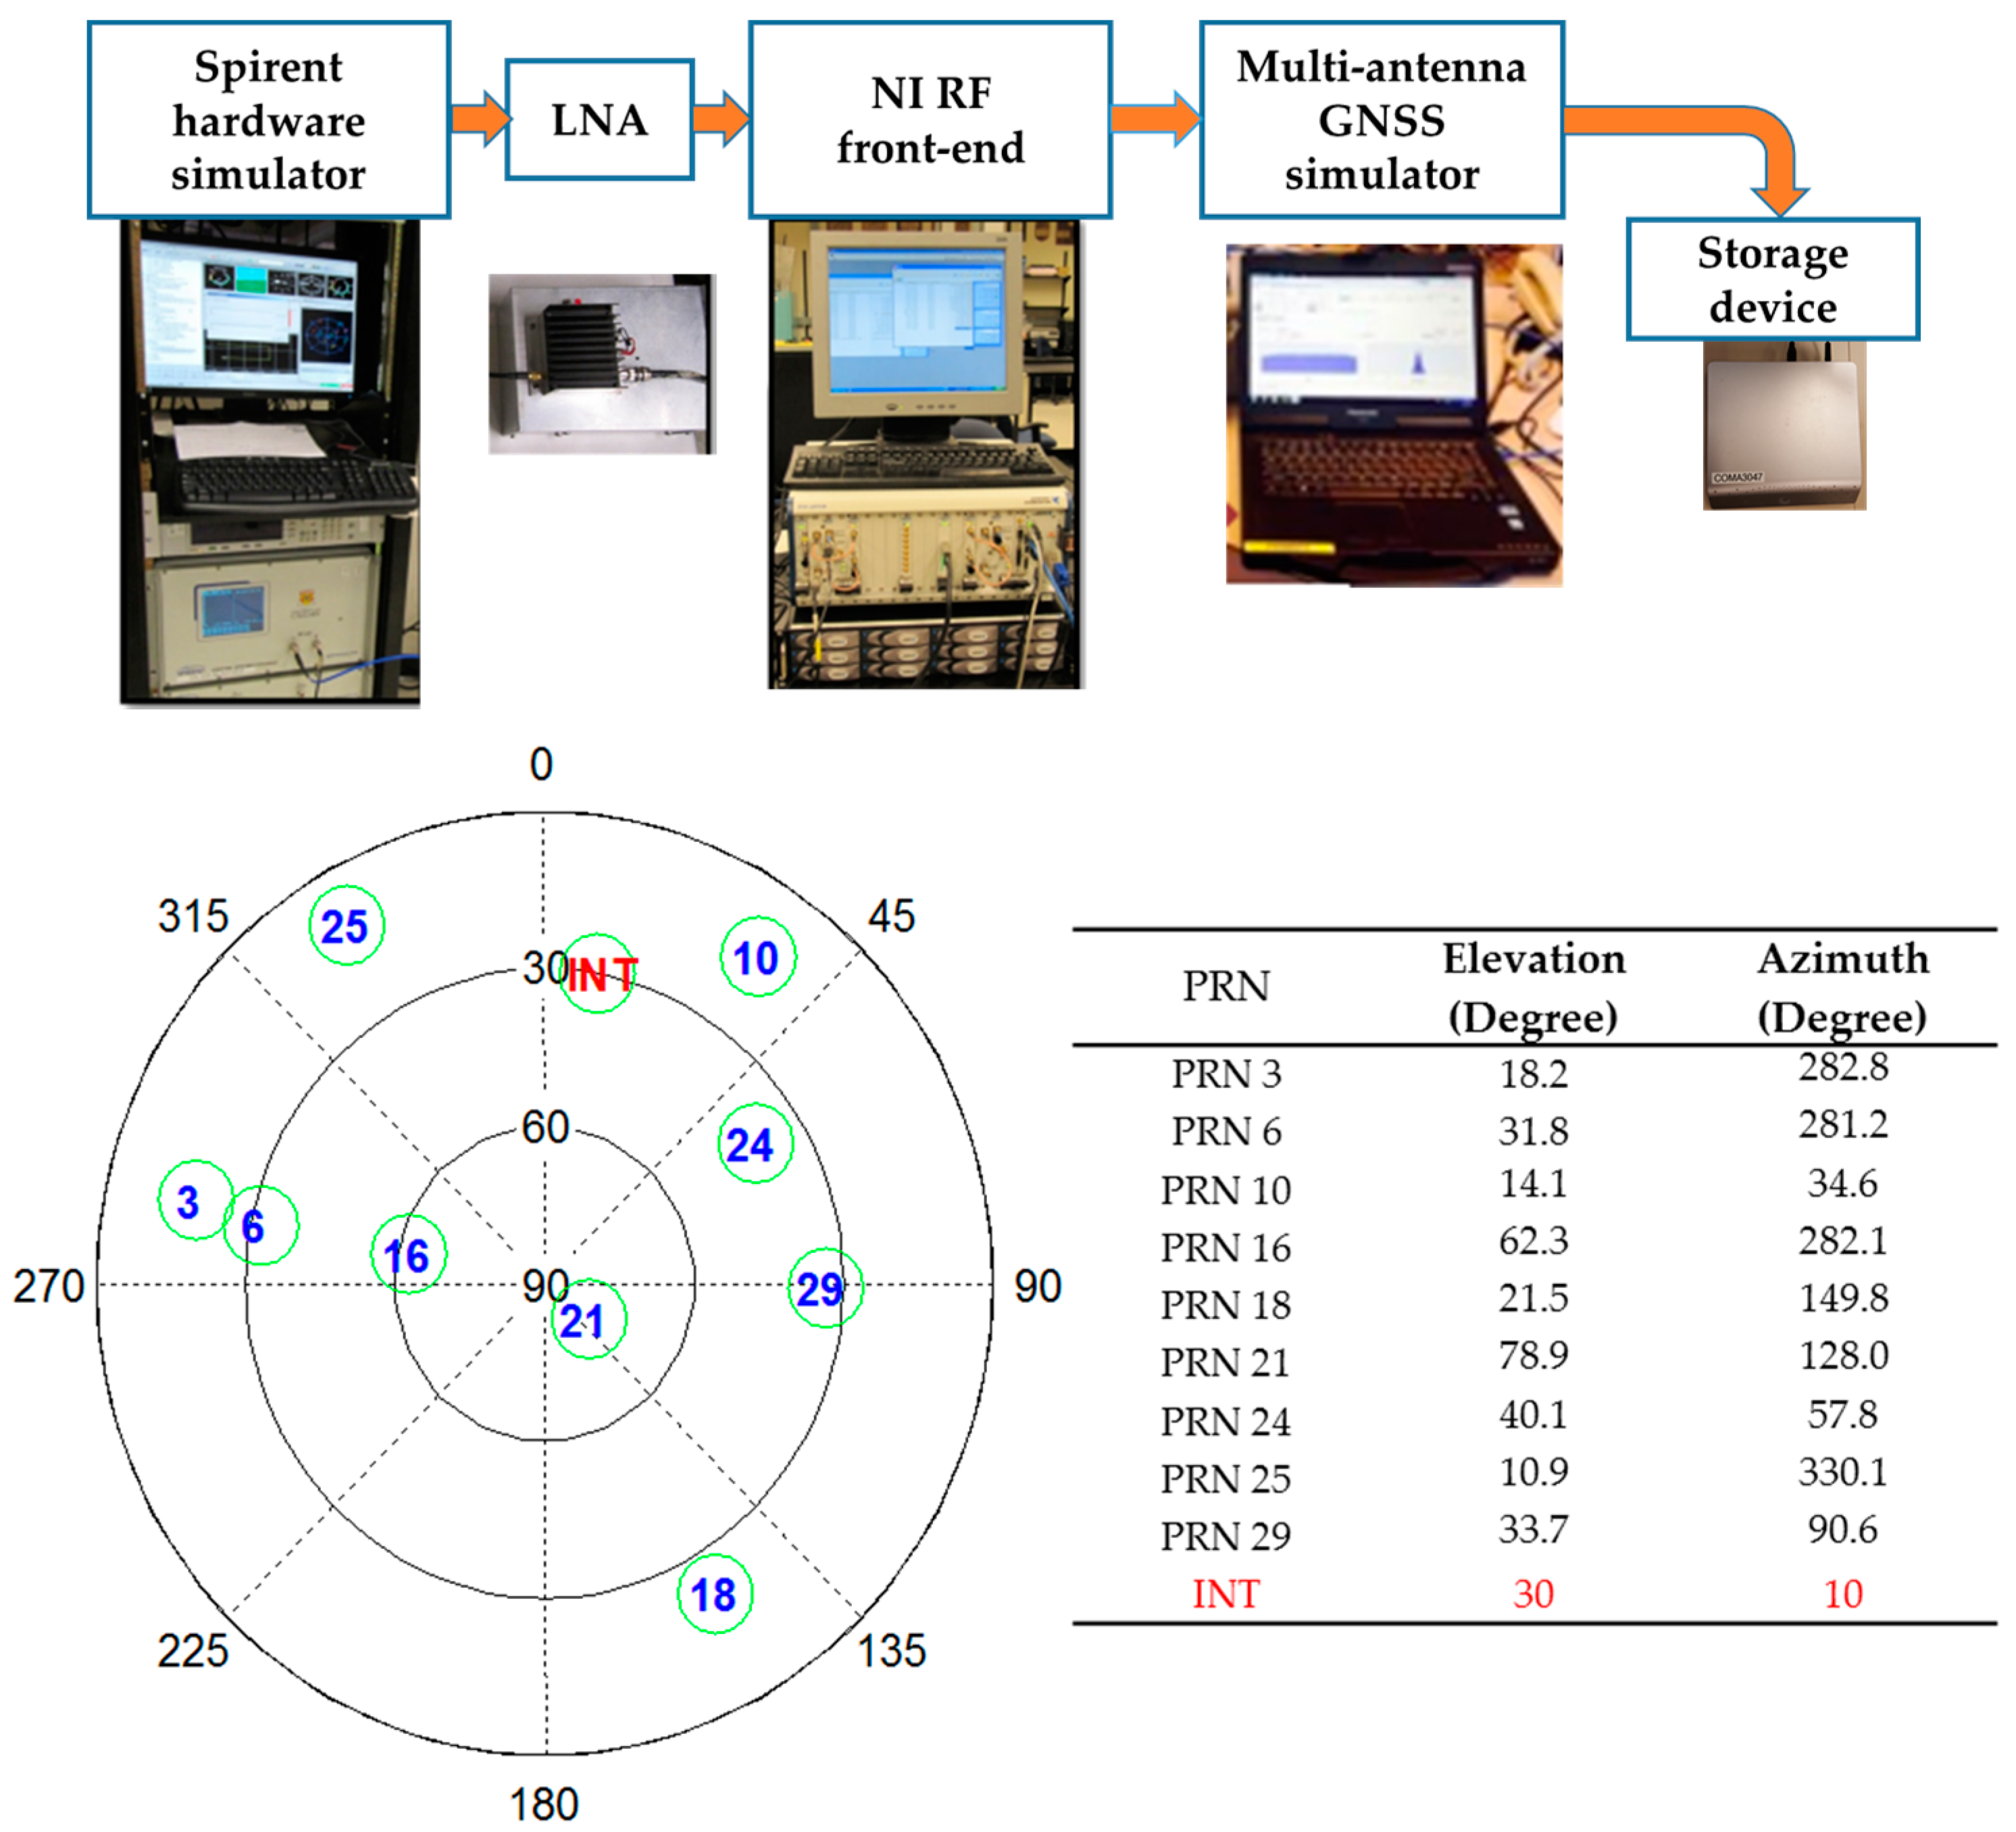
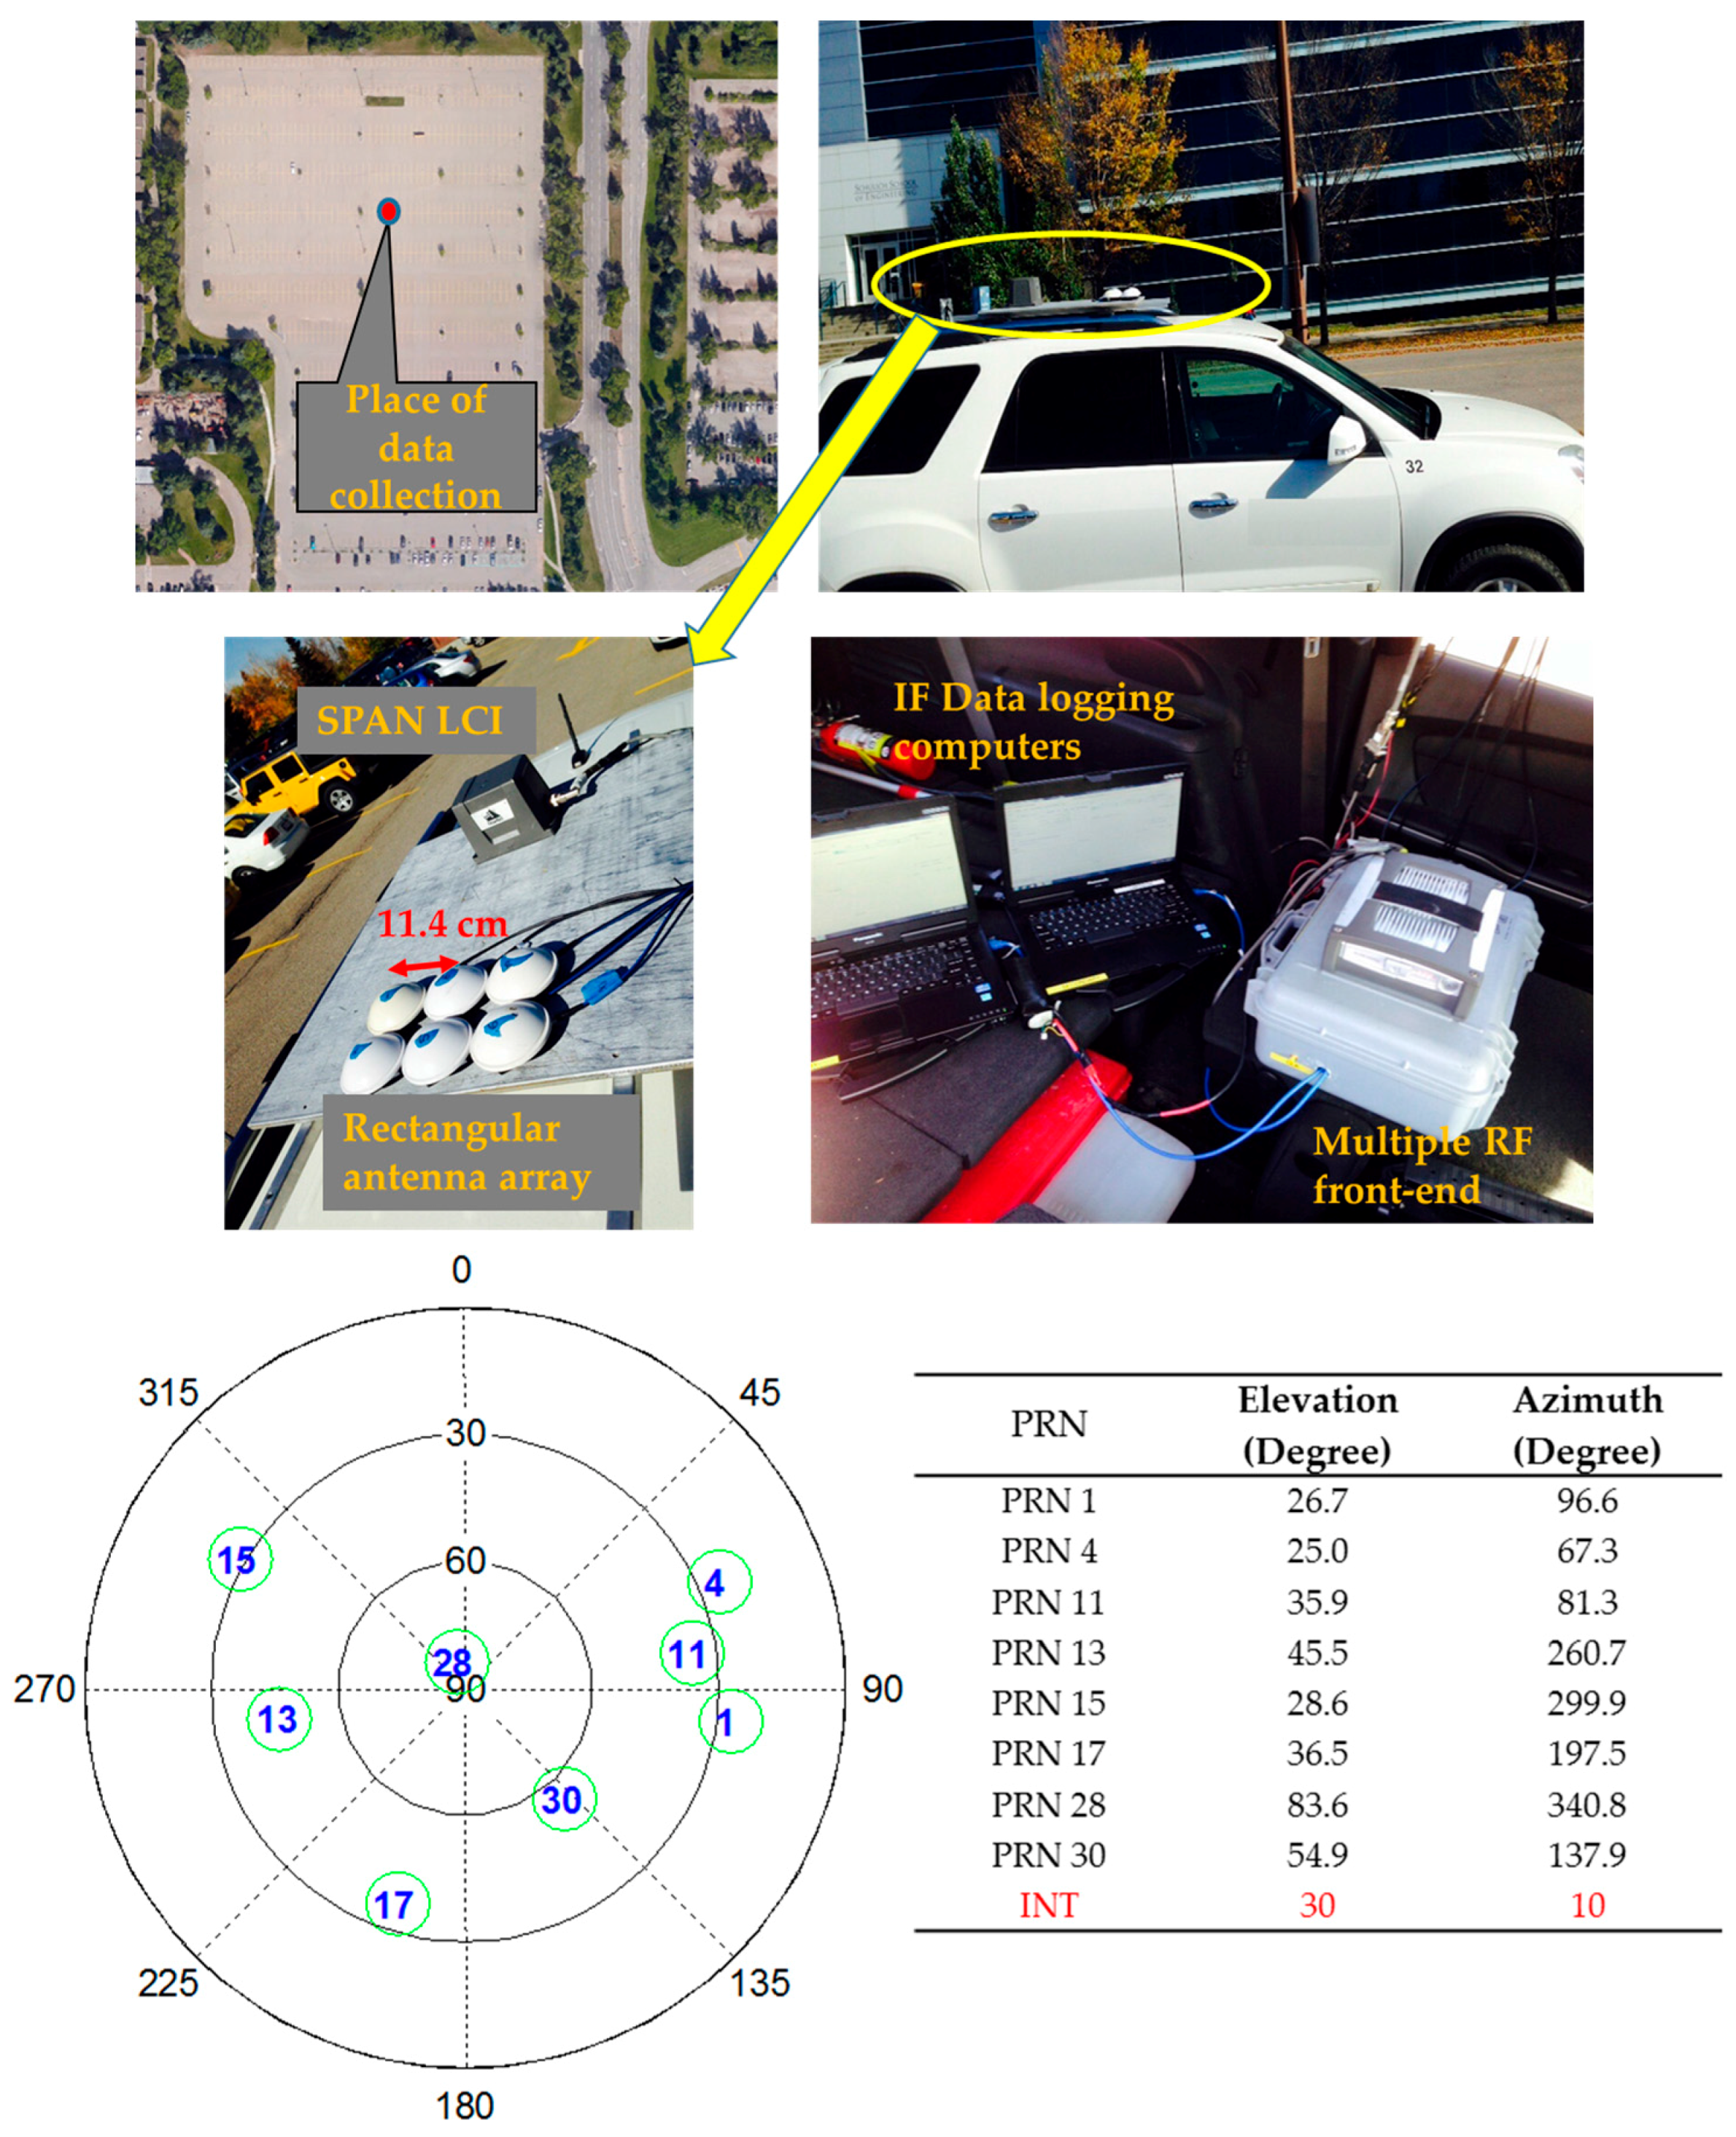
The input IF data file for the multi-antenna software simulator was collected using a Spirent hardware GPS simulator [
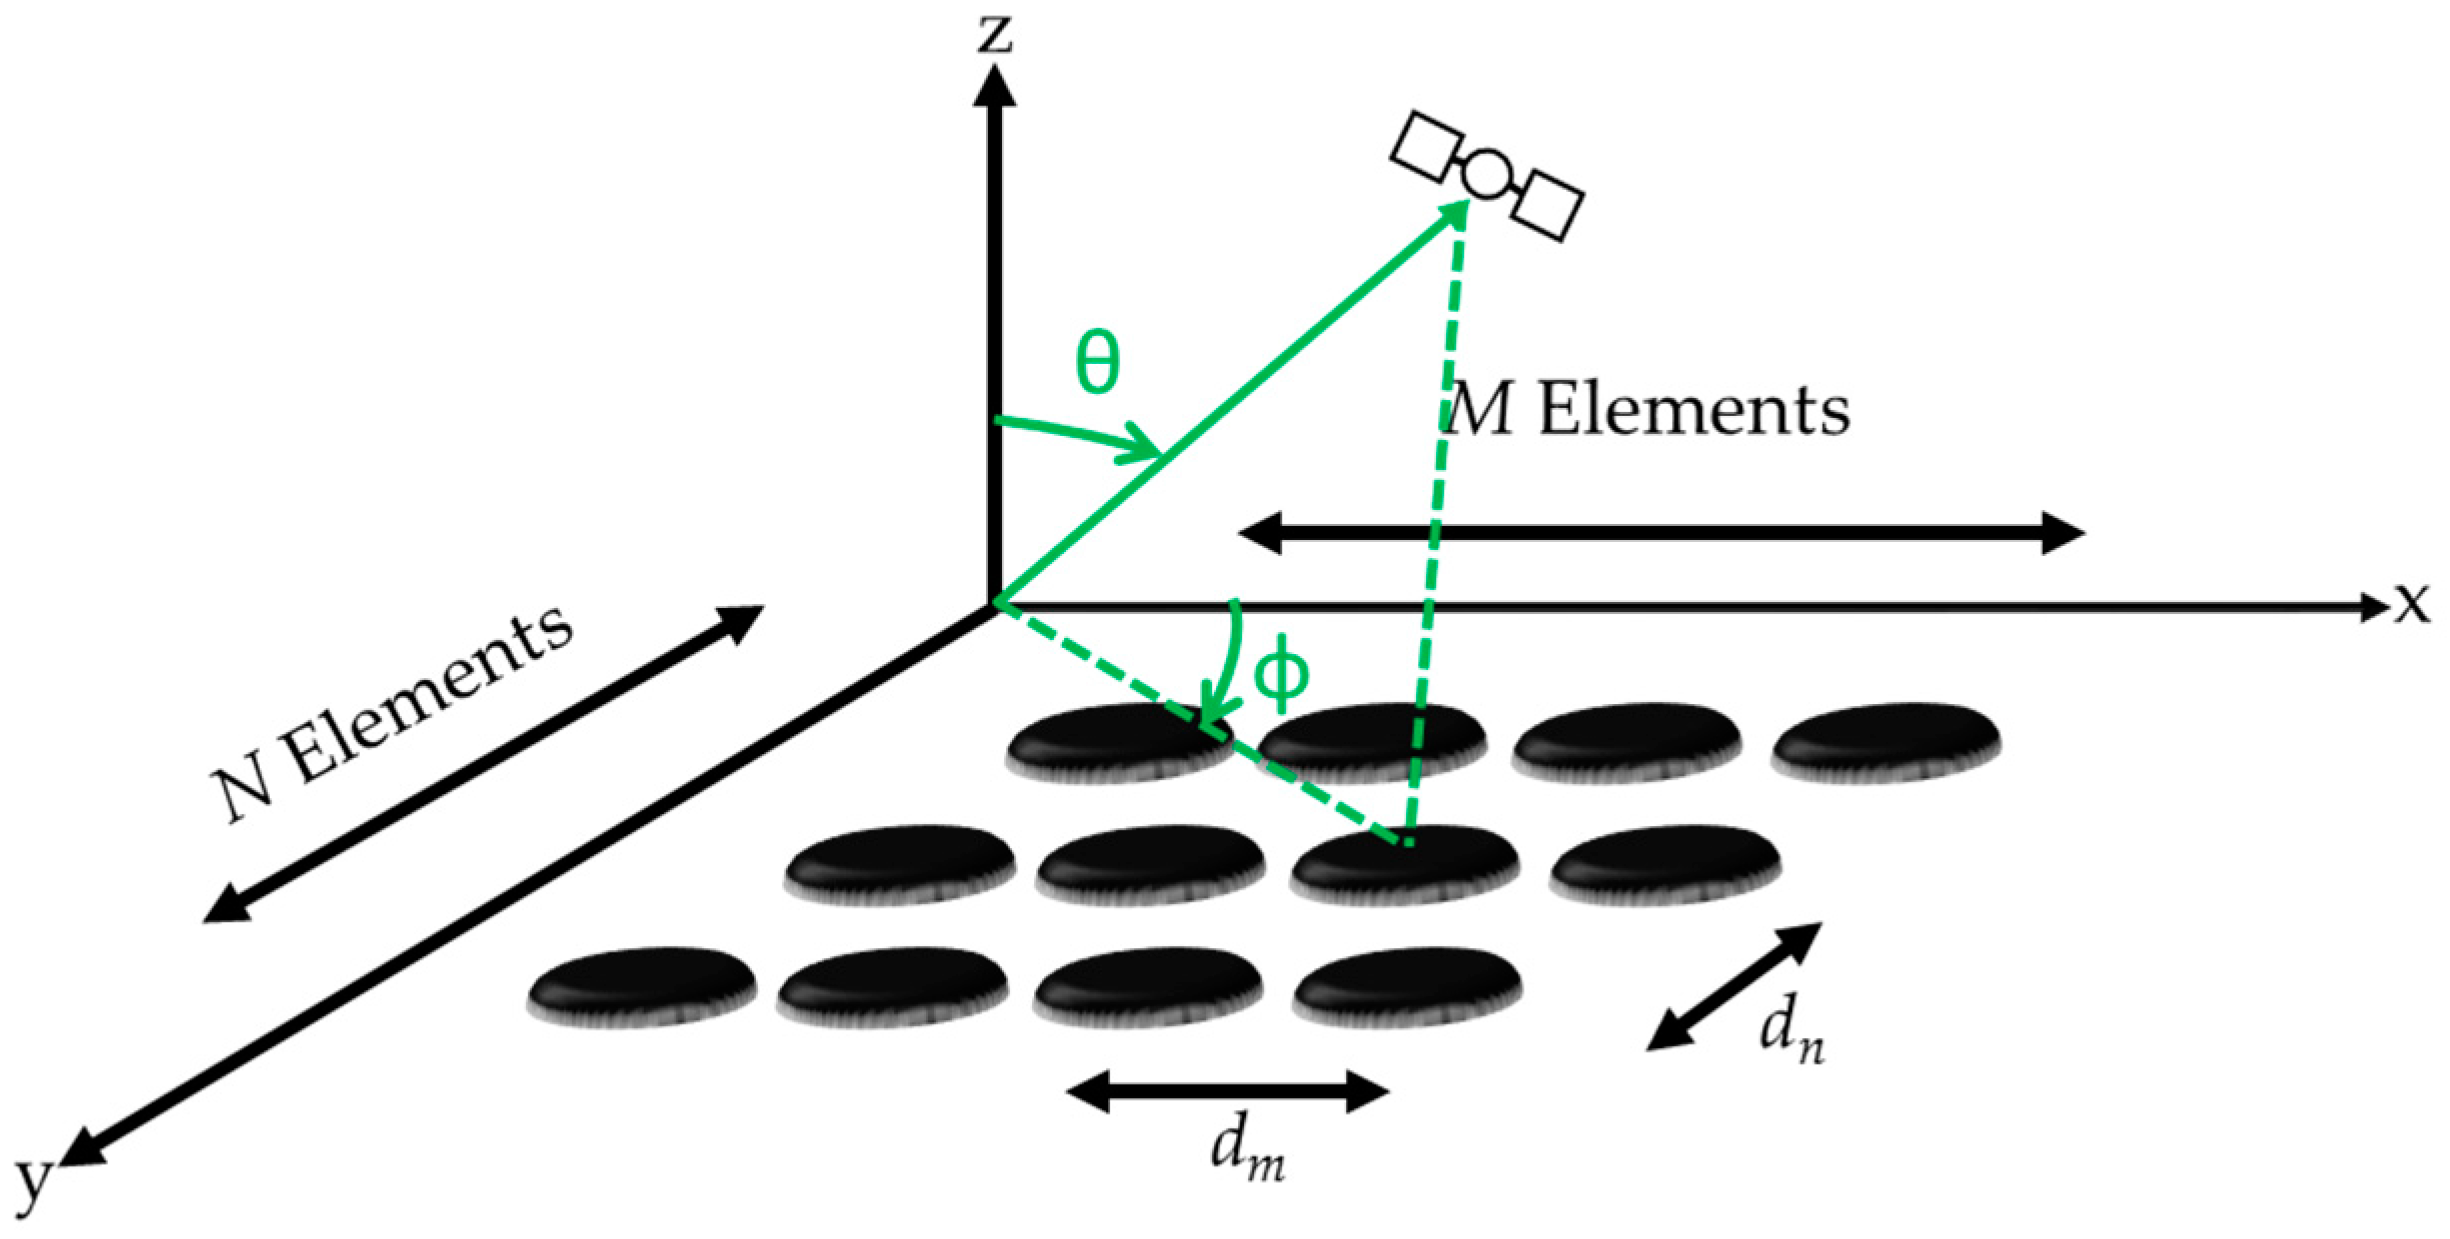
28] by disabling multipath and atmospheric errors. A static user scenario was used for collecting IF data samples at a 5 MHz sampling rate. The multi-antenna GPS signals were generated using the multi-antenna signal simulator and interference was added later to the clean IF samples. The six-element rectangular antenna array described earlier was considered for the simulations. The interference source was assumed to be static and was added after 15 s in order for the receiver to acquire and track the signals (for the post-correlation beamforming). The multi-antenna signal simulation method and sky plot of the simulated GPS satellites and interference source direction are shown in
Figure 4. The characteristics of the interference source are given in
Table 1. In all the simulation scenarios, the interference source direction was the same. The C/N
0 values for all PRNs were set to be the same for all the antenna elements (48 dB-Hz).
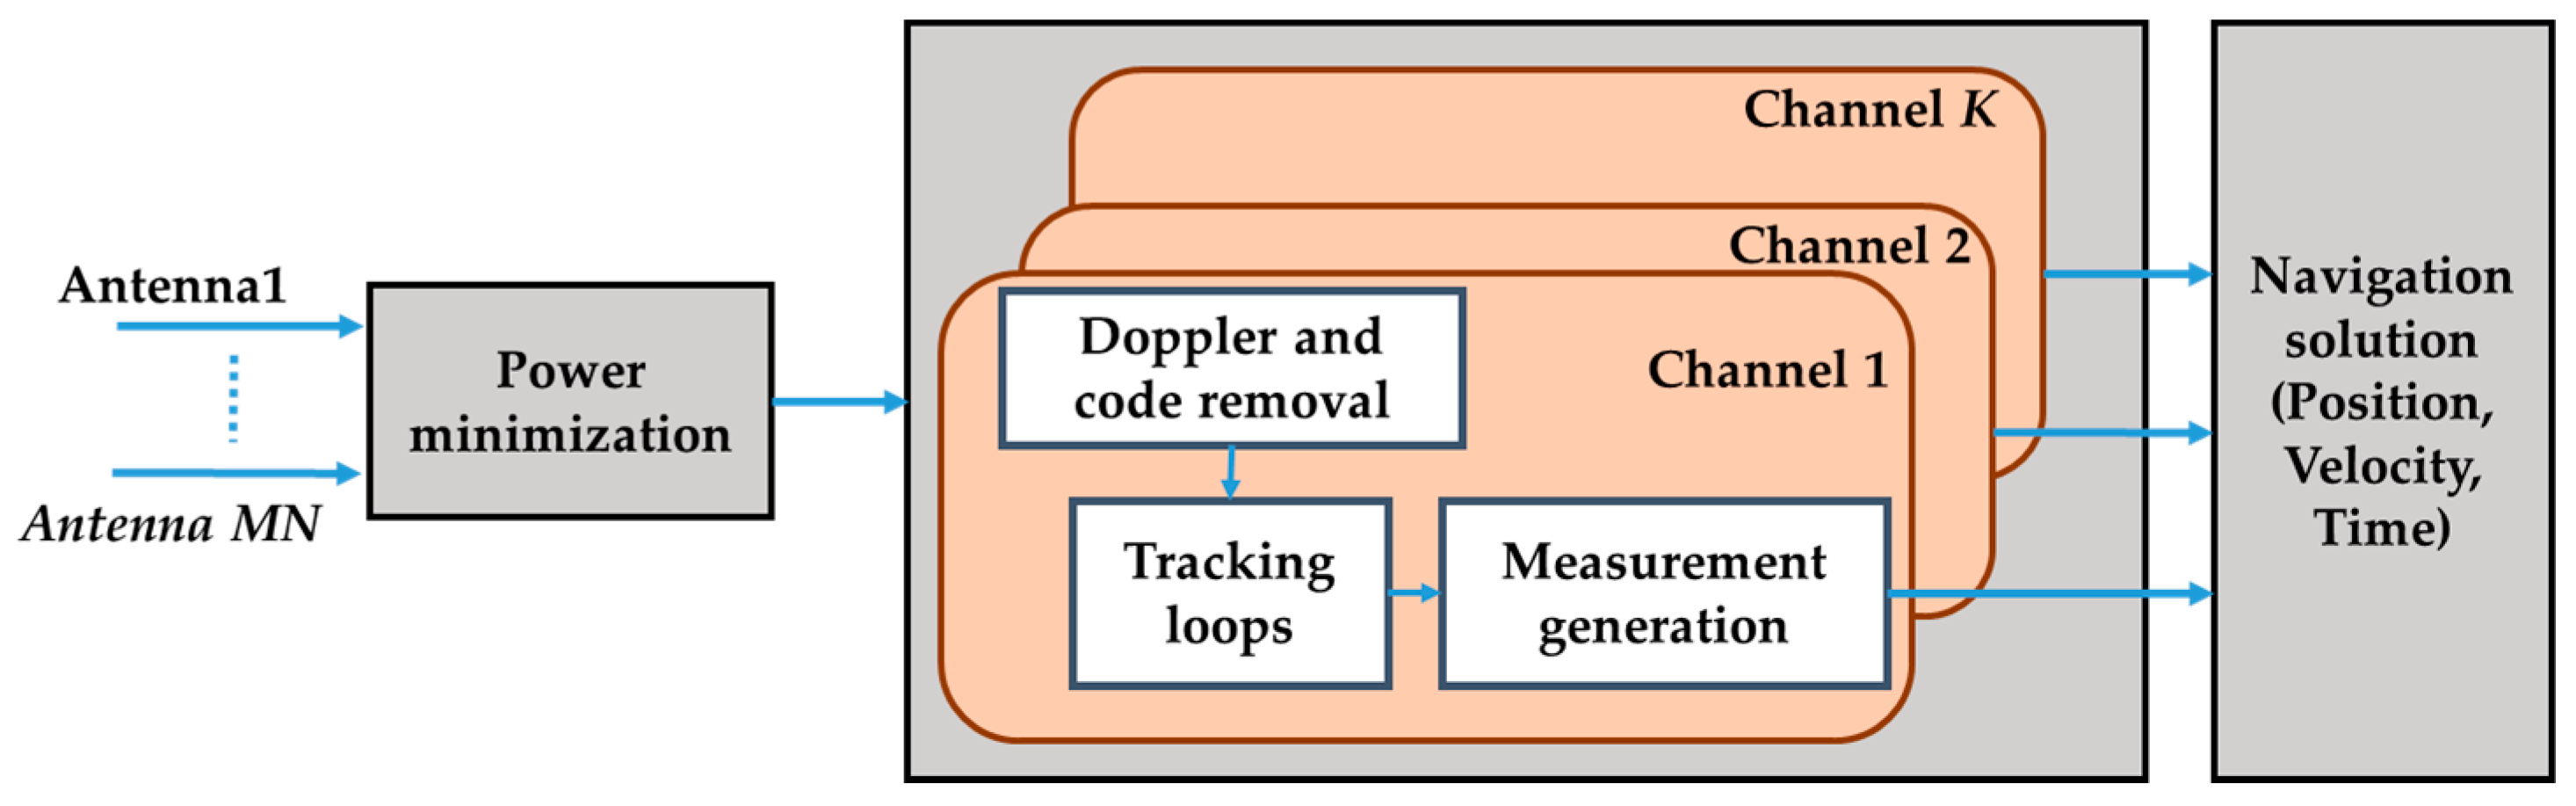
The simulated signals were processed using GSNRx
TM with the architectures shown in
Figure 2 and
Figure 3 to generate tracking and measurement parameters. Here, PM was performed from the beginning of the dataset as it was done in the pre-correlation stage. In the case of the MPDR beamformer, the receiver was made to operate with a single antenna for the initial 10 s, after which beamforming was performed before the occurrence of interference. This was done to ensure that the receiver operates in beamforming mode when interference affects the IF samples. In both PM and MPDR approaches, correlator spacing of 0.4 between early and late arms and non-coherent early-minus late discriminators were used. Carrier tracking was performed using a third order Phase Locked Loop (PLL) with a 15 Hz bandwidth.
3.1. Tracking Domain Analysis
In this section, tracking performance in terms of carrier Doppler estimation, C/N
0 and Phase Lock Indicator (PLI) is evaluated. The C/N
0 is computed using narrow band power and wide band power of the prompt correlation values and PLI is computed using prompt in-phase and quadrature-phase values [
29]. Initially, the signal affected by interference from the reference antenna of the array was processed and the corresponding results are discussed in subsequent sections. Since PRN 6 and PRN 16 are more affected by CW interference, these two PRNs are used to analyze tracking performance of the array-based receiver.
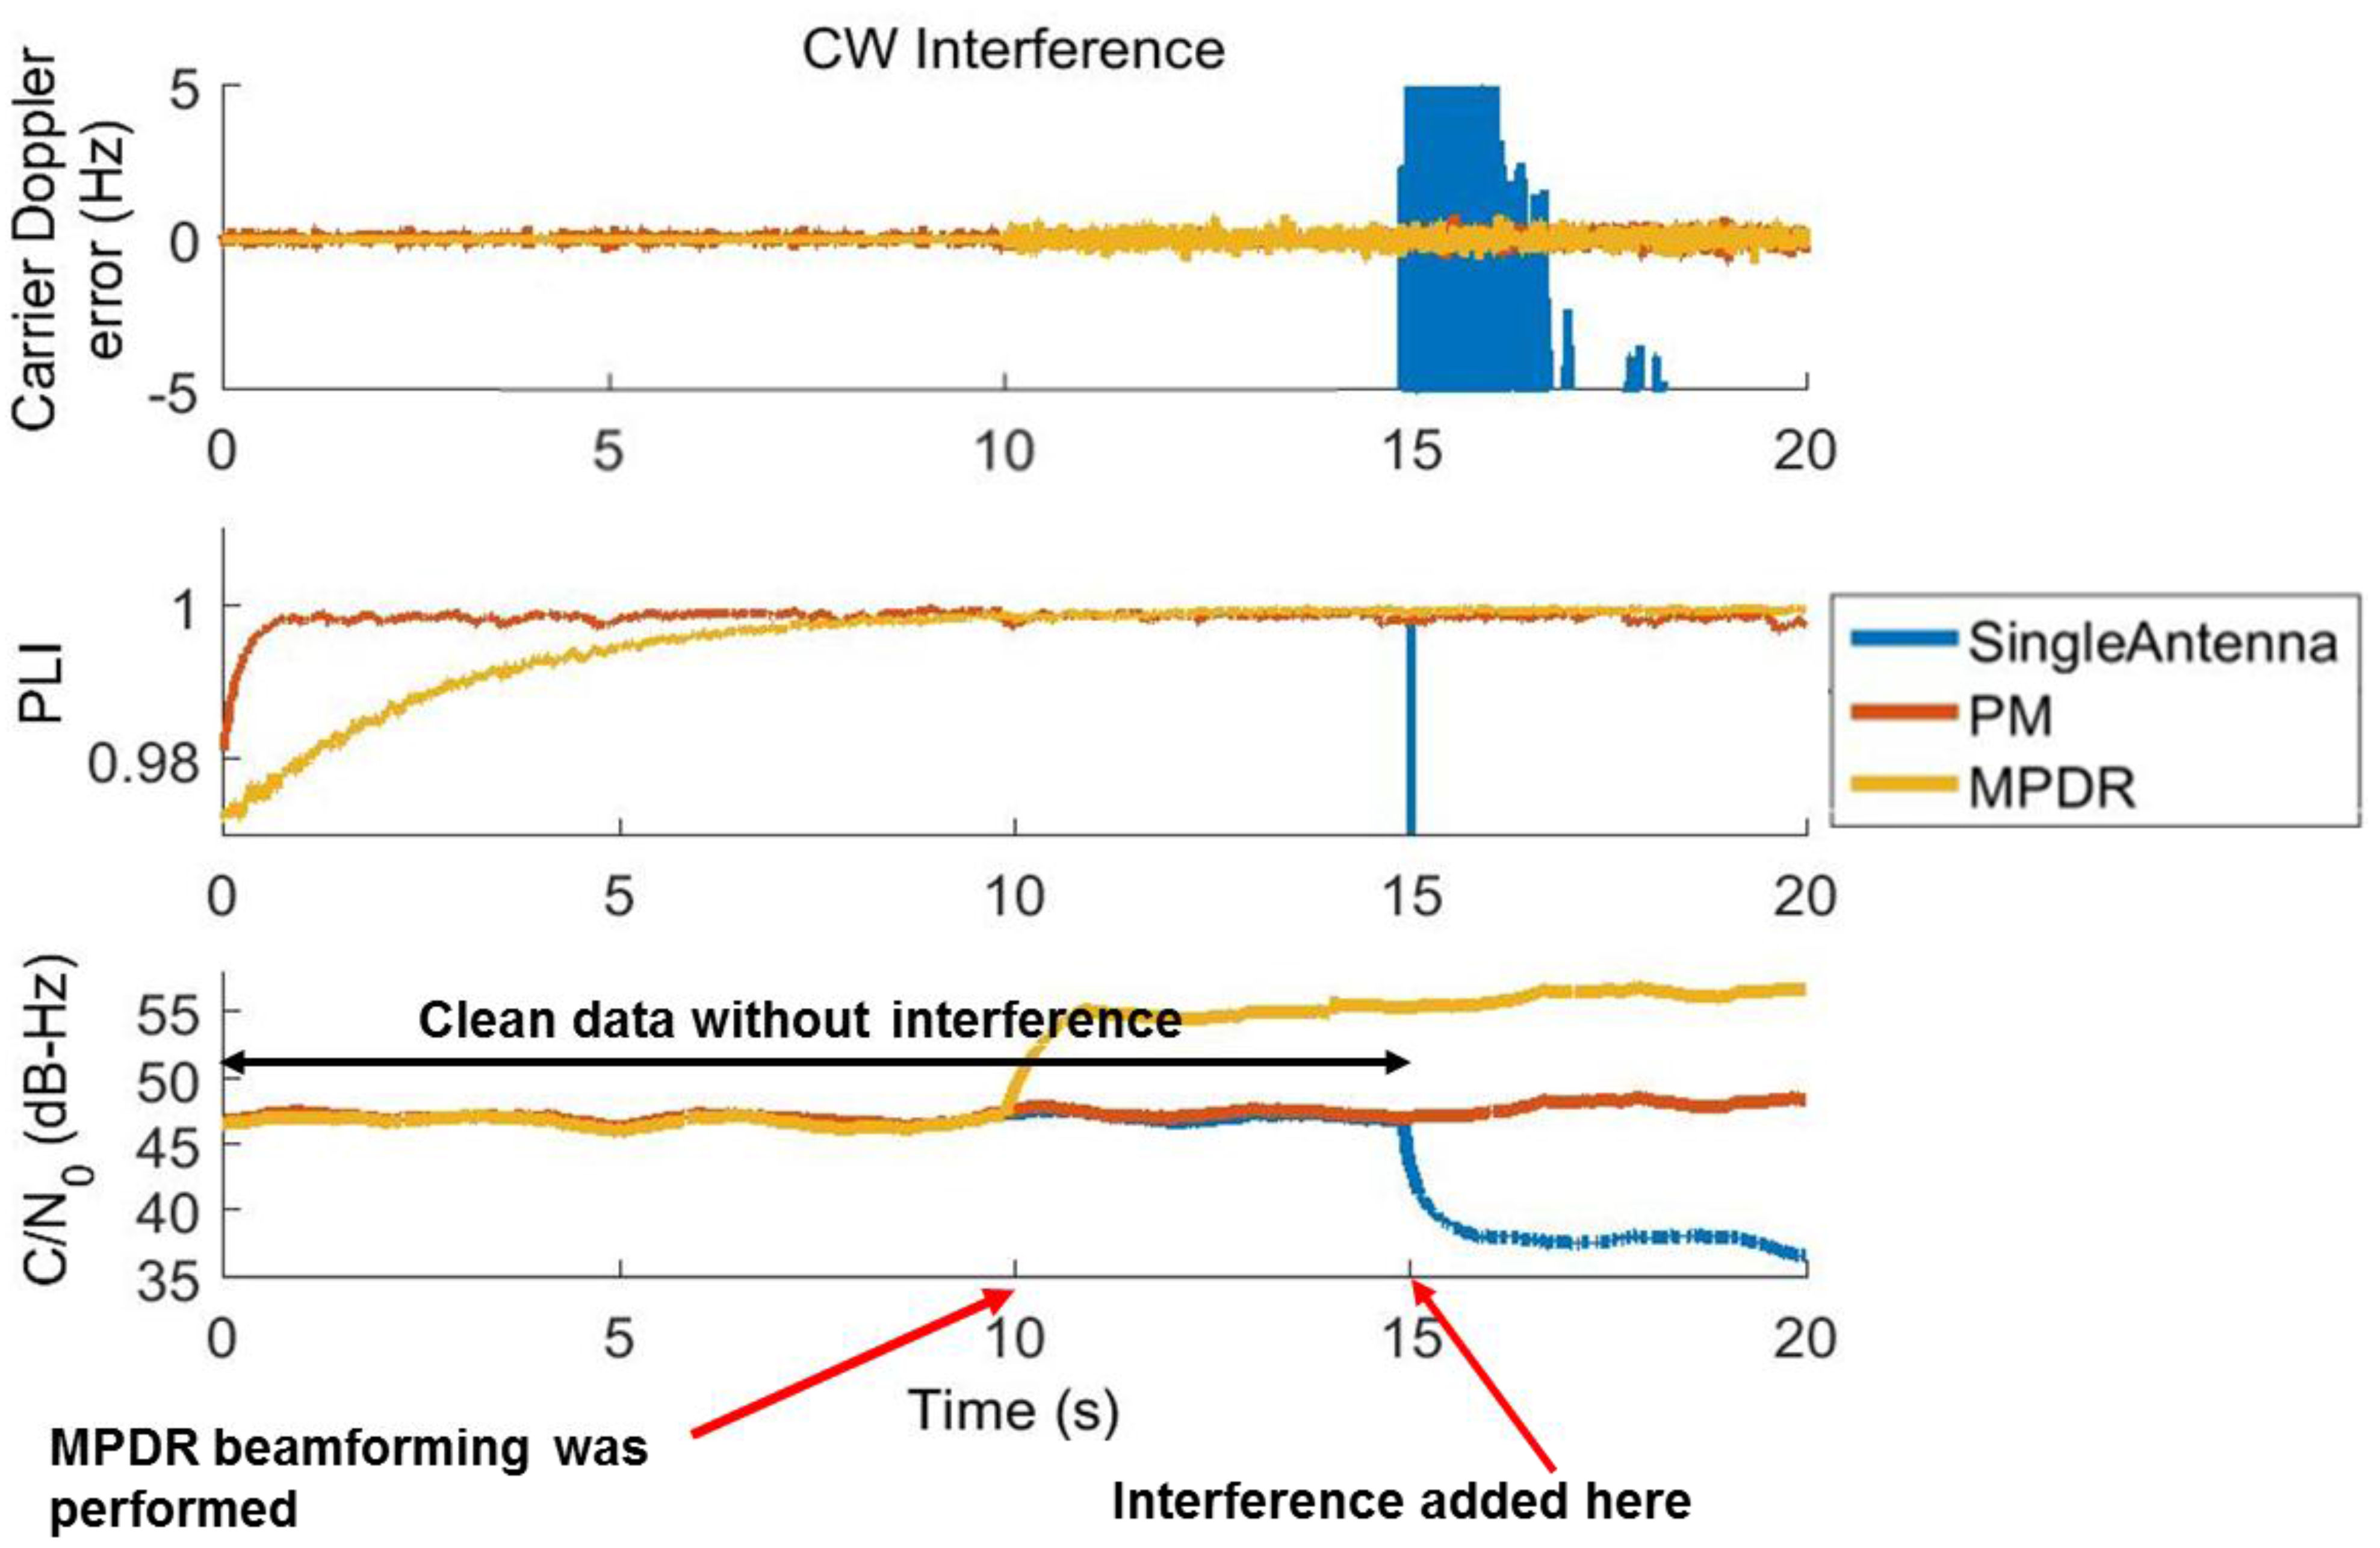
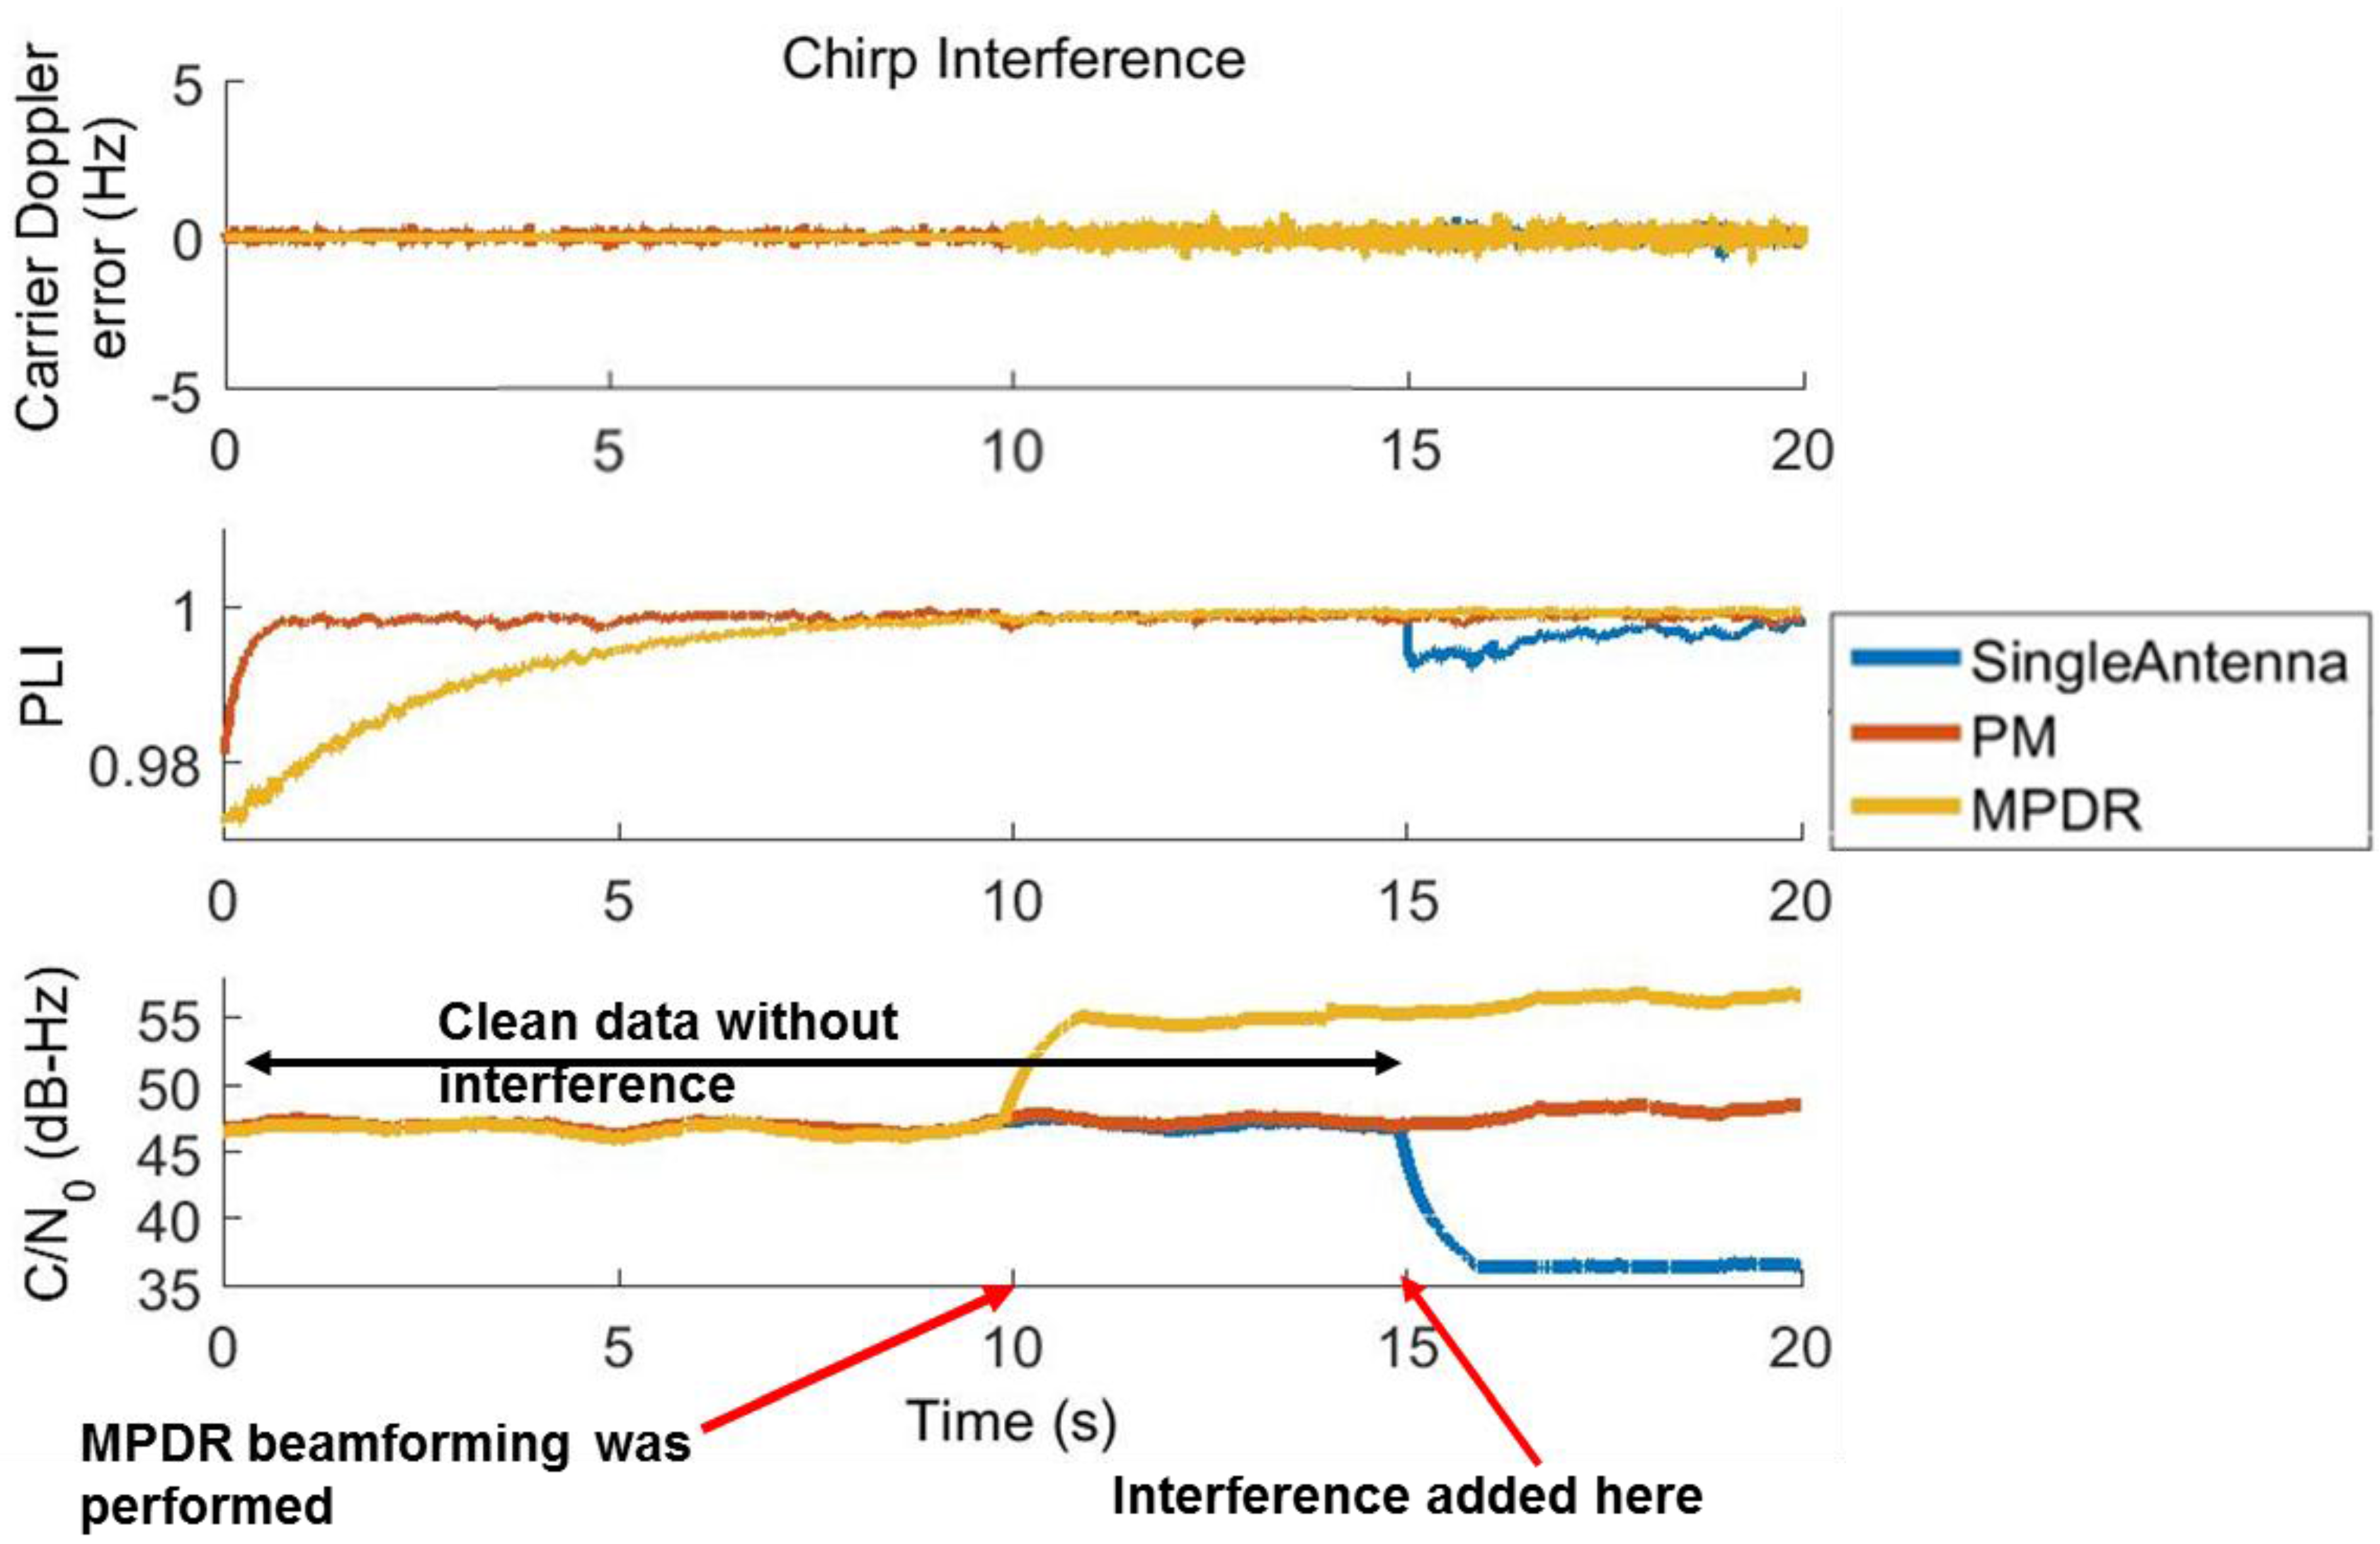
The tracking outputs of PRN 6 for the single antenna case affected by CW interference after beamforming for the first 20 s are shown in
Figure 5 where ‘Single Antenna’ corresponds to the tracking outputs of the reference antenna of the array in the presence of interference. For the initial 15 s, there was no interference; as mentioned earlier, PM was performed from the beginning of the data and MPDR was performed after 10 s.
Let us first consider the initial 15 s of data without interference. After MPDR beamforming, a C/N0 gain of 7.5 dB is observed. As six antenna elements were used, a gain of 7.7 dB [10 × log10(number of antennas)] is expected and one can observe the same with MPDR beamforming. With PM, a gain of 1.5 dB is observed; in this case, since there is no constraint on for the satellite signal AOA, the gain depends on the beampattern, which in turn depends on the interference direction and array geometry.
Now consider the data affected by interference (after 15 s) in
Figure 5. As soon as interference is injected, the C/N
0 values of the single antenna drops by about 8 dB. However, the same C/N
0 as that without interference was maintained through MPDR and PM methods. This ensured successful mitigation of the interference. If one considers the C/N
0 gain in the presence of interference, MPDR was able to deliver nearly 15.5 dB with respect to the single antenna. The gain observed from PM was 9.5 dB. As shown in
Figure 5, Doppler errors increase and PLI degrades for the single antenna case after interference. However, MPDR and PM were able to provide the same performance as that for the interference-free case. To compute the carrier Doppler errors shown in
Figure 5, the Doppler values obtained from the reference antenna with clean data were used as reference.
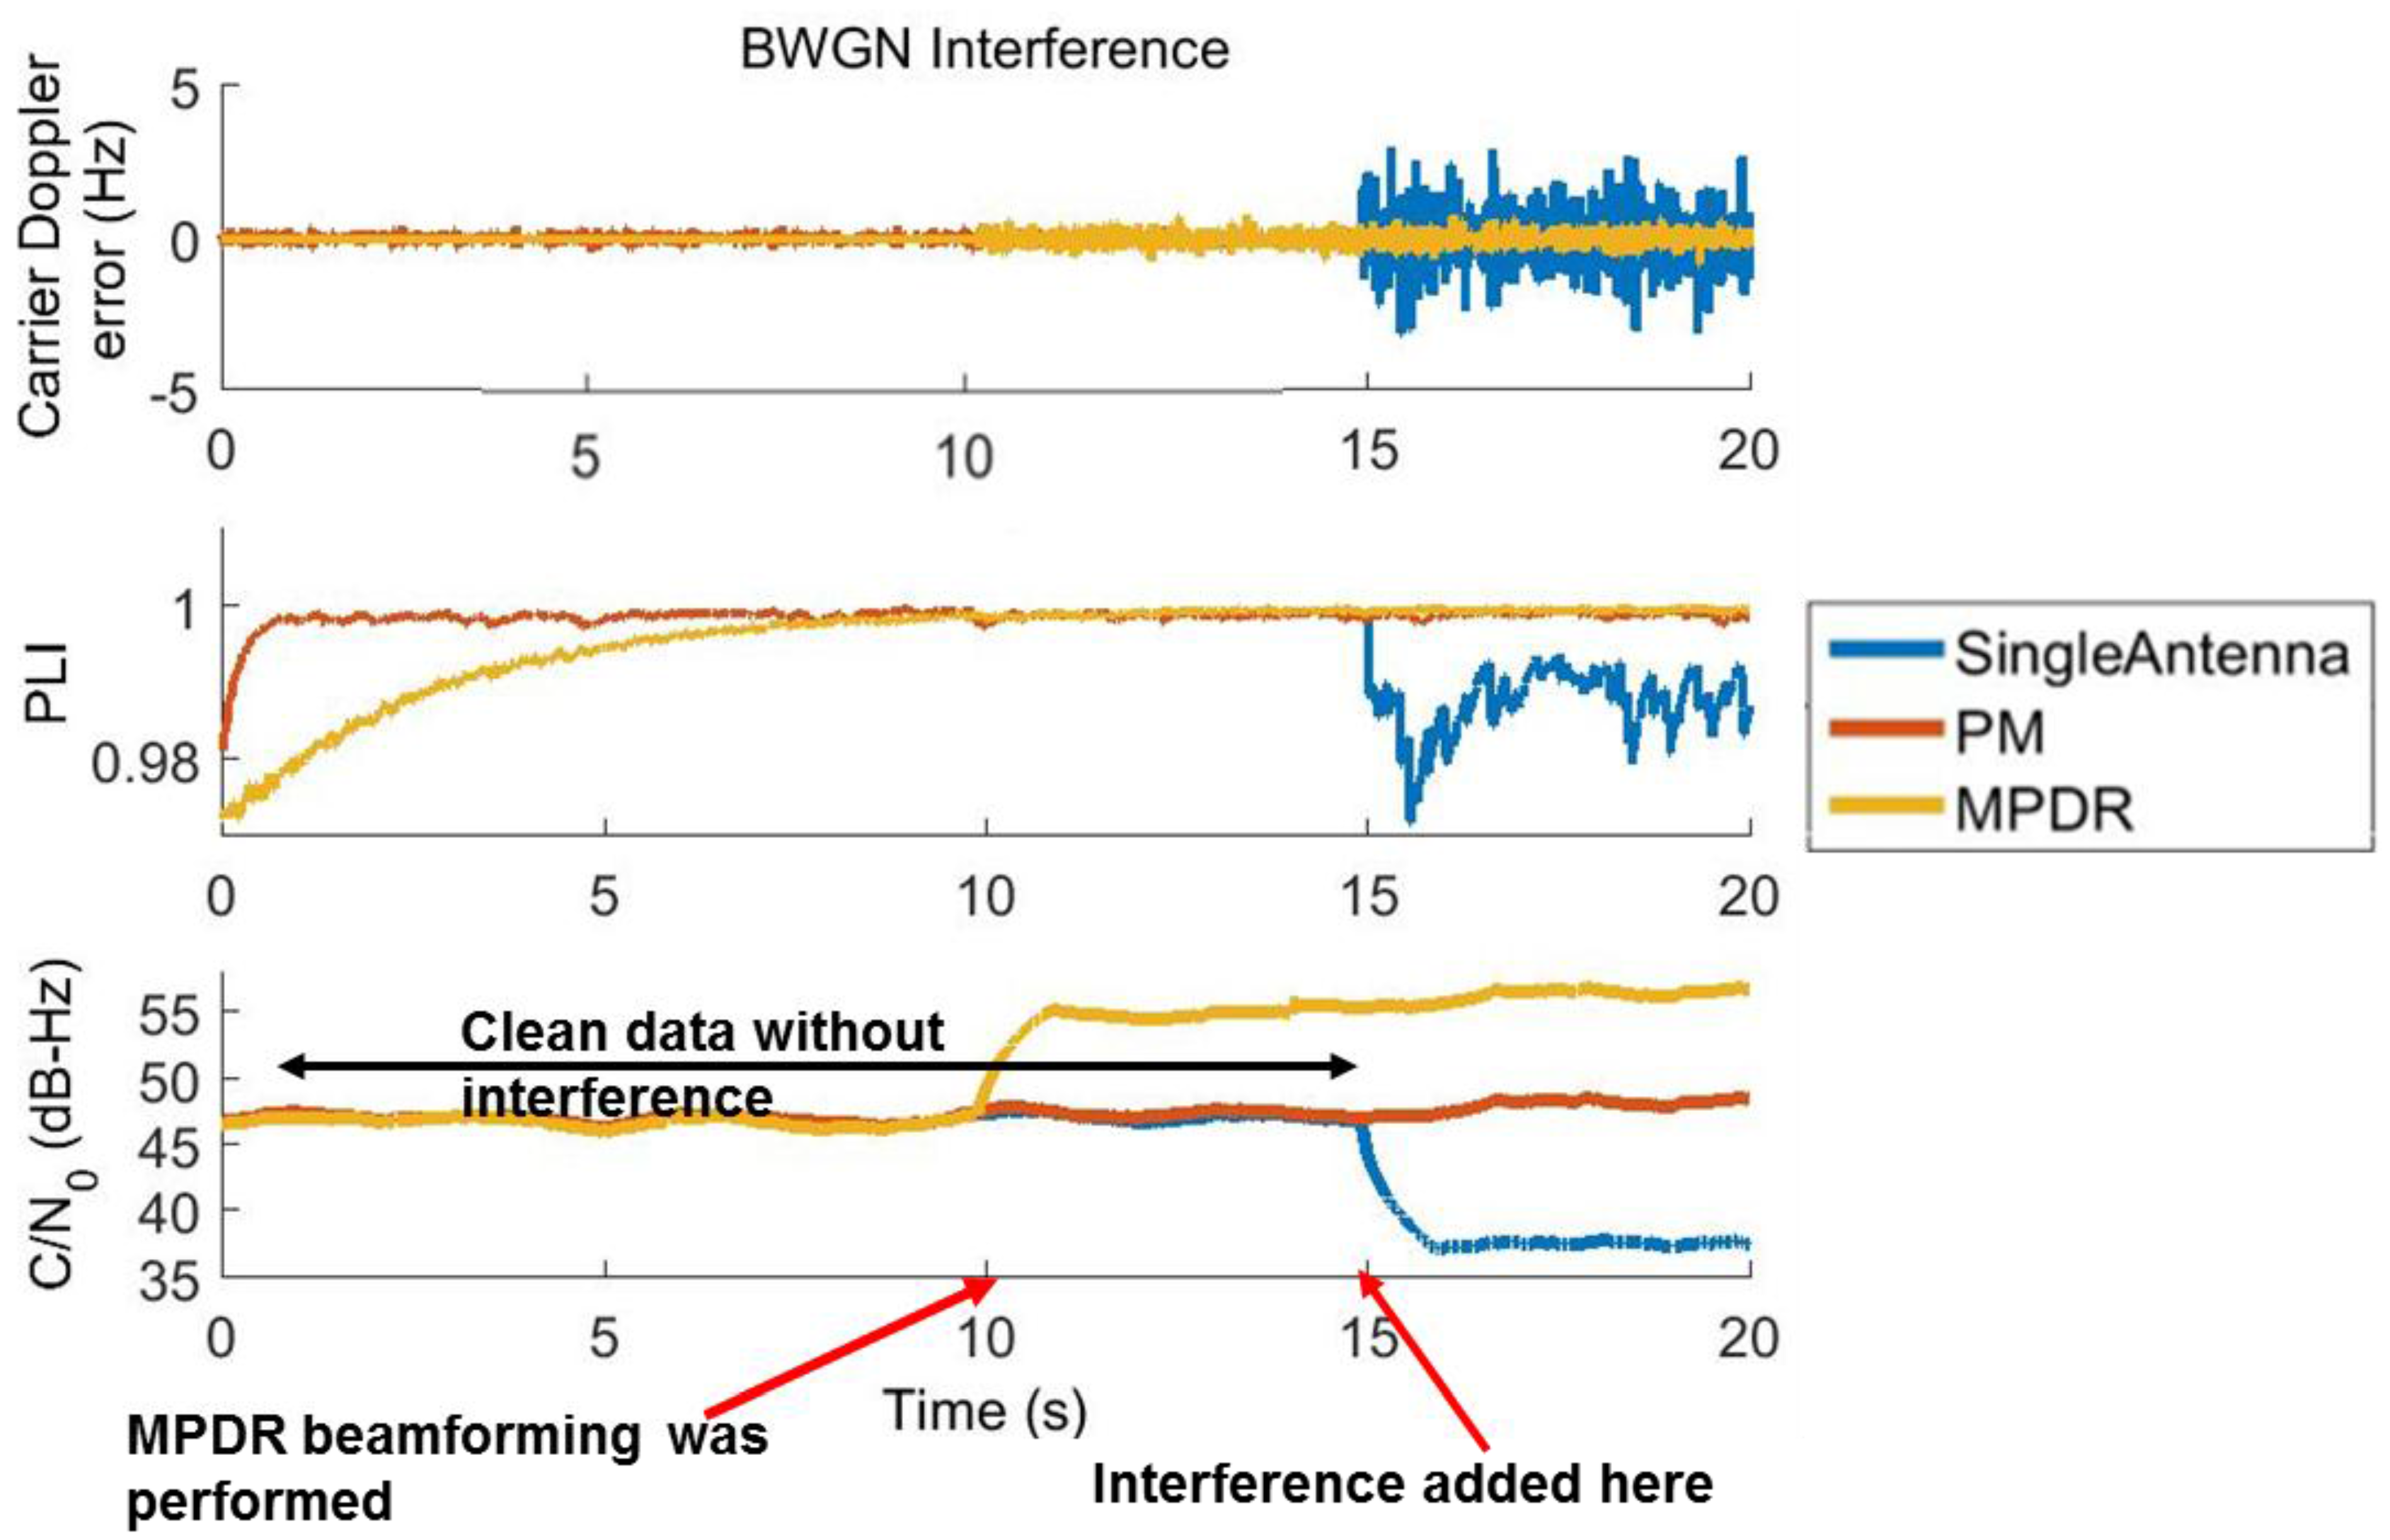
The carrier tracking performance of PRN 6 for chirp and BWGN scenarios for the first 60 s are shown in
Figure 6 and
Figure 7. MPDR was able to provide 15.5 dB of gain even in the presence of chirp and BWGN interference. PM was able to provide 9.5 dB of gain in the presence of the same interference. The Doppler error variance is lower after beamforming; this can be clearly observed in
Figure 7 in the presence of BWGN interference. The receiver was able to maintain PLI values of 0.99 after beamforming in all interference scenarios, indicating reliable tracking of the carrier phase.
The performance results of different PRNs in terms of Root-Mean-Square (RMS) Doppler errors, C/N
0 gain, and mean PLI for chirp interference are listed in
Table 2. These values were computed using the tracking outputs in the presence of interference. For computing Root-Mean-Square Error (RMSE) Doppler errors, the Doppler values obtained from the reference antenna with clean data were used as true values. The tracking performance results of different PRNs in the presence of CW and BWGN jammers are provided in
Appendix A for the CW jammer in
Table A1 and those for BWGN in
Table A2. It can be observed that compared to single antenna results, RMS Doppler errors are reduced for both beamformers for all simulation scenarios. MPDR RMS Doppler errors were lower by 0.1 Hz as compared to PM, a relative improvement of 25%.
3.2. Measurement Domain Analysis
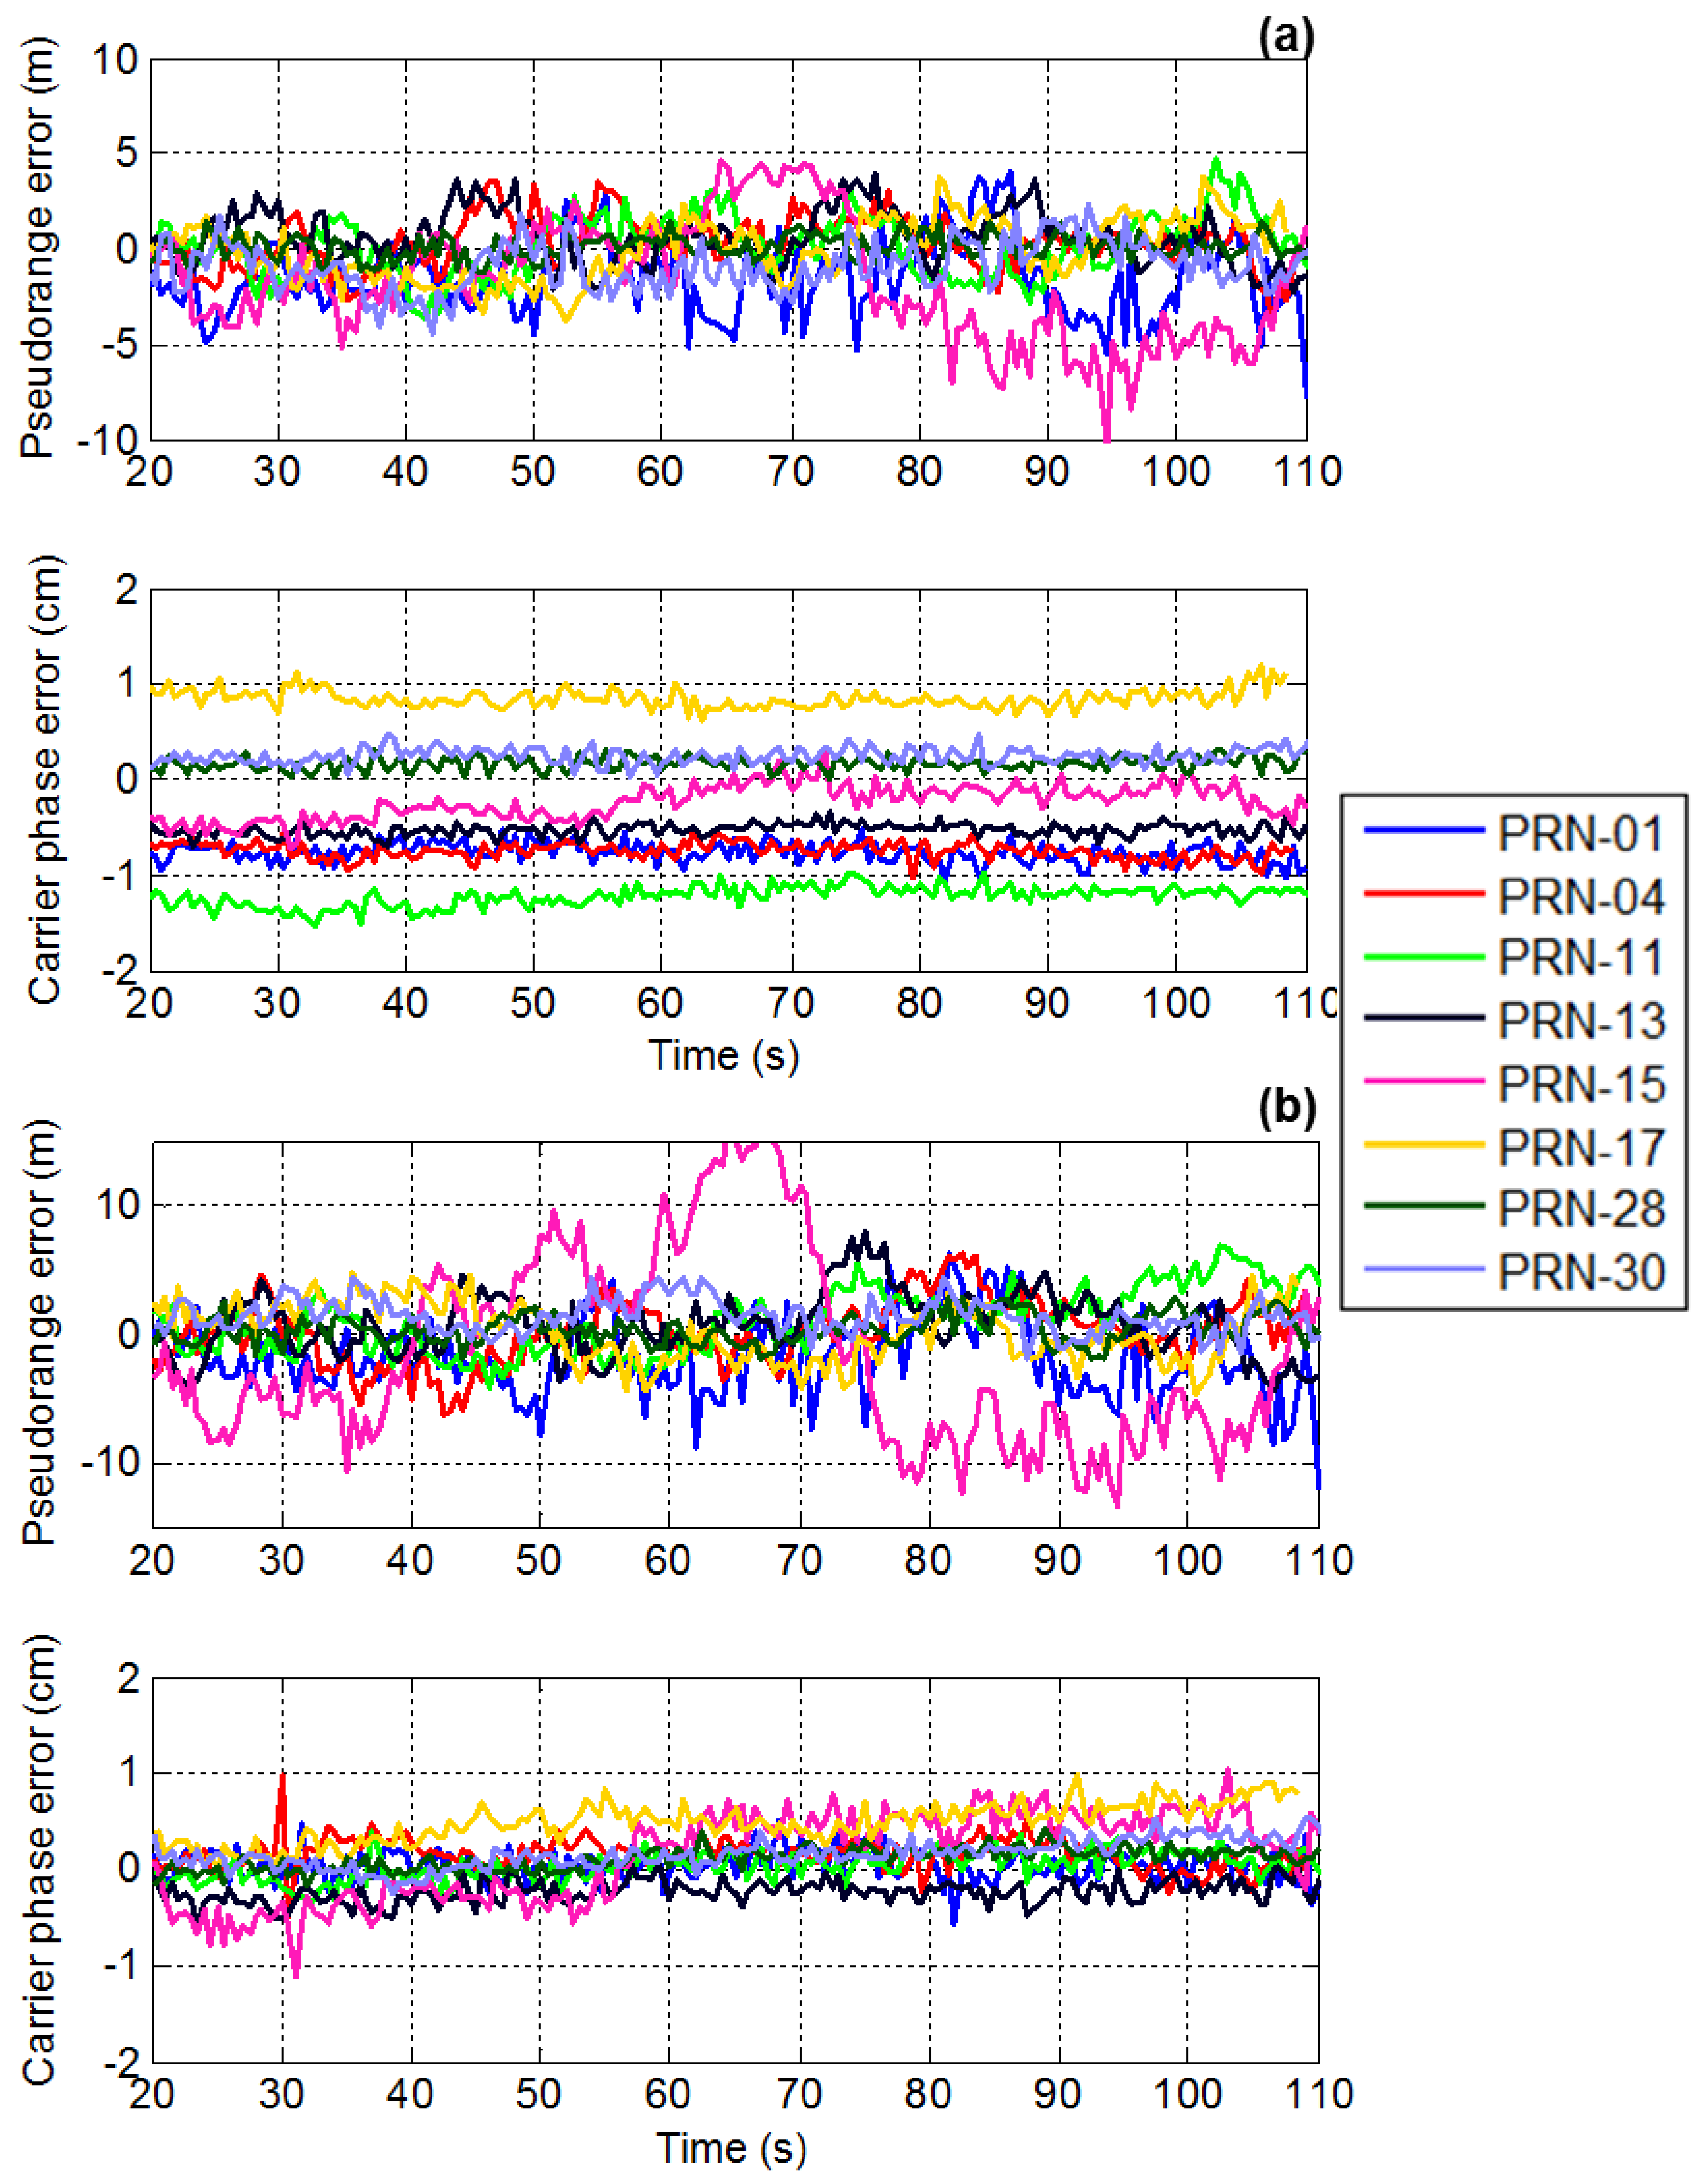
This section analyzes pseudorange and carrier phase measurement errors after beamforming. The measurement domain results in the presence of chirp interference are provided here. The measurement differencing technique described in the methodology section is used to obtain pseudorange and carrier phase measurement errors.
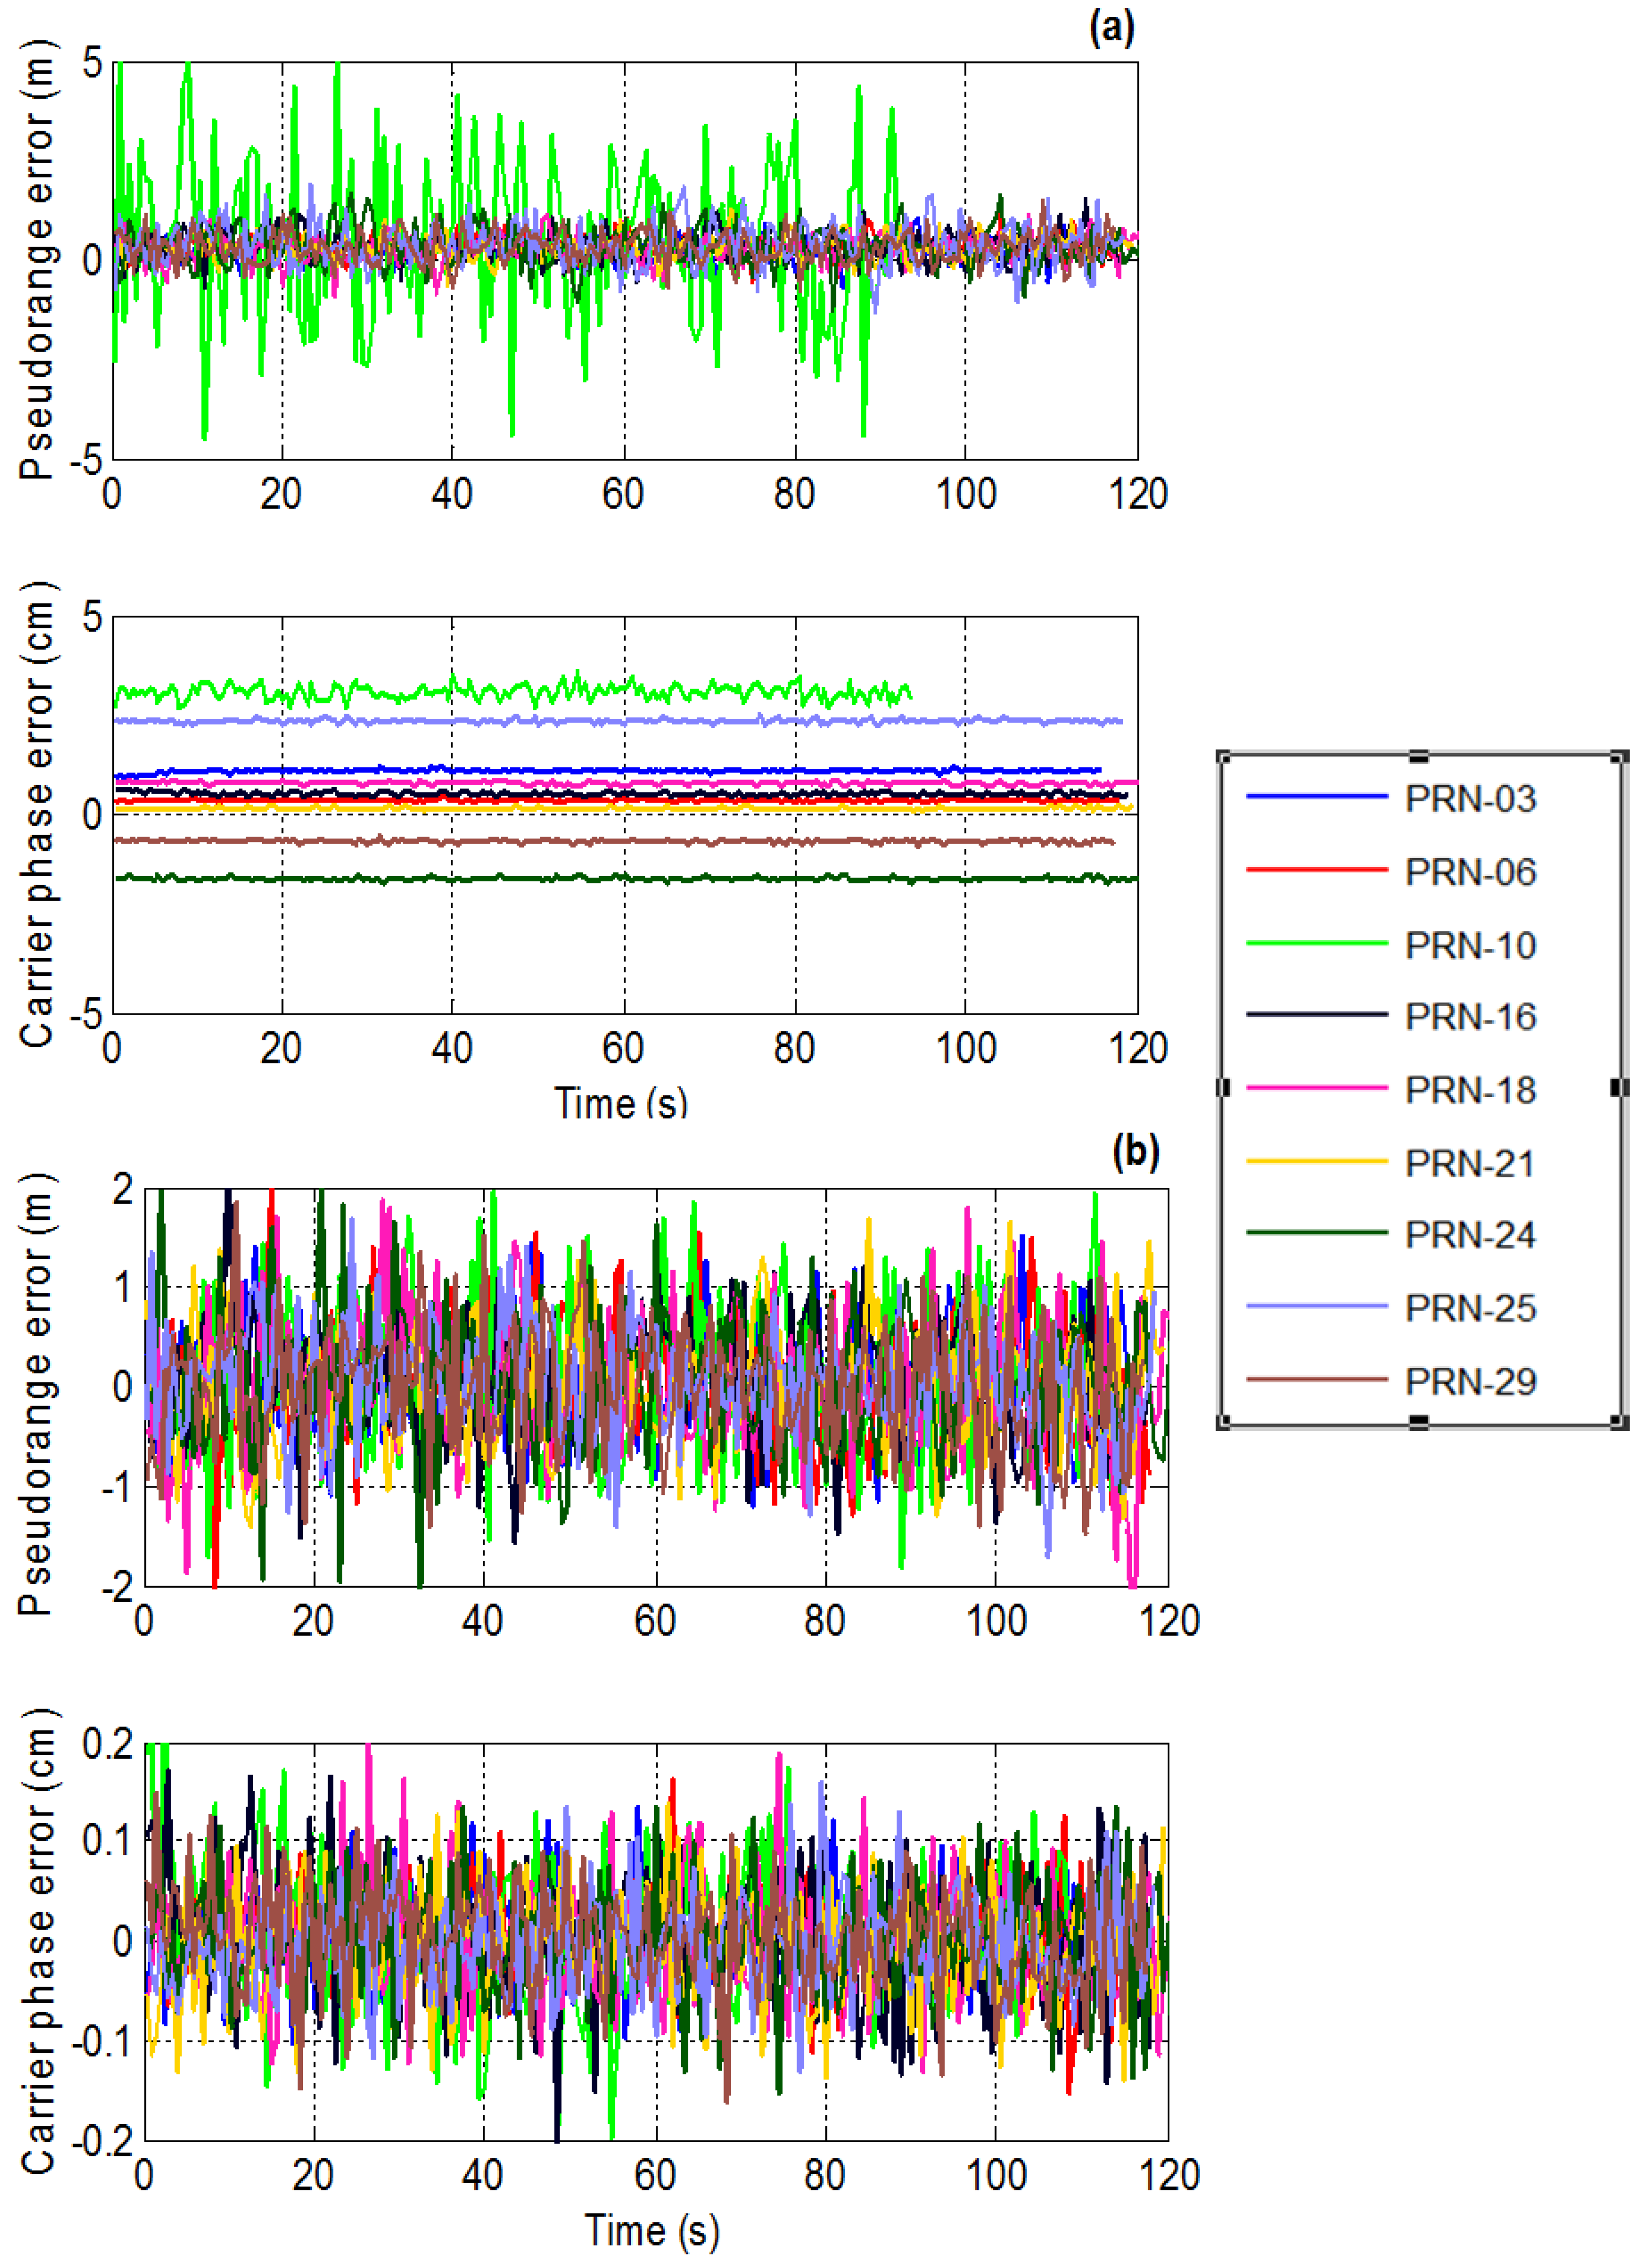
A time series plot of the pseudorange and carrier phase measurement errors for both PM and MPDR are shown in
Figure 8. The mean and standard deviations of the pseudorange errors for all the PRNs are provided in
Table 3. First consider the results of PM. It can be seen from
Table 3 that PM induces pseudorange biases of the order of 30 cm to 50 cm for different PRNs. It can also be observed that the biases observed are different for different PRNs. It can be seen from
Figure 8 that PRN 10 distortions are higher than those of other PRNs. This is because the interference source AOA is close to that of PRN 10 as shown in the sky plot of
Figure 4. Now consider the MPDR beamformer; it induces up to 4 cm of pseudorange bias, which is about the code phase measurement noise. For PRN 10, which is near the interference source, standard deviations of the measurement errors have increased compared to other PRNs.
It can be observed that mean pseudorange bias values are higher for PM than MPDR. The mean and standard deviations of the carrier phase measurement errors for different PRNs are listed in
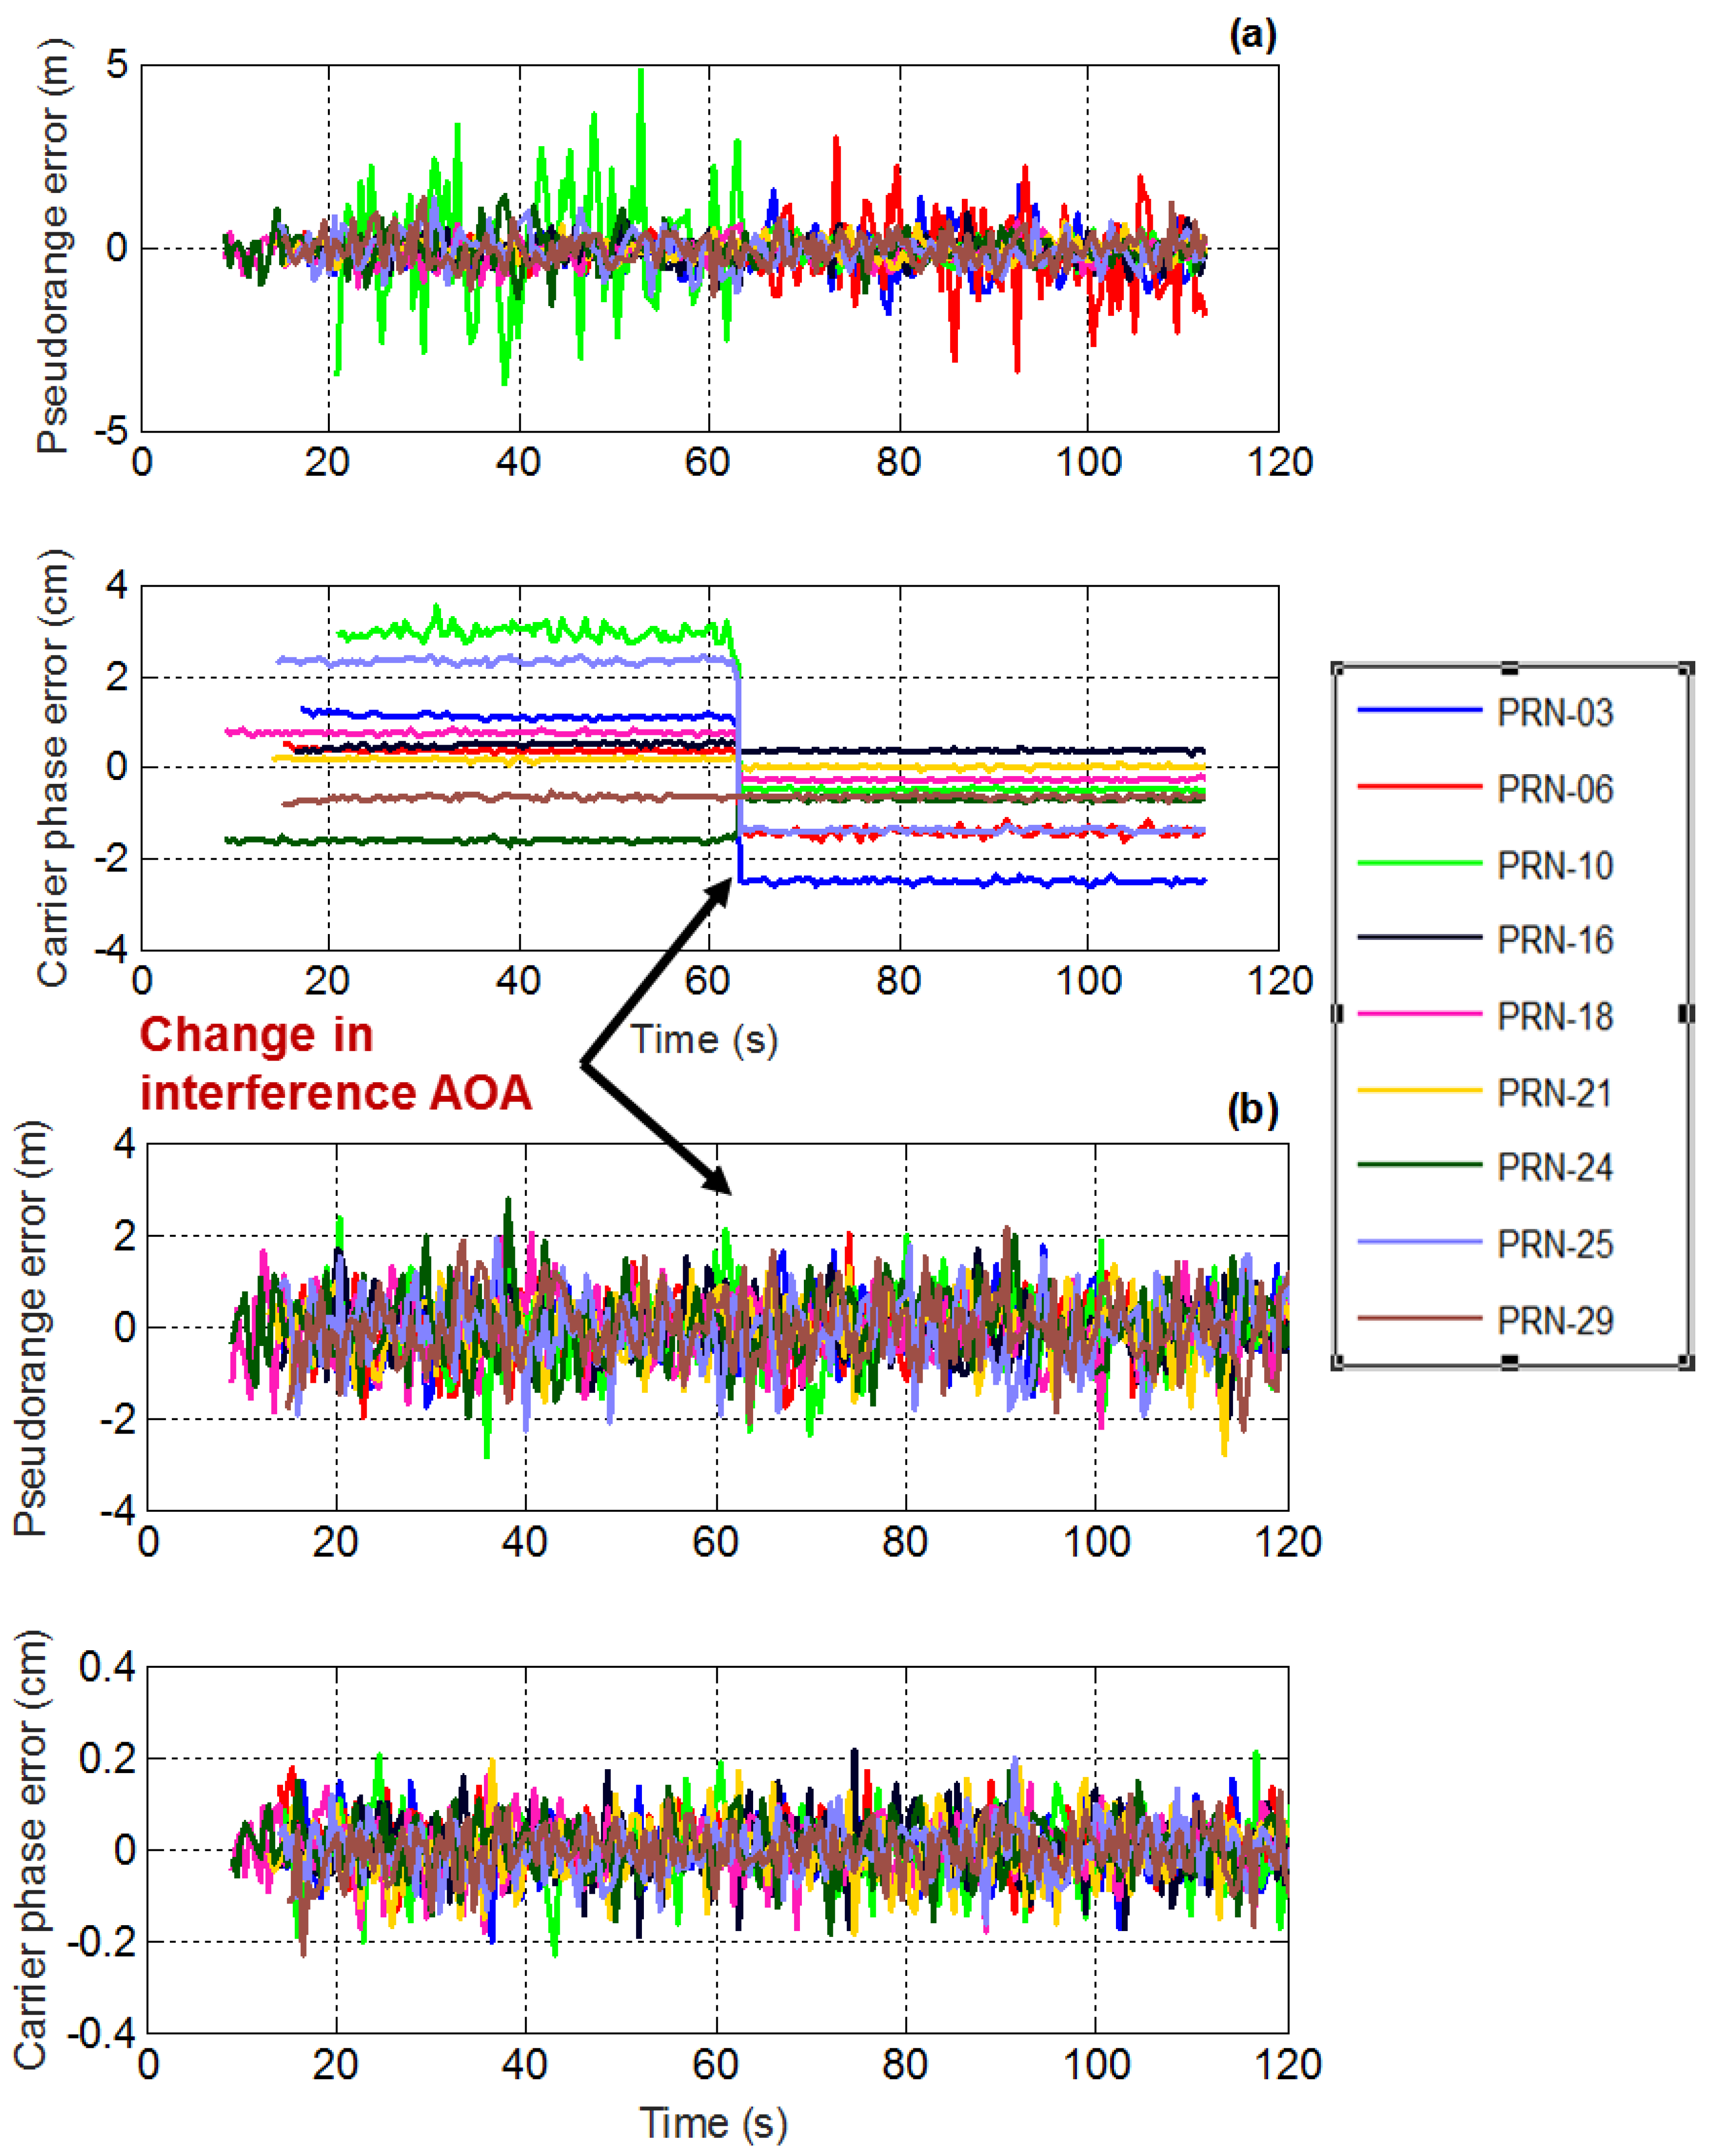
Table 4. It can be observed from
Figure 8 that PM induces different biases for different PRNs. The bias for a particular PRN remains the same for the entire test duration. This is because the interference source location and the array orientation were fixed and as such the beamformer weights were constant during the test. However, if the interference direction is changed or in the case of a dynamic user, the beamformer weights also change, different biases might be observed for the same PRN. A maximum bias value of 30 mm was observed in PRN 10 bias in the case of the PM beamformer. The carrier phase measurement biases for the MPDR beamformer are minimal as listed in
Table 4.
Similar observations were made with CW and BWGN jammers for code and carrier phase measurement distortions. The results corresponding to these jammers are provided in
Table B1,
Table B2,
Table B3 and
Table B4.
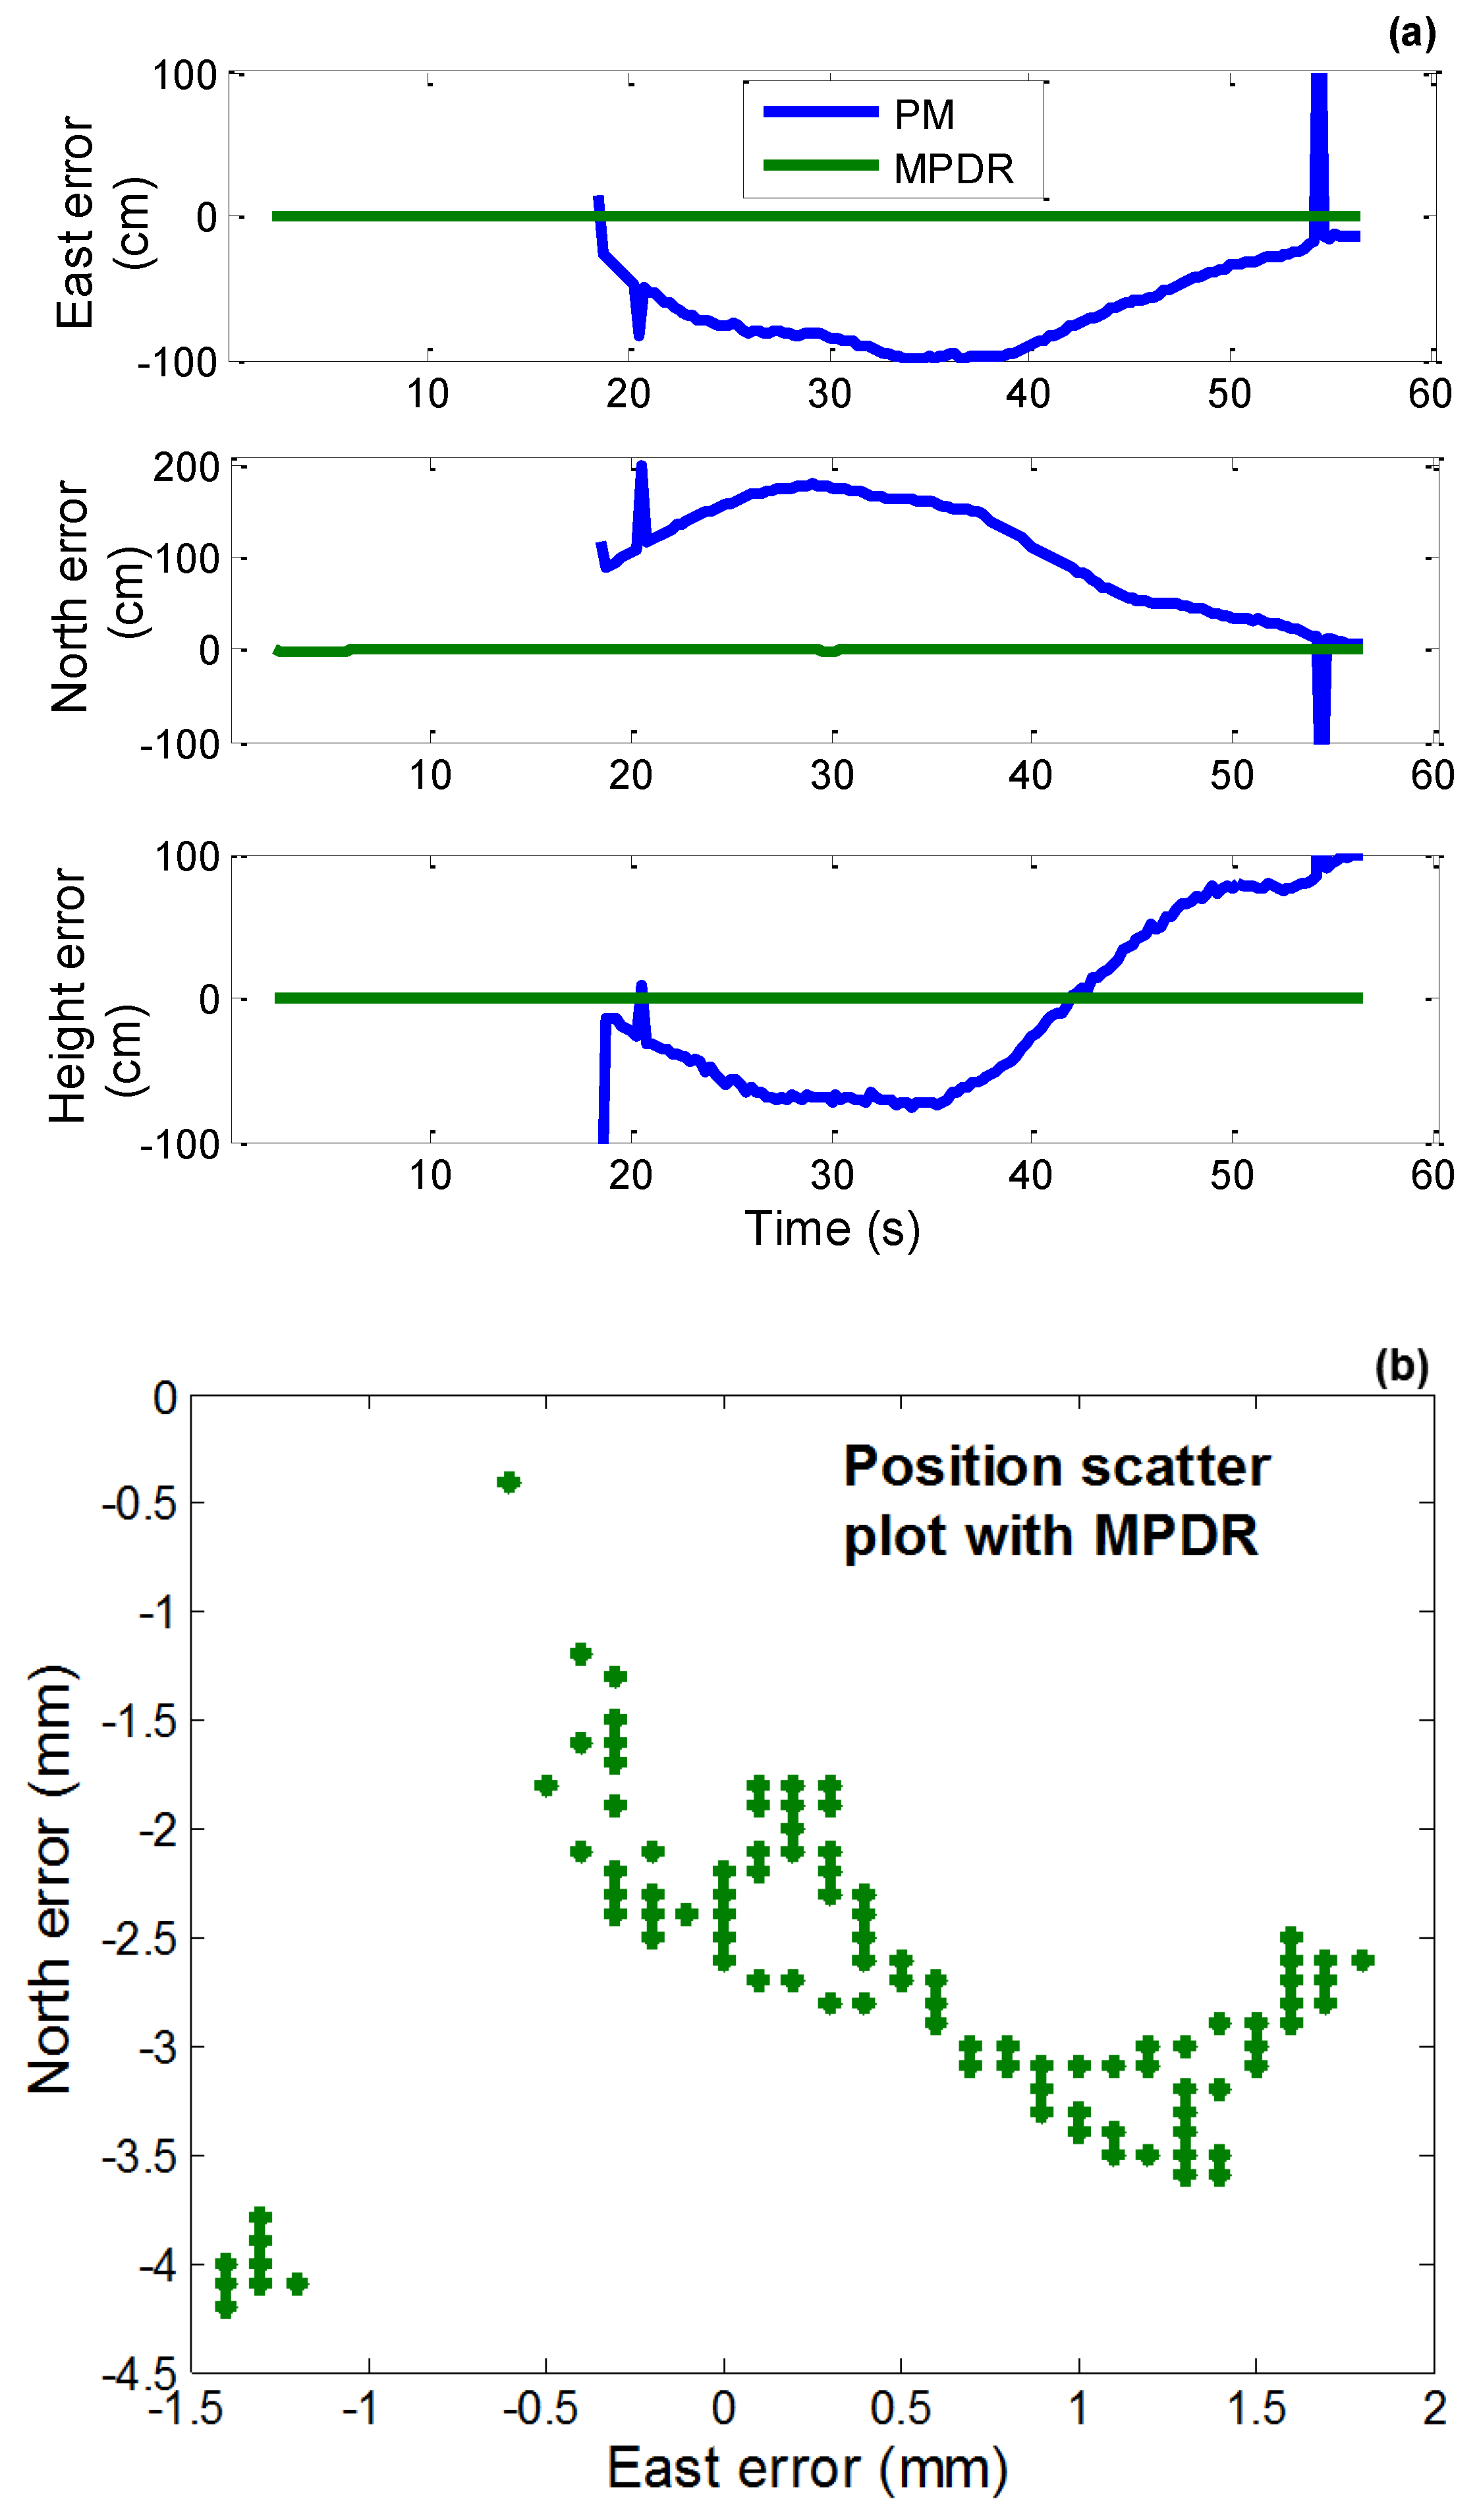
3.3. Position Domain Analysis
For the position domain analysis, the code and carrier phase measurements were processed using the RTKLib open source software [
30]. The measurements generated using the reference antenna of the array without interference were used as the base observations for the RTK software. The remote observations were generated from the beamformed data affected by interference. This kind of processing acts like a zero-baseline and any distortion in the measurements affects the position solution. The open source software was used without any modifications. In the RTKLib, the continuous carrier phase ambiguity resolution mode was selected and forward-backward processing was performed.
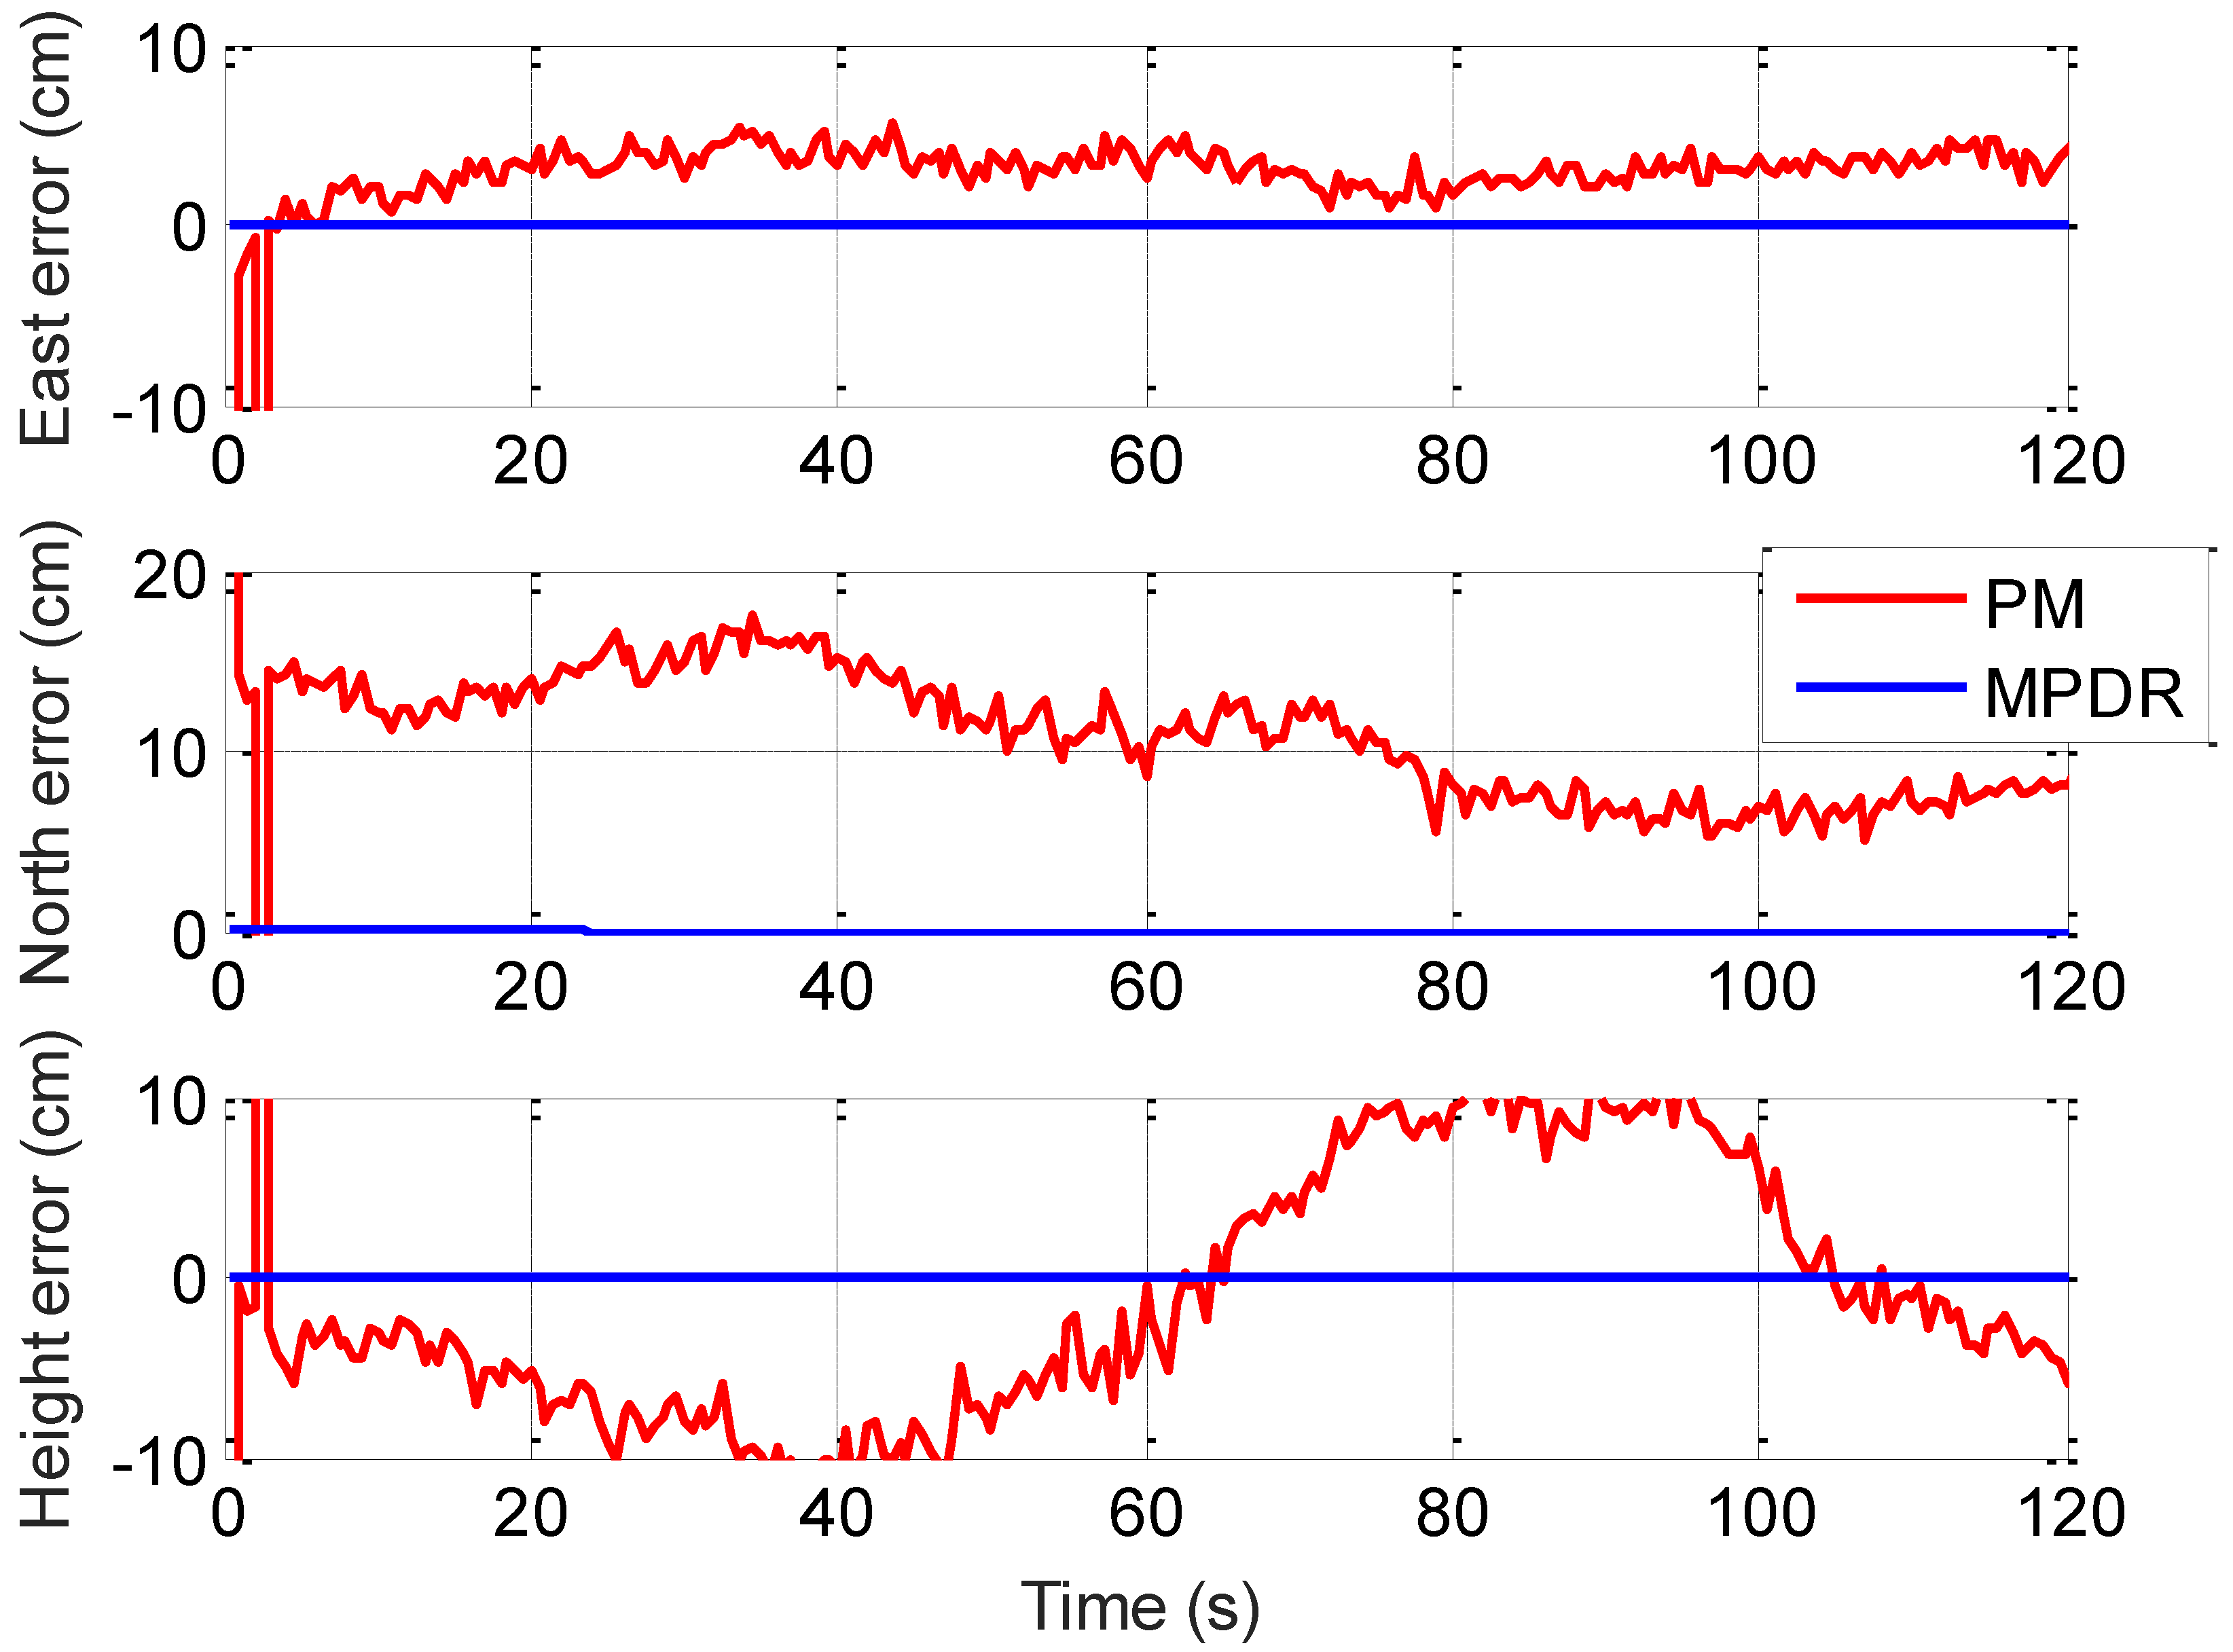
The east, north, and height position errors for PM and MPDR with chirp interference are shown in
Figure 9. The RTK software outputs a quality flag for each solution update indicating a fixed or float solution. PM was not able to provide fixed solutions and position errors on the order of 10 cm occur. MPDR was able to provide fixed solutions and position errors were at the sub-millimetre level. The mean and standard deviations of the position errors observed for both beamformers are provided in
Table 5. In the PM case, satellite directions are not considered in the optimization criterion and the antenna phase values are not added coherently. This will have adverse effect on the carrier phase measurements as discussed in the measurement analysis section. These biased measurements will affect carrier phase based positioning. It should be noted that with PM, different biases are observed for different PRNs and these bias values are a function of the interference and satellites AOA and cannot be calibrated beforehand.


