Article

Microbiota Structure and Functional Variation Across Intestinal Segments of Spinibarbus caldwelli


1
School of Life Science and Resources Environment, Yichun University, Yichun 336000, China
2
School of Artificial Intelligence and Information Engineering, Yichun University, Yichun 336000, China
3
Hunan Engineering Technology Research Center of Featured Aquatic Resources Utilization, Hunan Agricultural University, Changsha 410128, China
*
Author to whom correspondence should be addressed.
Diversity 2026, 18(9), 569; https://doi.org/10.3390/d18090569
Submission received: 27 July 2026 / Revised: 3 September 2026 / Accepted: 12 September 2026 / Published: 16 September 2026
(This article belongs to the Section Microbial Diversity and Culture Collections)

Abstract

Spinibarbus caldwelli is an important commercial aquaculture species in China. To investigate gut microbiota composition, inter-species interactions, and their correlation with intestinal function across different gut segments, we analyzed 18 gut samples from six wild S. caldwelli individuals collected from the Yuanhe River. The V4–V5 hypervariable regions of the 16S rRNA gene were high-throughput sequenced, resulting in 1557 operational taxonomic units. The microbiota across gut segments exhibited homogeneity, with greater similarity between the foregut and hindgut than between either of these and the midgut. The foregut and hindgut microbiota had significantly higher richness and diversity than the midgut microbiota. Pseudomonas was the most abundant genus. Cetobacterium and Microbacterium were significantly more prevalent in the midgut than in the hindgut, whereas Bacillus and Cupriavidus were significantly less abundant in the midgut than in the other gut segments. Network analysis revealed that cooperative interactions among gut microbes outweighed competitive interactions. Functional prediction indicated that the microbial metabolic patterns of the foregut and hindgut were more similar to each other than either was to the midgut, and the different metabolic pathways were mainly concentrated in the metabolism and environmental information processing. These findings suggest that the spatial heterogeneity of S. caldwelli gut microbiota is closely associated with physiological functions of gut segments.

1. Introduction

Aquaculture plays a crucial role in the global supply of aquatic products [1,2]. In 2022, the total global aquaculture production reached a record high of 130.9 million tons, with a total output value of USD 313 billion. Among this, farmed fish and other aquatic animals accounted for 94.40 million tons, making up 72.12% of total production. For the first time, aquaculture production (51%) exceeded capture fisheries, with inland aquaculture accounting for 62.6% of total aquatic animal farming. It is expected that by 2032, driven by the expansion of aquaculture and the recovery of capture fisheries, aquatic animal production will grow by 10%, reaching 205 million tons, with 111 million tons coming from aquaculture and 94 million tons from capture fisheries [3]. Although traditional bulk fish species still dominate, their proportion is declining. By 2024, the combined share of the four major freshwater fish—grass carp (Ctenopharyngodon idella), silver carp (Hypophthalmichthys molitrix), bighead carp (Hypophthalmichthys nobilis), and common carp (Cyprinus carpio)—is expected to decrease from 58% in 2018 to 52%. High-value species are experiencing rapid growth, leading to an overall improvement in the quality, efficiency, and competitiveness of fisheries. Meeting the demand for high-quality aquatic products has become a key development trend [4].
The gastrointestinal tract of animals hosts a large number and diverse types of microorganisms, forming a microbiota. These gut microbiota are closely connected with the host, and play crucial roles in maintaining host normal intestinal functions, such as defending against pathogens, promoting intestinal cell proliferation, and digesting various macromolecules [5]. Currently, research on gut microbiota is relatively well-developed in terrestrial vertebrates. However, there is a lack of research on gut microbiota in fish, despite them being the most diverse group of vertebrates, comprising about half of all species [3,6]. Additionally, environmental factors, such as microorganisms in the water, temperature, pH, and dissolved oxygen, impact the diversity of gut microbiota in fish [7].
Various segments of a fish digestive tract display significant morphological differences and spatial heterogeneity. Due to their distinct physiological functions, different segments of gut harbor distinct microbiota [8]. Although research on fish gut microbiota has primarily focused on comparative analysis of the entire digestive tract, such as in Polyodon spathula [9,10], studies on specific intestinal segments are relatively scarce. The composition and diversity of microbiota in different segments of the fish gut are complex. For instance, Gajardo et al. [11] found significant differences in the abundance and diversity of microbiota among different gut segments of the Atlantic salmon (Salmo salar). Similar variations in gut microbiota structure across different intestinal segments have been observed in grass carp [12,13] and zebrafish (Danio rerio) [14], whereas no significant differences were found in the herbivorous Parabramis pekinensis [15]. In a study specifically examining segment-specific gut microbiota, the α-diversity indices of the grass carp midgut were significantly higher than those of the foregut and hindgut [12]. Similar segmental differences were also observed in the microbiota structure of Atlantic salmon.
Spinibarbus caldwelli Nichls (Teleostei: Cyprinidae) is a species endemic to China, mainly found in the Yuanjiang River, Pearl River, Jiulongjiang River, Minjiang River, Yangtze River, and on Hainan Island [16]. S. caldwelli inhabits clear, gravel-bottomed streams and river sections with fast-flowing water. It is a mid-to-lower layer fish that primarily feeds on plankton and benthic animals, making it an omnivorous species [17,18,19]. Individuals of S. caldwelli over 12 cm in length can consume filamentous algae, with a particular preference for water sponges. Extensive research has been conducted on controlling algal blooms using S. caldwelli as a biological method [20,21]. The flesh of S. caldwelli is tender and delicious, and its soup is considered detoxifying, making it highly valuable both economically and ecologically [16,22,23,24]. Therefore, S. caldwelli is regarded as a superior freshwater cultured species in southern China [25,26]. However, wild stocks of S. caldwelli have declined substantially in recent years due to overexploitation, pollution, illegal fishing practices, and hydroelectric development [27,28]. To conserve and protect this valuable resource, artificial breeding has become urgent. The composition of fish gut microbiota depends on host selection, diet, and environmental factors [29], and plays an irreplaceable role in fish growth and health, making it crucial for artificial breeding. Previous studies have reported on the gut morphology and diet [30], liver energy metabolism [31], and digestive enzymes [32,33] of S. caldwelli, whereas research on the gut microbiota of S. caldwelli has only been conducted in artificial breeding settings [34,35]. The purpose of this study is to evaluate the gut microbiota structure, interspecies interactions and their topological roles, and the functional gene composition of the microbiota in wild S. caldwelli. This study is the first to systematically characterize the gut microbiota of this species and to compare the functional differences in the microbiota in different gut segments of S. caldwelli. Our results reveal the microbiota response to regional variations within the gut and provide a theoretical basis for the healthy aquaculture of S. caldwelli.

2. Materials and Methods

2.1. Sample Collection and Preprocess

This animal study protocol was approved by the Yichun University Medical Ethics Committee (protocol code 2023-40). Six healthy fish were randomly collected using a gill net from the Binjiang section of the Yuanhe River (114°29′–114°51′ E, 27°33′–28°08′ N) in January 2023 in Yuanzhou District, Yichun City, China, with a body length of 23.56 ± 7.27 cm and a body weight of 335.46 ± 276.18 g (Figure S1).
Live fish samples were transported to the laboratory in ice water within two hours and were immediately anesthetized for five minutes using the fish anesthetic MS-222 (50 mg/L). Subsequently, the surfaces of fish and the dissection instruments were disinfected with 75% ethanol. The abdominal cavity was quickly opened from the fish anus using surgical scissors, and each gut segment was sampled (Figure S1B) [30]. According to the criteria described by Ni and Hong [36] for the digestive tract histology of grass carp (Ctenopharyngodon idellus), the foregut is defined as the intestinal section from the esophagus to the first bend at three-quarters of the abdominal cavity. The midgut extends from the first bend to the last bend of the intestinal section. The hindgut is defined as the straight section from the last bend of the intestinal tract to the anus. The foregut, midgut, and hindgut samples were labeled as F, M, and H, respectively. For instance, the foregut sample from the first fish was labeled as JX01F. All samples were stored in an ultra-low-temperature freezer at −86 °C for gut microbiota analysis.

2.2. DNA Extraction and Sequencing of 16S rRNA Gene Amplicons

Total DNA was extracted from 300–500 mg of intestinal tissue with inclusions using the SPINeasy DNA Pro kit for soil (MP, Solon, OH, USA). DNA concentration was measured with a Nanodrop 2000 spectrophotometer (Thermo Scientific, Wilmington, DE, USA) and diluted to 10 ng/µL. The V4–V5 hypervariable regions of the 16S rRNA gene were amplified using the universal prokaryotic primers 515F (5′-GTGYCAGCMGCCGCGGTA-3′) and 909R (5′-CCGTCAATTCMTTTRAGT-3′) [37,38], with a 12 nt sample-specific barcode sequence attached to the 5′-end of primer 515F for sample differentiation. Each 25 µL PCR reaction contained 1× PCR buffer, 1.5 mM MgCl2, 0.2 mM dNTPs, 1.0 µM of each primer, 0.25 U ExTaq (TaKaRa, Dalian, China), and 10 ng of DNA template. PCR conditions were as follows: pre-denaturation at 94 °C for 10 min; 30 cycles of 94 °C for 30 s, 56 °C for 30 s, and 72 °C for 30 s; and a final extension at 72 °C for 10 min. Each sample was amplified in duplicate, and the two PCR products from the same sample were combined, analyzed on a 1.5% agarose gel, and purified using an AxyPrepTM DNA gel extraction kit (Axygen, Wujiang, China). All purified DNA samples were pooled in equal amounts and sequenced using the Illumina HiSeq platform(Illumina, San Diego, CA, USA) with the PE250 method [39].

2.3. Data Analysis

The raw sequencing reads were merged using FLASH 1.2.8 to obtain merged tags. The merged tags were then filtered with QIIME 1.9.0 [40] to remove tags that did not match the primers, were shorter than 300 bp, contained ambiguous bases (“N”), or had an average base quality below 30 [39,41], resulting in clean tags. Chimeric tags were then detected and removed using the Uchime program in the Usearch 9.0.2132 software (http://drive5.com/usearch/ (accessed on 30 August 2024)) to obtain effective tags. The vsearch in QIIME2 was used for de novo clustering of operational taxonomic units (OTUs) at 99% sequence similarity. R vegan package was used to calculate α-diversity indices, and generation of weighted and unweighted UniFrac distance matrices for principal coordinates analysis (PCoA). Taxonomic assignment of each OTU was performed using QIIME2 with the silva 138 database.
Based on the relative abundance profile of OTUs, co-occurrence network analysis was performed to evaluate interspecies interactions among bacterial communities in different segments of the intestine of S. caldwelli using R igraph 2.3.3 package. Correlations with the absolute of R > 0.6 and p < 0.01 were considered as effective. Stochastic matrix theory (RMT)-based methods were used for topological role identification, and module membership determination with automatic thresholds [42]. To quantitatively compare differences in gut microbial interactions, we calculated several topological attributes, including mean connectivity, average path distance (GD), average clustering coefficient (avgCC), and modularity. According to the values of intra-module connections (Oi) and inter-module connections (Pi), node topology was classified into four types: peripherals (Oi ≤ 2.5, Pi ≤ 0.62), connectors (Oi ≤ 2.5, Pi > 0.62), module centers (Oi > 2.5, Pi ≤ 0.62), and network hubs (Oi > 2.5, Pi > 0.62). Networks were visualized using Gephi 0.9.2.
Based on the compositions of microbial species, the functional profile of the microbiota was predicted using PICRUSt2 [43] to obtain KEGG-annotated gene compositions. OTU sequences with nearest sequenced taxon index (NSTI) > 2 were filtered out when conducting PICRUSt2. Non-metric multidimensional scaling (NMDS) and analysis of similarity (ANOSIM) with Bray–Curtis distance were then used to evaluate overall differences in the predicted microbial functional composition. Linear discriminant analysis (LDA) effect size (LEfSe) with LDA score > 2 as the threshold for significant differences was conducted for screening microbial indicators in each gut segment. The Kruskal–Wallis rank-sum test with Dunn’s multiple-comparison test was used to identify significantly different variables. A two-sided Welch’s t-test was used to identify significantly different metabolic pathways between the two microbial groups. p values were adjusted using the Bonferroni method. p < 0.05 was considered significant.

3. Results

3.1. Differences in Gut Microbiota Structure and Taxa Composition

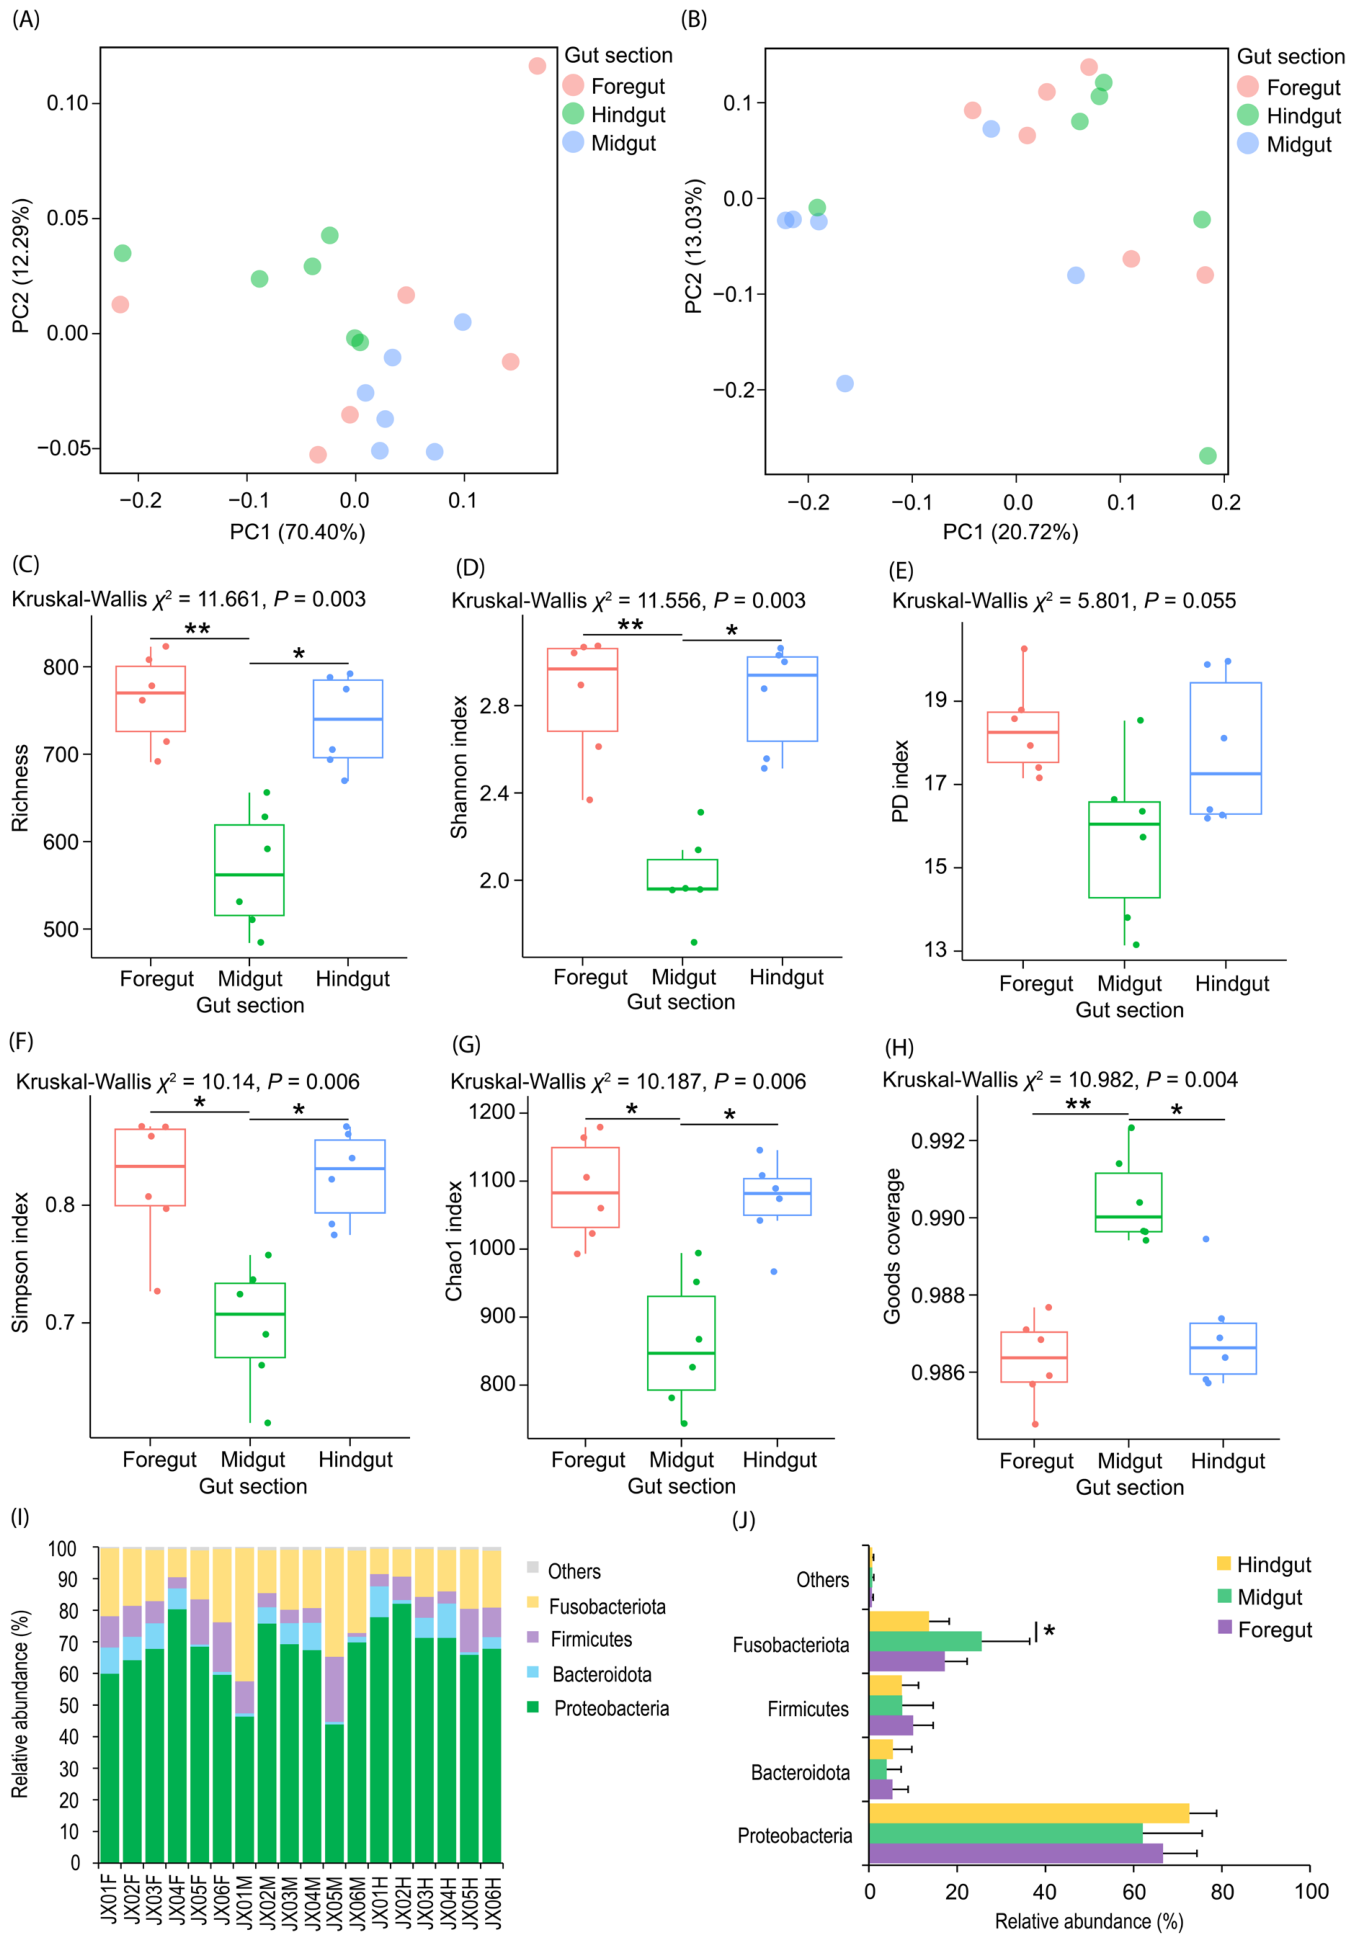
After removing low-quality tags and chimeric sequences, a total of 460,732 effective tags were obtained from 18 gut samples (six fish specimens, each providing three samples from the foregut, midgut, and hindgut) (Table S1). On average, each sample yielded 25,596.22 ± 3087.09 effective tags. The sample with the fewest effective tags had 19,850 tags; so, 19,850 effective tags from each sample were resampled for subsequent analysis (Table S1). From the resampled effective tags, a total of 1557 OTUs were detected. PCoA based on weighted and unweighted UniFrac distances showed significant separation among the foregut, midgut, and hindgut samples (ANOSIM, p < 0.05; Figure 1A,B). These results indicate that differences in the microbiota across gut segments are reflected in species composition and relative abundance.
The number of OTUs (richness), and the Shannon, Simpson, and Chao1 indices of the gut microbiota in the foregut and hindgut were significantly higher than those in the midgut (p < 0.05; Figure 1C,D,F,G, and Table S2). Although the PD index of the midgut microbiota also tended to be lower than those of the foregut and hindgut, no significant difference was detected (p > 0.05; Figure 1E and Table S2). As a result, the Goods coverage of microbial species in the midgut microbiota was significantly higher than that in the foregut and hindgut (p < 0.05; Figure 1H and Table S2).
A total of 13 prokaryotic phyla were detected in the gut microbiota of S. caldwelli. Four dominant phyla, each with a relative abundance exceeding 1% in at least one sample, were identified: Bacteroidota, Firmicutes, Fusobacteriota, and Proteobacteria (Figure 1I and Table S3). Proteobacteria represented the highest proportion of the gut microbiota. The relative abundance of Fusobacteriota in the midgut microbiota was significantly higher than that in the hindgut (Kruskal–Wallis rank sum test, χ2 = 6.187, p = 0.045; Figure 1J and Table S3).
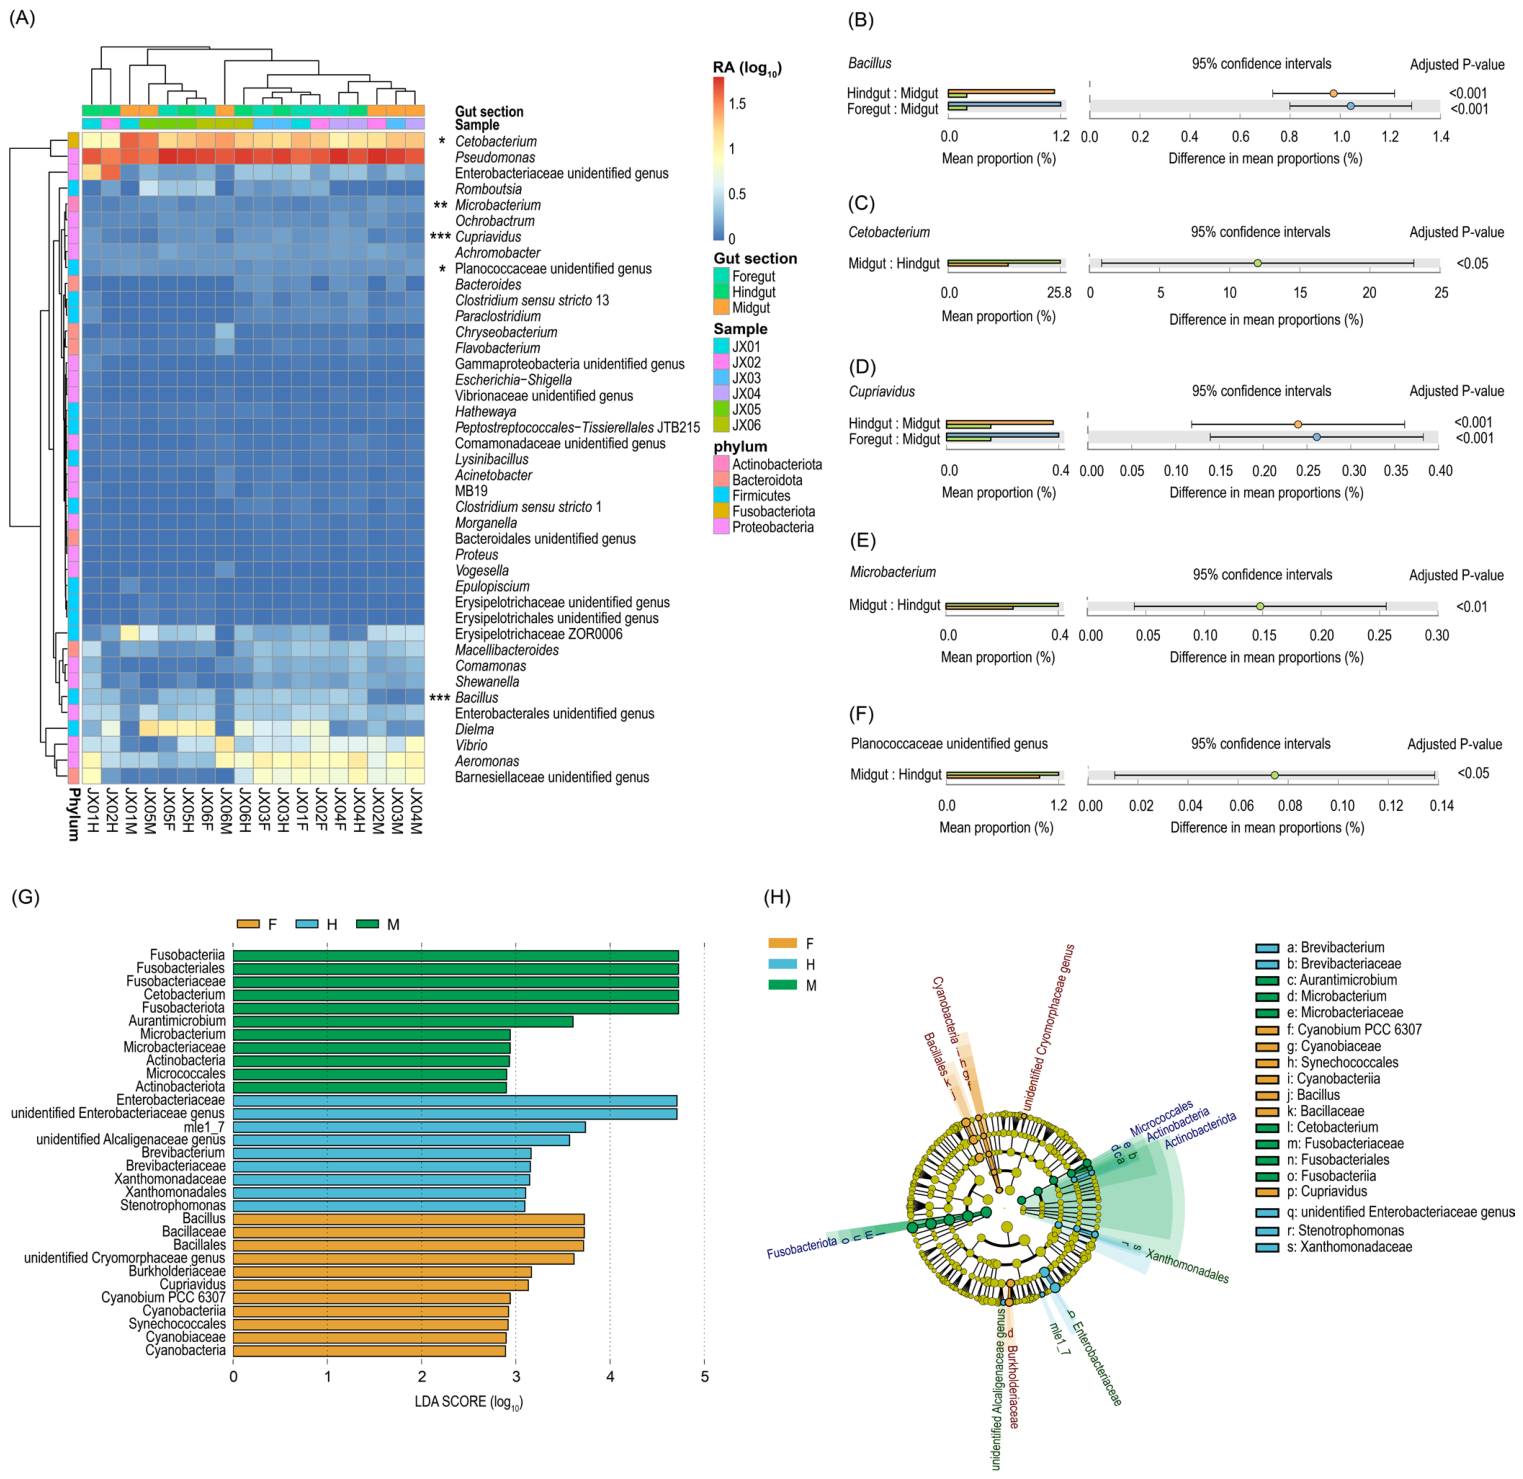
At the genus level, the most abundant genus in the gut microbiota was Pseudomonas, with a relative abundance of 52.812 ± 9.073% in the foregut, 48.409 ± 9.098% in the midgut, and 49.847 ± 8.954% in the hindgut, followed by Cetobacterium with 17.228 ± 5.033% in the foregut, 25.584 ± 10.847% in the midgut, and 13.616 ± 4.573% in the hindgut (Figure 2A and Table S4). Furthermore, Romboutsia, Vibrio, Bacillus, Aeromonas, Comamonas, Shewanella, Achromobacter, Cupriavidus, Lysinibacillus, Ochrobactrum, Microbacterium, Flavobacterium, Bacteroides, Clostridium sensu stricto 13, Clostridium sensu stricto 1, Paraclostridium, Chryseobacterium, Acinetobacter, Morganella, Epulopiscium, Proteus, Escherichia-Shigella, Hathewaya, Peptostreptococcales-Tissierellales JTB215, Vogesella, Macellibacteroides, and Dielma were also identified as dominant genera in the gut microbiota (Figure 2A). The relative abundances of Bacillus and Cupriavidus in the midgut microbiota were significantly lower than those in the other two gut segments (p < 0.05; Figure 2B,D, and Table S4). Moreover, Cetobacterium, Microbacterium, and an unidentified Planococcaceae genus were significantly more prevalent in the midgut microbiota than in the hindgut microbiota (p < 0.05; Figure 2C,E,F, and Table S4). LEfSe results showed that Cyanobium PCC 6307, Bacillus, and Cupriavidus were detected as foregut microbial indicators; Aurantimicrobium, Microbacterium, and Cetobacterium were detected as midgut microbial indicators; and Brevibacterium, and Stenotrophomonas were detected as hindgut microbial indicators (Figure 2G,H, and Table S4).

3.2. Differences in the Ecological Network of Gut Microbiota Between Different Intestinal Segments

The foregut microbial network was the most complex, with 1435 nodes and 19,017 edges, followed by the hindgut microbial network, which contained 1409 nodes and 18,662 edges. The midgut microbial network was relatively simple, with 1234 nodes and 18,824 edges (Table 1). This pattern was consistent with the functional differentiation of the gut: the foregut, as the main site of digestion, requires more complex microbial interactions to support nutrient metabolism and to suit a complex environment. Network density analysis showed that the midgut microbial network density (edges/nodes) was 15.25, higher than that of the foregut (13.25) and hindgut (13.24), indicating that connections among midgut microbes are stronger and more stable, and that microbial interactions occur more frequently. This high connectivity implies that the midgut microbiota is more stable than the foregut and hindgut microbiota.
Edge-type analysis revealed distinct interaction strategies among microbiota across different gut segments. In the foregut microbiota, negative interactions (2947 edges) accounted for 15.50%, whereas positive interactions (16,070 edges) made up 84.50%, indicating that synergy predominated in the foregut. In the midgut microbiota, negative interactions (1218 edges) accounted for 6.47%, and positive interactions (17,606 edges) accounted for 93.53%. In the hindgut microbiota, negative interactions (2427 edges) restored to 13.01%, while positive interactions (16,235 edges) decreased to 86.99% (Table 2). These patterns implied that synergistic metabolism of nutrients dominated in the gut microbiota of S. caldwelli, with multiple microbes collaborating in the degradation of nutrients.

3.3. Differences in Intra-Module Interaction Patterns Between Different Intestinal Segments

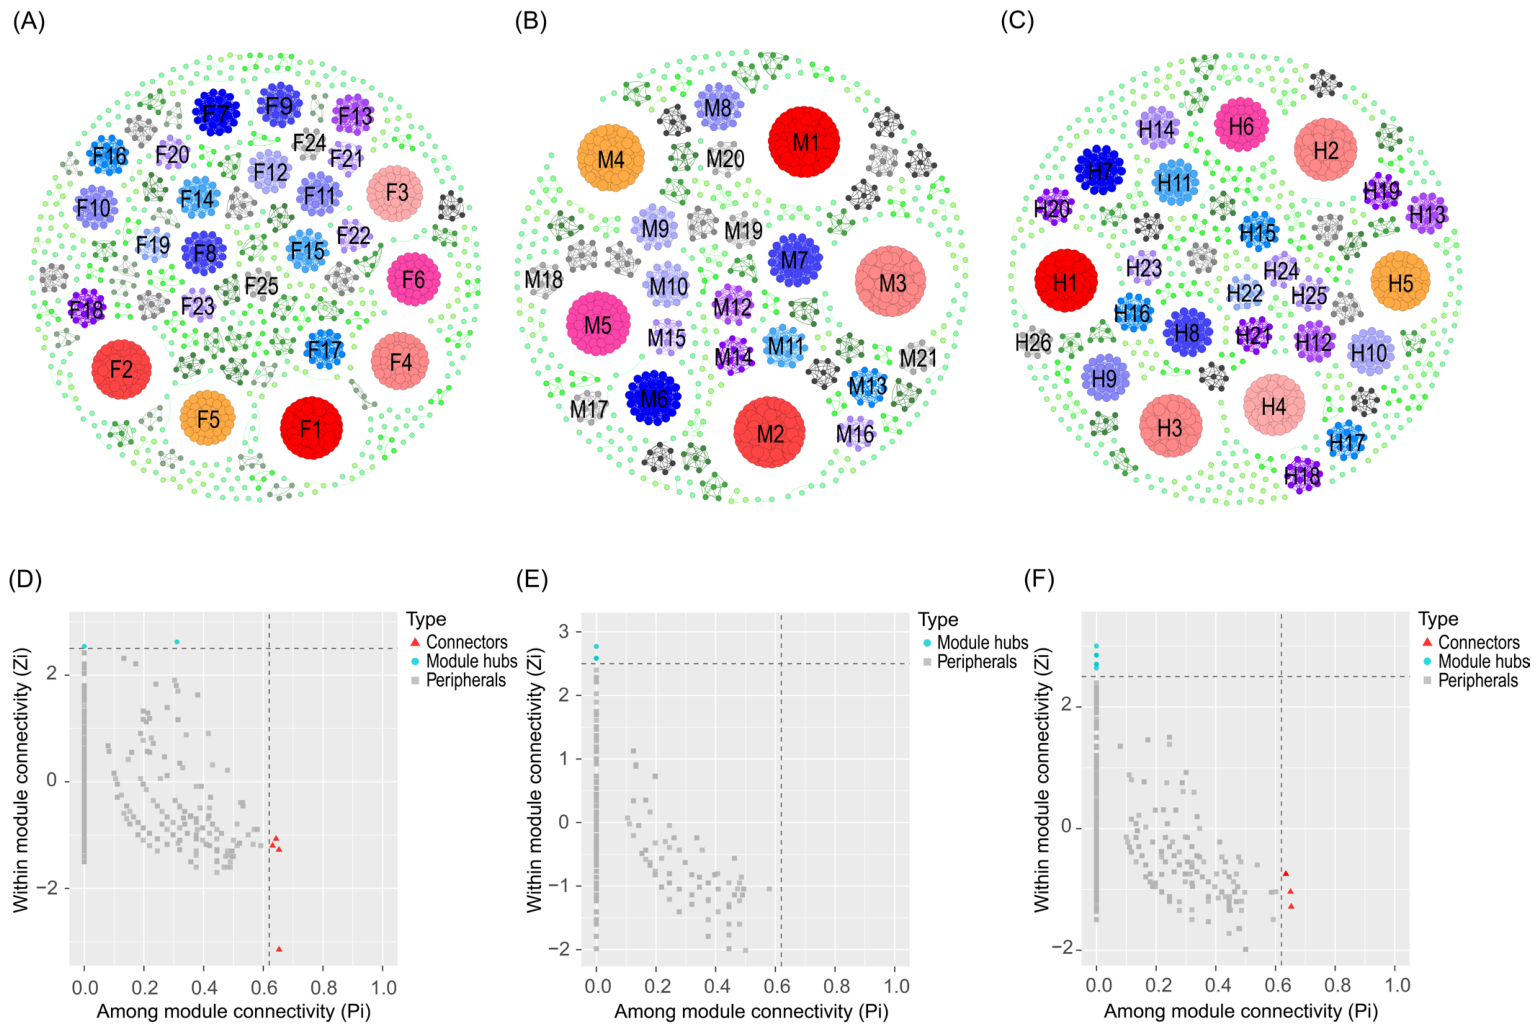
Based on the results of fast greedy modularity optimization, the intra-module interactions within each intestinal segment network showed distinct characteristics. Among the 25 modules with ≥10 OTUs in the foregut microbiota, F1 (65 OTUs) was the largest module, whereas F2 (54 OTUs), F3 (47 OTUs), F4 (42 OTUs), F5 (40 OTUs), and F6 (36 OTUs) also contained many nodes and dense internal connections, serving as the “functional hubs” of the foregut microbial ecology (Figure 3A). Moreover, two nodes and four nodes were identified as module hubs and connectors, respectively (Figure 3D and Table 2). The 21 modules in the midgut microbiota displayed more complex interaction patterns. The five largest modules—M1 (75 OTUs), M2 (74 OTUs), M3 (72 OTUs), M4 (58 OTUs), and M5 (49 OTUs)—indicated that the “network control power” of core cooperative nodes was significantly higher than that of competitive nodes (Figure 3B). Moreover, two nodes were identified as module hubs (Figure 3E and Table 2). The 26 modules in the hindgut microbiota had fewer interconnections. The five largest modules, H1 (56 OTUs), H2 (55 OTUs), H3 (51 OTUs), H4 (46 OTUs), and H5 (33 OTUs), served as the core carriers of hindgut microbial ecological functions (Figure 3C). Moreover, four nodes and three nodes were identified as module hubs and connectors, respectively (Figure 3F and Table 2).

3.4. Differences in Predicted Functions of Gut Microbiota

The predicted functional gene composition of the microbiota based on the species composition of the gut microbiota detected a total of 411 KEGG pathways and 10,543 KOs with 0.088 ± 0.020 of weighted NSTI (Table S5). These KOs were grouped into 45 KEGG level 2 functional categories. NMDS results showed that no significant difference was detected in the composition of predicted functional gene composition among the gut segments (Figure S2). After filtering out non-prokaryotic categories, such as human diseases and organismal systems, 22 categories were further analyzed. Most genes encoded by the gut microbiota were related to metabolism, including amino acid metabolism, carbohydrate metabolism, lipid metabolism, energy metabolism, cofactor and vitamin metabolism, and xenobiotics biodegradation and metabolism. These were followed by genes involved in genetic information processing, such as replication and repair, translation, folding, sorting and degradation, and transcription (Figure S3).
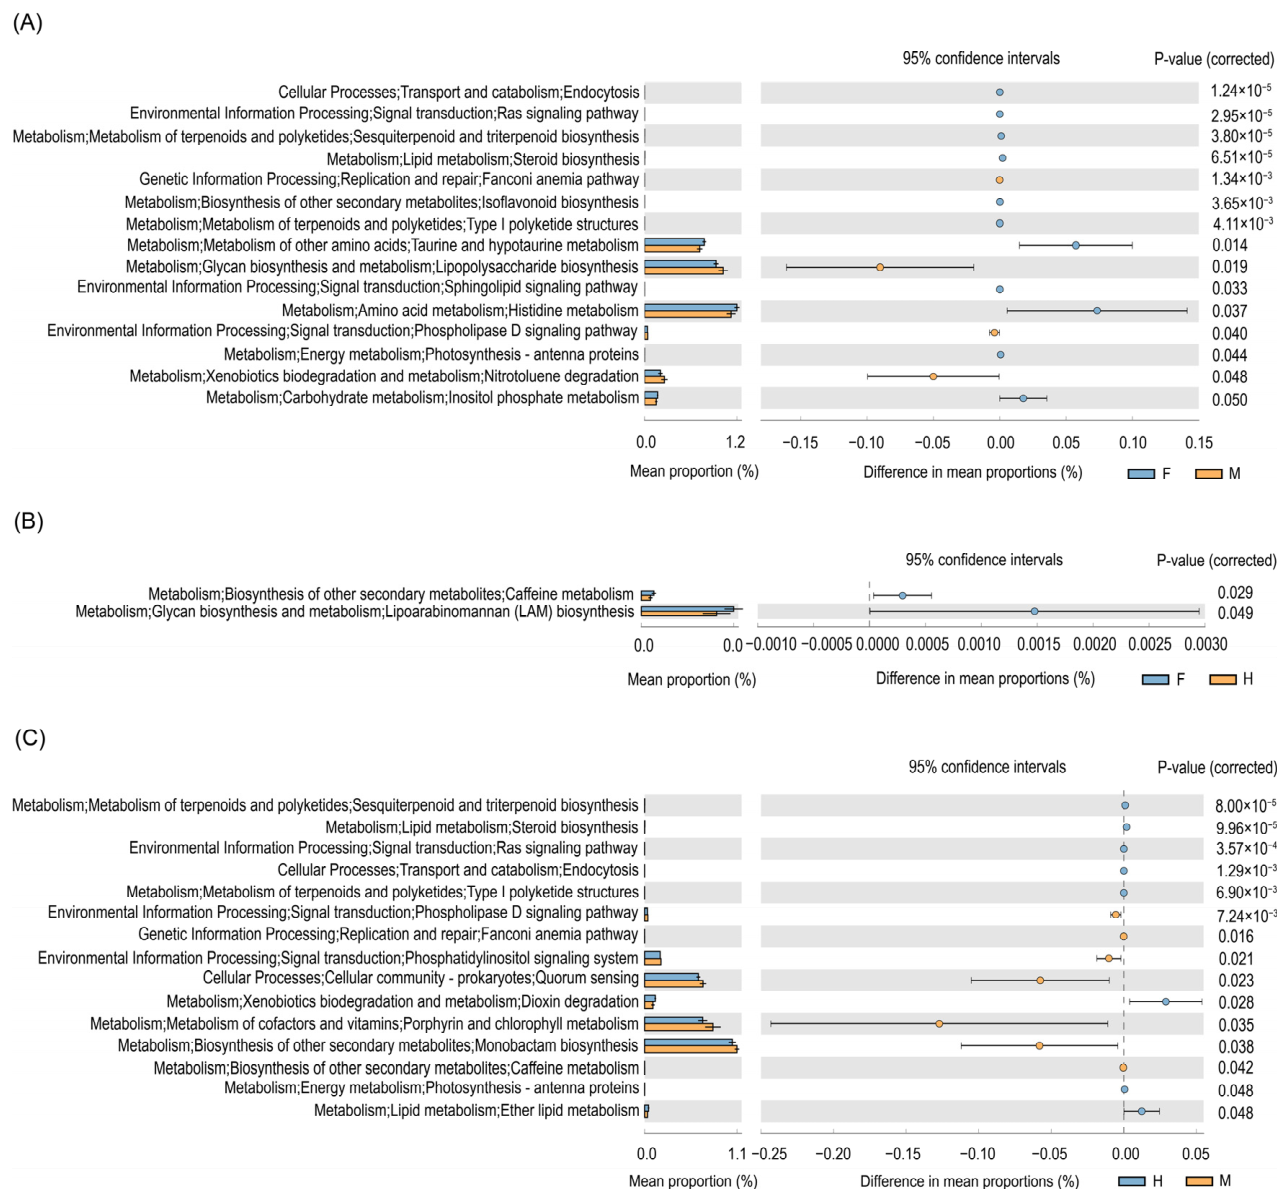
Compared with the midgut microbiota, the foregut microbiota showed enhanced endocytosis, the Ras signaling pathway, sesquiterpenoid and triterpenoid biosynthesis, steroid biosynthesis, isoflavonoid biosynthesis, type I polyketide structures, taurine and hypotaurine metabolism, sphingolipid signaling pathway, histidine metabolism, photosynthesis-antenna proteins, and inositol phosphate metabolism. In contrast, the midgut microbiota showed enhanced the Fanconi anemia pathway, lipopolysaccharide biosynthesis, phospholipase D signaling pathway, and nitrotoluene degradation compared with the foregut microbiota (Figure 4A). Caffeine metabolism and lipoarabinomannan biosynthesis were enhanced in the foregut microbiota compared with the hindgut microbiota (Figure 4B). Compared with the midgut microbiota, sesquiterpenoid and triterpenoid biosynthesis, steroid biosynthesis, endocytosis, type I polyketide structures, dioxin degradation, photosynthesis-antenna proteins, and ether lipid metabolism pathways were significantly enriched in the hindgut microbiota, whereas phospholipase D signaling pathway, Fanconi anemia pathway, phosphatidylinositol signaling system, quorum sensing, porphyrin and chlorophyll metabolism, monobactam biosynthesis, and caffeine metabolism pathways were significantly reduced (Figure 4C). These results suggest that the metabolic patterns of the foregut and hindgut microbiota were more similar to each other than either was to the midgut microbiota, and that the different metabolic pathways were mainly concentrated in the metabolism and environmental information processing.

4. Discussion

The diversity and functions of gut microbiota in healthy wild fish in their natural habitats are crucial for understanding the impact of fish microbiota in aquaculture and represent the first step in microbial manipulation in aquaculture systems [44]. In this study, we analyzed the diversity, interaction mechanisms, and potential functions of microbiota in different gut segments of S. caldwelli. The gut segment is considered one of the variables affecting the composition of fish gut microbiota [12]. Our results showed that the alpha-diversity indices of gut microbiota in the foregut and hindgut were significantly higher than those in the midgut. The relative abundance of Fusobacteriota in the midgut microbiota was significantly higher than in the hindgut. Moreover, the relative abundances of Bacillus and Cupriavidus in the midgut microbiota were significantly lower than those in the other two gut segments. The relative abundances of Cetobacterium and Microbacterium in the midgut microbiota were significantly higher than that in the hindgut. Network density analysis showed that the midgut microbial network density was 15.25, higher than that of the foregut (13.25) and hindgut (13.24), indicating that connections among midgut microbes are stronger and more stable, and that microbial interactions occur more frequently. These results provide crucial reference information for further in-depth exploration of the relationship between the intestinal functions of S. caldwelli and its gut microbiota, and lay the foundation for a deeper understanding of the functional differences among various gut microbiota.
Li et al. [45] reported that Bacteroidetes, Firmicutes, Fusobacteria, and Proteobacteria are the dominant phyla in the gut microbiota of common carp, silver carp, bighead carp, and grass carp. Our results also showed that Bacteroidota, Firmicutes, Fusobacteriota and Proteobacteria were the dominant phyla in different intestinal segments of S. caldwelli, but the relative abundance of Proteobacteria was obviously higher than in these four Asian cyprinids. These results indicate that there is a core microbiome dominated by Proteobacteria in the gut microbiota of S. caldwelli. The relative abundance of Fusobacteriota was higher in the midgut than in the hindgut of S. caldwelli, consistent with bighead carp [46] and grass carp [47].
Aeromonas, Pseudomonas, and Bacteroides are the dominant genera in the gut microbiota of freshwater fish [48]. In this study, Pseudomonas and Cetobacterium dominated the gut microbiota of S. caldwelli. However, Cetobacterium and Clostridium are the major bacterial genera in the gut microbiota of other cyprinids, such as grass carp, Carassius auratus, silver carp, and bighead carp [47]. Pseudomonas is a diverse bacterial group that can synthesize various extracellular enzymes, including proteases, amylases, and chitinases, and has a wide range of metabolic capabilities, ecological distribution, and adaptability to different environmental niches [49]. Feng et al. [50] found that Pseudomonas may be associated with pathogenic antagonism or participate in digestive enzyme secretion, and Pseudomonas strains have been used as probiotics in aquaculture, improving the response of different hosts to pathogens [51,52]. As a common intestinal bacterium, Cetobacterium can maintain the ecological balance of the intestine by inhibiting harmful bacteria [53]. It can also secrete various extracellular enzymes to degrade complex carbohydrates and synthesize vitamin B12 to promote protein fermentation and amino acid absorption, meeting its growth and energy needs [54,55]. Cetobacterium can produce short-chain fatty acids (SCFAs) such as acetic acid, propionic acid, and butyric acid. It also promotes glucose homeostasis, enhances intestinal barrier function, and improves disease resistance [13,56,57]. Wang et al. [58] found that the enrichment of Cetobacterium in the gut of Monopterus albus was correlated with its immunomodulatory function, whereas the abundance of Cetobacterium in the gut of S. caldwelli was higher and exhibited the same immunomodulatory function as in M. albus. However, our results showed that its relative abundance in the midgut of S. caldwelli was significantly higher than in the hindgut, implying differences in nutrient metabolism and immune function between the different gut segments of S. caldwelli.
Host food preferences obviously influence the composition of their gut microbiota [59]. In fish with different diets, there are often characteristic microbes present to aid in the digestion and absorption of various nutrients [5]. For instance, herbivorous fish tend to have a gut microbiota dominated by Clostridium, Citrobacter, and Leptotrichia, whereas carnivorous fish are primarily dominated by Cetobacterium and Halomonas. Omnivorous and filter-feeding fish, on the other hand, have a gut microbiota mainly dominated by Clostridium, Cetobacterium, and Halomonas [11,60]. As an omnivorous fish, S. caldwelli primarily feed on aquatic plants, and filamentous algae. They also consume aquatic insects and their larvae, organic detritus, seeds of plants, as well as small fish and shrimp. During the juvenile stage, their feeding habits tend to shift towards more animal-based food, resulting in a significant increase in protease activity. These changes may reflect a compensatory mechanism, where the fish increases enzyme secretion to ensure efficient digestion, similar to what has been observed in other omnivorous fish species such as carp [61]. Pseudomonas and Cetobacterium, both of which are found in the gut of S. caldwelli, are known to produce proteases and amylases [44], and can participate in amino acid and carbohydrate metabolism. Bacteroides, a dominant bacterial group in the gut of herbivorous fish, can assist in the digestion of cellulose. The presence of high-energy metabolic pathways suggests that gut microbes can provide energy for the host to digest and metabolize food [60,62]. Additionally, processes such as membrane transport and cell replication and repair, which are essential biological processes that are widely present in bacteria [63]. Therefore, it is reasonable that microbial genes involved in these functions are highly abundant in the gut of S. caldwelli, which is consistent with S. caldwelli being an omnivorous fish with a tendency toward herbivory. The gut microbiota of S. caldwelli has co-evolved with its diet, resulting in a broad-spectrum metabolic microbiota supported by microbes with specific functions. Through functional complementarity and dynamic responses, the fish is able to efficiently utilize diverse food sources. The diverse food sources available to omnivorous fish create nutritional selection pressures for the microbiota, while the functional synergy of these microbes provides micro-ecological support for the fish flexible dietary adjustments. Together, these factors establish the nutritional niche advantage of S. caldwelli in complex freshwater ecosystems.
S. caldwelli belongs to the stomachless Cyprinidae family and has intestines that coil seven times. Histological and anatomical characteristics support the division of the intestine into the foregut, midgut, and hindgut. The mucosal folds and columnar epithelial cells in the foregut and midgut are obviously higher than those in the hindgut. The diameter, mucosal height, and muscle layer thickness decrease from the foregut to the hindgut, whereas the number of goblet cells follows a “high-low-high” distribution pattern [30]. The foregut is the main digestive region of S. caldwelli, with the highest activities of α-amylase, lipase, and alkaline phosphatase, making it the core area for initial food digestion. Pseudomonas, such as Pseudomonas nitroreducens, prevents excessive microbial growth through competitive inhibition (negative interactions account for about 70%) and secretes proteases and amylases to participate in the breakdown of macromolecules [49]. The midgut is the metabolic hub area for S. caldwelli, serving as the core zone for glycolysis and fatty acid metabolism, and is responsible for xenobiotic detoxification and pathogen interactions. Cetobacterium, such as Cetobacterium somerae, is the most abundant in the midgut and supports energy metabolism through degrading complex carbohydrates and synthesizing vitamin B12 and SCFAs [54]. Cetobacterium works synergistically with Pseudomonas in both positive and negative interactions (accounting for 40.8% and 59.2%, respectively), regulating the balance of the microbiota [51]. The hindgut serves as the fermentation and immune zone for S. caldwelli, where dietary fiber is fermented and decomposed, maintaining intestinal barrier function. Bacteroidaceae maintain microecological stability through competitive inhibition. Cetobacterium participates in 15–20% of positive interactions, and synergistic metabolism enhances the host disease resistance [53]. The gut microbiota of S. caldwelli is dominated by Pseudomonas, with key co-occurring groups including Cetobacterium, and unclassified genera. This structure is the result of long-term co-evolution between the host omnivorous-leaning herbivorous diet and its microbiota: Pseudomonas dominates digestion and immune defense throughout the gut, whereas Cetobacterium focuses on nutrient transformation in the midgut. The microbiota establishes a closed-loop utilization of the full nutritional spectrum of “plant carbohydrates—animal proteins”, supporting the host metabolic needs. The gut segmentation of S. caldwelli is based on anatomical differences and functional differentiation of the microbiota, with each segment microbiota maintaining microecological stability through competitive and cooperative mechanisms. The structural and functional adaptation of dominant microbes deeply reflects the evolutionary logic of diet-driven microbial selection and microbial support of dietary habits.
Microbiota are complex ecosystems that form intricate ecological networks through interspecies interactions, maintaining a dynamic balance [64]. These interactions can have positive, negative, or neutral effects on the host [65]. The gut microbiota is constantly changing, with different types of microbes engaging in a delicate balance of cooperation and competition [66]. In the gastrointestinal microbiota of Polyodon spathula, cooperation is the dominant interaction [9]. Similarly, previous studies have shown that microbial cooperation is prevalent in the gut microbiota of Apostichopus japonicus Selenka [67], Monopterus albus [68], Carassius auratus var. Pengze [69], and Oreochromis niloticus [70]. In contrast, microbial competition is the dominant interaction in the gut microbiota of zebrafish [71] and Betta splendens [72]. Yang et al. [12] found that in grass carp, competition dominates in the foregut and midgut, whereas cooperation is more prevalent in the hindgut. Our results showed that the microbiota in different gut segments of S. caldwelli were dominated by cooperation. In S. caldwelli, the foregut and midgut work together through enzymatic synergy to secrete digestive enzymes such as amylase and protease. This positive interaction between actinomycetes and proteomycetes enhances the decomposition efficiency of starch and addresses the issue of insufficient activity of a single enzyme. Complex nutrients like cellulose and chitin require coordinated decomposition by multiple microbiota, as a single microbiota cannot complete the entire metabolic chain. Positive interactions play a crucial role in this “tandem function”, such as the fermentation synergy in the hindgut. Bacteroides decompose complex polysaccharides into oligosaccharides, which are then converted into SCFAs by Cetobacterium. This positive interaction supports the “terminal fermentation” function of the hindgut. Our results indicated that synergistic metabolism of nutrients dominated in the gut microbiota of S. caldwelli, with multiple microbes collaborating in the degradation of nutrients.
Diet and habitat are considered important external factors affecting the structure and function of the gut microbiota [29,73,74,75]. Developmental stage, health condition, sex, and genetic background are important internal factors that affect the gut microbiota [73,75,76]. Although it is not difficult to study the influence of these factors on the gut microbiota of cultured fish, it is much more difficult to study their influence on the gut microbiota of wild fish, mainly because it is difficult to track the diet, habitat characteristics, health status, and genetic background of wild fish. Therefore, in this study, we did not examine in detail the effects of these factors on the gut microbiota of wild S. caldwelli. Research on the gut microbiota of wild fish still faces the challenge of having too few samples, especially for rare fish species. To ensure that the gut microbiota of the collected samples is representative, it is necessary to collect gut microbiota samples as soon as possible after capturing the fish for further analysis. As a result, it is difficult to obtain enough samples at a single sampling point in a short time. Therefore, in this study, only six fish individuals were sampled for gut microbiota analysis. Because the sample size was limited and the sex of the samples could not be determined as the most samples were fry, we did not analyze the influence of sex on the gut microbiota of wild S. caldwelli in this study. The small sample size also affects the reliability of the co-occurrence network analysis results, mainly because calculating Spearman correlation coefficients with only six samples is not reliable. Therefore, future studies need to use more samples to verify our results. Another issue worth noting is that food composition and satiety or hunger are important factors affecting gut microbiota structure [73,74], especially in studies of wild fish. However, in this study, because the samples were collected from Yichun in January, when the average temperature was below 10 °C, the fish had stopped feeding, and all of the fish studied were hungry. In a follow-up study, it will be necessary to further investigate the composition and function of fish gut microbiota throughout a year. Because the 18 gut microbiota samples analyzed in this study came from different intestinal segments of six fish individuals, the gut segments within each fish were not independent, which may have caused a pseudoreplication. Although we used non-parametric tests in this study to avoid this problem, the potential impact of this issue on our results is still worth noting. Although we used PICRUSt2 v2.6.1 software to predict the functions of the gut microbiota in this study, we did not further validate the predicted results. Therefore, our description of microbiota function needs to be further validated using techniques such as qPCR or metagenomic sequencing.

5. Conclusions

Pseudomonas was the dominant genus in the gut of S. caldwelli in the Yuanhe River. The distribution patterns of the microbiota were closely correlated with the omnivorous diet and intestinal physiological functions of S. caldwelli. However, our results need to be further verified through increasing the sample size and expanding the sampling period and geographic range. Moreover, our functional prediction results need to be further verified using techniques such as metagenomic sequencing.

Supplementary Materials

The following supporting information can be downloaded at https://www.mdpi.com/article/10.3390/d18090569/s1, Table S1: Basic information of sequencing data; Table S2: Differences in α-diversity indices of gut microbiota in different segments of Spinibarbus caldwelli; Table S3: Differences in the relative abundances of dominant phyla of gut microbiota among different gut segments of Spinibarbus caldwelli; Table S4: Differences in the relative abundances of dominant genera of gut microbiota among different gut segments of Spinibarbus caldwelli; Table S5: Weighted nearest sequenced taxon index (NSTI) of functional prediction based on gut microbiota composition using PICRUSt2; Figure S1: Sample photos (A) and intestinal segments (B); Figure S2: Non-metric multidimensional scaling (NMDS) profile shows the difference in predicted gene composition among different gut segments; Figure S3: Functional composition of the gut microbiota in Spinibarbus caldwelli.

Author Contributions

Conceptualization, J.L., Y.T. and T.X.; methodology, Y.T.; software, J.L.; validation, Y.T., H.W. (Huan Wang) and H.W. (Honglian Wang); formal analysis, J.L. and Y.T.; investigation, Y.T. and H.W. (Huan Wang); resources, Y.T. and T.X.; data curation, J.L.; writing—original draft preparation, Y.T.; writing—review and editing, Y.T. and T.X.; visualization, J.L.; supervision, J.L. and T.X.; project administration, Y.T.; funding acquisition, Y.T. and T.X. All authors have read and agreed to the published version of the manuscript.

Funding

This study was funded by the Science and Technology Research Project of Jiangxi Provincial Department of Education (grant No. GJJ2201731) and the Innovation and Demonstration of Breeding Mode in Pond Healthy Colleges and Universities (grant No. 2017NK1032).

Institutional Review Board Statement

This animal study protocol was approved by the Yichun University Medical Ethics Committee (protocol code 2023-40).

Data Availability Statement

Merged sequencing data is deposited into NCBI SRA database with accession number PRJNA1490925 (https://www.ncbi.nlm.nih.gov/sra/PRJNA1490925 (accessed on 7 July 2026)). Other data presented in this study are available on request from the corresponding author.

Acknowledgments

We would like to thank Jiajia Ni at Guangdong Meilikang Bio-Science Ltd. (Foshan, China) for their assistance with data analysis and visualization.

Conflicts of Interest

The authors declare no conflict of interest.

Abbreviations

The following abbreviations are used in this manuscript:
OTUOperational taxonomic units
PCoAPrincipal coordinates analysis
NMDSNon-metric multidimensional scaling
ANOSIMAnalysis of similarity

References

  1. Naylor, R.L.; Goldburg, R.J.; Primavera, J.H.; Kautsky, N.; Beveridge, M.C.M.; Clay, J.; Folke, C.; Lubchenco, J.; Mooney, H.; Troell, M. Effect of Aquaculture on World Fish Supplies. Nature 2000, 405, 1017–1024. [Google Scholar] [CrossRef] [Scilit]
  2. Tidwell, J.H.; Allan, G.L. Fish as Food: Aquaculture’s Contribution. EMBO Rep. 2001, 2, 958–963. [Google Scholar] [CrossRef] [Scilit]
  3. Food and Agriculture Organization of the United Nations. The State of World Fisheries and Aquaculture 2024: Blue Transformation in Action; Food and Agriculture Organization of the United Nations: Rome, Italy, 2024. [Google Scholar]
  4. Fishery and Fishery Administration of Ministry of Agriculture and Rural Affairs; National Aquatic Technology Extension Station; China Society of Fisheries. China Fishery Statistics Yearbook 2024; China Agricultural Press: Beijing, China, 2024.
  5. Liu, C.; Zhao, L.; Shen, Y. A Systematic Review of Advances in Intestinal Microflora of Fish. Fish Physiol. Biochem. 2021, 47, 2041–2053. [Google Scholar] [CrossRef] [Scilit]
  6. Kumari, K.; Nair, S.M. Gut Microbes and Its Physiological Role in Fish: Adaptive Strategies for Climatic Variability. In Outlook of Climate Change and Fish Nutrition; Springer Nature: Singapore, 2022; pp. 99–119. [Google Scholar]
  7. Li, H.; Zhong, Q.; Wirth, S.; Wang, W.; Hao, Y.; Wu, S.; Zou, H.; Li, W.; Wang, G. Diversity of Autochthonous Bacterial Communities in the Intestinal Mucosa of Grass Carp (Ctenopharyngodon idellus) (Valenciennes) Determined by Culture-Dependent and Culture-Independent Techniques. Aquac. Res. 2015, 46, 2344–2359. [Google Scholar] [CrossRef] [Scilit]
  8. Luan, Y.; Li, M.; Zhou, W.; Yao, Y.; Yang, Y.; Zhang, Z.; Ringø, E.; Erik Olsen, R.; Liu Clarke, J.; Xie, S.; et al. The Fish Microbiota: Research Progress and Potential Applications. Engineering 2023, 29, 137–146. [Google Scholar] [CrossRef] [Scilit]
  9. Yang, G.; Tao, Z.; Xiao, J.; Tu, G.; Kumar, V.; Wen, C. Characterization of the Gastrointestinal Microbiota in Paddlefish (Polyodon spathula). Aquac. Rep. 2020, 17, 100402. [Google Scholar] [CrossRef] [Scilit]
  10. Long, C.; Wu, J.; Liu, J. Microbiota in Different Digestive Tract of Paddlefish (Polyodon spathula) Are Related to Their Functions. PLoS ONE 2024, 19, e0302522. [Google Scholar] [CrossRef] [Scilit]
  11. Gajardo, K.; Rodiles, A.; Kortner, T.M.; Krogdahl, Å.; Bakke, A.M.; Merrifield, D.L.; Sørum, H. A High-Resolution Map of the Gut Microbiota in Atlantic Salmon (Salmo salar): A Basis for Comparative Gut Microbial Research. Sci. Rep. 2016, 6, 30893. [Google Scholar] [CrossRef] [Scilit]
  12. Yang, G.; Jian, S.Q.; Cao, H.; Wen, C.; Hu, B.; Peng, M.; Peng, L.; Yuan, J.; Liang, L. Changes in Microbiota along the Intestine of Grass Carp (Ctenopharyngodon idella): Community, Interspecific Interactions, and Functions. Aquaculture 2019, 498, 151–161. [Google Scholar] [CrossRef] [Scilit]
  13. Wang, S.; Meng, X.; Dai, Y.; Zhang, J.; Shen, Y.; Xu, X.; Wang, R.; Li, J. Characterization of the Intestinal Digesta and Mucosal Microbiome of the Grass Carp (Ctenopharyngodon idella). Comp. Biochem. Physiol. Part D 2021, 37, 100789. [Google Scholar] [CrossRef] [Scilit]
  14. Roeselers, G.; Mittge, E.K.; Stephens, W.Z.; Parichy, D.M.; Cavanaugh, C.M.; Guillemin, K.; Rawls, J.F. Evidence for a Core Gut Microbiota in the Zebrafish. ISME J. 2011, 5, 1595–1608. [Google Scholar] [CrossRef] [Scilit]
  15. Gu, H.; Feng, Y.; Zhang, Y.; Yin, D.; Yang, Z.; Tang, W. Differential Study of the Parabramis Pekinensis Intestinal Microbiota According to Different Habitats and Different Parts of the Intestine. Ann. Microbiol. 2021, 71, 5. [Google Scholar] [CrossRef] [Scilit]
  16. Wu, Y.; Li, Y.; Cheng, Z.; Xu, H.; Wang, M.; Ye, X.; Lai, M.; Zhang, D. The Haplotype-Resolved Chromosome-Level Genome Assembly of Spinibarbus caldwelli Provides Insights into Environmental Adaptability and Disease Resistance. Comp. Biochem. Physiol. Part D 2025, 56, 101611. [Google Scholar] [CrossRef] [Scilit]
  17. Zhang, C. Systematic Monograph of Chinese Carps; Higher Education Press: Beijing, China, 1959. [Google Scholar]
  18. Wu, X.; Yang, Q.; Le, P. Economic Fauna of China: Freshwater Fishes; Science Press: Beijing, China, 1979. [Google Scholar]
  19. Li, H. Study on the Feeding Habits of the Black-Spined Barb (Spinibarbus caldwelli) in the Pearl River System. J. Anhui Agric. Sci. 2007, 35, 7482–7483. [Google Scholar]
  20. Zhang, Y.; Li, Z.; Wang, F.; Guo, G.; Chen, X.; Zhang, L.; Hua, W. Enclosures Experiment for controlling filamentous algae (Spirogyras sp.) by Spinibarbus hollandi and Hypophthalmichthys molitrix. Acta Sci. Circum. 2015, 35, 780–788. [Google Scholar] [CrossRef]
  21. Li, Z.; Zhang, Y.; Zhang, L.; Zheng, T.; Jin, J.; Pan, L.; Wang, C. Study on Feeding Preference of Spinibarbus hollandi to Spirogyra, Hydrilla verticillata and Ceratophyllum demersum and Effect on Water Quality. Acta Hydrobiol. Sin. 2013, 37, 735–743. [Google Scholar]
  22. Yu, J.; Ouyang, S.; Wu, X. Study on Biology of Barbodes caldwelli (Nichols). Acta Agric. Jiangxi 2008, 20, 80–81. [Google Scholar]
  23. Shen, M.; Jiang, Z.; Zhang, K.; Li, C.; Liu, F.; Hu, Y.; Zheng, S.; Zheng, R. Transcriptome Analysis of Grass Carp (Ctenopharyngodon idella) and Holland’s Spinibarbel (Spinibarbus hollandi) Infected with Ichthyophthirius multifiliis. Fish. Shellfish Immunol. 2022, 121, 305–315. [Google Scholar] [CrossRef] [Scilit]
  24. Lv, Y.; Huang, X.; Yang, Y.; Yao, Z.; Xia, L. Analysis and Evaluation on Nutritive Composition and Quality in the Muscle of Spinibarbus caldwelli (Nichols). J. Huazhong Agric. Univ. 2008, 27, 86–90. [Google Scholar]
  25. Fan, Z.; Lei, W.; Fang, Y.; Sheng, J.; Zeng, Q.; Jian, S.; Fang, L.; Hong, Y.; Zhang, W. Chromosome-Level Genome Assembly and Annotation of Spinibarbus caldwelli. Sci. Data 2025, 12, 1138. [Google Scholar] [CrossRef] [Scilit]
  26. Liang, P.; Wang, Y.; Wu, L.; Qin, Z.; Lai, M.; Lin, J.; Shao, J.; Zhang, D. Optimal Dietary Lipid Requirement of Spinibarbus caldwelli: Comprehensive Characterization of Growth Performance, Feed Utilization, Serum Biochemical and Immune Parameters, Hepatic Lipid Metabolism and Health Maintenance. Aquaculture 2025, 598, 742072. [Google Scholar] [CrossRef] [Scilit]
  27. Yuan, X.; Yang, X.; Ge, H.; Li, H. Genetic Structure of Spinibarbus caldwelli Based on MtDNA D-Loop. Agric. Sci. 2019, 10, 173–180. [Google Scholar] [CrossRef]
  28. Wang, J.; Lin, H.; Xiao, J.; Tan, G.; Yan, L.; Chen, J.; Zhao, J.; Wang, J. Environmental DNA for Assessing Population and Spatial Distribution of Spinibarbus caldwelli in the Liuxi River. Diversity 2025, 17, 320. [Google Scholar] [CrossRef] [Scilit]
  29. Ni, J.; Yan, Q.; Yu, Y.; Zhang, T. Factors Influencing the Grass Carp Gut Microbiome and Its Effect on Metabolism. FEMS Microbiol. Ecol. 2014, 87, 704–714. [Google Scholar] [CrossRef] [Scilit]
  30. Tuo, Y.; Xiao, T.; Li, W. Morphological and Histological Characteristics of the Digestive System in Spinibarbus caldwelli. J. Hydroecol. 2019, 40, 83–92. [Google Scholar]
  31. Yang, S.; Lin, T.; Liou, C.; Peng, H. Influence of Dietary Protein Levels on Growth Performance, Carcass Composition and Liver Lipid Classes of Juvenile Spinibarbus hollandi (Oshima). Aquac. Res. 2003, 34, 661–666. [Google Scholar] [CrossRef] [Scilit]
  32. Lv, Y.; Chen, J.; Ye, J.; Huang, X.; Lao, S.; Shen, B.; Yao, Z. Effects of Diet Protein Level on the Growth, Body Composition and Digestive Enzyme Activities of the Barbudes caldwell Juvenile. Chin. J. Agric. Biotechol. 2009, 17, 276–281. [Google Scholar]
  33. Qin, Z.; Liang, P.; Lin, J. Effects of Dietary Protein Levels on Growth Performance, Digestive Enzyme Activities, Protein Metabolism and Intestinal Morphology of Juvenile Spinibarbus caldwelli. Chin. J. Anim. Nutr. 2023, 35, 1134–1146. [Google Scholar]
  34. Zhang, J.; Lin, Y.; Chen, D.; Chen, B.; Xue, L.; Fan, H. Study on the Effects of Bacillus subtili on the Gut Microbiota of Different Fish Varieties and Water Quality as Water Additive. J. Fish. Res. 2024, 46, 136–146. [Google Scholar]
  35. Zou, H.; Li, C.; Xiang, J.; Guo, J.; He, Z.; Xie, Z.; Li, H.; Yuan, Y.; Cheng, X. Effects of Dietary Lipid Levels on the Growth, Health, Gut Microbiota Composition and Lipid Metabolism of Juvenile Spinibarbus caldwelli. Anim. Feed Sci. Technol. 2025, 327, 116424. [Google Scholar] [CrossRef] [Scilit]
  36. Ni, D.; Hong, X. The histology of the digestive tract of the grass carp (Ctenopharyngodon idellus). Acta Hydrobiol. Sin. 1963, 3, 1–25. [Google Scholar] [CrossRef] [Scilit]
  37. Tamaki, H.; Wright, C.L.; Li, X.; Lin, Q.; Hwang, C.; Wang, S.; Thimmapuram, J.; Kamagata, Y.; Liu, W.-T. Analysis of 16S RRNA Amplicon Sequencing Options on the Roche/454 next-Generation Titanium Sequencing Platform. PLoS ONE 2011, 6, e25263. [Google Scholar] [CrossRef] [Scilit]
  38. Fu, C.; Ni, J.; Huang, R.; Gao, Y.; Li, S.; Li, Y.; Li, J.; Zhong, K.; Zhang, P. Sex Different Effect of Antibiotic and Probiotic Treatment on Intestinal Microbiota Composition in Chemically Induced Liver Injury Rats. Genomics 2023, 115, 110647. [Google Scholar] [CrossRef] [Scilit]
  39. Ni, J.; Fu, C.; Huang, R.; Li, Z.; Li, S.; Cao, P.; Zhong, K.; Ge, M.; Gao, Y. Metabolic Syndrome Cannot Mask the Changes of Faecal Microbiota Compositions Caused by Primary Hepatocellular Carcinoma. Lett. Appl. Microbiol. 2021, 73, 73–80. [Google Scholar] [CrossRef] [Scilit]
  40. Caporaso, J.G.; Kuczynski, J.; Stombaugh, J.; Bittinger, K.; Bushman, F.D.; Costello, E.K.; Fierer, N.; Peña, A.G.; Goodrich, J.K.; Gordon, J.I.; et al. QIIME Allows Analysis of High-Throughput Community Sequencing Data. Nat. Methods 2010, 7, 335–336. [Google Scholar] [CrossRef] [Scilit]
  41. Ni, J.; Li, X.; He, Z.; Xu, M. A Novel Method to Determine the Minimum Number of Sequences Required for Reliable Microbial Community Analysis. J. Microbiol. Methods 2017, 139, 196–201. [Google Scholar] [CrossRef] [Scilit]
  42. Deng, Y.; Jiang, Y.-H.; Yang, Y.; He, Z.; Luo, F.; Zhou, J. Molecular Ecological Network Analyses. BMC Bioinform. 2012, 13, 113. [Google Scholar] [CrossRef] [Scilit]
  43. Douglas, G.M.; Maffei, V.J.; Zaneveld, J.R.; Yurgel, S.N.; Brown, J.R.; Taylor, C.M.; Huttenhower, C.; Langille, M.G.I. PICRUSt2 for Prediction of Metagenome Functions. Nat. Biotechnol. 2020, 38, 685–688. [Google Scholar] [CrossRef] [Scilit]
  44. García-Márquez, J.; Cerezo, I.M.; Figueroa, F.L.; Abdala-Díaz, R.T.; Arijo, S. First Evaluation of Associated Gut Microbiota in Wild Thick-Lipped Grey Mullets (Chelon labrosus, Risso 1827). Fishes 2022, 7, 209. [Google Scholar] [CrossRef] [Scilit]
  45. Li, X.; Yu, Y.; Li, C.; Yan, Q. Comparative Study on the Gut Microbiotas of Four Economically Important Asian Carp Species. Sci. China Life Sci. 2018, 61, 696–705. [Google Scholar] [CrossRef] [Scilit]
  46. Qin, Z.; Xiao, R.; Liang, S.; Lin, Y. Diversity of Intestinal Flora of Bighead Carp and Isolation and Identification of Potential Probiotics. Modern Food Sci. Technol. 2023, 39, 41–52. [Google Scholar]
  47. Li, J.; Hou, J.; Zhang, P.; Liu, Y.; Xia, R.; Ma, X. Comparative Study of Intestinal Microbial Community Structure in Different Species of Carp in Aquaponics System. South China Fish. Sci. 2016, 12, 42–50. [Google Scholar]
  48. Ganguly, S.; Prasad, A. Microflora in Fish Digestive Tract Plays Significant Role in Digestion and Metabolism. Rev. Fish Biol. Fish. 2012, 22, 11–16. [Google Scholar] [CrossRef] [Scilit]
  49. Mielko, K.A.; Jabłoński, S.J.; Milczewska, J.; Sands, D.; Łukaszewicz, M.; Młynarz, P. Metabolomic Studies of Pseudomonas aeruginosa. World J. Microbiol. Biotechnol. 2019, 35, 178. [Google Scholar] [CrossRef] [Scilit]
  50. Feng, X.; Wu, Z. Study on Digestive Enzyme-Producing Bacteria from the Digestive Tract of Ctenopharyngodon idellus and Carassius auratus gibelio. Freshw. Fish. 2008, 38, 51–57. [Google Scholar]
  51. Hoque, F.; Jawahar Abraham, T.; Nagesh, T.S.; Kamilya, D. Pseudomonas aeruginosa FARP72 Offers Protection against Aeromonas hydrophila Infection in Labeo rohita. Probiotics Antimicrob. Proteins 2019, 11, 973–980. [Google Scholar] [CrossRef] [Scilit]
  52. Giri, S.S.; Jun, J.W.; Yun, S.; Kim, H.J.; Kim, S.G.; Kim, S.W.; Woo, K.J.; Han, S.J.; Oh, W.T.; Kwon, J.; et al. Effects of Dietary Heat-Killed Pseudomonas Aeruginosa Strain VSG2 on Immune Functions, Antioxidant Efficacy, and Disease Resistance in Cyprinus carpio. Aquaculture 2020, 514, 734489. [Google Scholar] [CrossRef] [Scilit]
  53. Bhardwaj, S.; Thakur, K.; Sharma, A.K.; Sharma, D.; Brar, B.; Mahajan, D.; Kumar, S.; Kumar, R. Regulation of Omega-3 Fatty Acids Production by Different Genes in Freshwater Fish Species: A Review. Fish. Physiol. Biochem. 2023, 49, 1005–1016. [Google Scholar] [CrossRef] [Scilit]
  54. Sugita, H.; Miyajima, C.; Deguchi, Y. The Vitamin B12-Producing Ability of the Intestinal Microflora of Freshwater Fish. Aquaculture 1991, 92, 267–276. [Google Scholar] [CrossRef] [Scilit]
  55. Larsen, A.M.; Mohammed, H.H.; Arias, C.R. Characterization of the Gut Microbiota of Three Commercially Valuable Warmwater Fish Species. J. Appl. Microbiol. 2014, 116, 1396–1404. [Google Scholar] [CrossRef] [Scilit]
  56. Kim, P.S.; Shin, N.R.; Lee, J.B.; Kim, M.S.; Whon, T.W.; Hyun, D.W.; Yun, J.H.; Jung, M.J.; Kim, J.Y.; Bae, J.W. Host Habitat Is the Major Determinant of the Gut Microbiome of Fish. Microbiome 2021, 9, 166. [Google Scholar] [CrossRef] [Scilit]
  57. Qi, X.; Zhang, Y.; Zhang, Y.; Luo, F.; Song, K.; Wang, G.; Ling, F. Vitamin B12 Produced by Cetobacterium somerae Improves Host Resistance against Pathogen Infection through Strengthening the Interactions within Gut Microbiota. Microbiome 2023, 11, 135. [Google Scholar] [CrossRef] [Scilit]
  58. Wang, Y.; Huang, G.; Zhou, Q.; Zhang, J.; Zhou, L.; Bao, Y.; Zhou, W. Differences in Composition of Microbial between Healthy Swamp Eels (Monopterus albus) and Swamp Eels Lying on Water Grass. Acta Agric. Univ. Jiangxi 2024, 46, 467–480. [Google Scholar] [CrossRef] [Scilit]
  59. Jiao, F.; Zhang, L.; Limbu, S.M.; Yin, H.; Xie, Y.; Yang, Z.; Shang, Z.; Kong, L.; Rong, H. A Comparison of Digestive Strategies for Fishes with Different Feeding Habits: Digestive Enzyme Activities, Intestinal Morphology, and Gut Microbiota. Ecol. Evol. 2023, 13, e10499. [Google Scholar] [CrossRef] [Scilit]
  60. Liu, H.; Guo, X.; Gooneratne, R.; Lai, R.; Zeng, C.; Zhan, F.; Wang, W. The Gut Microbiome and Degradation Enzyme Activity of Wild Freshwater Fishes Influenced by Their Trophic Levels. Sci. Rep. 2016, 6, 24340. [Google Scholar] [CrossRef] [Scilit]
  61. Hernández-Sámano, A.; Guzmán-García, X.; García-Barrientos, R.; Guerrero-Legarreta, I. Actividad Enzimática de Proteasas de Cyprinus carpio (Cypriniformes: Cyprinidae) Extraídas de Una Laguna Contaminada En México. Rev. Biol. Trop. 2017, 65, 589–597. [Google Scholar] [CrossRef] [Scilit]
  62. Ray, A.K.; Ghosh, K.; Ringø, E. Enzyme-Producing Bacteria Isolated from Fish Gut: A Review. Aquac. Nutr. 2012, 18, 465–492. [Google Scholar] [CrossRef] [Scilit]
  63. Wu, Z.; Wang, S.; Zhang, Q.; Hao, J.; Lin, Y.; Zhang, J.; Li, A. Assessing the Intestinal Bacterial Community of Farmed Nile Tilapia (Oreochromis niloticus) by High-Throughput Absolute Abundance Quantification. Aquaculture 2020, 529, 735688. [Google Scholar] [CrossRef] [Scilit]
  64. Coyte, K.Z.; Schluter, J.; Foster, K.R. The Ecology of the Microbiome: Networks, Competition, and Stability. Science 2015, 350, 663–666. [Google Scholar] [CrossRef] [Scilit]
  65. Faust, K.; Raes, J. Microbial Interactions: From Networks to Models. Nat. Rev. Microbiol. 2012, 10, 538–550. [Google Scholar] [CrossRef] [Scilit]
  66. Singh, B.K.; Thakur, K.; Kumari, H.; Mahajan, D.; Sharma, D.; Sharma, A.K.; Kumar, S.; Singh, B.; Pankaj, P.P.; Kumar, R. A Review on Comparative Analysis of Marine and Freshwater Fish Gut Microbiomes: Insights into Environmental Impact on Gut Microbiota. FEMS Microbiol. Ecol. 2025, 101, fiae169. [Google Scholar] [CrossRef] [Scilit]
  67. Yang, G.; Peng, M.; Tian, X.; Dong, S. Molecular Ecological Network Analysis Reveals the Effects of Probiotics and Florfenicol on Intestinal Microbiota Homeostasis: An Example of Sea Cucumber. Sci. Rep. 2017, 7, 4778. [Google Scholar] [CrossRef] [Scilit]
  68. Peng, M.; Xue, J.; Hu, Y.; Wen, C.; Hu, B.; Jian, S.; Liang, L.; Yang, G. Disturbance in the Homeostasis of Intestinal Microbiota by a High-Fat Diet in the Rice Field Eel (Monopterus albus). Aquaculture 2019, 502, 347–355. [Google Scholar] [CrossRef] [Scilit]
  69. Li, J.; Fang, P.; Yi, X.; Kumar, V.; Peng, M. Probiotics Bacillus Cereus and B. subtilis Reshape the Intestinal Microbiota of Pengze Crucian Carp (Carassius auratus Var. Pengze) Fed with High Plant Protein Diets. Front. Nutr. 2022, 9, 1027641. [Google Scholar] [CrossRef] [Scilit]
  70. Liu, G.; Verdegem, M.; Ye, Z.; Liu, Y.; Zhao, J.; Zhu, S. Co-Occurrence Patterns in Biofloc Microbial Communities Revealed by Network Analysis and Their Impact on the Host. Aquaculture 2023, 577, 739964. [Google Scholar] [CrossRef] [Scilit]
  71. Xiao, F.; Zhu, W.; Yu, Y.; Huang, J.; Li, J.; He, Z.; Wang, J.; Yin, H.; Yu, H.; Liu, S.; et al. Interactions and Stability of Gut Microbiota in Zebrafish Increase with Host Development. Microbiol. Spectr. 2022, 10, e0169621. [Google Scholar] [CrossRef] [Scilit]
  72. Gruneck, L.; Jinatham, V.; Therdtatha, P.; Popluechai, S. Siamese Fighting Fish (Betta splendens Regan) Gut Microbiota Associated with Age and Gender. Fishes 2022, 7, 347. [Google Scholar] [CrossRef] [Scilit]
  73. Hasan, N.; Yang, H. Factors affecting the composition of the gut microbiota, and its modulation. PeerJ 2019, 7, e7502. [Google Scholar] [CrossRef] [Scilit]
  74. Karahan, F. Environmental factors affecting the gut microbiota and their consequences. Nat. Cell Sci. 2024, 2, 133–140. [Google Scholar] [CrossRef] [Scilit]
  75. Yang, J.; Wu, J.; Li, Y.; Zhang, Y.; Cho, W.C.; Ju, X.; van Schothorst, E.M.; Zheng, Y. Gut bacteria formation and influencing factors. FEMS Microbiol. Ecol. 2021, 97, fiab043. [Google Scholar] [CrossRef] [Scilit]
  76. Ni, J.; Yu, Y.; Zhang, T.; Gao, L. Comparison of intestinal bacterial communities in grass carp, Ctenopharyngodon idellus, from two different habitats. Chin. J. Oceanol. Limnol. 2012, 30, 757–765. [Google Scholar] [CrossRef] [Scilit]
Figure 1. Gut microbiota structure and taxa composition of Spinibarbus caldwelli. PCoA profiles based on weighted (A) and unweighted (B) UniFrac distance show differences in gut microbiota structure among different gut segments. (CH) Boxplots show differences in species richness, Shannon index, phylogenetic diversity (PD) distance, Simpson index, Chao1 index, and Goods coverage of gut microbiota among different gut segments, respectively. (I) Stacked bar chart shows the composition of dominant phyla in the gut microbiota. (J) Horizontal bar chart shows the differences in the relative abundance of dominant phyla between different intestinal segments. p values were adjusted using the Bonferroni method. * p < 0.05, ** p < 0.01.
Diversity 18 00569 g001
Figure 2. Heatmap profile (A), horizontal post hoc chart (BF), and horizontal bar chart (G) and cladogram (H) of linear discriminant analysis effect size show the differences in the relative abundances of dominant genera in the gut microbiota of Spinibarbus caldwelli between different gut segments. (B) Differences in the relative abundances of Bacillus between different gut segments. (C) Differences in the relative abundances of Cetobacterium between different gut segments. (D) Differences in the relative abundances of Cupriavidus between different gut segments. (E) Differences in the relative abundances of Microbacterium between different gut segments. (F) Differences in the relative abundances of unidentified Planococcaceae genus between different gut segments. When drawing the heatmap, the data was transformed according to the formula log10(relative abundance × 100 + 1). Linear discriminant analysis (LDA) score > 2 was set as the threshold for significant differences when conducting LDA effect size (LEfSe). F, foregut; M, midgut; H, hindgut. * p < 0.05; ** p < 0.01; *** p < 0.001.
Diversity 18 00569 g002
Figure 3. Co-occurrence network describes the submodules and the interspecific interaction within the gut microbiota of Spinibarbus caldwelli. (A) Foregut microbiota; (B) Midgut microbiota; (C) Hindgut microbiota; (D) Zi-Pi plot shows the distribution of foregut microbiota OTUs based on their topological roles in S. caldwelli; (E) Zi-Pi plot shows the distribution of midgut microbiota OTUs based on their topological roles in S. caldwelli; (F) Zi-Pi plot shows the distribution of hindgut microbiota OTUs based on their topological roles in S. caldwelli. Colors of the nodes inside the network indicate different modules. The edges inside the network represent the interactions between OTUs. F1–F25, M1–M21, and H1–H26 showed the modules with ≥10 OTUs in the foregut, midgut, and hindgut microbiota. In the co-occurrence network, different colors represent modules that contain different nodes. According to the values of intra-module connections (Oi) and inter-module connections (Pi), node topology was classified into four types: peripherals (Oi ≤ 2.5, Pi ≤ 0.62), connectors (Oi ≤ 2.5, Pi > 0.62), module centers (Oi > 2.5, Pi ≤ 0.62), and network hubs (Oi > 2.5, Pi > 0.62). Networks were visualized using Gephi 0.9.2.
Diversity 18 00569 g003
Figure 4. Functional composition of the gut microbiota in Spinibarbus caldwelli. F, foregut microbiota; M, midgut microbiota; H, hindgut microbiota. (A) Differences in KEGG pathways between foregut and midgut microbiota. (B) Differences in KEGG pathways between foregut and hindgut microbiota. (C) Differences in KEGG pathways between hindgut and midgut microbiota. p values were adjusted using the Bonferroni method. p < 0.05 was considered significant.
Diversity 18 00569 g004
Table 1. Molecular ecological network characteristics of gut microbiota in Spinibarbus caldwelli.
Intestinal SegmentNumber of NodesNumber of EdgesAverage ConnectivityClustering
Coefficient
Modularity
Foregut143519,01726.5050.8890.876
Midgut123418,82430.5090.9670.888
Hindgut140918,66226.4900.9010.889
Table 2. The composition of the ecological network of gut microbiota in Spinibarbus caldwelli.
ClassForegutMidgutHindgut
Total number of OTUs143512341409
The number of module hubs224
The number of connectors403
The number of negative correlation edges294712182427
The number of positive correlation edges16,07017,60616,235
Total number of edges19,01718,82418,662
Disclaimer/Publisher’s Note: The statements, opinions and data contained in all publications are solely those of the individual author(s) and contributor(s) and not of MDPI and/or the editor(s). MDPI and/or the editor(s) disclaim responsibility for any injury to people or property resulting from any ideas, methods, instructions or products referred to in the content.