Article

Elevational Patterns of Avian Community Diversity in the Daba Mountains and Their Underlying Drivers


1
College of Life Sciences, Shaanxi Normal University, 620 West Chang’an Street, Chang’an District, Xi’an 710119, China
2
Shaanxi Hualongshan National Nature Reserve, Chengguan Town, Zhenping County, Ankang 725600, China
*
Authors to whom correspondence should be addressed.
These authors contributed equally to this work.
Diversity 2026, 18(9), 537; https://doi.org/10.3390/d18090537
Submission received: 10 July 2026 / Revised: 25 August 2026 / Accepted: 29 August 2026 / Published: 2 September 2026
(This article belongs to the Special Issue Ecology, Distribution, and Conservation of Endangered Birds)

Abstract

Mountain ecosystems serve as natural laboratories for studying biodiversity distribution along elevational gradients. This study was conducted at Hualongshan National Nature Reserve in the Daba Mountains, Shaanxi Province, using line transect surveys, mist-netting, and passive acoustic monitoring (PAM). We systematically examined the spatial variation and drivers of bird community diversity along the elevational gradient, integrating α and β diversity across taxonomic, functional, and phylogenetic dimensions. A total of 91 bird species from 8 orders and 33 families were recorded, among which breeding birds (84 species) were dominated by Oriental (55.95%) and Palaearctic (26.19%) species, reflecting significant transitional characteristics between the two realms. Alpha diversity exhibited a mid-elevation unimodal pattern, peaking at 1951~2250 m in the coniferous and broad-leaved mixed forest zone. β diversity decomposition revealed that taxonomic diversity was dominated by turnover, functional diversity by nestedness, and phylogenetic diversity by balanced contributions of both, indicating asynchrony among dimensions. Random forest models identified precipitation difference as the primary driver of taxonomic β diversity, while Enhanced Vegetation Index (EVI) difference dominated functional β diversity, revealing differentiated mechanisms by which water availability and vegetation productivity shape species composition and functional structure, respectively. Our findings highlight the asynchrony of multidimensional bird diversity, emphasizing that a single dimension cannot fully capture community assembly mechanisms, and provide theoretical and practical reference for mountain biodiversity conservation.

1. Introduction

Mountain ecosystems, characterized by steep environmental gradients, harbor rich biodiversity [1]. As indicator taxa highly sensitive to environmental changes, birds exhibit vertical distribution patterns of community diversity that reflect not only species’ utilization of spatial resources but also the shaping effects of ecological processes—including environmental filtering (the process by which abiotic environmental conditions filter the regional species pool), interspecific competition, and dispersal limitation—on community assembly [2].
Bird diversity along elevational gradients has long been central to biogeography. McCain’s global meta-analysis identified the mid-elevation unimodal pattern as the most prevalent [3]. Recent studies have demonstrated that taxonomic, functional, and phylogenetic diversity may exhibit asynchronous distribution patterns along elevational gradients [4,5,6]. This asynchrony reflects the differentiated shaping of different community dimensions by various ecological processes and provides new perspectives for understanding community assembly mechanisms (asynchrony refers to the decoupling among dimensions, whereby taxonomic, functional, and phylogenetic diversity exhibit divergent elevational distribution patterns or respond differentially to the same environmental drivers). At the β-diversity level, partitioning total β diversity into turnover and nestedness components helps identify the dominant processes driving changes in community composition—whether species replacement or selective loss [7].
The mechanisms driving the vertical distribution patterns of bird communities are multifaceted. Climatic factors (particularly temperature and precipitation) are considered the most fundamental environmental filters, limiting species distributions through physiological tolerance thresholds [8,9]. The habitat heterogeneity hypothesis emphasizes that vegetation structural complexity provides diverse niche spaces for different functional groups [10,11]. The resource availability hypothesis links elevational changes in diversity to the spatial distribution of food resources. These hypotheses are not mutually exclusive, and their relative importance may vary with study region, spatial scale, and community dimension [12]. Recent studies have also found that bird vertical migration behavior is closely related to interspecific competition and energy allocation, and climatic factors alone cannot fully explain seasonal elevational movements of species [13].
The Daba Mountains are situated at the boundary between northern and southern China and the transition zone between the warm temperate and subtropical regions, representing a key area where the Oriental and Palaearctic fauna converge. The Hualongshan National Nature Reserve in Shaanxi Province, located on the northern slope of the Daba Mountains, has its main peak Hualongshan as the second highest peak of the Daba Mountains, characterized by significant vertical relief and complete vegetation zonation [14,15], making it an ideal platform for studying the vertical distribution patterns of mountain bird communities. Earlier surveys recorded 224 bird species belonging to 16 orders and 50 families in this reserve [16], but systematic studies on the vertical distribution patterns of bird community diversity and their multidimensional driving mechanisms in this region are still lacking.
This study was conducted in the Hualongshan Nature Reserve, employing an integrated survey strategy combining line transects, mist-netting, and passive acoustic monitoring (PAM). From the taxonomic, functional, phylogenetic, and acoustic dimensions, and integrating both α and β scales, we aimed to: (1) elucidate the basic structural characteristics of the bird community in the study area; (2) reveal the vertical distribution patterns of multidimensional diversity along the elevational gradient; and (3) identify the driving factors of β-diversity patterns along the elevational gradient. Through these investigations, we seek to provide empirical evidence for understanding mountain bird community assembly mechanisms and to offer scientific guidance for the refined management of the Hualongshan and other similar nature reserves.

2. Methods

2.1. Study Area

Hualongshan National Nature Reserve is located at the junction of Zhenping County and Pingli County in Ankang City, Shaanxi Province, with geographical coordinates ranging from 109°16′41″ to 109°30′29″ E and 31°54′39″ to 32°8′13″ N, covering a total area of 28,103 hm2 [17]. The reserve is situated on the northern slope of the Daba Mountains and belongs to the northern subtropical monsoon climate zone, with an annual mean temperature of 12.1 °C and annual precipitation ranging from 946.2 to 1004.1 mm [14]. Both soil and vegetation exhibit distinct vertical zonation: below 1200 m, mountain yellow-cinnamon soils and agricultural areas predominate; between 1200 and 2000 m, mountain brown soils and deciduous broad-leaved forests occur; between 2000 and 2400 m, mountain dark brown soils and mixed coniferous and broad-leaved forests are found; and above 2400 m, mountain gray-brown soils with alpine coniferous forests, shrublands, and meadows dominate [15].
The main peak of the reserve, Hualongshan, ranges in elevation from 540 to 2917 m. Based on the reserve’s DEM (Digital Elevation Model) data and the characteristics of vertical vegetation zones, the study area was divided into four elevational zones: Zone 1 (1350~1650 m, transitional zone between river valley farmland and deciduous broad-leaved forest), Zone 2 (1651~1950 m, deciduous broad-leaved forest zone), Zone 3 (1951~2250 m, mixed coniferous and broad-leaved forest zone), and Zone 4 (2251~2550 m, alpine coniferous forest and shrub meadow zone).

2.2. Data Collection

2.2.1. Bird Abundance and Species Data

This study employed three complementary methods for bird surveys: line transect sampling, mist-netting, and PAM.
Line transect sampling: Two transects were established in each elevational zone, totaling eight transects. Surveys were conducted once per season in spring (April 2025), summer (July 2025), autumn (October 2025), and winter (February 2026), with a total of 24 effective survey days. Each transect was 1 km in length, and survey walks were conducted at a speed of 1.5–3 km/h. Binoculars and telephoto cameras were used to assist in species identification.
Mist-netting: One to two netting sites were established in each elevational zone. Each site consisted of multiple mist nets (6 m × 3 m or 9 m × 3 m) connected in series, with a total length of approximately 45 m. Netting was conducted once in April, July, and October 2025, with each session lasting two consecutive days. Nets were opened before sunrise and closed after sunset, and were checked hourly. Captured birds were identified to species and morphological measurements were recorded.
PAM: One to two acoustic recorders (model LY-S-01, Qingdao Canglu Original Ecology Technology Co., Ltd., Qingdao, China) were deployed in each elevational zone, fixed to tree trunks at approximately 2 m above ground. Recordings were collected during three periods: March–June, July–September, and October–December 2025. Daily recordings covered the dawn/dusk periods (60 min before sunrise and after sunset) and daytime periods (08:00–10:00, 12:00–13:00, 15:00–17:00, with 15 min recordings every 30 min). Data were retrieved and batteries replaced every 2–3 months.
In addition, observational data from the China Bird Report database (www.birdreport.cn, accessed on 12 November 2025) falling within the reserve boundaries were screened and incorporated for community diversity analyses.

2.2.2. Functional Trait Data

Eight functional traits were selected, encompassing six continuous variables (body mass, body length, bill length, wing length, tail length, and tarsus length) and two categorical variables (diet and foraging stratum) (Table 1). Morphological measurements for a subset of species were obtained through field mist-netting (Tables S3 and S6); for species lacking direct field measurements, data were supplemented from published datasets. Continuous trait data were obtained from the dataset of “Life-history and ecological traits of Chinese birds” [18], while categorical trait data were derived from the EltonTraits database [19]. For each species, both diet and foraging stratum were represented as percentages across multiple columns, with all columns summing to 100%. Partial morphological measurements were supplemented by field measurements from mist-netting.

2.2.3. Environmental Data

Temperature and precipitation data were obtained from the National Tibetan Plateau Data Center (https://data.tpdc.ac.cn, accessed on 15 September 2025) as monthly datasets at 1 km resolution [20]. Enhanced Vegetation Index (EVI) data were obtained from the National Earth System Science Data Center (https://www.geodata.cn, accessed on 19 November 2025) as monthly datasets at 1 km resolution [21]. Two-year averages (2023–2024) were extracted for each survey month, and the mean temperature, mean precipitation, and mean EVI values were calculated for each elevational zone. Elevational distance was calculated as the Euclidean distance between the mid-elevation values of each pair of elevational zones.

2.3. Data Analysis

2.3.1. Acoustic Identification

Bird acoustic identification was performed using two approaches: (1) direct batch recognition using BirdNet-Analyzer with a confidence threshold of 0.8 [22]; and (2) local transfer learning based on the BirdNet framework [23,24]. Audio recordings of 978 Chinese bird species retrieved from the xeno-canto repository underwent a preprocessing pipeline (including resampling to a uniform rate, temporal segmentation, and noise reduction) prior to training a custom classifier. When conducting local transfer learning based on the BirdNet framework, the training audio data were partitioned into an 80% training set and a 20% validation set. The sample sizes for each species are presented in Table S2. The same confidence threshold of 0.8 was adopted for species identification based on the self-trained classifier. Original recordings of PAM-exclusive detections were manually validated to confirm that each target species was aurally identified in at least three independent recordings. Additionally, spectrograms were generated from these PAM-unique species recordings using Raven Lite software for secondary visual confirmation. All identification results were manually reviewed and verified by experts to determine the final species checklist.

2.3.2. Diversity Metrics

The calculation of relative abundance and Simpson’s dominance index was primarily performed using functions such as “mutate”, “sum”, and “summarise” from the “dplyr” package in R, to quantitatively analyze the dominance and abundance characteristics of the avian communities across each elevational belt. Species with a dominance value ≥ 5% were classified as dominant species, those with a dominance value of 2–4.99% as subdominant species, and the remaining species as common/accidental species (the relevant results are presented in Tables S4 and S5).
Alpha taxonomic diversity: Shannon–Wiener index (H), Simpson’s index (1–D), and Pielou evenness index (E) were calculated. Beta taxonomic diversity: Bray–Curtis dissimilarity coefficient was used, and total beta diversity (βSOR) was partitioned into its turnover (βSIM) and nestedness (βSNE) components based on the Sorensen dissimilarity index [7]. For taxonomic diversity, the calculations were conducted primarily using the “vegan” and “betapart” R packages. Specifically, within the “vegan” package, the three alpha diversity indices (H, 1–D and E) were calculated via the “diversity” function, while the Bray–Curtis dissimilarity index for beta diversity was computed using the “vegdist” function. Furthermore, βSOR, along with βSIM and βSNE, were quantified using the “beta.pair” function in the “betapart” R package.
Alpha functional diversity: Functional richness index (FRic) and functional divergence index (FDiv) were calculated. Beta functional diversity: Bray–Curtis dissimilarity coefficient was used, and the total beta functional diversity (βSOR.F) was decomposed into functional turnover (βSIM.F) and functional nestedness (βSNE.F) [25]. The two alpha functional diversity indices (FRic and FDiv) were calculated using the “dbFD” function in the “FD” R package. For beta functional diversity, we first calculated the pairwise Gower distance based on functional traits using the “vegdist” function in the “vegan” R package. These distances were then subjected to a Principal Coordinate Analysis (PCoA) via the pcoa function in the “ape” R package to construct a functional space coordinate matrix (retained axes: 4, variance explained: 36.91%). Within the framework of the resulting four-dimensional PCoA functional space, βSOR.F, along with βSIM.F and βSNE.F, were quantified using the “beta.pair” function in the “betapart” R package. Sensitivity analysis revealed that the functional beta diversity matrix computed using raw continuous trait values (without log transformation) in combination with Gower distance was significantly consistent with that derived from the primary scheme of this study (Mantel r = 0.986, Spearman ρ = 0.943, both p < 0.05).
Alpha phylogenetic diversity: Faith’s phylogenetic diversity index (PD) and mean pairwise distance (MPD) were calculated. Beta phylogenetic diversity: The total beta phylogenetic diversity (βSOR.P) was decomposed into phylogenetic turnover (βSIM.P) and phylogenetic nestedness (βSNE.P) using the same framework. For phylogenetic diversity, the analyses were integrated across the “phangorn”, “picante”, and “betapart” R packages. To account for phylogenetic uncertainty in topology and branch length estimations, we retrieved 1000 alternative phylogenetic trees for the regional bird assembly from the global avian phylogenetic database BirdTree (https://birdtree.org/, accessed on 8 February 2026). A Maximum Clade Credibility (MCC) tree was then constructed using the maxCladeCred function in the “phangorn” R package. Within the picante package, the two alpha diversity indices—PD and MPD—were calculated via the “pd” and “mpd” functions, respectively. The total beta phylogenetic diversity (βSOR.P), along with βSIM.P and βSNE.P, were quantified using the “phylo.beta.pair” function in the “betapart” R package.
All diversity indices were calculated in R version 4.3.3, and bootstrap resampling (n = 1000) with replacement was applied to estimate the mean and standard deviation of each alpha diversity index.

2.3.3. Driving Factor Analysis

Surveys from the four seasons were treated as four repeated sampling events. The response variables were taxonomic β-diversity and functional β-diversity (Bray–Curtis dissimilarity coefficients) between each pair of elevational zones for each survey month. The explanatory variables included environmental distance matrices (Euclidean distances of temperature and precipitation) and a geographic distance matrix (Euclidean distance of elevational differences). Random forest models combined with SHAP (SHapley Additive exPlanations) values were used to parse the contribution of each factor [26,27]. The importance of each variable was ranked by the mean absolute SHAP value ( | S H A P | ¯ ), and the direction of its effect was determined by the mean SHAP value ( S H A P ¯ ). The random forest model was constructed with 1000 decision trees and evaluated using 10-fold cross-validation, with seasonal replicate sites treated as independent samples.

3. Results

3.1. Species Composition

In this study, a total of 91 bird species were recorded, belonging to 8 orders and 33 families. The community was dominated by Passeriformes, which comprise 79 species across 26 families (86.81%). In terms of residency status, residents and summer visitors were predominant, accounting for 84 species (92.31%). From a zoogeographic perspective, among the breeders (84 species), Oriental species were the most prevalent (47 species, 55.95%), followed by Palaearctic species (22 species, 26.19%) and widely distributed species (15 species, 17.86%). Notably, 11 species, spanning 4 orders and 8 families, were listed as nationally protected wildlife at the second class level in China (Table S1).

3.2. Elevational Patterns of Alpha and Beta Diversity

3.2.1. Taxonomic Diversity

Bird species diversity in the study area exhibited a typical unimodal distribution pattern along the elevational gradient (Figure 1). Species richness peaked in Zone 3 (1951~2250 m) and reached its lowest value in Zone 2 (Figure 1a). The Shannon–Wiener diversity index (H) and Simpson’s index (1–D) showed highly consistent trends, both peaking in Zone 3 (Figure 1b,c). In contrast, Pielou’s evenness index (E) exhibited a different distribution pattern, with its lowest value in Zone 1 and the second lowest in Zone 3 (Figure 1d), indicating that higher species richness at mid-elevations did not necessarily correspond to the highest evenness. Overall, bird community species diversity in the study area peaked in Zone 3, exhibiting a typical mid-elevation unimodal pattern, a result consistent with the general patterns of species vertical distribution in mountain ecosystems.
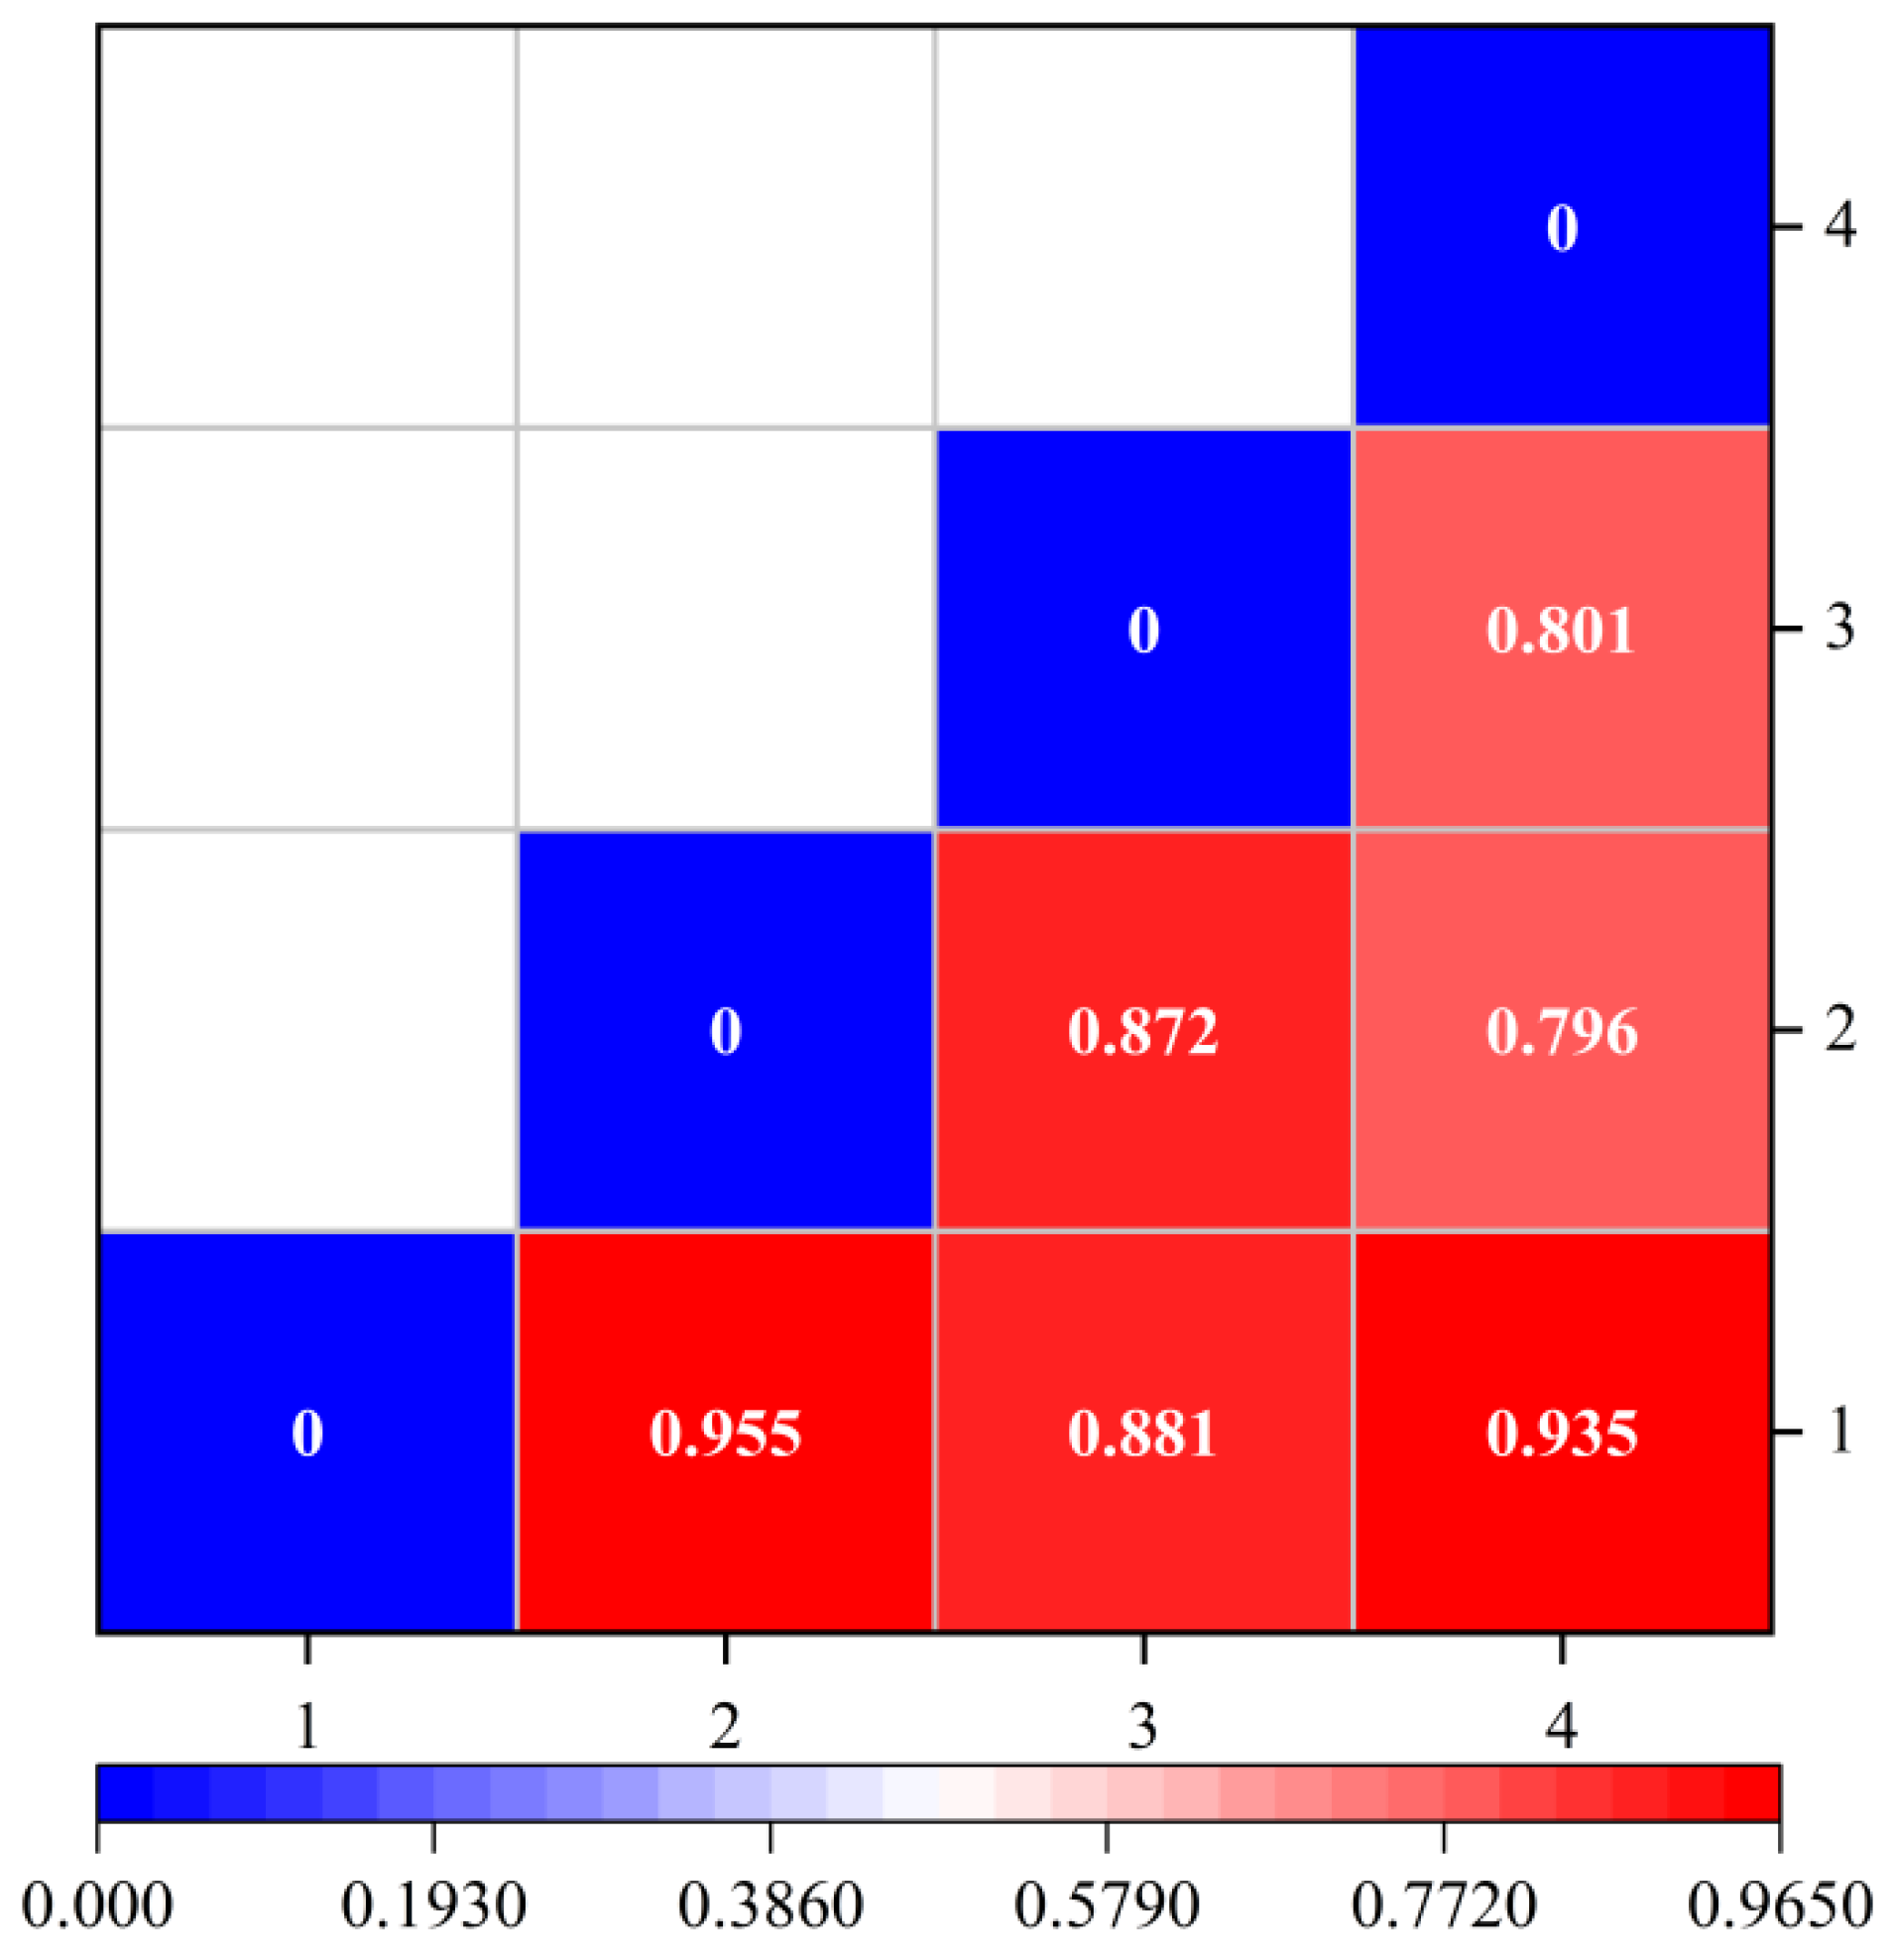
For beta taxonomic diversity, Bray–Curtis dissimilarity coefficients showed that species composition differed most between Zone 1 and the other three zones (all dissimilarity coefficients > 0.880), while the smallest difference occurred between Zones 2 and 4 (0.796, Figure 2).

3.2.2. Functional Diversity

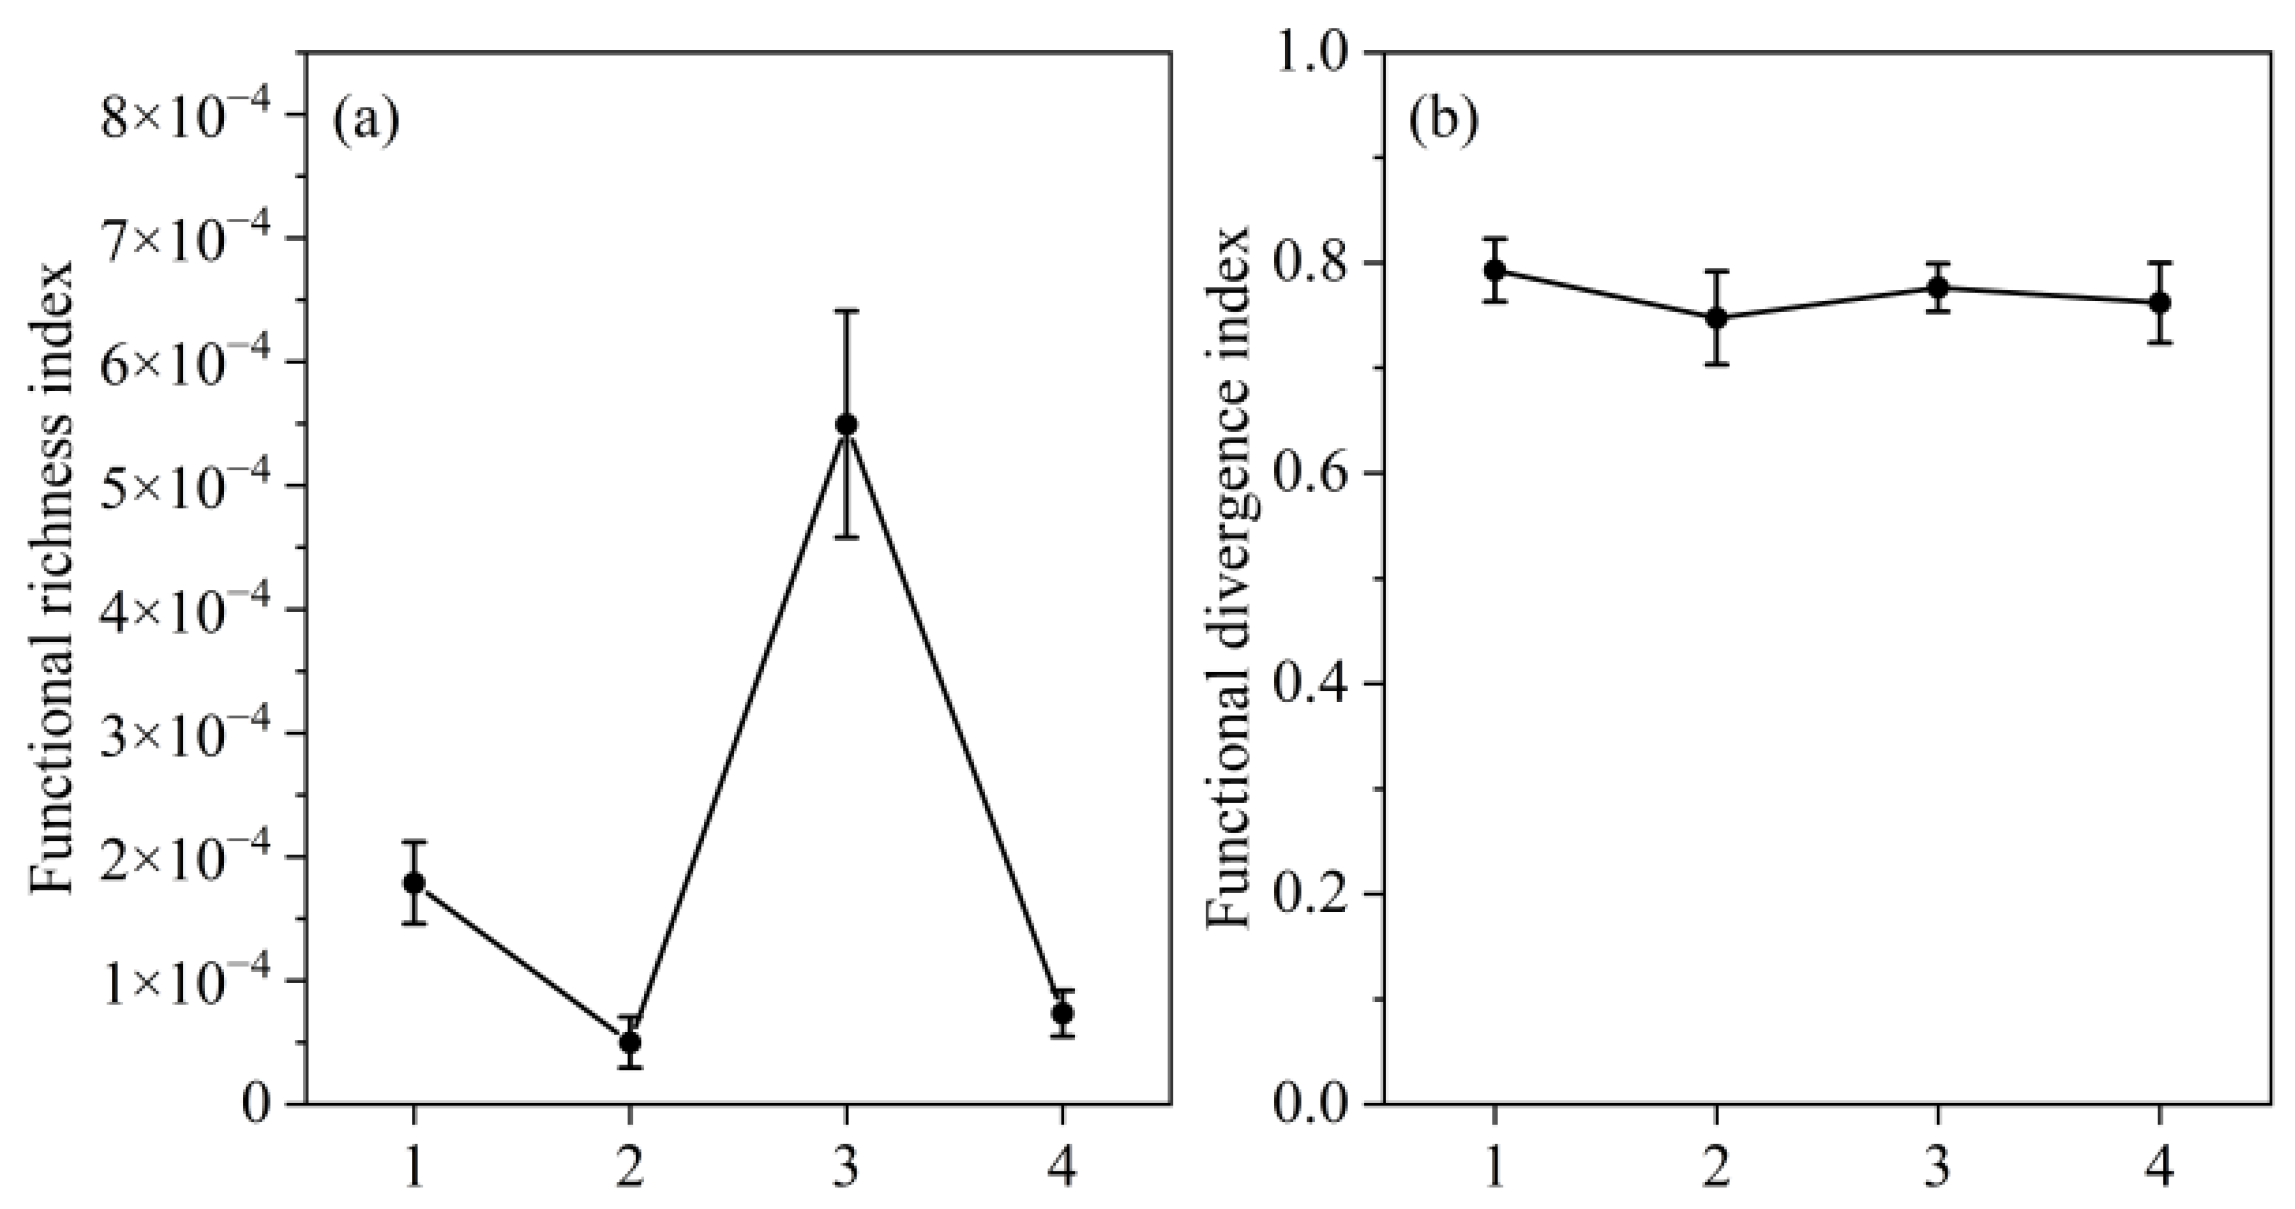
The variation in functional diversity of bird communities along the elevational gradient is shown in Figure 3. Functional richness index (FRic) peaked in Zone 3 and remained relatively low in the other zones (Figure 3a), indicating that the mid-elevation zone provided more diverse niche space. The functional divergence index (FDiv) showed little variation across elevational zones, ranging from 0.74 to 0.80, suggesting that the dispersion of species in functional space was relatively consistent among zones.
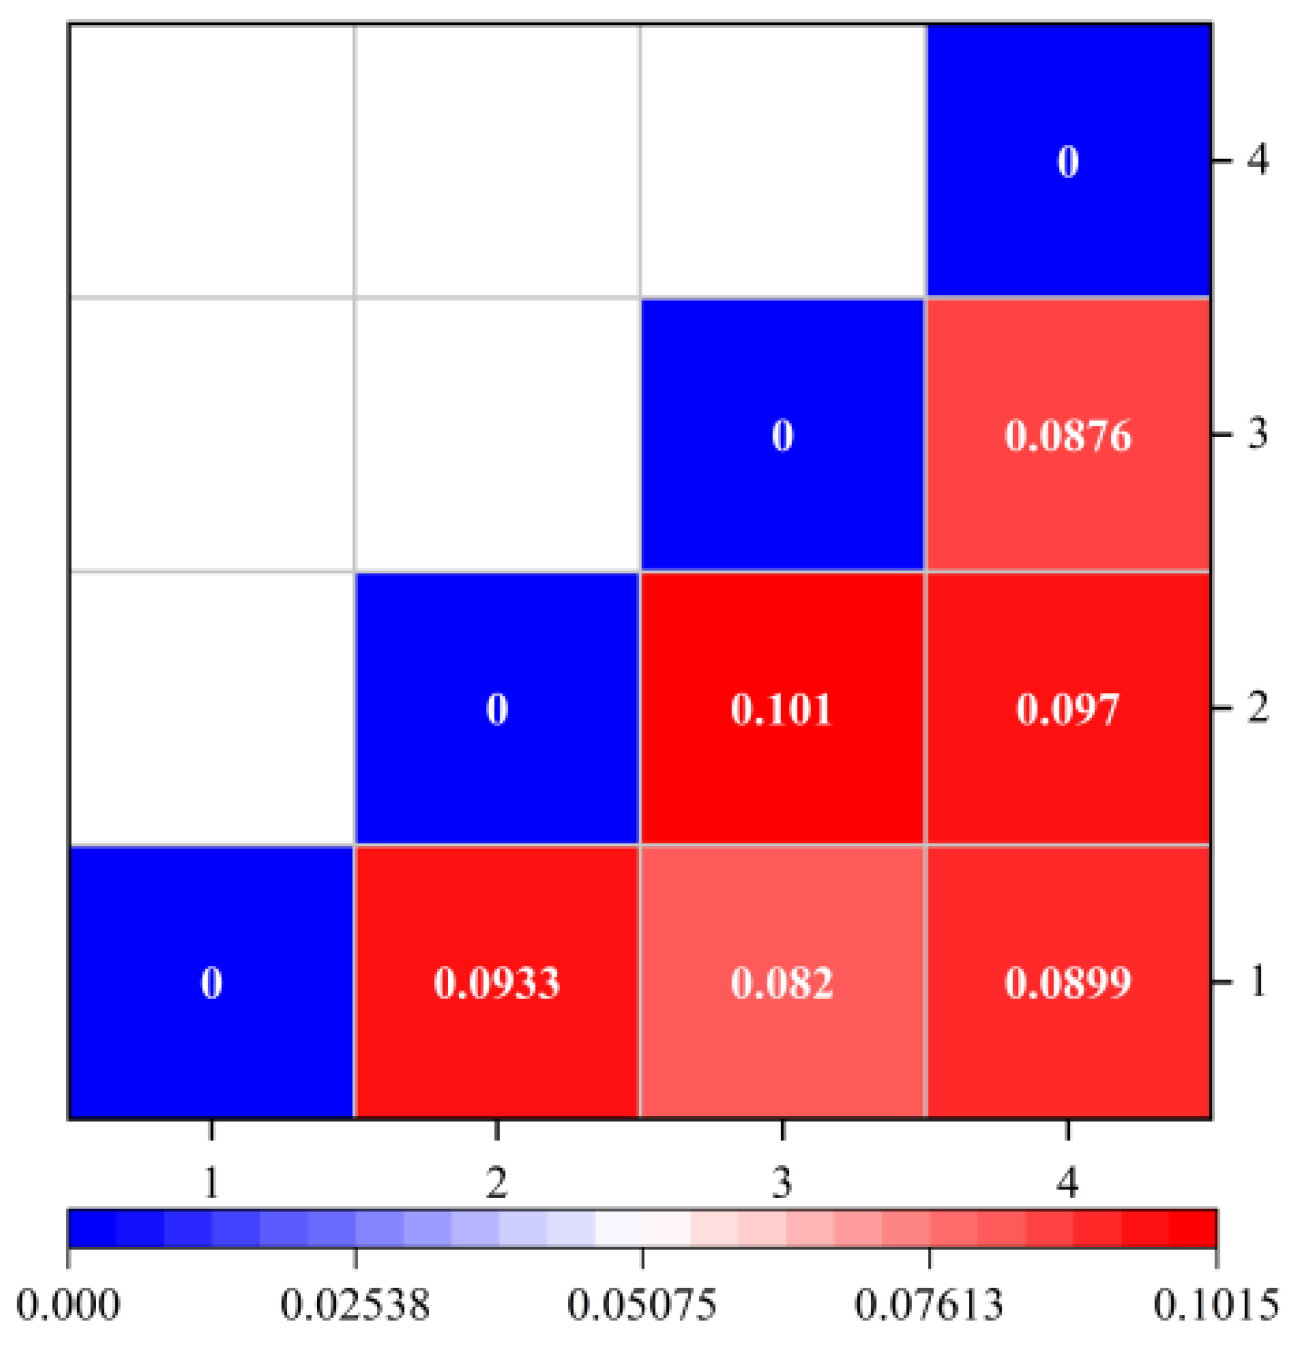
The functional Bray–Curtis dissimilarity coefficients (Figure 4) showed that functional composition differences between any two elevational zones were generally low (all <0.101), with the largest difference between Zones 2 and 3 (0.101) and the smallest between Zones 1 and 3 (0.082), indicating that functional composition varied far less than taxonomic composition along the elevational gradient, suggesting high stability of the functional structure.
Combining taxonomic diversity and functional diversity results, the bird communities in the study area exhibited the following pattern: taxonomic composition varied significantly along the elevational gradient (Bray–Curtis coefficients mostly > 0.7), whereas functional composition varied weakly (all <0.11). This pattern of “pronounced species turnover, stable functional structure” indicates that although species composition changes markedly across elevational zones, ecological functions remain highly conserved, suggesting the presence of functional redundancy.

3.2.3. Phylogenetic Diversity

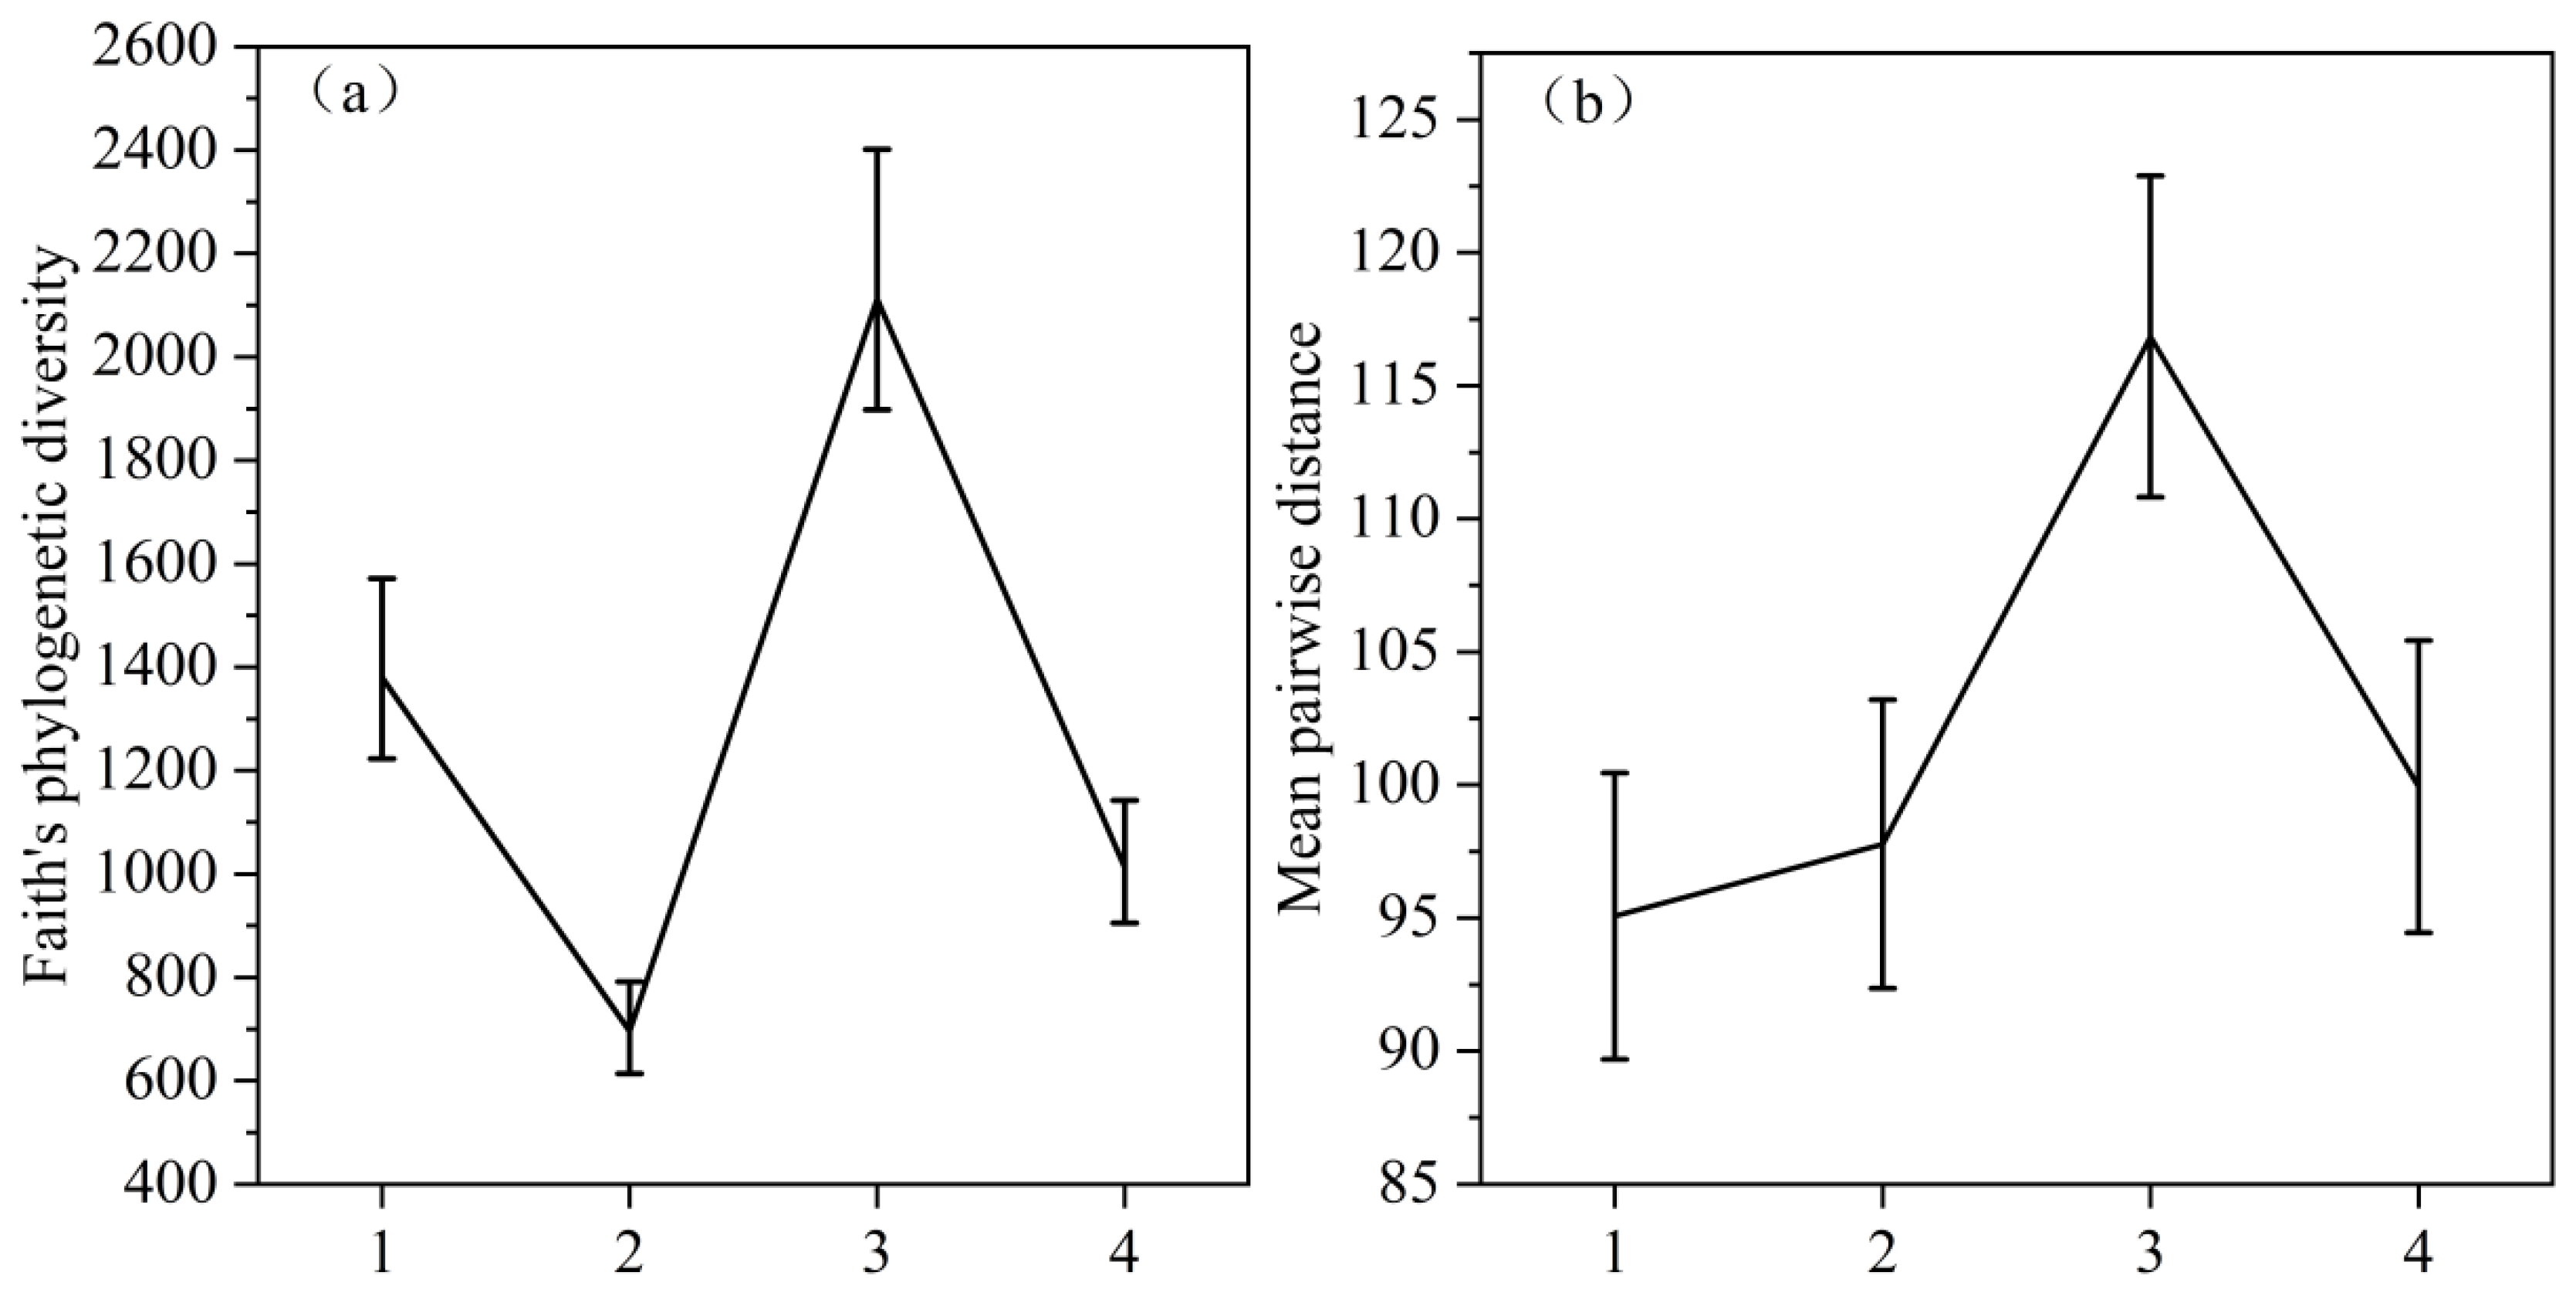
Phylogenetic diversity of bird communities fluctuated markedly along the elevational gradient (Figure 5). Faith’s phylogenetic diversity (PD) was relatively high in Zone 1, dropped to its lowest in Zone 2, peaked in Zone 3 (PD = 2112.03 ± 251.70), and declined thereafter, indicating that Zone 3 harbored the richest evolutionary history. MPD was lowest in Zone 1 and also peaked in Zone 3 (MPD = 116.85 ± 6.04). Both PD and MPD reached their maxima simultaneously at mid-elevation, suggesting that this zone not only supported high species richness but also contained phylogenetically more distantly related species, thus exhibiting higher evolutionary diversity.

3.3. Decomposition of Beta Diversity Components

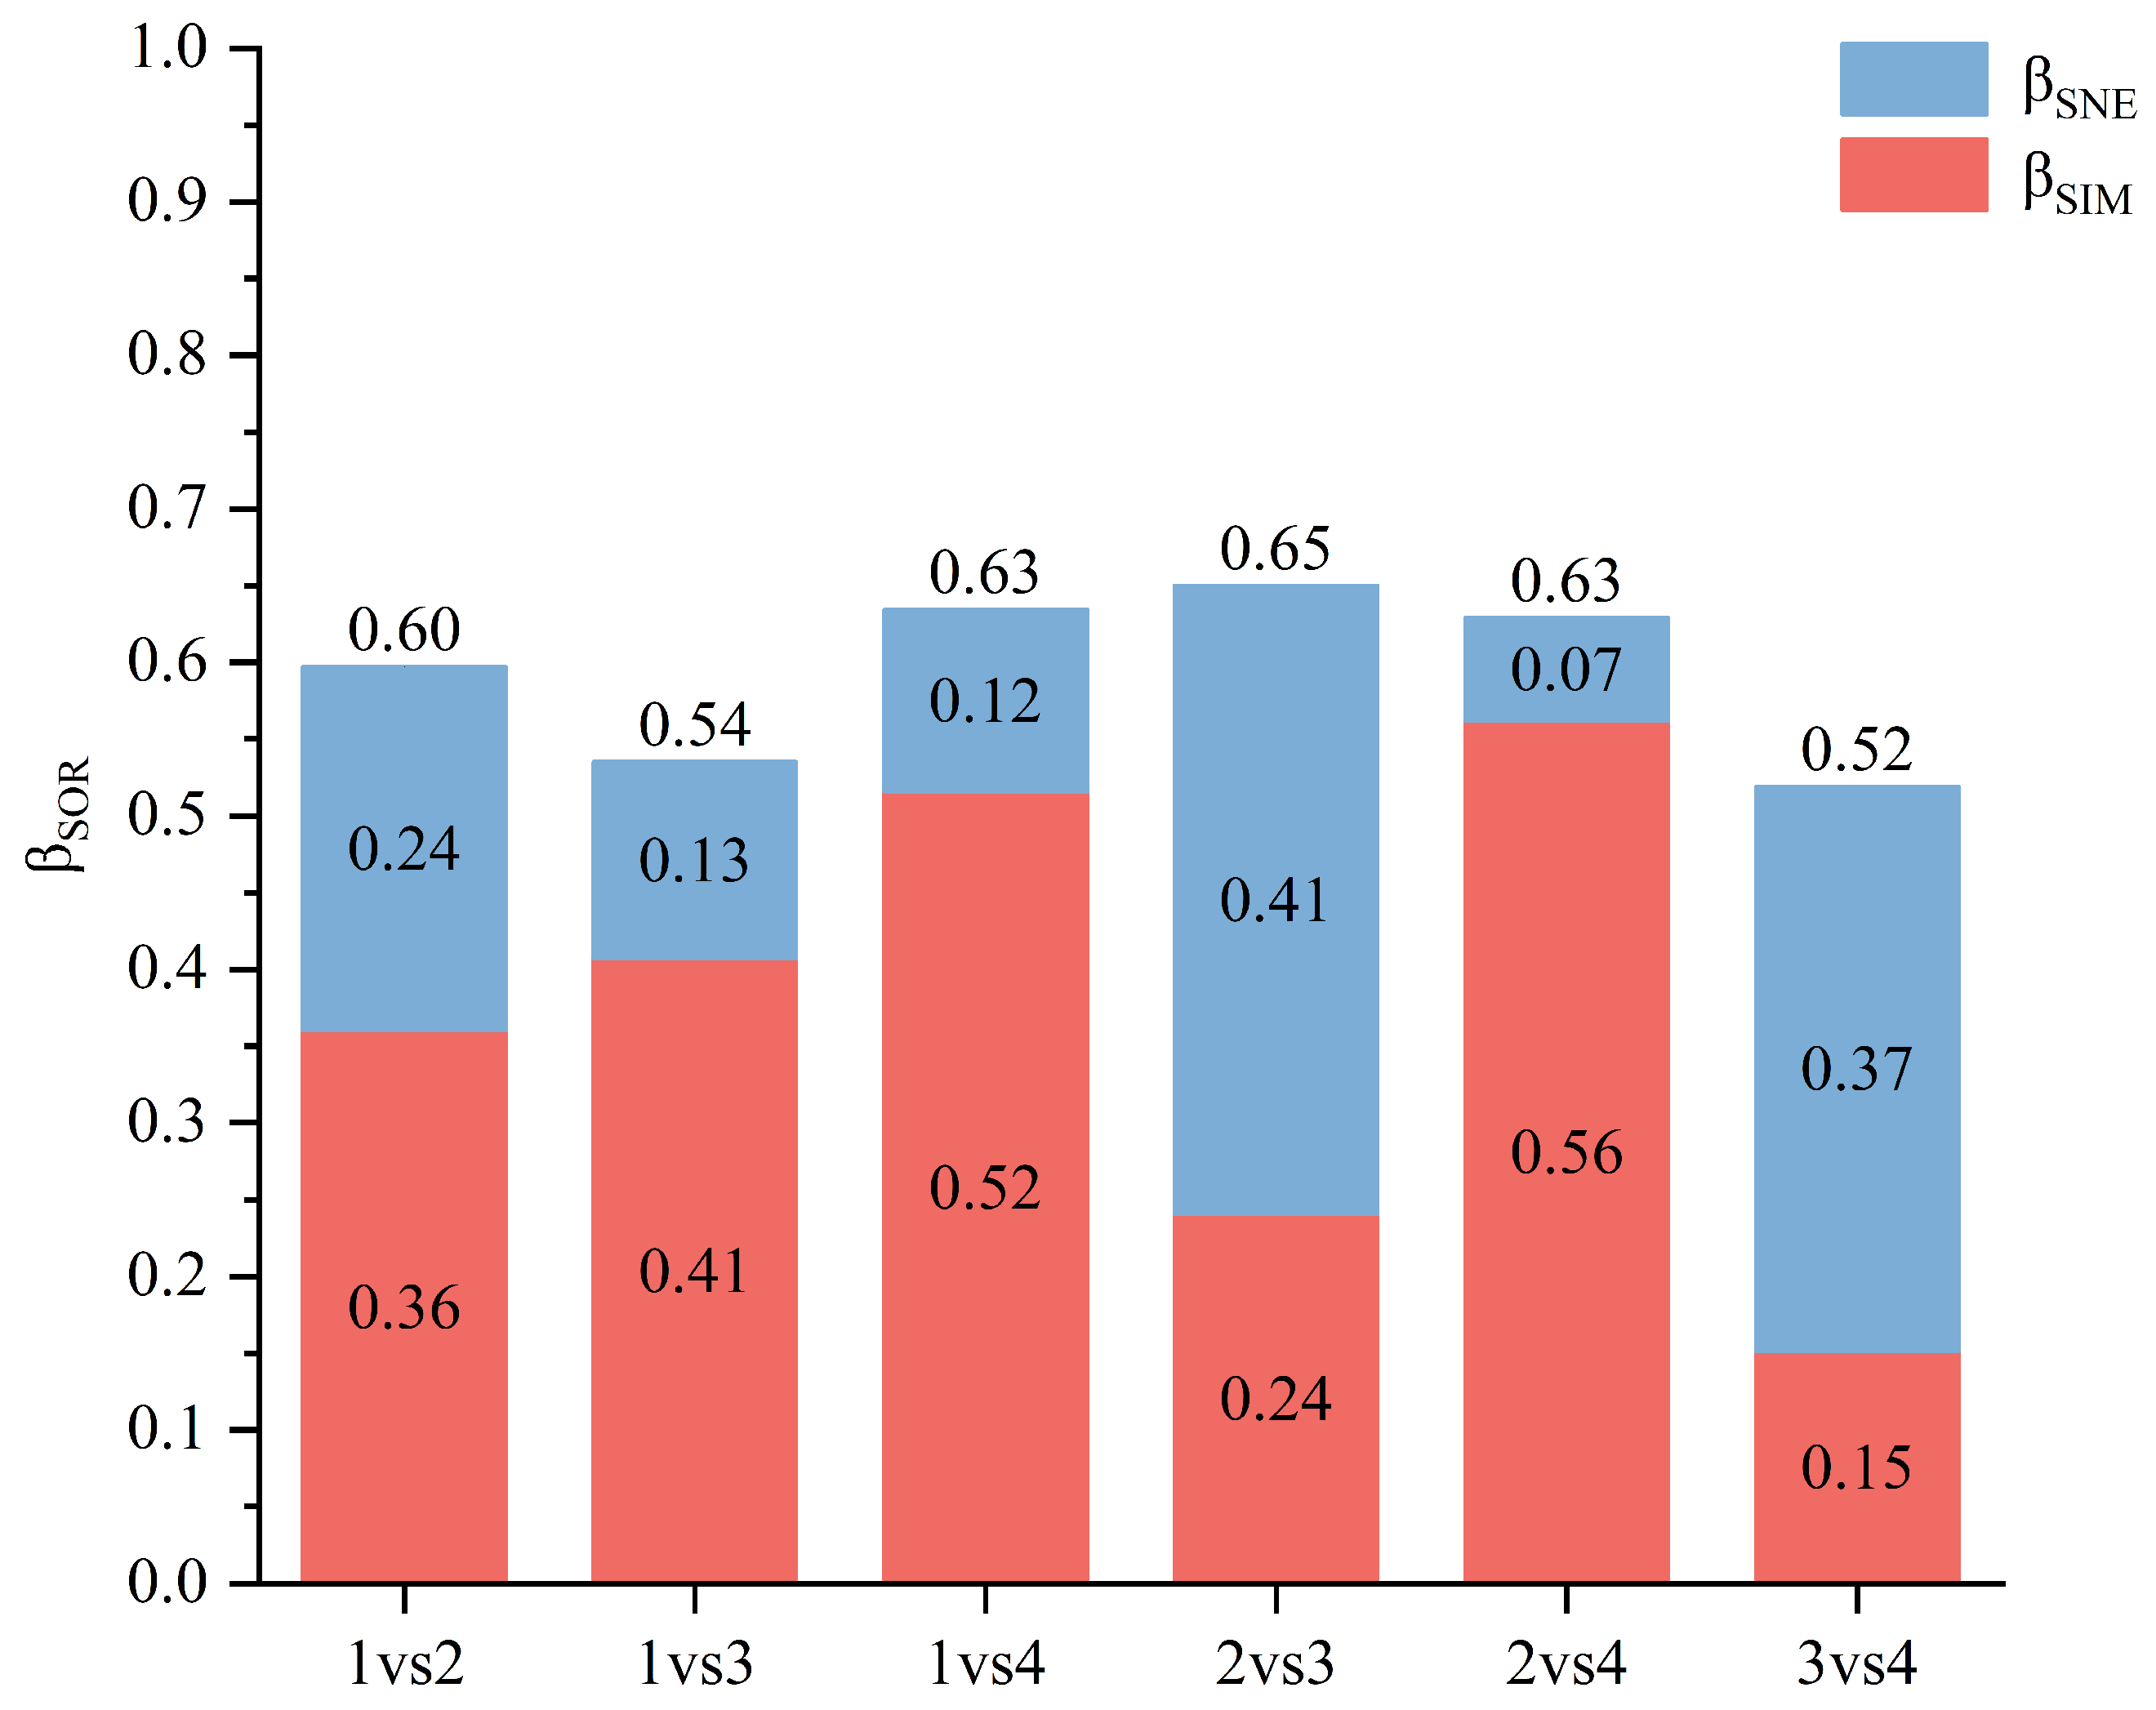
Regarding the turnover (βSIM) and nestedness (βSNE) components, overall, turnover contribution (βSIMSOR) generally increased with elevational distance, while nestedness decreased, though exceptions occurred involving Zone 4: the turnover contribution between Zones 4 and 1 was 81.1% (βSIM = 0.52), and between Zones 4 and 2 it was even higher at 88.9% (βSIM = 0.55), neither of which increased monotonically with increasing elevational distance. The nestedness contribution was highest between Zones 3 and 4 (βSNE = 0.37, 71.5%) and lowest between Zones 2 and 4 (βSNE = 0.07, 11.1%).
In summary, beta diversity of bird communities in the study area was predominantly driven by species turnover (most zone pairs with βSIM contribution > 50%), indicating that species turnover is the core ecological process shaping community composition changes along the elevational gradient. The nestedness component was only significant between specific zone pairs (e.g., Zones 3 and 4), suggesting that compositional differences in these sections partially arose from the selective loss of species (Figure 6).
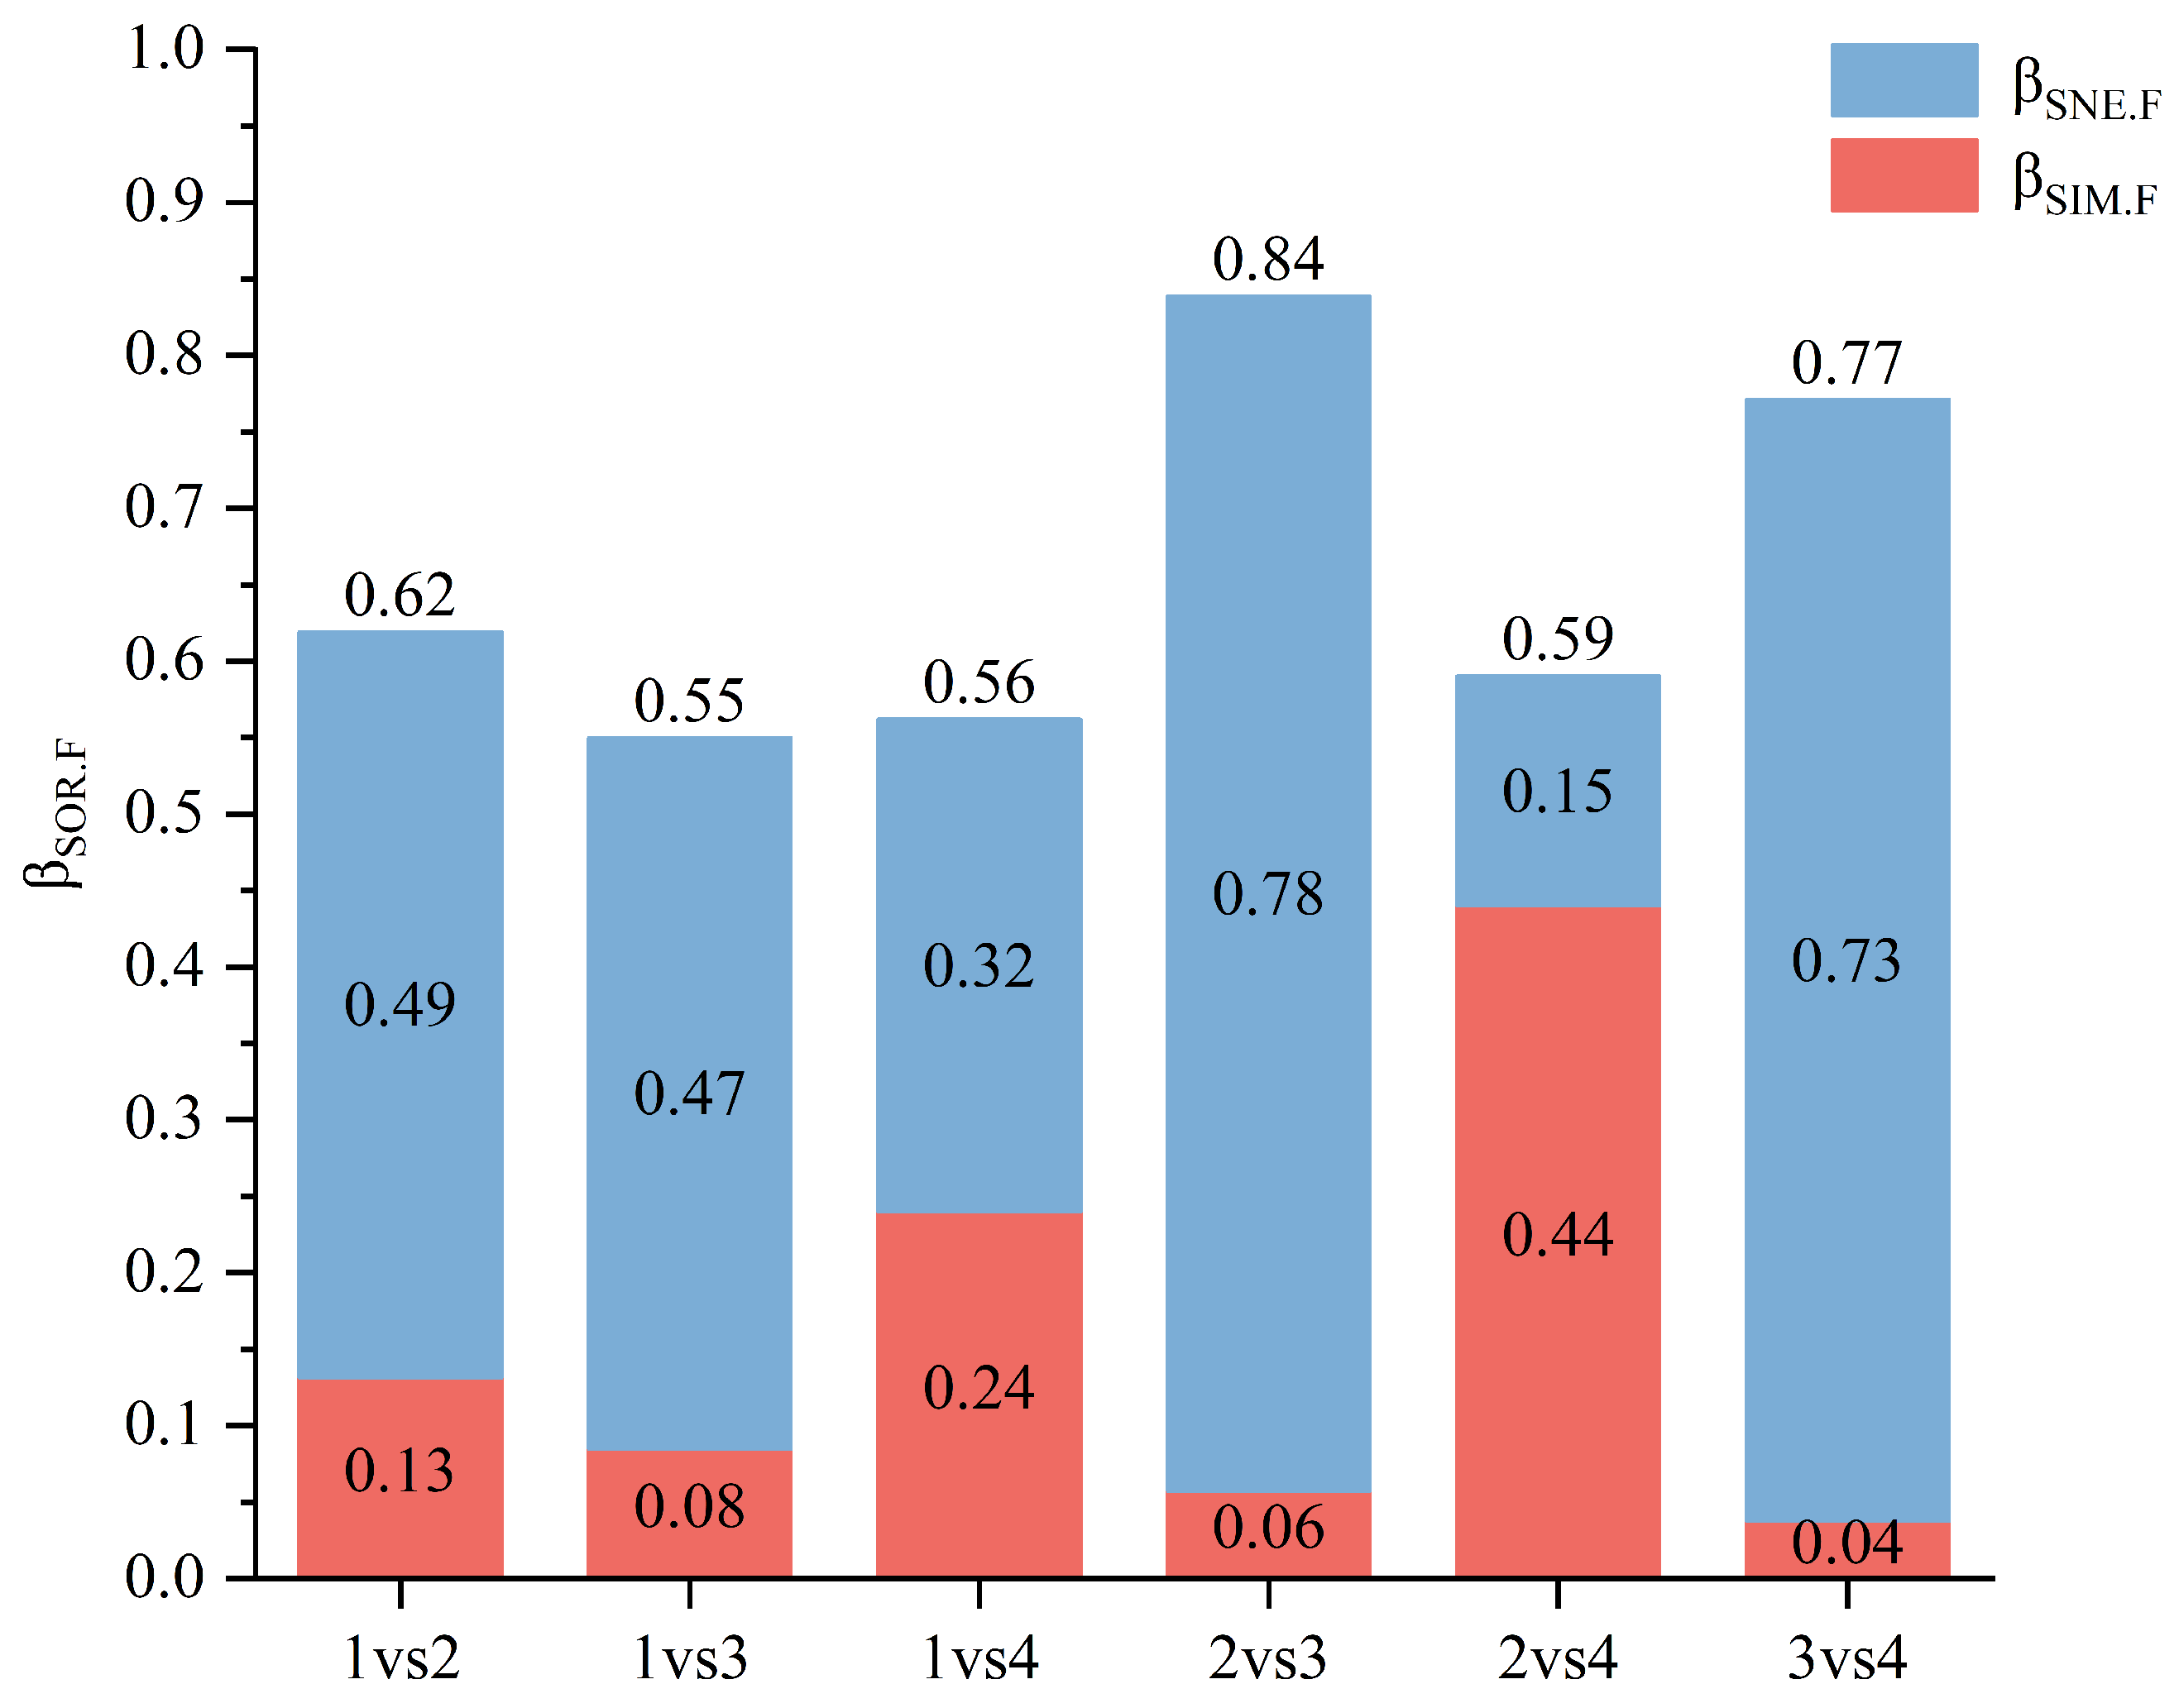
Total beta functional diversity (βSOR.F) was highest between Zones 2 and 3 (0.84) and lowest between Zones 1 and 3 (0.55). With increasing elevational distance, the contribution of turnover component (βSIM.F) to total beta functional diversity (βSIM.FSOR.F) generally showed an increasing trend, while the contribution of nestedness component (βSNE.F) decreased. However, exceptions occurred when comparing Zone 1 with Zones 2 and 3: the turnover contribution between Zones 1 and 2 was 21.2% (βSIM.F = 0.13), but dropped to 15.4% (βSIM.F = 0.08) between Zones 1 and 3, failing to show monotonic increase with elevational distance. The nestedness contribution peaked between Zones 3 and 4 (βSNE.F = 0.73, 95.1%) and was lowest between Zones 2 and 4 (βSNE.F = 0.15, 25.5%) (Figure 7).
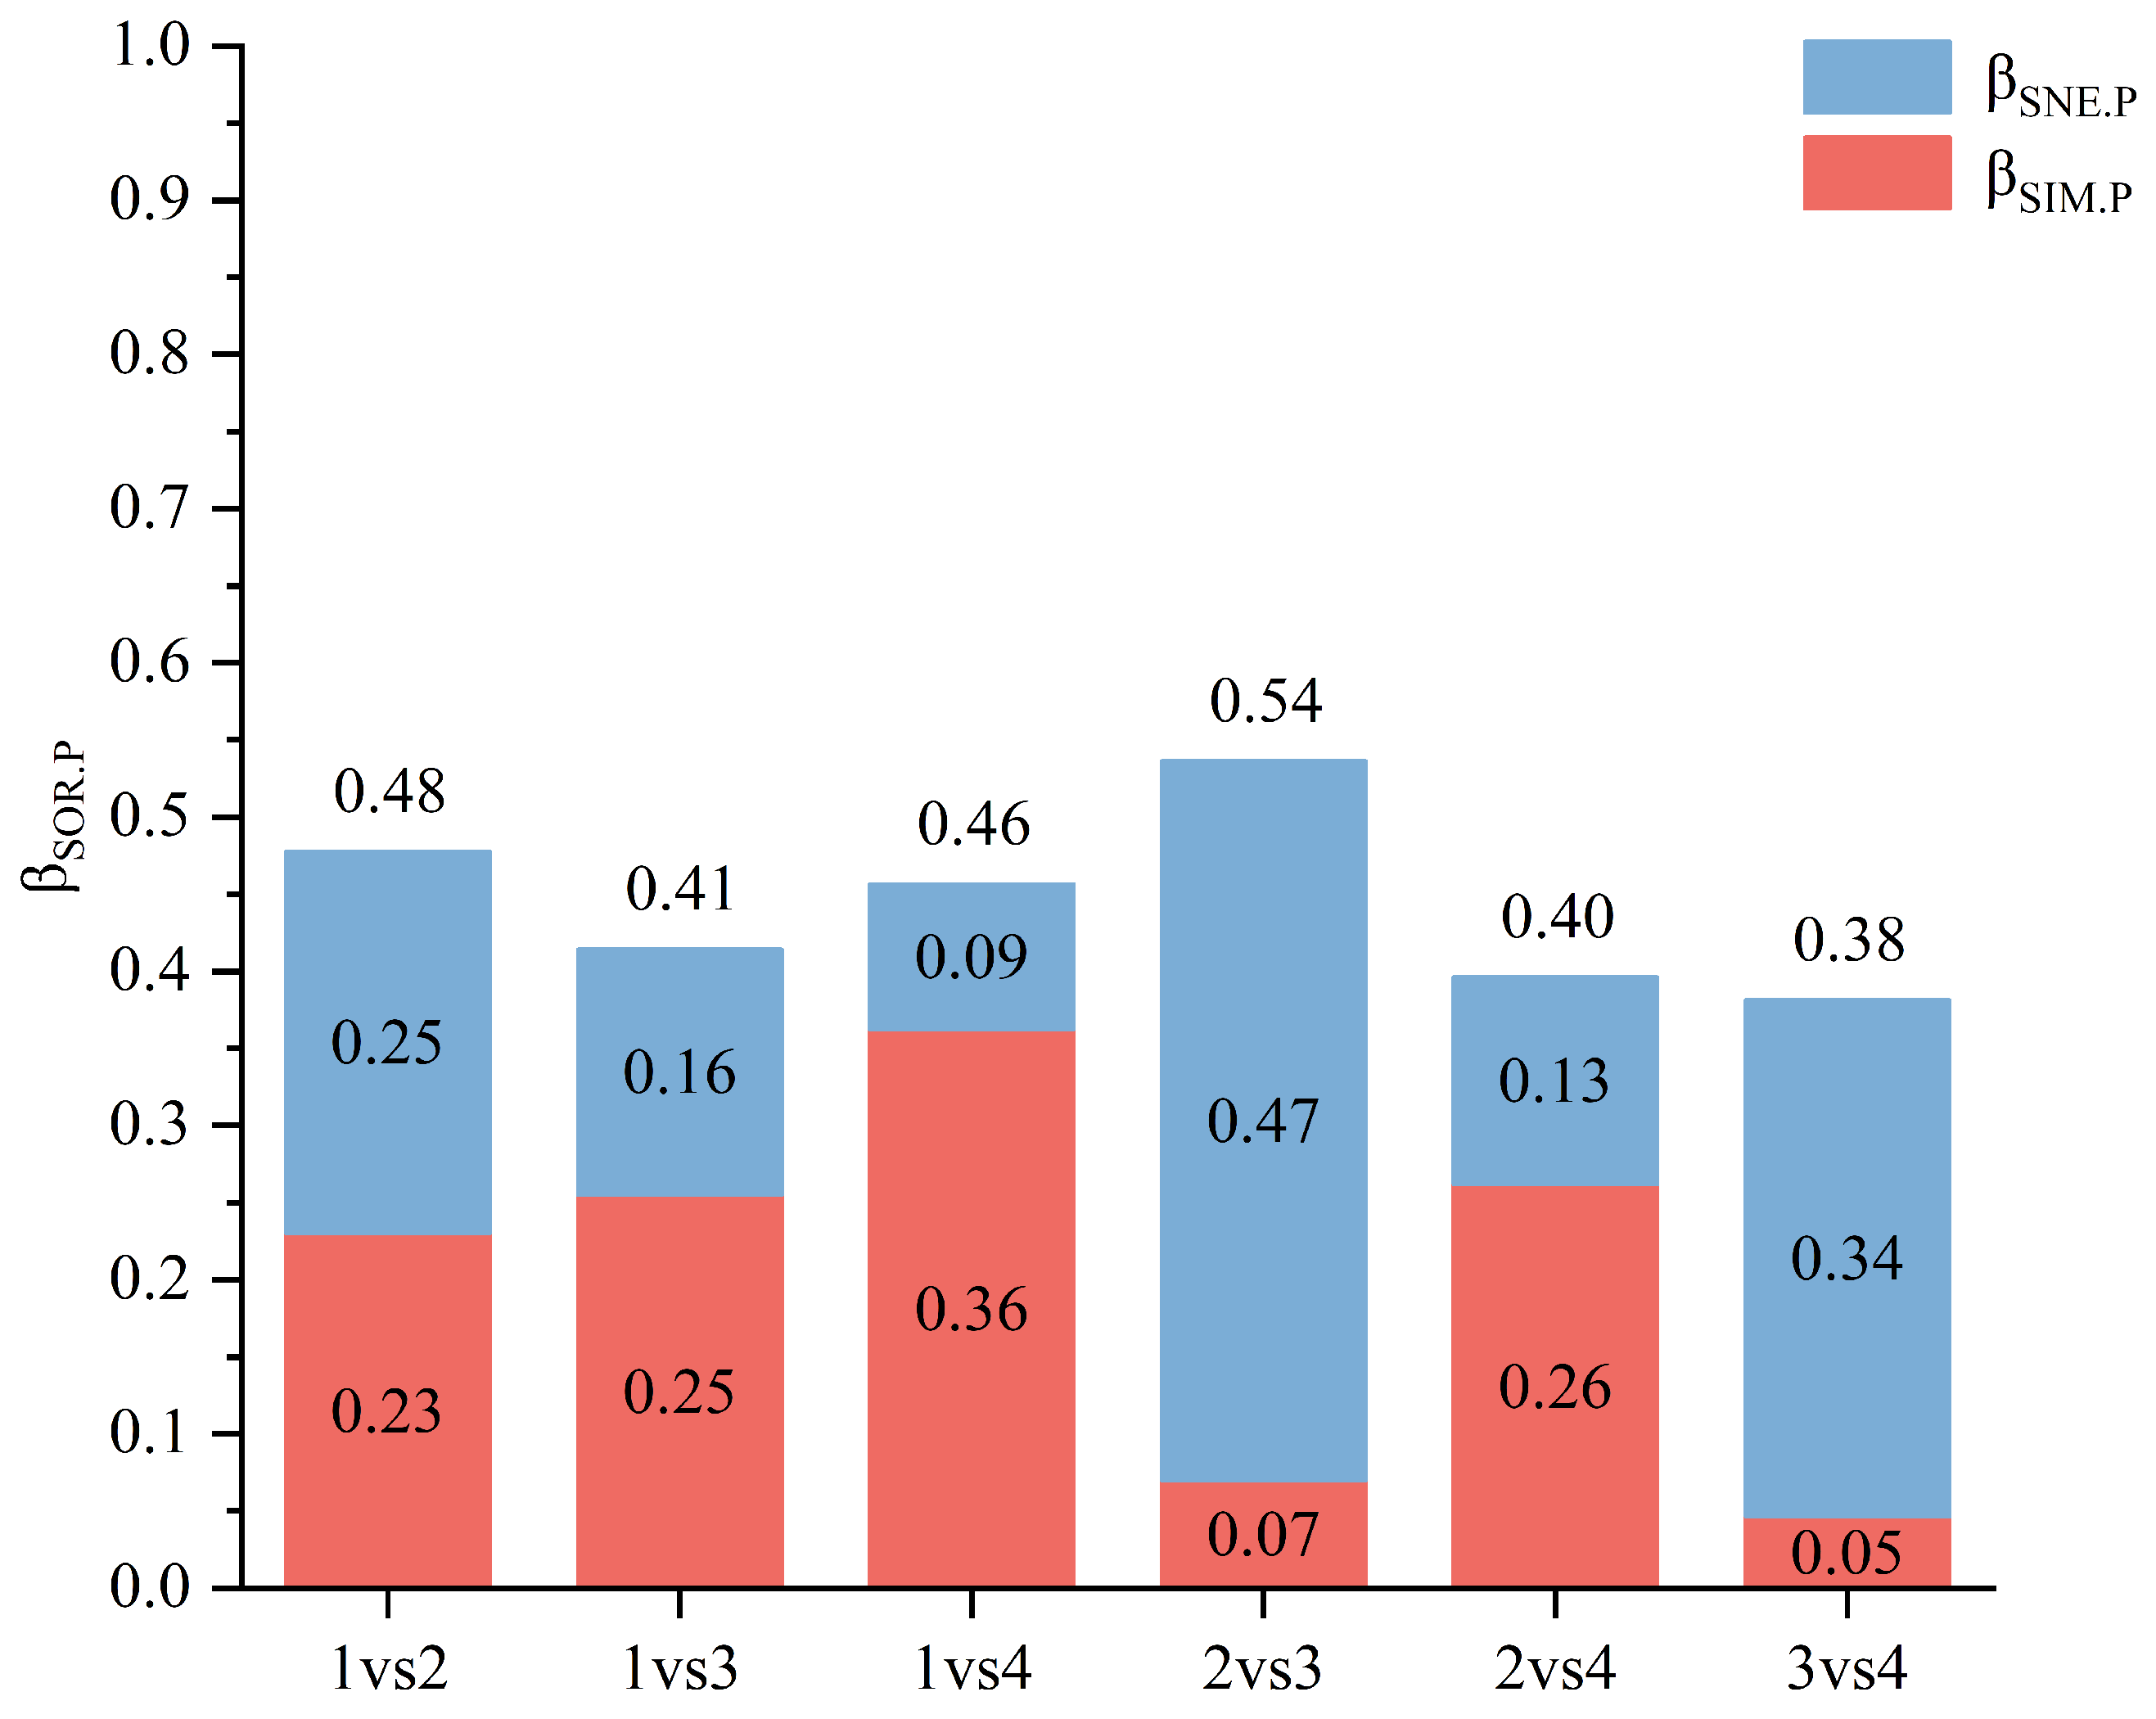
For beta phylogenetic diversity (Figure 8), the contributions of turnover (βSIM.P) and nestedness (βSNE.P) components to total diversity varied among elevational zone pairs. Overall, the contribution of turnover (βSIM.PSOR.P) tended to increase with greater elevational distance; however, three elevational zone pairs had turnover contributions exceeding 50%, and another three had nestedness contributions exceeding 50%.
Among adjacent elevational zones, the nestedness contribution exceeded the turnover contribution in all cases: 51.9% between Zones 1 and 2, 87.0% between Zones 2 and 3, and 87.8% between Zones 3 and 4. This indicates that along the continuous vertical gradient, differences in phylogenetic composition primarily arose from the selective loss of species (nestedness), rather than from species replacement (turnover).

3.4. Drivers of Beta Diversity

Random forest model analysis showed that the selected environmental factors explained 90% (R2 = 0.90) of the variation in taxonomic β-diversity and 87% (R2 = 0.87) of the variation in functional β-diversity, indicating that these variables could adequately explain the variation in community composition along the elevational gradient.
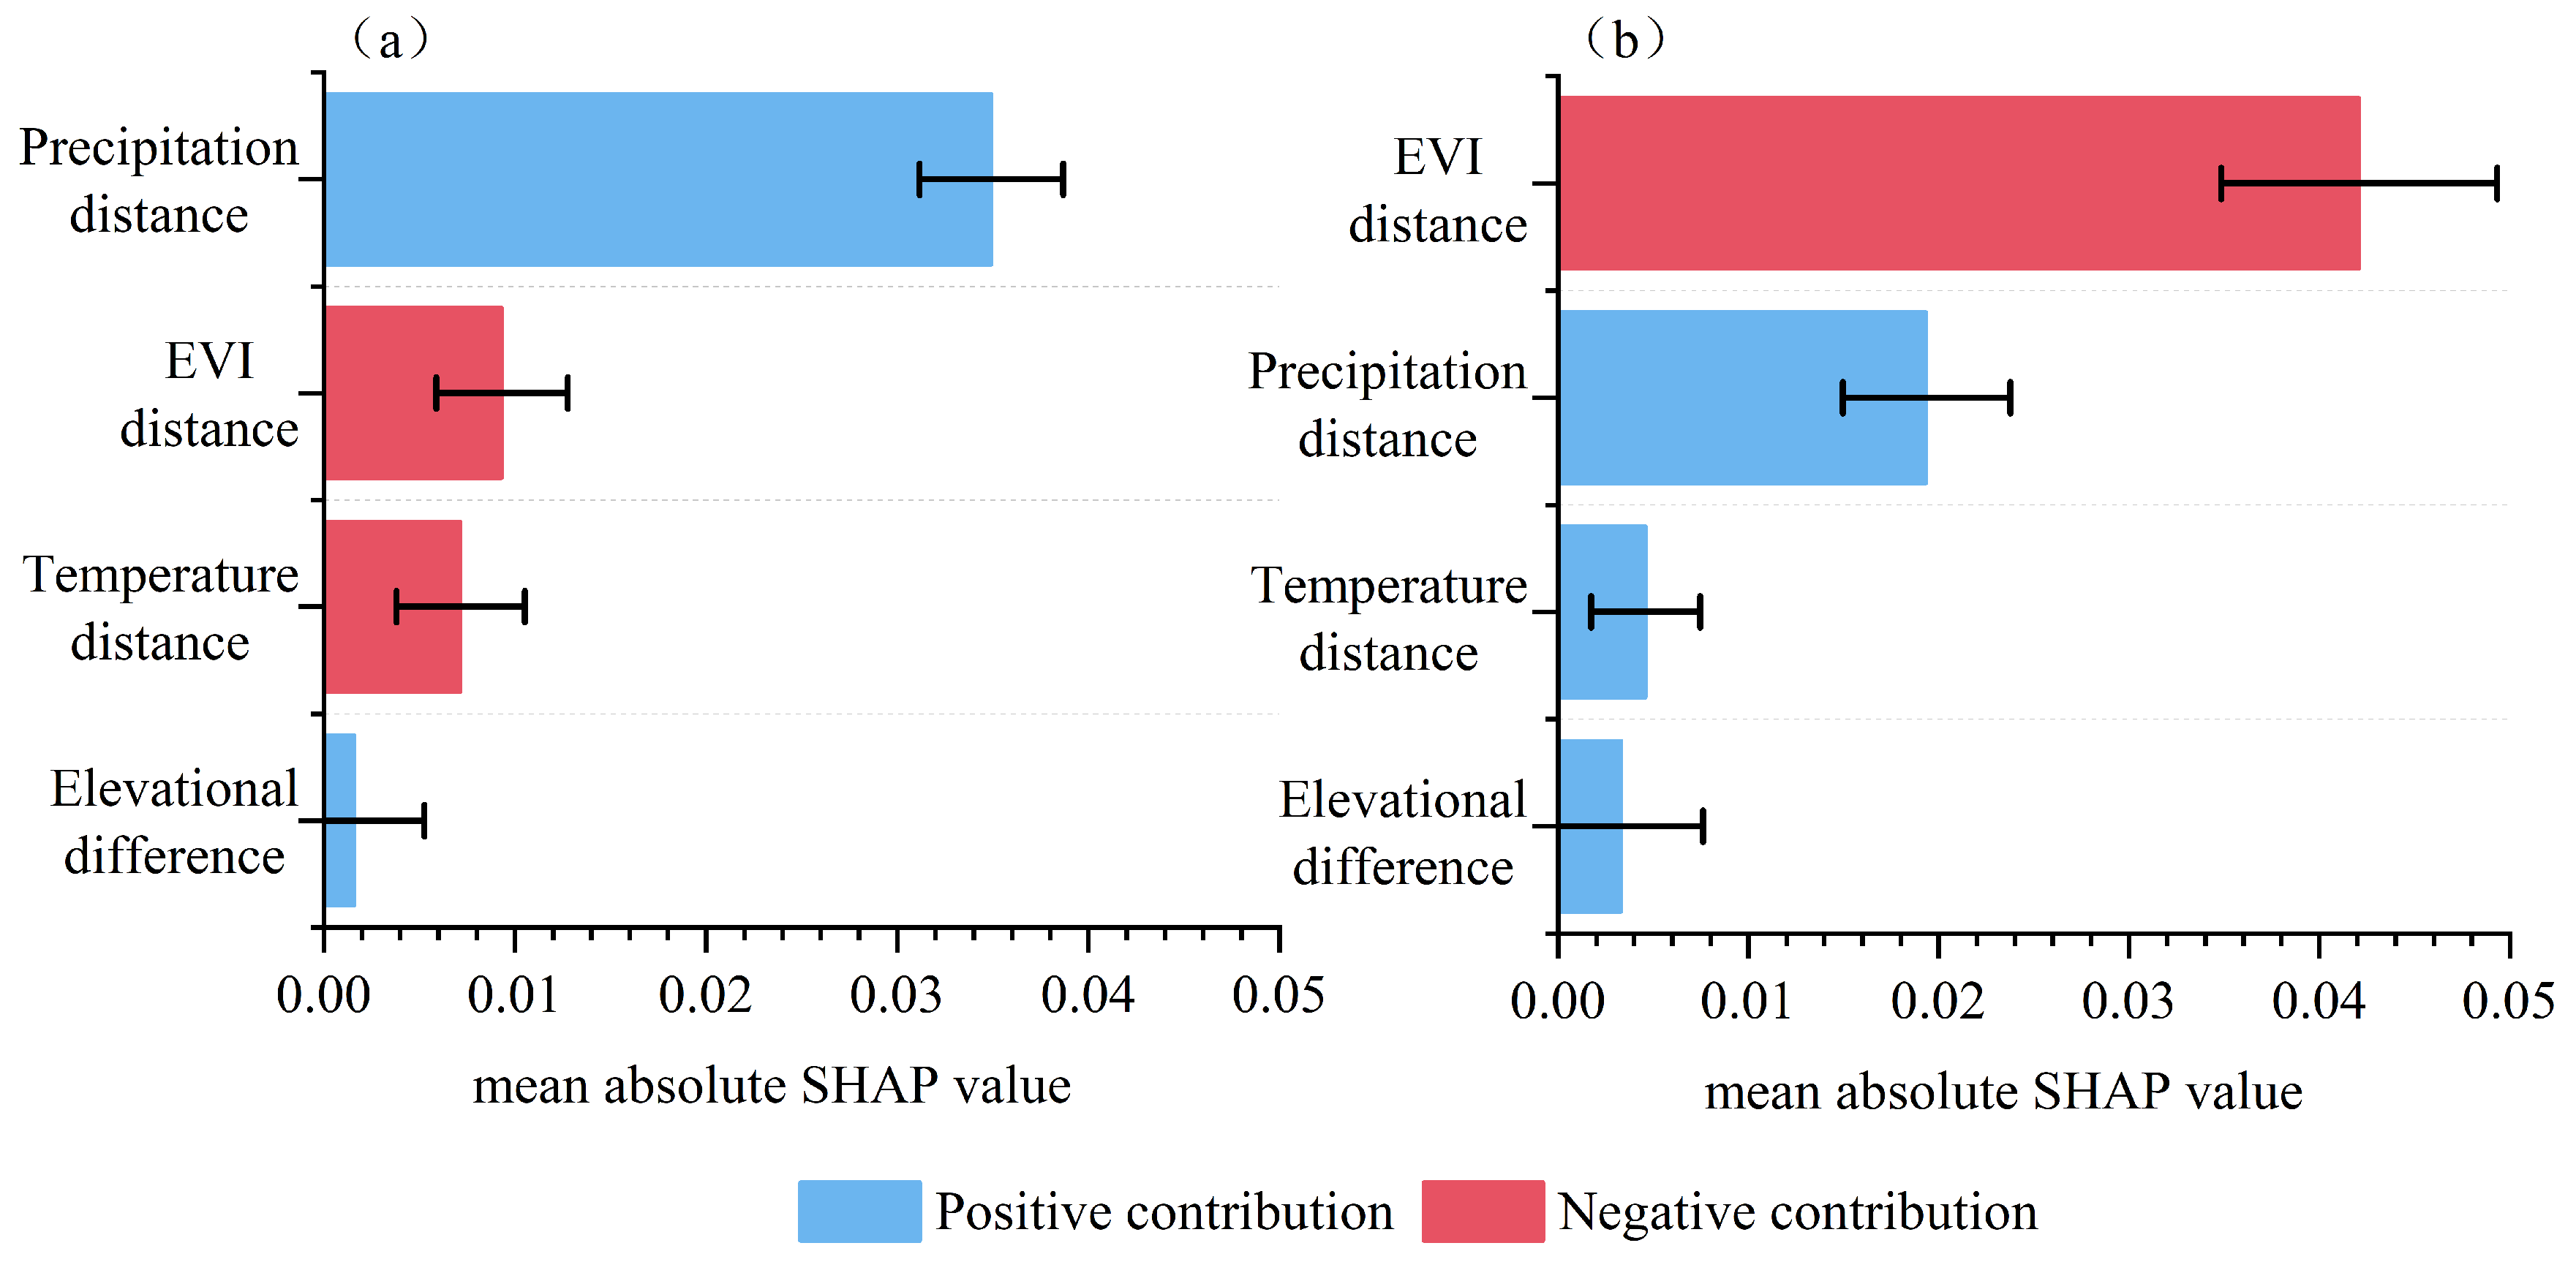
At the taxonomic level, precipitation distance was the primary driver of taxonomic β-diversity ( | SHAP | ¯ = 0.035), followed by vegetation index EVI distance ( | SHAP | ¯ = 0.009), indicating that spatial heterogeneity in water availability played a dominant role in species turnover (Figure 9a).
At the functional level, EVI distance emerged as the most important factor ( | SHAP | ¯ = 0.042), followed by precipitation distance ( | SHAP | ¯ = 0.019), suggesting that spatial variation in vegetation productivity was the key driver shaping functional composition changes (Figure 9b).
Overall, precipitation difference dominated taxonomic β-diversity, while EVI distance dominated functional β-diversity. This divergent pattern indicates that changes in species composition along the elevational gradient are primarily constrained by water availability, whereas the evolution of functional structure depends more on resource availability represented by vegetation productivity.

4. Discussion

4.1. Ecological Mechanisms Underlying the Mid-Elevation Unimodal Pattern of Alpha Diversity

In this study, taxonomic, functional, and phylogenetic alpha diversity all exhibited a mid-elevation unimodal pattern, with the peak occurring in Zone 3 (1951~2250 m), which corresponds to the mixed coniferous and broad-leaved forest belt. This pattern is consistent with findings from most global mountain bird studies [3], and is also in agreement with observations from typical mountain ranges such as the Andes and the Himalayas [5,28].
The mechanisms underlying the mid-elevation peak can be explained from the following aspects. First, the habitat heterogeneity hypothesis: The mixed coniferous and broad-leaved forest in Zone 3 possesses the most complex vertical structure, with well-developed tree, shrub, and herb layers and moderate canopy closure, providing diverse foraging substrates and habitat spaces for birds with different niche requirements [29]. Second, the mid-domain effect: Mid-elevation areas often represent zones of overlap between the distributional ranges of lowland and highland species, and the superposition of “geometric boundaries” may increase species richness [3]. Third, resource availability: The mid-elevation zone benefits from favorable hydrothermal conditions, higher vegetation productivity, and relatively abundant food resources, which can support the coexistence of more species [30].
The low evenness observed in Zone 1 warrants particular attention. This zone, characterized by valley farmland habitats, exhibited the second-highest species richness but the lowest evenness. This pattern is associated with the high abundance of a few dominant species (e.g., finches and sparrows) in farmland ecosystems. Anthropogenic disturbance leads to resource monopolization by a small number of highly adaptable synanthropic species, resulting in highly uneven abundance distribution despite a relatively large species pool on breeding birds in Taiwan [31]. The combination of low richness and high evenness in Zone 2 reveals another mode of disturbance. Human activities such as lacquer tapping and beekeeping in this zone may have led to forest secondary succession and simplified vegetation structure, compressing niche space. However, the absence of absolutely dominant species has allowed interspecific competition to remain relatively balanced. This result suggests that changes in vegetation structure are a key factor driving the reorganization of bird community functional structure, which is consistent with the findings of Marcos, who demonstrated that vegetation restoration promotes the reorganization and addition of avian functional traits [32]. The decline in diversity in Zone 4 can be attributed to harsh environmental filtering at high elevations: low temperatures, strong winds, short growing seasons, and limited food resources, which only a few specialized species can tolerate [33]. The finding that functional divergence (FDiv) remained high across all elevational zones is particularly noteworthy, suggesting that even under harsh high-elevation conditions, coexisting species still mitigate competition through trait differentiation.

4.2. Dimensional Asynchrony in the Decomposition of Beta Diversity Components

One of the core findings of this study is that taxonomic, functional, and phylogenetic beta diversity exhibited pronounced differences in their component decomposition, revealing the asynchrony of community assembly mechanisms across different dimensions.
For pairwise beta diversity, taxonomic dissimilarity is predominantly driven by species turnover, whereas functional dissimilarity is primarily attributable to nestedness. This pattern suggests that species replacement occurs relatively frequently among closely related species that share similar functional traits. In contrast, the gain of new species (or loss of existing species) tends to occur more often among species that differ substantially in their functional traits [6]. However, between Zone 3 and Zone 4, the nestedness component accounted for 70.8% of the total dissimilarity, indicating that community differences were primarily attributable to species loss rather than species replacement. Consequently, the high-altitude bird community more closely resembled a subset of the mid-elevation community after environmental filtering. This suggests that harsh environmental conditions at high elevations, such as extreme cold, may have filtered out species lacking the physiological traits to survive in the environment, thereby elevating the contribution of nestedness. According to the environmental filtering hypothesis, abiotic conditions tend to preferentially retain species possessing specific adaptive traits that enable them to tolerate local conditions, while limiting the establishment and persistence of other species. Thus, the high nestedness contribution observed between Zone 3 and Zone 4 implies that environmental filtering plays a critical role in shaping bird community assembly along this local elevational gradient. Overall, our results provide support for the environmental filtering hypothesis [34]. The contribution of turnover increased with greater elevational distance, suggesting that more pronounced environmental gradients lead to greater compositional differences. This finding is highly consistent with results from studies on butterfly communities [35] and breeding bird communities in the Himalayas [6]. And this “distance decay” pattern is a general principle in biogeography, confirming that species turnover is the core mechanism explaining spatial patterns of taxonomic beta diversity in mountain ecosystems [36].
Functional beta diversity was dominated by nestedness, with extremely low functional turnover, indicating that the functional trait space of bird communities across different elevational zones is highly nested and inclusive. This result is similar to the conclusions of the global-scale meta-analysis—while species composition changes markedly along environmental gradients, communities across different environments may exhibit similar functional structures [37]. Combined with the finding that functional divergence (FDiv) remained high across all elevational zones, it can be inferred that, despite species turnover with increasing elevation, the functional trait dissimilarity among bird communities was mainly attributable to the gain or loss of particular traits, and the level of trait dispersion remained uniformly high. This decoupling pattern of “species turnover with functional nestedness” may arise from the joint effects of functional redundancy and environmental filtering: species replacement preferentially occurs among redundant species sharing similar functional traits, whereas as abiotic stress intensifies at higher elevations, birds with particular functional strategies are selectively eliminated, leading to a contraction in functional trait space along the gradient [38]. Additionally, the limited trait variation available in the regional species pool may constrain community functioning across environmental gradients; the resulting homogenization of the overall trait space could produce functional nestedness even as species turnover proceeds [4]. Secondly, developmental or evolutionary trait conservatism may cause closely related species to retain ancestral adaptive features, meaning that core ecological functions remain similar despite species replacement [39]. Thirdly, methodological limitations in trait selection—such as the possibility that the morphological or niche-related traits used do not fully capture key dimensions of elevational variation—may obscure true functional differentiation at the data level.
In phylogenetic beta diversity, turnover and nestedness contributions were relatively balanced, which differs from some mountain studies where phylogenetic beta diversity is typically dominated by turnover. A likely reason is the unique geographical location of the study area—situated at the transition zone between the Oriental and Palaearctic realms—where the mixed distribution of species from different faunal origins across elevational zones results in the coexistence of both phylogenetic replacement and loss. This is consistent with the findings of Liang on the patterns of avian phylogenetic beta diversity across China [40]. Pairwise phylogenetic β-diversity between adjacent zones was primarily driven by the nestedness component. This pattern indicates that the phylogenetic lineages of species-poor adjacent sites constitute nested subsets of those in species-rich sites. We hypothesize that this may be linked to historical biogeography, recent radiative evolution, or dispersal filtering. Driven by historical climatic oscillations or rapid radiative evolution, newly diverged species and lineages are often highly restricted to evolutionary hotspots or core areas, having not yet accomplished large-scale dispersal into surrounding regions. Additionally, spatial barriers or environmental gradients between adjacent zones may have partially hindered the dispersal of certain clades, allowing only lineages with specific adaptive or dispersal traits to successfully colonize marginal areas. Collectively, these processes may have led to the formation of a phylogenetically nested pattern in bird communities across the elevational gradient [5,41].

4.3. Dimensional Differentiation in Drivers of Beta Diversity

The random forest models revealed the differentiated driving roles of precipitation and EVI on beta diversity, providing key clues for understanding the multiple mechanisms underlying mountain bird community assembly.
Precipitation dominated taxonomic beta diversity, indicating that spatial heterogeneity in water availability is the primary factor determining changes in species composition along the elevational gradient. This is consistent with the water-energy dynamics hypothesis: precipitation variation directly regulates vegetation type distribution, microhabitat humidity, and the abundance of food resources such as insects, thereby constituting a fundamental constraint on species distributions [42,43]. Along elevational gradients, precipitation typically exhibits nonlinear patterns with elevation, and such variation is directly mirrored in the turnover patterns of species composition.
EVI dominated functional beta diversity, indicating that vegetation productivity—representing energy availability—is the key factor shaping functional structure variation [44]. The negative relationship of EVI (i.e., greater EVI difference leading to lower functional beta diversity) warrants further exploration. One explanation is that high-EVI areas (typically mid-elevation mixed forests) possess higher vegetation productivity and support a “functional hotspot” where diverse functional traits coexist, while the functional space in low-EVI areas (high-elevation or disturbed habitats) represents a subset of this hotspot, manifesting as functional nestedness. This pattern is fully consistent with the finding that functional beta diversity is dominated by nestedness. Another possibility is that the EVI itself cannot fully capture understory vegetation conditions and three-dimensional vegetation structure, both of which may more directly drive avian functional diversity [45].
The differentiated responses of taxonomic and functional dimensions to environmental drivers imply that single-dimensional diversity assessments cannot fully reveal community assembly mechanisms. Taxonomic beta diversity reflects “which species are present” and is primarily governed by climatic filtering; functional beta diversity reflects “which functions are realized” and is regulated by resource availability. The asynchrony between the two underscores the necessity of multidimensional integrated analyses [27,46].

4.4. Conservation and Management Recommendations

Based on the findings of this study, the following conservation recommendations are proposed:
(1) Establish an integrated monitoring system employing multiple methods. Line transect surveys, mist-netting, and acoustic recording exhibit significant complementarity in species detection, particularly for cryptic and nocturnal species [47,48]. It is recommended that the reserve establish a routine, multi-method integrated monitoring program, especially incorporating a workflow combining deep-learning-based identification with manual verification for acoustic monitoring, to enhance the capacity for detecting cryptic and nocturnal species [22,49].
(2) Implement a holistic conservation strategy across the entire elevational gradient. Beta diversity analyses indicate that different elevational zones harbor unique species compositions and functional traits that are not readily substitutable for one another. The low evenness in the farmland habitats of Zone 1 and the decline in species richness due to anthropogenic disturbance in Zone 2 highlight that low-elevation areas also require attention—despite their relatively high species richness, community stability may be fragile. It is recommended that the reserve adopt an integrated management approach across the full elevational gradient to maintain habitat connectivity among elevations. Although this study did not directly quantify the specific intensity of anthropogenic disturbance, based on field investigations and ecological principles, it is recommended that particular attention be paid to the appropriate management and control of anthropogenic disturbance at mid-to-low elevations, and that the ecological thresholds of such disturbance be further examined in subsequent research.
(3) Develop a multidimensional, multi-scale integrated assessment framework. Taxonomic diversity reflects community taxonomic structure and species richness, functional diversity reveals niche differentiation and ecosystem functioning, and phylogenetic diversity represents evolutionary potential and genetic resources [50]. No single dimension can fully capture community health or assembly mechanisms. It is recommended that multidimensional diversity metrics be incorporated into routine monitoring systems for future conservation effectiveness assessments, thereby establishing a more comprehensive biodiversity evaluation framework.
(4) Recognize the dual effects of anthropogenic disturbance. This study found that low-elevation farmland habitats can increase species richness but reduce evenness, whereas specific anthropogenic activities at mid-elevations may lead to decreased species richness while maintaining higher evenness. Although this study did not directly examine the mechanisms of disturbance, based on the spatial patterns inferred above, it is recommended that differentiated management measures be implemented according to the types and intensities of anthropogenic disturbance across different elevational zones, avoiding a one-size-fits-all approach, and balancing the protection of natural ecosystems with the livelihood needs of local communities.

5. Conclusions

Our results showed that the bird community in the Hualongshan Nature Reserve exhibited pronounced transitional characteristics between the Palaearctic and Oriental realms. Alpha-scale analyses of taxonomic, functional, and phylogenetic diversity all revealed a typical mid-elevation peak pattern along the elevational gradient. Beta-scale decompositions of taxonomic, functional, and phylogenetic diversity revealed that the relative contributions of turnover and nestedness components varied across dimensions. Random forest models identified precipitation difference and EVI difference as the primary drivers of taxonomic and functional β-diversity patterns, respectively. Consequently, we strongly advocate for the implementation of integrated conservation strategies that take into account both elevational zones and multiple diversity dimensions.

Supplementary Materials

The following supporting information can be downloaded at: https://www.mdpi.com/article/10.3390/d18090537/s1, Table S1: Bird Checklist (Survey Data) from Hualongshan National Nature Reserve, Shaanxi Province. Table S2: The number of bird vocalization samples used in the localized transfer learning model based on BirdNET; Table S3: Avian species checklist with morphological data derived from mist-netting survey; Table S4: Dominance characteristics of the avian community along the elevational gradient; Table S5: Relative abundance and dominance rank of each species within each elevation belt; Table S6: Morphological data of birds collected from field surveys in this study.

Author Contributions

Conceptualization, M.L. and X.Y.; Methodology, M.L., C.T. and X.S.; Investigation, M.L., F.L., Y.S. (Yan Shi) and Y.S. (Yaoqiang Song); Formal Analysis, M.L. and X.S.; Visualization, M.L. and X.S.; Writing—Original Draft, M.L.; Data Curation, F.L.; Writing—Review and Editing, F.L. and X.Y.; Validation, C.T.; Supervision, J.L. and D.L.; Project Administration, J.L.; Resources, D.L. and X.Y.; Funding Acquisition, X.Y. All authors have read and agreed to the published version of the manuscript.

Funding

This research was funded by the National Natural Science Foundation of China (Grant No. 32270541) and the Scientific Research and Monitoring System Construction Project under the 2025 Central Fiscal Forestry and Grassland Ecological Protection and Restoration Funds (Project No.: SXJT-2025-0513).

Institutional Review Board Statement

The standard mist-netting method involved in this study was used only for the temporary capture of wild birds to measure their morphological data. No animals were housed, subjected to invasive clinical procedures, or sacrificed in this study. The research has been approved by the Shaanxi Hualong Mountain National Nature Reserve Administration and the academic committee of Shaanxi Normal University.

Data Availability Statement

The original contributions presented in this study are included in the Supplementary Material. Further inquiries can be directed to the corresponding authors.

Acknowledgments

We are grateful to the Administration Bureau of Shaanxi Hualongshan National Nature Reserve for providing logistical support during the fieldwork. Special thanks go to Li Guijiang and Liu Ping for their dedicated efforts in the field surveys. We also acknowledge the invaluable assistance of local forest rangers for their guiding services during the fieldwork, as well as the support of local residents for their cooperation in the interview surveys. In addition, during the preparation of this manuscript, we utilized AI-based language editing tools, including DeepSeek-v4-pro and GPT-5.5 Instant, solely for the purpose of refining the written expression and improving readability. All intellectual content and scientific conclusions remain our own.

Conflicts of Interest

The authors declare no conflicts of interest.

References

  1. Rahbek, C.; Borregaard, M.K.; Antonelli, A.; Colwell, R.K.; Holt, B.G.; Nogues-Bravo, D.; Rasmussen, C.M.Ø.; Richardson, K.; Rosing, M.T.; Whittaker, R.J.; et al. Building mountain biodiversity: Geological and evolutionary processes. Science 2019, 365, 1114–1119. [Google Scholar] [CrossRef] [Scilit] [PubMed]
  2. Canterbury, G.E.; Martin, T.E.; Petit, D.R.; Bradford, D.F. Bird communities and habitat as ecological indicators of forest condition in regional monitoring. Conserv. Biol. 2000, 14, 544–558. [Google Scholar] [CrossRef] [Scilit]
  3. McCain, C.M. Global analysis of bird elevational diversity. Glob. Ecol. Biogeogr. 2009, 18, 346–360. [Google Scholar] [CrossRef] [Scilit]
  4. Zhang, A.Y.; Wei, X.F.; Wu, D.H.; Wang, Z.H.; Yu, M.J.; Mao, L.H. Fragmentation effects on β-diversity: The role of abundance and intraspecific trait variation in shaping taxonomic, functional, and phylogenetic patterns. Plant Divers. 2025, 47, 981–990. [Google Scholar] [CrossRef] [Scilit] [PubMed]
  5. Ding, Z.; Hu, H.; Cadotte, M.; Liang, J.; Hu, J.; Si, X. Elevational patterns of bird functional and phylogenetic structure in the central Himalaya. Ecography 2021, 44, 1403–1417. [Google Scholar] [CrossRef] [Scilit]
  6. Ding, Z.; Liang, J.; Yang, L.; Wei, C.; Hu, H.; Si, X. Deterministic processes drive turnover-dominated beta diversity of breeding birds along the central Himalayan elevation gradient. Avian Res. 2024, 15, 100170. [Google Scholar] [CrossRef] [Scilit]
  7. Baselga, A. Partitioning the turnover and nestedness components of beta diversity. Glob. Ecol. Biogeogr. 2010, 19, 134–143. [Google Scholar] [CrossRef] [Scilit]
  8. Chamberlain, D.; Brambilla, M.; Caprio, E.; Pedrini, P.; Rolando, A. Alpine bird distributions along elevation gradients: The consistency of climate and habitat effects across geographic regions. Oecologia 2016, 181, 1139–1150. [Google Scholar] [CrossRef] [Scilit] [PubMed]
  9. Elsen, P.R.; Tingley, M.W.; Kalyanaraman, R.; Ramesh, K.; Wilcove, D.S. The role of competition, ecotones, and temperature in the elevational distribution of Himalayan birds. Ecology 2017, 98, 337–348. [Google Scholar] [CrossRef] [Scilit] [PubMed]
  10. Xu, J.; Farwell, L.; Radeloff, V.; Luther, D.; Songer, M.; Cooper, W.; Huang, Q.Y. Avian diversity across guilds in North America versus vegetation structure as measured by the Global Ecosystem Dynamics Investigation (GEDI). Remote Sens. Environ. 2024, 315, 114446. [Google Scholar] [CrossRef] [Scilit]
  11. Anderle, M.; Brambilla, M.; Hilpold, A.; Matabishi, J.G.; Paniccia, C.; Rocchini, D.; Rossin, J.; Tasser, E.; Torresani, M.; Tappeiner, U.; et al. Habitat heterogeneity promotes bird diversity in agricultural landscapes: Insights from remote sensing data. Basic Appl. Ecol. 2023, 70, 38–49. [Google Scholar] [CrossRef] [Scilit]
  12. Montaño-Centellas, F.A.; McCain, C. Using functional and phylogenetic diversity to infer avian community assembly along elevational gradients. Glob. Ecol. Biogeogr. 2019, 29, 232–245. [Google Scholar] [CrossRef] [Scilit]
  13. Zhang, K.; Wen, Z.; Wu, Y.; Yue, Y.; Jia, C.; Song, G.; Lei, F. Scale-dependent dispersal drives community assembly of breeding birds along elevational gradients. Ecol. Process. 2025, 14, 33. [Google Scholar] [CrossRef] [Scilit]
  14. Li, J.J.; Zhao, Y.Q. Comprehensive scientific investigation report of Hualongshan Nature Reserve. Shaanxi For. Sci. Technol. 1999, 2, 29–33. [Google Scholar]
  15. Wang, K.Y. A preliminary study on the vertical distribution of forest vegetation in Hualongshan, Shaanxi Province. Chin. J. Plant Ecol. 1992, 16, 88–96. [Google Scholar]
  16. Chen, S.L.; Wang, W.D.; Long, D.X.; Yu, X.P.; Ma, X.C. A preliminary study on avian species diversity in Hualongshan National Nature Reserve, Shaanxi Province. Chin. J. Wildl. 2014, 35, 426–430. [Google Scholar]
  17. Yu, X.P.; Zhang, J.C.; Chen, Q. Vertebrate Resources and Conservation in Hualongshan National Nature Reserve, Shaanxi Province; Northwest A&F University Press: Yangling, China, 2013. [Google Scholar]
  18. Wang, Y.P.; Song, Y.F.; Zhong, Y.X.; Chen, C.W.; Zhao, Y.H.; Zeng, D.; Wu, Y.R.; Ding, P. A Dataset on the life-history and ecological traits of Chinese birds. Biodivers. Sci. 2021, 29, 1149–1153. [Google Scholar] [CrossRef] [Scilit]
  19. Wilman, H.; Belmaker, J.; Simpson, J.; de la Rosa, C.; Rivadeneira, M.M.; Jetz, W. EltonTraits 1.0: Species-level foraging attributes of the world‘s birds and mammals. Ecology 2014, 95, 2027. [Google Scholar] [CrossRef] [Scilit]
  20. Peng, S.; Ding, Y.; Liu, W.; Li, Z. 1 km monthly temperature and precipitation dataset for China from 1901 to 2017. Earth Syst. Sci. Data 2019, 11, 1931–1946. [Google Scholar] [CrossRef] [Scilit]
  21. Lu, L.; Kuenzer, C.; Wang, C.Z.; Guo, H.D.; Li, Q.T. Evaluation of three MODIS-derived vegetation index time series for dryland vegetation dynamics monitoring. Remote Sens. 2015, 7, 7597–7614. [Google Scholar] [CrossRef] [Scilit]
  22. Kahl, S.; Wood, C.M.; Eibl, M.; Klinck, H. BirdNET: A deep learning solution for avian diversity monitoring. Ecol. Inform. 2021, 61, 101236. [Google Scholar] [CrossRef] [Scilit]
  23. Alswaitti, M.; Zihao, L.; Alomoush, W.; Alrosan, A. Effective classification of birds‘ species based on transfer learning. Int. J. Electr. Comput. Eng. 2022, 12, 4172–4184. [Google Scholar] [CrossRef] [Scilit]
  24. Kumar, S.V.S.; Kondaveeti, H.K. Bird species recognition using transfer learning with a hybrid hyperparameter optimization scheme. Ecol. Inform. 2024, 80, 102510. [Google Scholar] [CrossRef] [Scilit]
  25. Villéger, S.; Grenouillet, G.; Brosse, S. Decomposing functional β-diversity reveals that low functional β-diversity is driven by low functional turnover in European fish assemblages. Glob. Ecol. Biogeogr. 2013, 22, 671–681. [Google Scholar] [CrossRef] [Scilit]
  26. Hu, Y.M.; Ding, Z.F.; Jiang, Z.G.; Quan, Q.; Guo, K.J.; Tian, L.Q.; Hu, H.J.; Gibson, L. Birds in the Himalayas: What drives beta diversity patterns along an elevational gradient? Ecol. Evol. 2018, 8, 11704–11716. [Google Scholar] [CrossRef] [Scilit] [PubMed]
  27. Liu, Y.; Zhu, Y.; Wu, S.P.; Yang, Y.H.; Chen, J.; Wang, H.J. Determinants of taxonomic, functional, and phylogenetic beta diversity in breeding birds within urban remnant woodlots: Implications for conservation. Ecol. Evol. 2024, 14, e11426. [Google Scholar] [CrossRef] [Scilit] [PubMed]
  28. Altamirano, T.A.; de Zwaan, D.R.; Ibarra, J.T.; Wilson, S.; Martin, K. Treeline ecotones shape the distribution of avian species richness and functional diversity in south temperate mountains. Sci. Rep. 2020, 10, 18428. [Google Scholar] [CrossRef] [Scilit] [PubMed]
  29. Hanzelka, J.; Reif, J. Effects of vegetation structure on the diversity of breeding bird communities in forest stands of non-native black pine (Pinus nigra A.) and black locust (Robinia pseudoacacia L.) in the Czech Republic. For. Ecol. Manag. 2016, 379, 102–113. [Google Scholar] [CrossRef] [Scilit]
  30. Dillon, K.; Conway, C. Habitat heterogeneity, temperature, and primary productivity drive elevational gradients in avian species diversity. Ecol. Evol. 2021, 11, 5985–5997. [Google Scholar] [CrossRef] [Scilit] [PubMed]
  31. Tu, H.M.; Fan, M.W.; Ko, J.C. Different habitat types affect bird richness and evenness. Sci. Rep. 2020, 10, 1221. [Google Scholar] [CrossRef] [Scilit] [PubMed]
  32. Marcos, M.; Marco, S.; Augusto, P. Improvement of vegetation structure enhances bird functional traits and habitat resilience in an area of ongoing restoration in the Atlantic Forest. An. Acad. Bras. Ciênc. 2020, 92, e20191241. [Google Scholar] [CrossRef] [Scilit] [PubMed]
  33. García-Navas, V.; Sattler, T.; Schmid, H.; Ozgul, A. Temporal homogenization of functional and beta diversity in bird communities of the Swiss Alps. Divers. Distrib. 2020, 26, 900–991. [Google Scholar] [CrossRef] [Scilit]
  34. Keddy, P.A. Assembly and response rules: Two goals for predictive community ecology. J. Veg. Sci. 1992, 3, 157–164. [Google Scholar] [CrossRef] [Scilit]
  35. Dewan, S.; Sanders, N.J.; Acharya, B.K. Turnover in butterfly communities and traits along an elevational gradient in the eastern Himalayas, India. Ecosphere 2022, 13, e3984. [Google Scholar] [CrossRef] [Scilit]
  36. Nekola, J.C.; White, P.S. Special Paper: The distance decay of similarity in biogeography and ecology. J. Biogeogr. 1999, 26, 867–878. [Google Scholar] [CrossRef] [Scilit]
  37. Graco-Roza, C.; Aarnio, S.; Abrego, N.; Acosta, A.T.R.; Alahuhta, J.; Altman, J.; Angiolini, C.; Aroviita, J.; Attorre, F.; Baastrup-Spohr, L.; et al. Distance decay 2.0—A global synthesis of taxonomic and functional turnover in ecological communities. Glob. Ecol. Biogeogr. 2022, 31, 1399–1421. [Google Scholar] [CrossRef] [Scilit] [PubMed]
  38. Du, Y.B.; Fan, L.Q.; Xu, Z.H.; Wen, Z.X.; Cai, T.L.; Feijo, A.; Hu, J.H.; Lei, F.M.; Yang, Q.S.; Qiao, H.J. A multi-faceted comparative perspective on elevational beta-diversity: The patterns and their causes. Proc. R. Soc. B 2021, 288, 20210343. [Google Scholar] [CrossRef] [Scilit] [PubMed]
  39. Matthews, T.J.; Sheard, C.; Cottee-Jones, H.E.W.; Bregman, T.P.; Tobias, J.A.; Whittaker, R.J. Ecological traits reveal functional nestedness of bird communities in habitat islands: A global survey. Oikos 2015, 124, 817–826. [Google Scholar] [CrossRef] [Scilit]
  40. Liang, J.C.; Ding, Z.F.; Li, C.L.; Hu, Y.M.; Zhou, Z.X.; Lie, G.W.; Niu, X.N.; Huang, W.B.; Hu, H.J.; Si, X.F. Patterns and drivers of avian taxonomic and phylogenetic beta diversity in China vary across geographical backgrounds and dispersal abilities. Zool. Res. 2024, 45, 125–135. [Google Scholar] [CrossRef] [Scilit] [PubMed]
  41. Burgio, K.R.; Presley, S.J.; Cisneros, L.M.; Davis, K.E.; Dreiss, L.M.; Klingbeil, B.T.; Willig, M.R.; Montaño-Centellas, F.A. Historical biogeography and current ecology influence Andean bird communities along an elevational gradient. Ornithology 2026, 143, 1–12. [Google Scholar] [CrossRef] [Scilit]
  42. O’Brien, E.M. Water-energy dynamics, climate, and prediction of woody plant species richness: An interim general model. J. Biogeogr. 1998, 25, 379–398. [Google Scholar] [CrossRef] [Scilit]
  43. Hawkins, B.A.; Field, R.; Cornell, H.V.; Currie, D.J.; Guégan, J.F.; Kaufman, D.M.; Kerr, J.T.; Mittelbach, G.G.; Oberdorff, T.; O’Brien, E.M.; et al. Energy, water, and broad-scale geographic patterns of species richness. Ecology 2003, 84, 3105–3117. [Google Scholar] [CrossRef] [Scilit]
  44. Benedetti, Y.; Callaghan, C.T.; Ulbrichova, I.; Galanaki, A.; Kominos, T.; Abou Zeid, F.; Ibáñez-Álamo, J.D.; Suhonen, J.; Díaz, M.; Markó, G.; et al. EVI and NDVI as proxies for multifaceted avian diversity in urban areas. Ecol. Appl. 2023, 33, 1–17. [Google Scholar] [CrossRef] [Scilit] [PubMed]
  45. Remeš, V.; Remešová, E.; Friedman, N.R.; Matysiokova, B.; Turčoková, R.L. Functional diversity of avian communities increases with canopy height: From individual behavior to continental-scale patterns. Ecol. Evol. 2021, 11, 11839–11851. [Google Scholar] [CrossRef] [Scilit] [PubMed]
  46. Vigués, J.J.; Scherrer, D.; Duchenne, F.; Zellweger, F.; Gossner, M.M.; Bollmann, K. Differential responses of taxonomic, functional and phylogenetic multi-taxa diversity to environmental factors in temperate forest ecosystems. Ecol. Indic. 2025, 178, 113855. [Google Scholar] [CrossRef] [Scilit]
  47. Sethi, S.S.; Bick, A.; Chen, M.-Y.; Crouzeilles, R.; Hillier, B.V.; Lawson, J.; Lee, C.-Y.; Liu, S.-H.; De Freitas Parruco, C.H.; Rosten, C.M.; et al. Large-scale avian vocalization detection delivers reliable global biodiversity insights. Proc. Natl. Acad. Sci. USA 2024, 121, e2315933121. [Google Scholar] [CrossRef] [Scilit]
  48. Metcalf, O.; Barlow, J.; Marsden, S.; Gomes de Moura, N.; Berenguer, E.; Ferreira, J.; Lees, A.C. Optimizing tropical forest bird surveys using passive acoustic monitoring and high temporal resolution sampling. Remote Sens. Ecol. Conserv. 2022, 8, 45–56. [Google Scholar] [CrossRef] [Scilit]
  49. Winiarska, D.; Neubauer, G.; Budka, M.; Szymański, P.; Barczyk, J.; Cholewa, M.; Osiejuk, T.S. BirdNET provides superior diversity estimates compared to observer-based surveys in long-term monitoring. Ecol. Indic. 2025, 177, 113747. [Google Scholar] [CrossRef] [Scilit]
  50. Hu, Y.; Fan, H.; Chen, Y.; Zhan, X.; Wu, H.; Zhang, B.; Wang, M.; Zhang, W.; Yang, L.; Hou, X.; et al. Spatial patterns and conservation of genetic and phylogenetic diversity of wildlife in China. Sci. Adv. 2021, 7, eabd5725. [Google Scholar] [CrossRef] [Scilit] [PubMed]
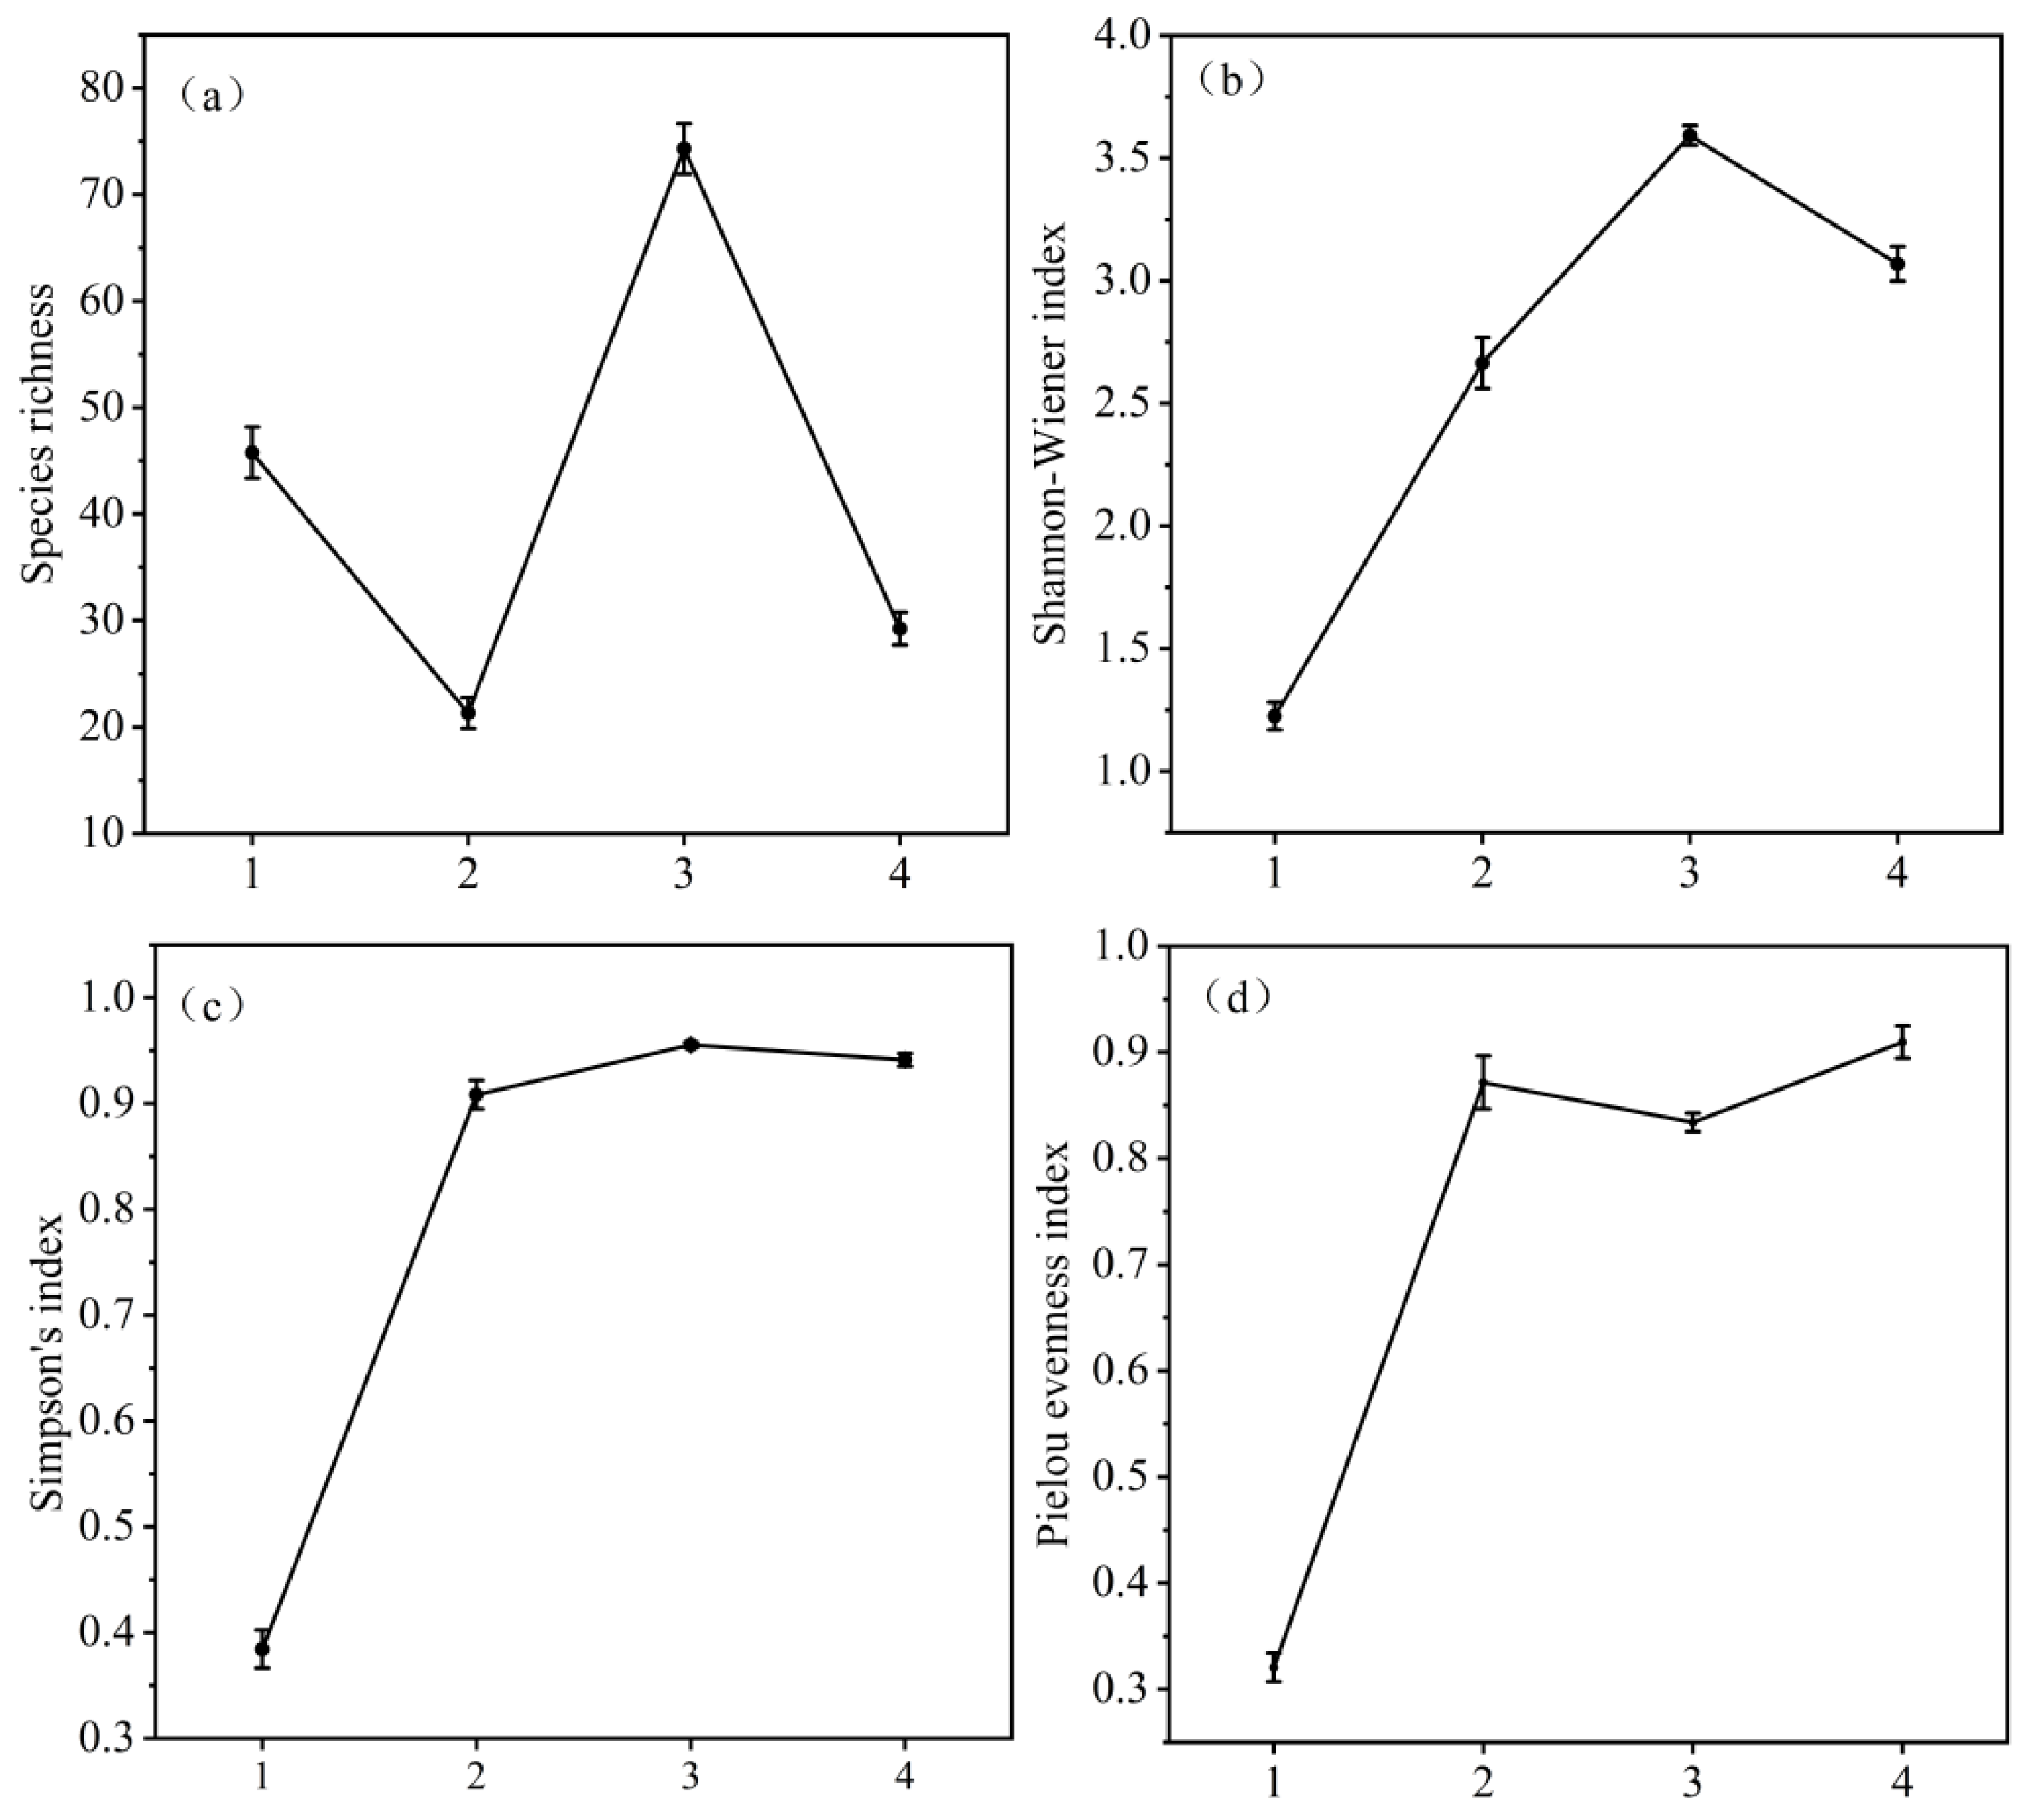
Figure 1. Taxonomic α-diversity of bird communities at different elevation zones in Hualong Mountains. (a) Species richness; (b) Shannon–Wiener index; (c) Simpson index; (d) Pielou evenness index. Letter code: 1: 1350~1650 m; 2: 1651~1950 m; 3: 1951~2250 m; 4: 2251~2550 m.
Diversity 18 00537 g001
Figure 2. Taxonomic β-diversity (Bray–Curtis dissimilarity index) of bird communities among different elevation gradients in Hualong Mountains. Letter code: 1: 1350~1650 m; 2: 1651~1950 m; 3: 1951~2250 m; 4: 2251~2550 m.
Diversity 18 00537 g002
Figure 3. Functional α-diversity of bird communities at different elevation gradients in Hualong Mountains (a) Functional richness index (FRic); (b) Functional divergence index (FDiv) Letter code: 1: 1350~1650 m; 2: 1651~1950 m; 3: 1951~2250 m; 4: 2251~2550 m.
Diversity 18 00537 g003
Figure 4. Beta functional diversity of bird communities across elevation zones in Hualong Mountains based on the Bray–Curtis dissimilarity coefficients Letter code: 1: 1350~1650 m; 2: 1651~1950 m; 3: 1951~2250 m; 4: 2251~2550 m.
Diversity 18 00537 g004
Figure 5. Alpha phylogenetic diversity of bird communities across elevation zones in Hualong Mountains. (a) Phylogenetic diversity (PD); (b) Mean pairwise distance (MPD). Letter code: 1: 1350~1650 m; 2: 1651~1950 m; 3: 1951~2250 m; 4: 2251~2550 m.
Diversity 18 00537 g005
Figure 6. Decomposition of beta taxonomic diversity of bird communities across elevation zones in Hualong Mountains based on βSOR, βSIM and βSNE; Note: βSOR = βSIM + βSNE. Letter code: 1: 1350~1650 m; 2: 1651~1950 m; 3: 1951~2250 m; 4: 2251~2550 m.
Diversity 18 00537 g006
Figure 7. Decomposition of beta functional diversity of bird communities across elevation zones in Hualong Mountains based on βSOR.F, βSIM.F and βSNE.F; Note: βSOR.F = βSIM.F + βSNE.F; Letter code: 1: 1350~1650 m; 2: 1651~1950 m; 3: 1951~2250 m; 4: 2251~2550 m.
Diversity 18 00537 g007
Figure 8. Decomposition of beta phylogenetic diversity of bird communities across elevation zones in Hualong Mountains based on βSOR.P, βSIM.P and βSNE.P; Note: βSOR P = βSIM.P + βSNE.P. Letter code: 1: 1350~1650 m; 2: 1651~1950 m; 3: 1951~2250 m; 4: 2251~2550 m.
Diversity 18 00537 g008
Figure 9. Random forest analysis of factors influencing beta diversity of bird community in Hualong Mountains. (a) β species diversity; (b) β functional diversity. Note: Both β species diversity and β functional diversity were assessed using the Bray–Curtis dissimilarity coefficients. Error bars indicate the standard deviations derived from 50 bootstrap iterations.
Diversity 18 00537 g009
Table 1. Details of bird functional traits selected in this study.
Functional TraitsVariable TypeClassification/Range
Body massContinuous5.50~635.25 g
Body lengthContinuous9.55~807.25 cm
Bill lengthContinuous5.74~57.25 mm
Wing lengthContinuous47.75~326 mm
Tail lengthContinuous3.43~506.25 cm
Tarsus lengthContinuous11.6~77.5 mm
DietCategoricalInvertebrates (e.g., insects)
Ectotherms (reptiles/amphibians)
Endotherms (small mammals/birds)
Fish
Unknown vertebrates
Scavenge
Fruit
Nectar
Seed
Plant other
Foraging stratumCategoricalWater—below surface
Water—around surface
Ground
Understory
Mid–high
Canopy
Aerial
Disclaimer/Publisher’s Note: The statements, opinions and data contained in all publications are solely those of the individual author(s) and contributor(s) and not of MDPI and/or the editor(s). MDPI and/or the editor(s) disclaim responsibility for any injury to people or property resulting from any ideas, methods, instructions or products referred to in the content.