Article

Study of Rubus chamaemorus Population Genetic Structure in the Eastern Baltic Region

1
State Scientific Research Institute Nature Research Centre, Akademijos St. 2, 08412 Vilnius, Lithuania
2
Faculty of Medicine and LifeScience, University of Latvia, 19 Raina Blvd, LV-1586 Riga, Latvia
*
Author to whom correspondence should be addressed.
Diversity 2026, 18(9), 513; https://doi.org/10.3390/d18090513
Submission received: 31 July 2026 / Revised: 21 August 2026 / Accepted: 26 August 2026 / Published: 27 August 2026
(This article belongs to the Section Plant Diversity)

Abstract

Cloudberry (Rubus chamaemorus L.) is a dioecious, perennial plant that grows in the boreal climate zone. For the first time, intraspecific genetic variability of 174 individual cloudberry plants from 25 locations in Lithuania, Latvia, Estonia, and Belarus was examined. Genetic variation was assessed using microsatellite markers specific to the Rubus genus. Although high heterozygosity was observed across all sampling sites, allelic richness, the Shannon diversity index, and the number of unique genotypes revealed a geographic gradient in genetic diversity across the Eastern Baltic region, with the highest values in Estonia and the lowest in Belarus. Cluster analysis identified ten genetically distinct groups, revealing patterns of population differentiation. Principal coordinates analysis further demonstrated that some sampling sites were genetically distinct despite geographic proximity. PERMANOVA indicated that most genetic variation occurred among individuals within sampling sites rather than among sampling sites, despite the predominantly vegetative reproduction of this species. These findings improve our understanding of the intraspecific diversity and genetic structure of the cloudberry population at the southern edge of the distribution of the species, suggest factors shaping genetic structure, and provide valuable insights for conservation and management of this ecologically and economically important species.

1. Introduction

Rubus chamaemorus L., widely known as cloudberry, is a perennial, dioecious plant of the Rosaceae family. It is widespread in the boreal climate zone and is commonly found in bogs, tundra, and wet meadows [1]. These plants feature creeping woody rhizomes that allow vegetative propagation, supporting their high nutrient uptake capacity and subsequent survival in nutrient-poor, acidic peatlands where decomposition is minimal [2].
The whole Rubus genus is characterized by a basic chromosome number of x = 7 [3]. Cloudberry is an octoploid species (2n = 8x = 56) with an estimated genome size of 3.8 Gbp [1]. It is also known that this species is an allopolyploid, containing multiple chromosome sets derived from distinct ancestral species. Putative progenitors are thought to include Rubus lasiococcus and Rubus pedatus [4,5].
Cloudberries hold considerable cultural and economic significance. Their fruits are rich in vitamin C and have long been vital to northern communities. Because of their high vitamin C content, the fruits of cloudberry historically have been used in the treatment of deficiency-related diseases, particularly scurvy [6]. Today these fruits are harvested and grown on an industrial scale in Scandinavian countries, and they are used for food products such as jams, yogurts, alcoholic beverages, and cosmetics [7]. The cultivation of this plant is also being seriously considered for peat bog restoration methods in places where peat extraction has been discontinued, which would help to increase the ecological and economic value of these areas. Cloudberries are highly dependent on soil conditions; one aspect is the degree of peat decomposition. A study conducted in Canada showed that successful restoration of former peat bogs requires first re-establishing the moss layer and then planting rhizomes in the newly formed, least decomposed peat. Greenhouse experiments revealed that cloudberries grow best in such substrates [8].
Cloudberry is abundant in northern regions, but populations of this plant are declining at the southern edge of its range. In Europe, this species is predominantly distributed in northern countries, with its southernmost occurrence recorded in the Krkonoše Mountains of the Czech Republic [9]. In Poland and Belarus, cloudberry has already been included in the lists of protected species [10,11,12]. In Lithuania, this plant is not widespread, but it can be found in the northern part of the country, and it is not listed as a protected species.
Genetic differentiation studies of cloudberry populations have already been conducted in several European countries. In 2018, a study of the genetic diversity of cloudberry populations found in the Czech Republic and Norway was carried out using microsatellite markers. It was found that genetic differentiation is largely determined by the genetic variation found within populations rather than between different populations. Genetic differentiation between those populations is determined by limited gene flow. However, although populations from different regions are genetically distinct, individuals with shared alleles were also found [13]. Another study performed in Poland in 2023 sought to determine the genetic diversity between populations in Poland, Norway, and Sweden. The selected microsatellite markers revealed that the greatest differentiation is between populations from different regions, rather than within geographical regions. High genetic diversity was found in the north of Poland, where cloudberry populations were divided into three distinct genetically isolated groups [14]. The study demonstrated that different population groups did not share any common alleles. The observed differences between the results of these two studies may be attributed to differences in the genetic markers used and the data analysis methods applied.
Although several studies have investigated cloudberry population diversity in Europe, data on the population genetics of this species in the Baltic region are lacking. Therefore, in this work, we aimed to assess intra- and interpopulation genetic diversity among geographically close cloudberry growing sites in the Eastern Baltic region using microsatellite markers. The objectives of the study are (i) to determine the genetic diversity of cloudberry in the Eastern Baltic region based on analyzed microsatellite loci; (ii) to characterize the genetic differentiation among cloudberry sampling sites in the study area and determine whether a correlation exists between geographic and genetic distances; and (iii) to discuss patterns of genetic relationships among the examined sampling sites.

2. Materials and Methods

2.1. Population Sampling of Cloudberries

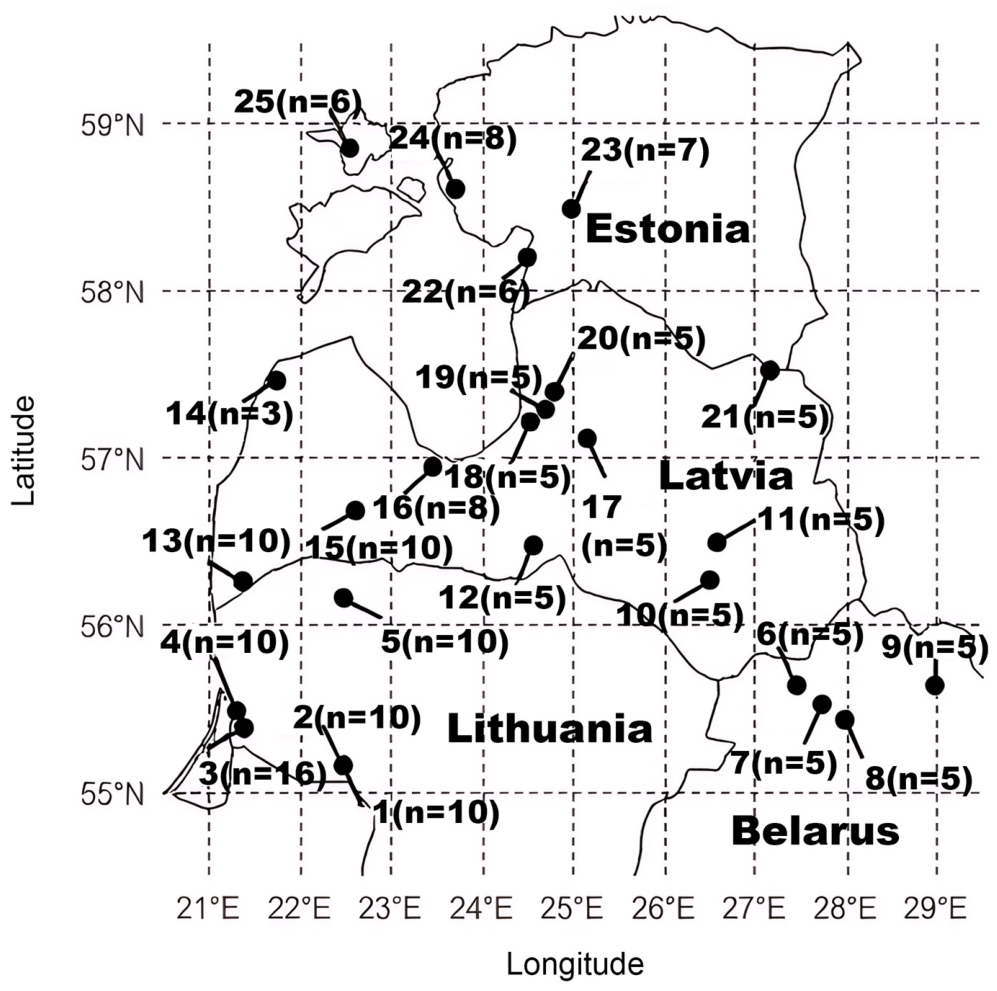
This study examined twenty-five sampling sites of cloudberries represented by a total of 174 individuals (3 to 16 from one sampling site) from western Lithuania (5 sampling sites, n = 56), northern Belarus (4 sampling sites, n = 20) Latvia (12 sampling sites, n = 71) and Estonia (4 sampling sites, n = 27), and sampled from 2020 to 2024 (Figure 1). The number of individuals per site ranged from 3 to 16, averaging 6.96 individuals per site. Sample sizes vary across sampling sites due to natural growing site density and field collection constraints. Samples were collected systematically, with collection sites spaced 10–20 m apart throughout the territory [15]. This distance was chosen to minimize the likelihood that samples from the same clone were collected. To ensure the removal of all moisture from the collected leaves, samples were placed in bags with silica gel granules.

2.2. DNA Extraction and Molecular Analysis of Cloudberries

DNA extraction was performed following recommendations indicated in Krasnevska et al. [16]. The dry leaf samples were homogenized in an ice bath until they became a fine powder. Immediately, 1 mL of lysis buffer heated to 60 °C and 10 μL of mercaptoethanol were added to each sample. Then, samples were incubated in the lysis buffer for one hour at 60 °C, then 600 μL of chloroform:isoamyl alcohol in a ratio of 24:1 was added and mixed well. The samples were centrifuged at maximum speed (16,100× g (13,200 rpm)) for 10 min. The aqueous phase (~750 μL) was transferred to a new tube and equal volume of isopropanol was then added. The tubes were incubated for up to 24 h at −20 °C. Afterwards, 400 μL of washing buffer (75% ethanol, 0.01 M ammonium acetate) was added, and tubes were centrifuged at maximum speed for 10 min. The supernatant was discarded, and the tubes were dried. Then, 100 μL of TE buffer and 5 μL of RNase A were added to the pellet remaining on the bottom of the tube. After incubation of the tubes for 20 min at 37 °C, 50 μL of 7.5 M ammonium acetate was added and the tubes were briefly shaken. Finally, 250 μL of 96% ethanol was added to the same tube and centrifuged at maximum speed for 10 min. After the supernatant was discarded and the pellet was dried, 50 μL of TE buffer was added to dissolve DNA for storage. The samples were stored at −20 °C. Before performing PCR, the quality of DNA was checked based on electrophoretic analysis on 1% agarose gel.
Once DNA was extracted, multiplex PCR was performed to amplify microsatellite loci [17]. Six primer pairs best suited for cloudberries were chosen, and PCR was performed with fluorescently labelled primers (Table 1). Reactions were performed using a volume of 12.5 μL consisting of 5.36 μL Ampil Taq Gold 360 Master Mix (Thermo Fisher Scientific Baltics, Vilnius, Lithuania), 1 μL of each primer at a concentration of 0.20 μM, 1.14 μL of nuclease-free dH2O, and 2 μL of the DNA sample. Theoretical melting temperatures (Tm) for each primer pair were calculated (Table 1), and a common annealing temperature (Ta) of 58 °C was selected for the multiplex reaction. PCRs were conducted under the following conditions: an initial denaturing step of 95 °C for 10 min, followed by 35 cycles of 30 s at 95 °C, 30 s at 58 °C, and then 30 s at 72 °C, and finally finished at 72 °C for 7 min.
Fragment analysis was performed using a Genetic Analyzer 3500 (Thermo Fisher Scientific, Waltham, MA, USA) with LIZ600 size standard. The results of fragment analysis were processed using GeneMapper software (v6.1 Applied Biosystems, Foster City, CA, USA).

2.3. Data Analysis

The lengths of microsatellite locus fragments were recorded in an Excel spreadsheet. All data were analyzed using R statistical software version 4.4.2 with several specialized population genetics packages. The main packages used included adegenet (v.2.1.11), poppr (v.2.9.8), vegan (v.2.7-5), and RColorBrewer (v.1.1-3) for data analysis and visualization [18,19,20,21].
Genotypes were scored as binary allele presence/absence profiles. The resulting binary matrix was formatted for polyploid-aware population genetic analyses in R. Pairwise genetic differentiation was calculated using band-based distance metrics suitable for dominant phenotypic profiles, avoiding standard diploid allele frequency assumptions. In order to assess genetic diversity, key indicators of genetic diversity such as allele richness, observed and expected heterozygosity of sampling sites [22], Shannon diversity index, and the number of unique genotypes were calculated for each sampling site and at each locus. Heterozygosity was assessed by determining genotypes with several different alleles at each locus, taking into account that cloudberry is an octoploid species. Expected heterozygosity was calculated using a model suitable for allopolyploids [23].
Population structure was assessed using Discriminant Analysis of Principal Components (DAPC) implemented in the adegenet package in R software [18]. The optimal number of clusters was determined based on the Bayesian Information Criterion (BIC). Using poppr, Nei’s genetic distance was calculated between all pairs of sampling sites to evaluate patterns of genetic differentiation.
The relationships between sampling sites were visualized using principal coordinates analysis (PCoA) with the vegan package [20]. In addition, to visualize genetic relationships between collection sites, a dendrogram was created using hierarchical clustering according to Ward’s method (ward.D2), with a bootstrap value of 1000.
In order to determine whether the differences between sampling sites were determined by geographical distance, a Mantel test was performed, comparing the genetic distance matrix with the geographical distance matrix between collection sites [24]. The significance of the correlation between genetic and geographical distances was assessed using 999 permutations.

3. Results

3.1. Genetic Diversity of Studied Cloudberry Sampling Sites

It was found that among the 174 individuals studied, there were 169 different allele sets. Identical allele sets were found both within and between sampling sites, including two geographically remote sampling sites (sites 5 and 21, located in northwestern Lithuania and northeastern Latvia, respectively). These results suggest clonal propagation; however, insufficient marker resolution could not be excluded.
When each locus was examined separately, the highest number of genotypes was found in the locus amplified by RiM019 primer pair (Table 2). In total, 38 different genotypes were identified at this locus. By contrast, significantly fewer unique genotypes were found using all other primer pairs. The exceptionally high variability of RiM019 makes it particularly valuable for genetic analysis of sampling sites, as it has the most input in determining the structure of a population. This locus was identified as the most informative and diverse marker, not only due to the highest number of unique genotypes but also due to its high allelic richness and Shannon diversity index, indicating high polymorphism and a relatively even distribution of alleles.
High levels of observed heterozygosity were detected across five of the six analyzed loci, with Ho values ranging from 0.19 to 1.00. At these loci, observed heterozygosity (Ho) is higher than expected heterozygosity (He). This coincides with theoretical studies suggesting high heterozygosity rates in species that primarily reproduce through cloning [25,26]. In contrast, locus RiM017 showed considerably lower heterozygosity (Ho = 0.19), indicating reduced genetic variability and limited resolution for distinguishing genetic differences among individuals.
After analyzing all 25 cloudberry sampling sites, a high level of heterozygosity was determined (Table 3), which corresponds to the allopolyploid nature of the species [27]. Ho in the studied sampling sites was not lower than 0.75 and reached a value ≥ 0.80 in 20 of 25 sites. The high level of heterozygosity across all sampling sites, regardless of geographical location, indicates that significant genetic diversity remains throughout the entire studied distribution range of cloudberry. The diversity that formed during polyploidization is maintained due to the allopolyploid genome structure characteristic of this plant, almost exclusively vegetative reproduction, and occasional random sexual reproduction [28,29].
The distribution of genetic diversity parameters across the 25 studied sampling sites revealed geographic patterns of variation in cloudberry genetic diversity (Table 3). Sampling sites located in Estonia (sites 22–25) exhibited the highest levels of genetic diversity, with the highest allelic richness values observed at sites 24 and 25 (both 4.42). These sites also showed the highest Shannon diversity index values (1.46–1.47), indicating greater allele diversity and a more even distribution of alleles. These sampling sites are located at the northernmost part of the species’ distribution range, making them the most distant from the range margin, and these populations possibly have experienced less severe environmental stress [30]. In addition, Estonian sites showed relatively high numbers of unique genotypes, ranging from 2.83 to 3.60.
In contrast, Belarusian sampling sites (sites 6–9) demonstrated the lowest genetic diversity parameters, with allelic richness ranging from 2.97 to 3.60 and Shannon diversity index values from 0.99 to 1.18. The number of unique genotypes was also lower in Belarusian sites (1.83–2.17) compared with most Lithuanian, Latvian, and Estonian sites. Sampling sites in Lithuania (sites 1–5) and Latvia (sites 10–21) showed intermediate values for allelic richness, Shannon diversity index, and unique genotype numbers, corresponding to their geographical position between Belarus and Estonia. Overall, these results indicate a geographic gradient of genetic diversity across the Eastern Baltic region, with the highest diversity in northern Estonia and the lowest diversity in Belarus.
Permutation analysis of variance (PERMANOVA) showed that 34.9% of genetic diversity was detected between sampling sites, while the majority, 65.1%, was between individuals within the collection sites (p = 0.001). Such a distribution of genetic diversity is characteristic of sampling sites with barriers to gene flow [31], which in this case may be due to the reproductive biology of the plant [13,32,33].

3.2. Assessment of Population Structure of Cloudberries

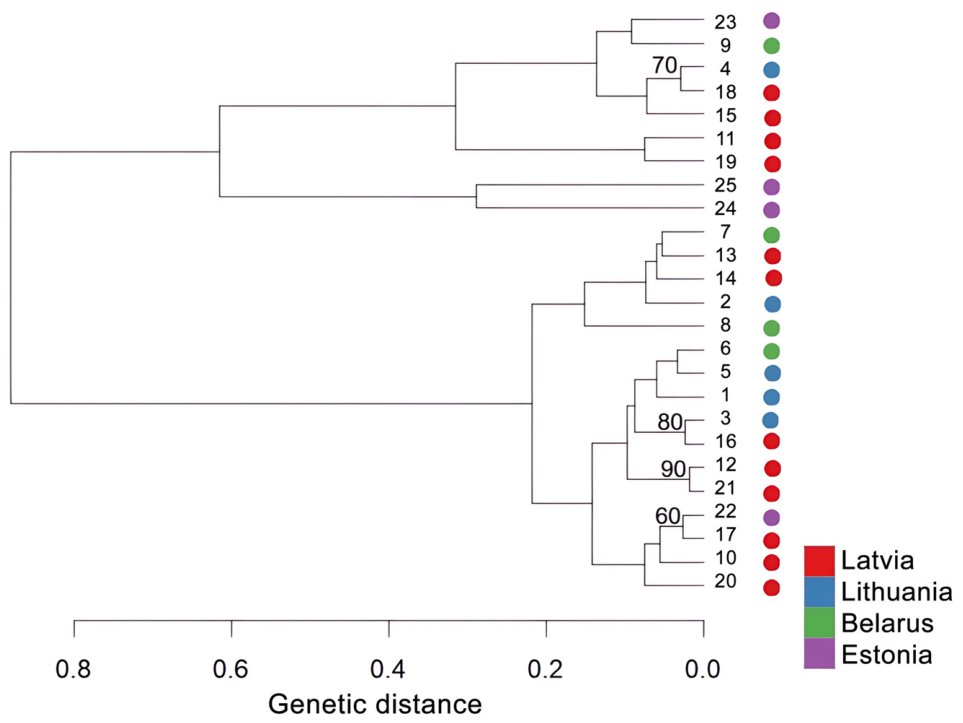
The UPGMA dendrogram based on pairwise genetic distances divided the 25 sampling sites into two major clusters (Figure 2). Within the upper cluster, the Estonian sampling sites 24 and 25 formed a distinct subcluster, suggesting high genetic similarity between these geographically adjacent sampling sites. The second major cluster also contained sampling sites from Lithuania, Belarus, Latvia, and one from Estonia, demonstrating additional genetic mixing among countries. Overall, sampling sites from different geographic regions were interspersed throughout the dendrogram rather than forming country-specific clusters, indicating that other factors most likely have the greatest influence on the genetic structure of sampling sites. It is important to note that many nodes within the dendrogram received low bootstrap support (<50%), indicating that this phylogenetic tree model has limited power to resolve fine-scale population relationships.
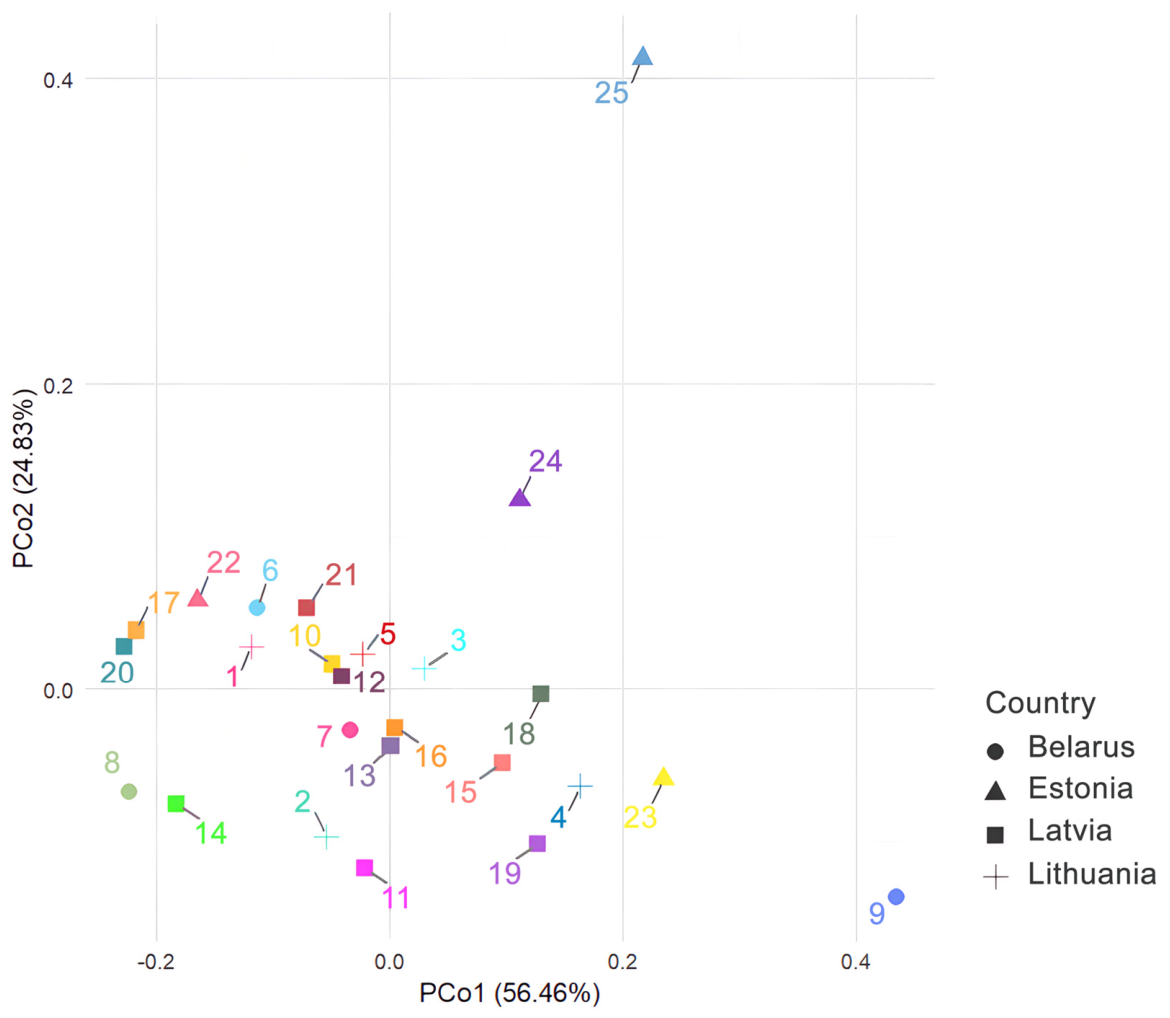
Principal coordinates analysis (PCoA) based on pairwise genetic distances revealed genetic relationships between the cloudberry sampling sites studied (Figure 3). The first two principal coordinates explained 81.09% of genetic variation, PCo1 accounting for 56.46% and PCo2 for 24.83%. Most sampling sites from Lithuania, Latvia, and Belarus clustered closely together and showed substantial overlap, indicating close genetic relatedness among these sampling sites.
In contrast, the Estonian sampling sites were more clearly differentiated. Sampling site 23 was separated mainly along PCo1, and sampling site 24 along PCo2, whereas sampling site 25 was distinctly isolated from all other sites along both coordinate axes, indicating the highest level of genetic differentiation. The Belarus sampling site 9 was also clearly separated from the remaining sites, primarily along PCo1.

3.3. Geographical and Genetic Patterns of Cloudberries

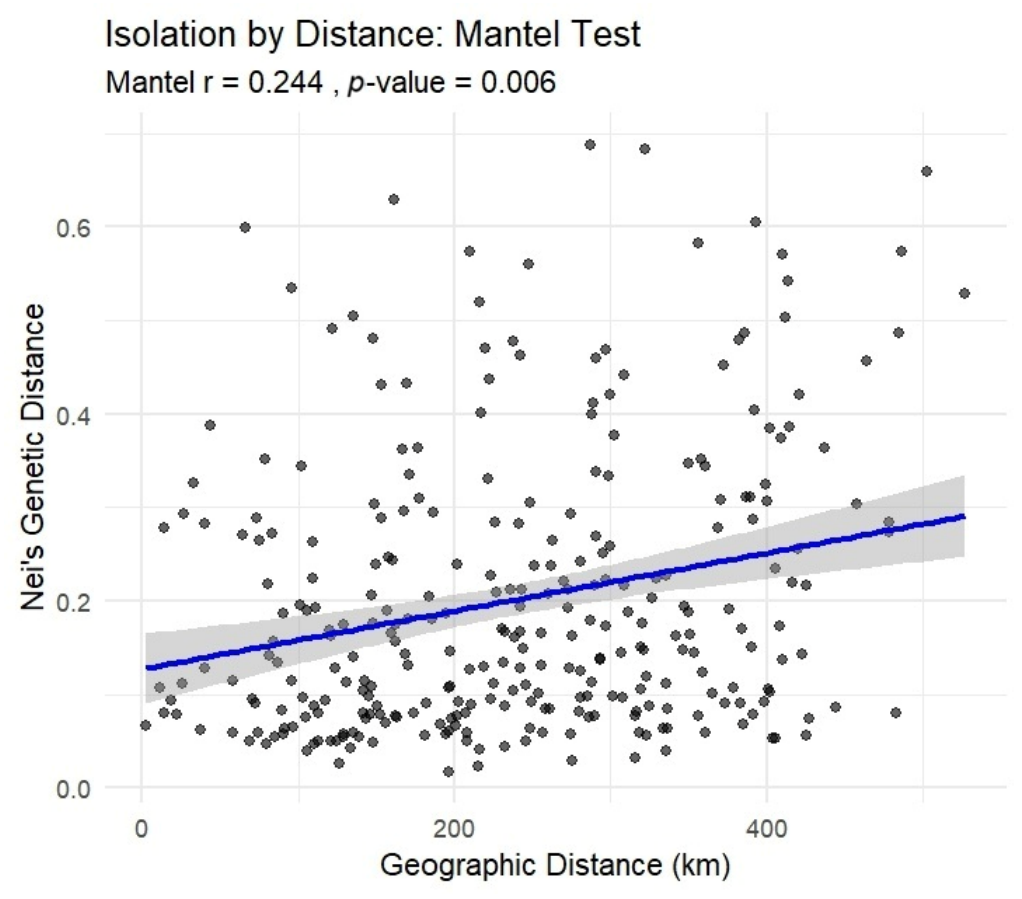
The relationship between genetic and geographical distance between sampling sites was assessed using the Mantel test. Isolation by distance was weakly but significantly correlated with the geographic distance between sampling sites (r = 0.244, p = 0.006) (Appendix A Figure A1). It is possible that the weak correlation between genetic and geographic distances may reflect the mixed reproductive strategy of cloudberry, in which sexual reproduction by seeds, which can be dispersed over long distances by birds [34], is combined with vegetative reproduction by rhizomes, resulting in genetic linkage at the local level. The significant but low Mantel test r value indicates that although geographical distance influences genetic structure, other factors, such as habitat fragmentation, historical changes in range after the ice age, or the dioecious nature of the species, likely play an important role in shaping the population genetic structure in the studied region.
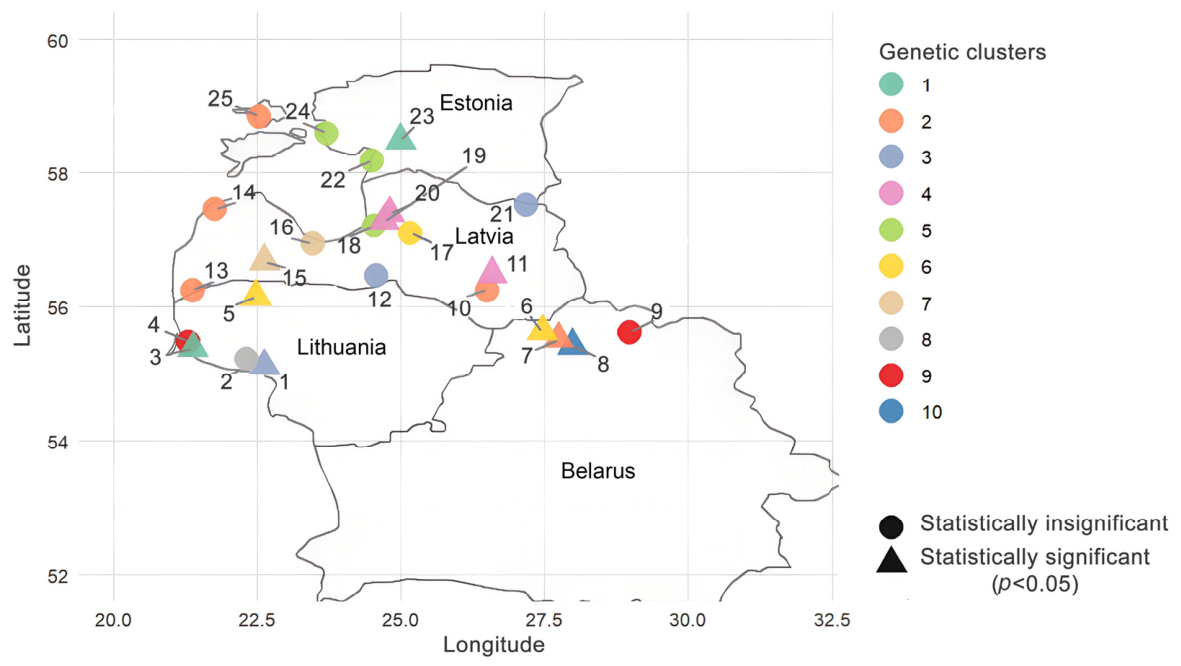
Discriminant Analysis of Principal Components (DAPC) was performed to disclose the most likely number of genetic clusters among sampling sites studied. Based on the BIC, the optimal clustering solution was K = 10, which yielded the lowest BIC value (−540). The distribution of the 10 clusters was depicted on a map where each collection site was represented by a different color corresponding to its assigned genetic cluster (Figure 4). The spatial distribution of the genetic clusters revealed no clear relationships between geographic proximity and genetic similarity. Several geographically adjacent sampling sites were assigned to different genetic clusters, whereas some geographically distant sampling sites grouped within the same cluster. Notably, only two genetic clusters consisted exclusively of sampling sites with statistically significant assignments. One cluster included the geographically adjacent 19, 20, and 11 sampling sites, whereas the other comprised sampling sites 3 and 23, although these sites are geographically distinct.

4. Discussion

4.1. Patterns of Genetic Diversity in Cloudberries from Eastern Baltic Region

The analysis of genetic diversity parameters revealed clear geographical variation among the studied cloudberry sampling sites in the Eastern Baltic region. Belarusian sampling sites generally demonstrated lower allelic richness compared with collection sites from Lithuania, Latvia, and Estonia, whereas several Estonian sampling sites (mostly 24 and 25) showed the highest levels of allelic richness. Similar patterns were observed for Shannon diversity index values and the number of unique genotypes. Lower genetic variation in sampling sites from the edge of the species’ range may be related to historical demographic processes, habitat fragmentation, reduced gene flow, or long-term isolation. Populations located near species distribution margins often experience reduced gene flow and smaller effective population sizes, which may contribute to reduced genetic diversity [30,35]. However, considering the postglacial history and fragmented distribution of suitable peatland habitats [2,33], the observed geographic gradient likely reflects several interacting processes.
Despite intensive vegetative reproduction, a high level of heterozygotic genetic diversity has been preserved in all 25 sampling sites (Ho ≥ 0.75). Most of the genetic differentiation was found within sampling sites rather than between them. This indicates that, despite the predominance of vegetative reproduction, sexual reproduction likely contributes to the maintenance of genetic diversity within sampling sites, consistent with previous studies of clonal species and cloudberry populations [25,29]. In addition, the allopolyploid origin of cloudberries may partly explain the high genetic diversity observed by increasing genomic variation and enhancing the potential for genetic differentiation [27,28].

4.2. Genetic Structure and Differentiation of Cloudberries

The genetic structure of cloudberry sampling sites revealed a complex pattern in which geographical proximity only partly explained genetic relationships among collection sites. The Mantel test showed a weak but significant correlation between genetic and geographical distances. Similar patterns were reported for cloudberry populations in Central Europe, suggesting that historical processes, reproductive characteristics, and habitat distribution contribute to population structure [13]. The absence of strong geographical clustering was also evident from UPGMA, PCoA, and DAPC analyses. Sampling sites from different countries were intermixed within genetic clusters, whereas some geographically close sampling sites showed different genetic assignments.
Most of the genetic variation was detected within sampling sites (65.1%) rather than among collection sites (34.9%). This pattern is consistent with the biology of cloudberry as a long-lived clonal species capable of extensive vegetative propagation through rhizomes [36]. Clonal growth may preserve locally established genotypes over long periods [25,29,37].
Notably, sampling sites 24 and 25 from Estonia, demonstrating the highest level of genetic variation, were separated from most other sampling sites in the UPGMA and PCoA analyses. The combination of high diversity and genetic distinctiveness may indicate long-term persistence of these sampling sites, or the presence of divergent ancestral lineages [38]. Northern Estonia may have provided suitable conditions for the long-term survival of cloudberry populations [39], allowing the accumulation and preservation of unique genetic variation after post-glacial recolonization [30,33]. Alternatively, these growing sites may represent areas influenced by historical admixture between genetically distinct lineages. Further genomic studies are desirable to draw reliable conclusions on the observed distinctiveness of northern Estonia sites of cloudberries.

4.3. Historical and Ecological Processes Shaping Genetic Structure

The observed genetic structure may be explained by a combination of historical and ecological processes. As a post-glacial relict species, cloudberry populations in the eastern Baltic region may reflect historical colonization [33]. The spatial distribution of genetic clusters further suggests that historical processes, rather than geographic distance alone, have shaped population structure. The DAPC analysis showed that geographically distant sampling sites may share genetic similarity, whereas nearby collection sites can belong to different clusters. For instance, sampling sites 3 and 23 from Lithuania and Estonia, respectively, were assigned to the same statistically significant genetic cluster despite their geographic separation. This finding possibly reflects historical connectivity, shared genetic lineage, or long-distance dispersal [34,40].
Although vegetative reproduction dominates in cloudberry, sexual reproduction may contribute to genetic connectivity through seed dispersal. Birds have been suggested as potential seed dispersers due to their ability to consume cloudberry fruits and transport seeds between wetlands [34]. Dispersal mediated by birds could partly explain genetic similarities between geographically distant sampling sites and the absence of strict geographical clustering. However, this assumption should be considered cautiously as genetic data alone cannot confirm historical seed movement, and successful establishment also depends on habitat availability.
The occurrence of identical multilocus genotypes between geographically distant sites 5 and 21 may indicate historical connectivity or long-distance dispersal. However, identical genotypes may also result from insufficient marker resolution, particularly in an allopolyploid species where distinguishing homologous alleles can be challenging [23].

4.4. Study Limitations and Future Perspectives

The current study provides new insights into the genetic structure and diversity patterns of cloudberry collection sites in the Eastern Baltic region. The analysis revealed high genetic diversity among the studied sampling sites, and the grouping of similar collection sites disclosed connections between geographically distant sampling sites. These findings improve our understanding of the evolutionary history and genetic architecture of cloudberries in the Eastern Baltic region and provide valuable evidence for the conservation of this economically important species. In particular, the identification of genetically distinct sampling sites in Estonia, which are also characterized by very high genetic diversity, highlights the importance of preserving such growing sites as reservoirs of the species’ overall genetic variability [41,42].
Several limitations should be considered when interpreting the genetic structure of cloudberry sampling sites. Although microsatellite markers provided valuable information on genetic variability and differentiation, the limited number of loci may not fully resolve fine-scale sampling site relationships, particularly in an allopolyploid species with a highly complex genome structure [23]. In addition, differences in sampling intensity among collection sites may influence estimates [43].
While microsatellite markers and genome-wide approaches provide substantial insights into the population genetic structure of cloudberries in the Eastern Baltic region, future studies could significantly benefit from incorporating inter-primer binding site (iPBS) markers. Because iPBS profiling targets ubiquitous retrotransposons without requiring prior genomic sequence data, it offers several distinct advantages for clonal and polyploid species like cloudberry. Specifically, future research should focus on achieving finer-scale clonal resolution to verify whether identical allele sets observed between distant locations (such as sites 5 and 21) stem from true historical connectivity or insufficient marker resolution, given the dominance of vegetative reproduction via rhizomes in cloudberry populations. Furthermore, utilizing a panel of optimized iPBS primers would allow researchers to screen multi-locus variation across the entire octoploid genome (2n = 8x = 56), capturing structural genomic changes driven by mobile genetic elements that may not be detected by neutral SSRs. Finally, integrating iPBS markers alongside cpDNA, mtDNA, and high-throughput sequencing data across a broader geographic range extending deeper into Fennoscandia and core boreal areas would clarify whether the high genetic distinctiveness observed in northern Estonian sampling sites is linked to ancient refugial lineages or active retrotransposon-mediated adaptation to changing peatland environments.

Author Contributions

Conceptualization, D.B. and D.G.; methodology, D.G., D.B. and V.L.; software, V.L.; validation, D.B. and D.G.; formal analysis, V.L.; investigation, V.L.; resources, D.B. and D.G.; data curation, V.L.; writing—original draft preparation, V.L.; writing—review and editing, V.L., D.B., P.P. and D.G.; visualization, V.L.; supervision, D.B.; project administration, D.B. and D.G. All authors have read and agreed to the published version of the manuscript.

Funding

This research received no external funding.

Institutional Review Board Statement

Not applicable.

Data Availability Statement

The original contributions presented in this study are included in the article. Further inquiries can be directed to the corresponding author.

Acknowledgments

The authors thank Nikole Krasņevska, Andra Miķelsone, and Alesya Kruchonok, who contributed to the collection of the samples.

Conflicts of Interest

The authors declare no conflicts of interest.

Appendix A

Table A1. Detailed locations of 25 cloudberry sampling sites.
Sampling SiteNumber of Sampled IndividualsCountryLocationCoordinates
(Latitude (°N), Longitude (°E))
110LithuaniaGlitis55.1465, 22.4725
210LithuaniaArtoji55.1663, 22.4513
316LithuaniaAukštumala55.3854, 21.3790
410LithuaniaSvencelė55.4819, 21.2966
510LithuaniaKamanos 56.1619, 22.4720
65BelarusVelikij moch 55.6372, 27.4504
75BelarusElna 55.5238, 27.7362
85BelarusZhada55.4284, 27.9780
95BelarusLonno55.6332, 28.9719
105LatviaAsenieku56.2644, 26.4904
115LatviaLielais Pelecares56.4920, 26.5755
125LatviaZalezera56.4719, 24.5610
1310LatviaTirpuvis56.2602, 21.3664
143LatviaKlānu57.4599, 21.7547
1510LatviaBaltezera56.6792, 22.6208
168LatviaKemeri56.9414, 23.4508
175LatviaNitaure57.1120, 25.1513
185LatviaDzelves ir Krona57.2079, 24.5143
195LatviaLaugas57.2806, 24.7028
205LatviaPemmes57.3942, 24.7968
215LatviaBaltais57.5238, 27.1595
226EstoniaVoiste58.1923, 24.4921
237EstoniaSoomaa58.4888, 24.9861
248EstoniaKaruse58.6023, 23.7051
256EstoniaTihu58.8537, 22.5313
Figure A1. Results of the Mantel test illustrating the correlation between genetic and geographic distances among sampling sites of cloudberries. Each point represents a pairwise comparison of populations. The grey shading indicates the 95% confidence interval around the blue regression line.
Diversity 18 00513 g0a1

References

  1. Thiem, B. Rubus chamaemorus L.—A boreal plant rich in biologically active metabolites: A review. Biol. Lett. 2003, 40, 3–13. [Google Scholar]
  2. Āboliņa, L.; Osvalde, A.; Karlsons, A. Habitat characteristics and mineral nutrition status of Rubus chamaemorus L. in Latvia. Plants 2023, 12, 528. [Google Scholar] [CrossRef] [Scilit] [PubMed]
  3. Mohammadpour, S.; Karimzadeh, G.; Ghaffari, S.M. Karyomorphology, genome size, and variation of antioxidant in twelve berry species from Iran. Caryologia 2023, 75, 133–148. [Google Scholar] [CrossRef] [Scilit]
  4. Michael, K. Clarification of Basal Relationships in Rubus (Rosaceae) and the Origin of Rubus chamaemorus. Master’s Thesis, Western Kentucky University, Bowling Green, KY, USA, 2006. [Google Scholar]
  5. Strand, M.A.; To, T.-H.; Tørresen, O.K.; Fullmer, S.; Ferrari, G.; Skage, M.; Tooming-Klunderud, A.; Sandve, S.R.; Jakobsen, K.S. The origin of the octoploid cloudberry (Rubus chamaemorus) genome is the result of multiple and complex polyploidization events. J. Hered. 2026, 117, 822–833. [Google Scholar] [CrossRef] [Scilit] [PubMed]
  6. De Luca, L.M.; Norum, K.R. Scurvy and cloudberries: Chapter in the history of nutritional sciences. J. Nutr. 2011, 141, 2101–2105. [Google Scholar] [CrossRef] [Scilit] [PubMed]
  7. Puupponen-Pimiä, R.; Nohynek, L.; Suvanto, J.; Salminen, J.-P.; Seppänen-Laakso, T.; Tähtiharju, J.; Honkapää, K.; Oksman-Caldentey, K.-M. Natural antimicrobials from cloudberry (Rubus chamaemorus) seeds by sanding and hydrothermal extraction. ACS Food Sci. Technol. 2021, 1, 917–927. [Google Scholar] [CrossRef] [Scilit]
  8. Bussières, J.; Rochefort, L.; Lapointe, L. Cloudberry cultivation in cutover peatland: Improved growth on less decomposed Peat. Can. J. Plant Sci. 2015, 95, 479–489. [Google Scholar] [CrossRef] [Scilit]
  9. Danihelka, J.; Chrtek, J.J.; Kaplan, Z. Checklist of vascular plants of the Czech Republic. Preslia 2012, 84, 647–811. [Google Scholar]
  10. Thiem, B.; Śliwińska, E. Flow cytometric analysis of nuclear DNA content in cloudberry (Rubus chamaemorus L.) in vitro cultures. Plant Sci. 2003, 164, 129–134. [Google Scholar] [CrossRef] [Scilit]
  11. Kachanovsky, I.M. (Ed.) The Red Book of the Republic of Belarus: Plants: The Rare and Endangered Species of Wild Plants; Belarusian Encyclopedia Named After P. Brovka: Minsk, Belarus, 2015; p. 445. [Google Scholar]
  12. Szczęśniak, E.; Celka, Z.; Ziarnek, K.; Dajdok, Z.; Cwener, A.; Michalska-Hejduk, D.; Kaźmierczakowa, R.; Bloch-Orłowska, J.; Pawlikowski, P. (Eds.) Polska Czerwona Lista Paprotników i Roślin Kwiatowych = Polish Red List of Pteridophytes and Flowering Plants; Instytut Ochrony Przyrody Polskiej Akademii Nauk: Kraków, Poland, 2016; p. 31. [Google Scholar]
  13. Leišová-Svobodová, L.; Phillips, J.; Martinussen, I.; Holubec, V. Genetic differentiation of Rubus chamaemorus populations in the Czech Republic and Norway after the last glacial period. Ecol. Evol. 2018, 8, 5701–5711. [Google Scholar] [CrossRef] [Scilit] [PubMed]
  14. Urbaniak, J.; Kwiatkowski, P.; Pawlikowski, P. Genetic diversity and population structure of the endangered Rubus chamaemorus populations in Poland. Glob. Ecol. Conserv. 2023, 47, e02633. [Google Scholar] [CrossRef] [Scilit]
  15. Karst, A.L.; Antos, J.A.; Allen, G.A. Sex ratio, flowering and fruit set in dioecious Rubus chamaemorus (Rosaceae) in Labrador. Botany 2008, 86, 204–212. [Google Scholar] [CrossRef] [Scilit]
  16. Krasņevska, N.; Miķelsone, A.; Kruchonok, A.; Rashal, I.; Butkauskas, D.; Grauda, D. Assessment of iPBS primers potential to be used in genetic diversity studies of wild cloudberry (Rubus chamaemorus L.) populations. In Proceedings of the Latvian Academy of Sciences. Section B. Natural, Exact, and Applied Sciences; Latvian Academy of Sciences: Riga, Latvia, 2022; Volume 76, pp. 314–316. [Google Scholar] [CrossRef] [Scilit]
  17. Castillo, N.R.F.; Reed, B.M.; Graham, J.; Fernández-Fernández, F.; Bassil, N.V. Microsatellite markers for raspberry and blackberry. J. Am. Soc. Hortic. Sci. 2010, 135, 271–278. [Google Scholar] [CrossRef] [Scilit]
  18. Jombart, T.; Devillard, S.; Balloux, F. Discriminant analysis of principal components: A new method for the analysis of genetically structured populations. BMC Genet. 2010, 11, 94. [Google Scholar] [CrossRef] [Scilit] [PubMed]
  19. Kamvar, Z.N.; Tabima, J.F.; Grünwald, N.J. Poppr: An R package for genetic analysis of populations with clonal, partially clonal, and/or sexual reproduction. PeerJ 2014, 2, e281. [Google Scholar] [CrossRef] [Scilit] [PubMed]
  20. Dixon, P. VEGAN, a package of R functions for community ecology. J. Veg. Sci. 2003, 14, 927–930. [Google Scholar] [CrossRef]
  21. Neuwirth, E. RColorBrewer: ColorBrewer Palettes. R Package Version 1.1-3, 2022. Available online: https://CRAN.R-project.org/package=RColorBrewer (accessed on 20 August 2026).
  22. Chung, M.Y.; Merilä, J.; Li, J.; Mao, K.; López-Pujol, J.; Tsumura, Y.; Chung, M.G. Neutral and adaptive genetic diversity in plants: An overview. Front. Ecol. Evol. 2023, 11, 1116814. [Google Scholar] [CrossRef] [Scilit]
  23. Clark, L.V.; Schreier, A.D. Resolving microsatellite genotype ambiguity in populations of allopolyploid and diploidized autopolyploid organisms using negative correlations between allelic variables. Mol. Ecol. Resour. 2017, 17, 1090–1103. [Google Scholar] [CrossRef] [Scilit] [PubMed]
  24. Diniz-Filho, J.A.F.; Soares, T.N.; Lima, J.S.; Dobrovolski, R.; Landeiro, V.L.; Telles, M.P.D.C.; Rangel, T.F.; Bini, L.M. Mantel test in population genetics. Genet. Mol. Biol. 2013, 36, 475–485. [Google Scholar] [CrossRef] [Scilit] [PubMed]
  25. Balloux, F.; Lehmann, L.; De Meeûs, T. The population genetics of clonal and partially clonal diploids. Genetics 2003, 164, 1635–1644. [Google Scholar] [CrossRef] [Scilit] [PubMed]
  26. Meloni, M.; Reid, A.; Caujapé-Castells, J.; Marrero, Á.; Fernández-Palacios, J.M.; Mesa-Coelo, R.A.; Conti, E. Effects of clonality on the genetic variability of rare, insular species: The case of Ruta microcarpa from the Canary Islands. Ecol. Evol. 2013, 3, 1569–1579. [Google Scholar] [CrossRef] [Scilit] [PubMed]
  27. Chen, Z.J.; Yu, H.H. Genetic and epigenetic mechanisms for polyploidy and hybridity. In Polyploid and Hybrid Genomics; Chen, Z.J., Birchler, J.A., Eds.; Wiley-Blackwell: New York, NY, USA, 2013; pp. 335–354. [Google Scholar] [CrossRef] [Scilit]
  28. Mason, A.S.; Wendel, J.F. Homoeologous exchanges, segmental allopolyploidy, and polyploid genome evolution. Front. Genet. 2020, 11, 1014. [Google Scholar] [CrossRef] [Scilit] [PubMed]
  29. Vallejo-Marín, M.; Dorken, M.E.; Barrett, S.C.H. The ecological and evolutionary consequences of clonality for plant mating. Annu. Rev. Ecol. Evol. Syst. 2010, 41, 193–213. [Google Scholar] [CrossRef] [Scilit]
  30. Eckert, C.G.; Samis, K.E.; Lougheed, S.C. Genetic variation across species’ geographical ranges: The central–marginal hypothesis and beyond. Mol. Ecol. 2008, 17, 1170–1188. [Google Scholar] [CrossRef] [Scilit] [PubMed]
  31. Hevroy, T.H.; Moody, M.L.; Krauss, S.L. Population genetic analysis reveals barriers and corridors for gene flow within and among riparian populations of a rare plant. AoB Plants 2018, 10, plx065. [Google Scholar] [CrossRef] [Scilit] [PubMed]
  32. Debnath, S.C. Inter-simple sequence repeat (ISSR)-PCR analysis to assess genetic diversity in a collection of wild cloudberry (Rubus chamaemorus L.) clones. J. Hortic. Sci. Biotechnol. 2007, 82, 727–732. [Google Scholar] [CrossRef] [Scilit]
  33. Ehrich, D.; Alsos, I.G.; Brochmann, C. Where did the northern peatland species survive the dry glacials: Cloudberry (Rubus chamaemorus) as an example. J. Biogeogr. 2008, 35, 801–814. [Google Scholar] [CrossRef] [Scilit]
  34. Nechaev, V.A.; Nechaev, A.A. Wild berry plants and carpophagous birds in the taiga zone of the southern Russian Far East. Contemp. Probl. Ecol. 2012, 5, 71–78. [Google Scholar] [CrossRef] [Scilit]
  35. Hardie, D.C.; Hutchings, J.A. Evolutionary ecology at the extremes of species’ ranges. Environ. Rev. 2010, 18, 1–20. [Google Scholar] [CrossRef] [Scilit]
  36. De Witte, L.C.; Stöcklin, J. Longevity of clonal plants: Why it matters and how to measure it. Ann. Bot. 2010, 106, 859–870. [Google Scholar] [CrossRef] [Scilit] [PubMed]
  37. Gauci, R.; Otrysko, B.; Catford, J.-G.; Lapointe, L. Carbon allocation during fruiting in Rubus chamaemorus. Ann. Bot. 2009, 104, 703–713. [Google Scholar] [CrossRef] [Scilit] [PubMed]
  38. Deng, T.; Abbott, R.J.; Li, W.; Sun, H.; Volis, S. Genetic diversity hotspots and refugia identified by mapping multi-plant species haplotype diversity in China. Isr. J. Plant Sci. 2019, 66, 136–151. [Google Scholar] [CrossRef] [Scilit]
  39. Āboliņa, L.; Karlsons, A.; Osvalde, A. Effect of shade treatment on the growth and vitality of cloudberry Rubus chamaemorus. Agric. Res. 2025, 23, 1017–1030. [Google Scholar] [CrossRef]
  40. Taylor, K. Rubus chamaemorus L. J. Ecol. 1971, 59, 293. [Google Scholar] [CrossRef] [Scilit]
  41. Allendorf, F.W.; Hohenlohe, P.A.; Luikart, G. Genomics and the future of conservation genetics. Nat. Rev. Genet. 2010, 11, 697–709. [Google Scholar] [CrossRef] [Scilit] [PubMed]
  42. Hoban, S.; Bruford, M.W.; Funk, W.C.; Galbusera, P.; Griffith, M.P.; Grueber, C.E.; Heuertz, M.; Hunter, M.E.; Hvilsom, C.; Stroil, B.K.; et al. Global commitments to conserving and monitoring genetic diversity are now necessary and feasible. BioScience 2021, 71, 964–976. [Google Scholar] [CrossRef] [Scilit] [PubMed]
  43. Aguirre-Liguori, J.A.; Luna-Sánchez, J.A.; Gasca-Pineda, J.; Eguiarte, L.E. Evaluation of the minimum sampling design for population genomic and microsatellite studies: An analysis based on wild maize. Front. Genet. 2020, 11, 870. [Google Scholar] [CrossRef] [Scilit] [PubMed]
Figure 1. Map showing sample collection sites in Lithuania, Latvia, Estonia, and Belarus. The names of the locations are listed in Appendix A Table A1 (map created using R 4.4.2.). Sampling site locations: 1–5 Lithuania, 6–9 Belarus, 10–21 Latvia, 22–25 Estonia.
Diversity 18 00513 g001
Figure 2. UPGMA dendrogram showing genetic relationships among 25 sampling sites in the Eastern Baltic region of cloudberries based on pairwise genetic distances. Bootstrap values exceeding 50% are shown next to nodes; nodes lacking labels had bootstrap values less than 50%. The horizontal axis denotes genetic distance. Colored circles indicate the geographic origin of the sample.
Diversity 18 00513 g002
Figure 3. Principal coordinates analysis (PCoA) based on Nei genetic distances exhibiting relationships between cloudberry sampling sites from Estonia, Latvia, Lithuania, and Belarus. The numbering and colors indicate the sample collection sites, which are described in Appendix A, Table A1.
Diversity 18 00513 g003
Figure 4. Geographical distribution of 10 genetic clusters of cloudberries in the Eastern Baltic region. Distinct genetic clusters are shown in different colors. Triangles and circles indicate statistically significant and non-significant cluster assignments, respectively.
Diversity 18 00513 g004
Table 1. List of oligonucleotides used for microsatellite fragment amplification.
LocusPrimer SequencesTm, °CFluorescent
Marker
Expected
Size (bp)
Product
Range (bp)
RiM017Fwd: GAAACAGGTGGAAAGAAACCTG
Rev: CATTGTGCTTATGATGGTTTCG
56.8VIC194161–196
RiM015Fwd: CGACACCGATCAGAGCTAATTC
Rev: ATAGTTGCATTGGCAGGCTTAT
57.86-FAM350344–363
RiM019Fwd: ATTCAAGAGCTTAACTGTGGGC
Rev: CAATATGCCATCCACAGAGAAA
57.2PET176160–346
RhM001Fwd: GGTTCGGATAGTTAATCCTCCC
Rev: CCAACTGTTGTAAATGCAGGAA
58.26-FAM232212–276
RhM003Fwd: CCATCTCCAATTCAGTTCTTCC
Rev: AGCAGAATCGGTTCTTACAAGC
58.6VIC200256–263
RhM023Fwd: CGACAACGACAATTCTCACATT
Rev: GTTATCAAGCGATCCTGCAGTT
58.4VIC196163–199
Table 2. Genetic diversity metrics across six loci.
LocusObserved
Heterozygosity
Expected
Heterozygosity
Shannon IndexAllelic RichnessUnique Genotypes
RhM0011.000.781.555.358
RhM0030.890.610.993.006
RiM0150.990.791.596.3616
RiM0170.190.510.863.969
RiM0190.900.831.867.8538
RhM0230.990.801.626.008
Table 3. Parameters of genetic diversity across 25 sampling sites of cloudberries.
Sampling SiteMean HoMean HeMean Shannon IMean Allelic RichnessUnique Genotypes
10.790.631.163.412.67
20.750.661.233.403.50
30.840.711.343.784.83
40.820.711.394.284.00
50.800.681.273.653.33
60.870.641.183.602.00
70.830.661.163.501.83
80.770.560.992.971.83
90.770.581.063.362.17
100.880.671.263.803.00
110.930.661.203.662.83
120.830.701.364.232.50
130.850.701.343.893.50
140.830.601.153.831.83
150.830.691.283.723.83
160.920.701.354.003.33
170.830.631.233.972.17
180.810.701.354.123.17
190.830.681.263.772.83
200.800.611.163.582.50
210.840.681.293.912.67
220.800.611.213.832.83
230.770.671.293.823.33
240.820.741.464.423.60
251.000.761.474.423.25
Disclaimer/Publisher’s Note: The statements, opinions and data contained in all publications are solely those of the individual author(s) and contributor(s) and not of MDPI and/or the editor(s). MDPI and/or the editor(s) disclaim responsibility for any injury to people or property resulting from any ideas, methods, instructions or products referred to in the content.