Article

Recent Population Genetic Divergence in Two Globose Cacti Endemic to the Queretano–Hidalguense Desert, Mexico

by
Amelia Cornejo-Romero
1,*,
Yanin Islas-Barrios
2,
Vicente de Jesús Castillo-Chora
3,
Alicia Callejas-Chavero
1 and
Carlos Gómez-Hinostrosa
4
1
Laboratorio de Ecología Vegetal, Escuela Nacional de Ciencias Biológicas, Instituto Politécnico Nacional, Prolongación de Carpio y Plan de Ayala, s/n, Miguel Hidalgo, Mexico City 11340, Mexico
2
Laboratorio Divisional de Biología Molecular, Universidad Autónoma Metropolitana-Iztapalapa (UAMI), Avenida Ferrocarril San Rafael Atlixco 186, Iztapalapa, Mexico City 09310, Mexico
3
Laboratorio de Ecología Molecular y Evolución, UBIPRO, Facultad de Estudios Superiores (FES) Iztacala, Universidad Nacional Autónoma de México (UNAM), Tlalnepantla de Baz 54090, Mexico State, Mexico
4
Departamento de Botánica, Instituto de Biología, Universidad Nacional Autónoma de México (UNAM), Apartado Postal 70-233, Mexico City 04510, Mexico
*
Author to whom correspondence should be addressed.
Diversity 2026, 18(9), 509; https://doi.org/10.3390/d18090509
Submission received: 30 June 2026 / Revised: 13 August 2026 / Accepted: 17 August 2026 / Published: 26 August 2026

Abstract

Mammillaria parkinsonii and M. perbella are species endemic to the Queretano–Hidalguense Desert (QHD), a potential globose cacti Pleistocene refuge. We tested if the phylogeographic and genetic structures of these species are temporally consistent with the Pleistocene glacial refuge hypothesis. In this case, there would be high haplotype divergence associated with population contraction during the Last Glacial period (115-11.7 kya). Chloroplast DNA sequences and ISSR nuclear markers were used to estimate genetic diversity and structure, haplotype networks, and divergence times. Changes in paleodistribution were modeled using the Ecological Niche Model (MNE). cpDNA and ISSR markers revealed low-to-moderate genetic diversity in M. pakinsonii and M. perbella (π = 0.0004, 0.0044 respectively; HS = 0.362–0.434, 0.293–0.400, respectively) and high population differentiation (GST = 1, 0.722, respectively; ΦST = 0.378, 0.3957, respectively), with no evidence of gene flow (Nm = 0, 0.29, respectively). The estimated divergence times and MNE showed that population divergence began during the Last Glacial in M. perbella and continued into the Holocene for both species. This divergence is associated with population contraction, geographic isolation, and disruption of gene flow. This joint evidence indicated that Pleistocene–Holocene glacial cycles may have driven the recent divergence of these Mammillaria species in the QHD.

1. Introduction

Mammillaria is the genus of globose cacti with the greatest species richness within the family Cactaceae and one of the most representative of the arid flora of the Americas [1]. The genus comprises approximately 155 species, of which 88.2% are endemic to Mexico; it is, therefore, considered an eminently Mexican genus [1,2]. The origin and diversification of the genus took place in the Mexican Plateau (Chihuahuan Desert) during the Neogene orogenic activity and Pleistocene cyclical climatic changes [3]. The ancestor of Mammillaria originated in the south of the Mexican Plateau (Chihuahua Desert) during the late Miocene (7.5 Mya) in a scenario of increasing aridity [3,4,5]. From this location, the genus underwent rapid diversification, mainly by dispersal, during the Pliocene–Pleistocene (4.5 Mya) [3]. Although Pleistocene climatic changes may have promoted the divergence of cacti at both macro and micro scales, their impact on geographical patterns of genetic differentiation among populations of modern globose cacti in the southern Mexican Plateau remains unclear [6,7]. During the Pleistocene glacial–interglacial cycles, the species’ range contracted during the prolonged cold and dry glacial periods; conversely, it expanded during the brief, warmer and wetter interglacial periods [8,9,10]. Thus, changes in population size, geographic isolation, and the disruption of gene flow associated with glacial cycles have a profound influence on the population genetic divergence and have contributed to species diversification in arid adapted plants of North America [11]. In the arid regions of northern Mexico (the Sonoran and Chihuahuan Deserts), phylogeographic studies highlight the geological dynamics of the Neogene and the glacial cycles of the Pleistocene as drivers of population divergence and speciation among endemic taxa [12,13]. These studies reveal a pattern of recent lineage divergence consistent with the Pleistocene glacial refuge hypothesis, according to which, during glacial periods, populations retreated to several xerophilous refuges and subsequently recolonized the north during interglacial periods [14,15]. In the columnar cacti and boojum tree of the Sonoran Desert, genetic divergence resulted from range contraction during the Last Glacial Maximum (LGM, around 22 kya) and subsequent geographical expansion from southern refugia on the Baja California Peninsula during the Holocene Optimum (around 6.5 kya) [13,16,17,18]. In the northern part of the Chihuahuan Desert, the phylogeographic history of several endemic species belonging to the genera Agave and Ephedra and shrubs reveals that the contraction events, isolation, divergence and subsequent expansion of lineages occurred along altitudinal and latitudinal gradients, and were temporally coincident with the Pleistocene glacial cycles [12,19].
From a population genetics perspective, studies of endemic Mammillaria species in the semi-arid region of central Mexico, the Tehuacán–Cuicatlán Valley, revealed low-to-moderate levels of genetic diversity and a high degree of population differentiation. These patterns are mainly driven by genetic drift and restricted gene flow due to geographical isolation and habitat specificity (i.e., soil type) [20]. Furthermore, globose cacti exhibit biological characteristics that accentuate the effect of these evolutionary forces, such as small effective population sizes and limited dispersal capacity, as well as mixed mating, which induces a certain degree of inbreeding [21,22,23].
In Mexico, six areas of high species richness for Mammillaria are recognized: Southern Baja California, in the Sonoran Desert; Jumave, Guadalcázar, San Luis Potosí and the Southern Subregion of the Chihuahuan Desert; and the Tehuacán–Cuicatlán Valley in southern Mexico, all of which may have served as refugia during the Pleistocene [1,6,7]. In particular, the southern subregion, or the Queretano–Hidalguense Desert (at the southernmost tip of the Mexican Plateau), is the main center of diversity for the genus, where a total of 30 species have been recorded, seven of which are endemic [1]. The Queretano–Hidalguense Desert (QHD) consists of small areas with valleys and depressions, relatively isolated within the states of Guanajuato, Querétaro and Hidalgo [24]. This region has been subject both to Neogene geological events—due to the uplift of the Sierra Madre Oriental and the Mexican highlands, and the formation of the Trans-Mexican Volcanic Belt—and to Pleistocene climatic changes, which have shaped the distribution and evolutionary processes of Mammillaria [6,7].
The monophyletic Leucocephale Series sensu Cervantes et al., (2021) [25] is a group of eight Mammillaria species, most of which are found in the DQH [1]. Of these, Mammillaria parkinsonii (Ehrenb.) and Mammillaria perbella (Hildm. ex K. Schum.) are endemic and their distribution coincides with the sites where the greatest species richness is found within the DQH (9–13 species) [1]. Mammillaria parkinsonii grows on calcareous slopes at an elevation of 1120–2020 masl, while M. perbella grows at 1630–2300 masl; both species prefer to grow in calcareous soils, protected by vegetation consisting of crassicauleous shrubs, microphyllous plants and dry deciduous forest [26]. Given the current discontinuous distribution of M. perbella and M. parkinsonii in the QHD, their close phylogenetic relationship and the estimated Pleistocene origin of M. perbella, these species provide a suitable system for studying the impact of Pleistocene climatic fluctuations on shaping genetic distribution patterns and promoting the divergence of intraspecific lineages.
To document the evolution of M. parkinsonii and M. perbella at the population level, within their origin center and main diversification area, we used cpDNA maternal and ISSR nuclear markers to characterize the genetic diversity and structure and date the divergence time of lineages under the scenario of Pleistocene refugia hypothesis. As a complementary approach to test the hypothesis, we reconstruct the species’ potential palaeo-distribution and infer suitable habitats where the species probably grew and reproduced in the past, by means of an Ecological Niche Model (ENM) approach. Thus, we expected that, if M. parkinsonii and M. perbella retreated to refugia during the Last Glacial, we would detect high genetic divergence among populations of each species for both chloroplast and nuclear markers, as well as divergence times among haplotypes coinciding with major climatic shifts during the Pleistocene, particularly during the Last Glacial and the Holocene. Similarly, we expected the species’ distribution ranges to undergo contractions and expansions during these periods, reflecting shifts in suitability conditions inferred from ENM. Our objective was to assess whether the phylogeographic and genetic structure in both species is distinctive and temporally consistent with what would be expected under the hypothesis of Pleistocene glacial refugia in the QHD.

2. Materials and Methods

2.1. Plant Tissue Collection and DNA Extraction

Based on georeferenced presence records of M. parkinsonii and M. perbella [1], potential collection sites were identified. Plant tissue was successfully collected from six populations of M. parkinsonii and four of M. perbella in QHD (Figure 1). Plant tissue was collected from 12 individuals (minimum separation distance of 10 m) and preserved in liquid nitrogen (SEMARNAT-DGVS Scientific Collection Permit 09/K4-0488/01/26). Individuals of both species were collected in Venado site. Genomic DNA was isolated using the AccuPrep Plant Genomic DNA Extraction Kit (Bioneer, Daejeon, Republic of Korea) according to the manufacturer’s instructions.

2.2. Primer Design and Amplification of cpDNA Regions

Specific primers for the chloroplast sequences were designed, including the accDψ pseudogene, the accD gene from the chloroplast genome, and the intergenic regions (IGs) rrn5-rrn4.5 and trnF-psbJ, as these regions exhibit a high degree of variation within the genus Mammillaria and are longer than 700 bp [27]. The design was based on the chloroplast genomes of seven species deposited in GenBank (MN517610.1, MN519716, MN517613.1, MN508963.1, MN517612.1, MN518341.1, and MN517611). Consensus sequences were obtained for each region to identify conserved regions and design the primers in silico (Table A1). The specificity of the primers was validated; they were synthesized, and the respective annealing temperatures were adjusted. Once the primers were verified to be functional, the sequences of accDψ, rrn5-rrn4.5, and trnF-psbJ were obtained from both species to analyze nucleotide variation within and between populations.
The PCR amplification reaction for the three regions was carried out in a total volume of 25 µL, containing 10 ng/µL of genomic DNA, PCR PreMix (Accu-Power), 0.25 µL of 50 mM MgCl2, 0.25 µL of 0.4% BSA, 0.5 µL of forward primer, 0.5 µL of reverse primer at a concentration of 10 pM, and 22.5 µL of sterile injectable water. Amplification conditions included an initial denaturation at 94 °C for 2 min, followed by 25 cycles of denaturation at 94 °C for 1 min; the annealing temperatures were 65.4, 66, and 65 °C for accDψ, rrn5-rrn4.5, and trnF-psbJ, respectively, for 45 s; elongation and extension were performed at 72 °C for 1 min. All reactions were performed in the T100 Thermal Cycler (Bio-Rad Laboratories, Inc., Hercules, CA, USA). The integrity of the PCR products was verified on 0.1% agarose gels and purified using SapExo (Jena BioScience, Thuringia, Germany).
The purified products were amplified in both directions using the BigDye Terminator Kit v. 3.1 (Applied Biosystems, Thermo Fisher Scientific, Vilnius, Lithuania) at the IB-UNAM Genomic Services Laboratory and Macrogen (Seoul, Republic of Korea, https://dna.macrogen.com/, accessed on 27 January 2026). Low-quality sequences were eliminated. The intergenic regions were edited using the SEQUENCHER 4.8 software (Genes Codes Corporation, Ann Arbor, MI, USA) [28], aligned using the MUSCLE algorithm [29], manually reviewed, and edited using BioEdit 7.1.1 [30] and MEGA12 [31]. Subsequently, the sequences of the three regions were concatenated using MEGA12.

2.3. Amplification of nDNA ISSRs

We used interspersed simple sequence repeat (ISSR) markers to determine the multilocus genotype from genomic DNA and to assess the genetic variation and structure of both species. ISSRs are DNA segments flanked at both ends by microsatellite sequences, uncovering polymorphisms across many loci and providing both reproducibility and comprehensive genome coverage [32]. These dominant markers focus on variations in segment length and are effective for identifying mutations in small or localized populations. ISSR, with its ease of application and cost-effectiveness, makes studies on genetic variation more accessible to less-funded projects [33]. ISSR markers have been used to study genetic variation and structure in several Agave genera from Mexican arid lands [34].
Ten primers designed at the University of British Columbia (UBC series) were used for the amplifications, which produce well-defined, discrete and reproducible bands (Table A2). The loci were amplified by PCR in a total volume of 12.5 µL, which contained 0.0625 µL of GoTaq DNA Polymerase 5X (Promega, Madison, WI, USA), 1 µL of genomic DNA (≈10 ng/µL), 0.5 µL of 10 mM primer, 0.5 µL of 50 mM MgCl2, 2.5 µL of 5X Colorless GoTaq buffer, 0.25 µL of 10 mM dNTPs (New England BioLabs, Ipswich, MA, USA), and 7.68 µL of water. The thermocycler program consisted of an initial denaturation at 92 °C for 7 min, followed by 35 cycles of 92 °C for 50 s, the specific hybridization temperature for each primer for 45 s, and 72 °C for 1 min, with a final extension at 72 °C for 1 min. The amplification products were separated by electrophoresis in 2% agarose gels with TBE buffer and stained with 2X GelRed®. The bands were visualized on the Chemi-Doc (BioRad, Hercules, CA, USA) photodocumenter and interpreted as binary data indicating the presence (1) or absence (0) of bands of a particular size. Individuals that did not show consistent amplification were excluded from the analysis.

2.4. Statistical Analysis

2.4.1. cpDNA Genetic Diversity and Haplotype Networks

For both species, intraspecific genetic variation was estimated using the three concatenated sequences. Nucleotide diversity (π); number of haplotypes (h); haplotype diversity (Hd), without considering gaps; and the genetic differentiation coefficient (GST) were estimated using the dnaSP 6.0 software [35]. Maps showing the spatial distribution of haplotype frequencies were created in RStudio 4.5.3 [36]. Based on the haplotype sequences, a haplotype network was constructed to visualize their relationships and geographic distribution using the Network 10.2.0.0 [37] software with the default Median-joining parameters.
Population Structure and Neutrality Tests
Interpopulation genetic differentiation (GST) was estimated, and Tajima’s D and Fu’s Fs neutrality tests were conducted to detect deviations from neutrality associated with population expansion or contraction using dnaSP6 [35]. Negative and significant values of Tajima’s D and Fu’s Fs indicate an excess of low-frequency variants and are commonly interpreted as evidence of recent population expansion following bottleneck or founder events, although they may also result from purifying selection or recent selective sweeps. In contrast, positive and significant values may be explained by population structure (the Wahlund effect), recent population bottlenecks, or balancing selection [38].
Divergence Times Estimation
To determine whether the divergence ages of the haplotypes of M. parkinsonii and M. perbella were temporally consistent with the last Pleistocene glacial cycle, a calibrated haplotype tree was constructed in two stages. In the first stage, we estimated the age of origin of our species of interest based on a sequence matrix of the accDψ and trnF-psbJ regions, which was constructed using M. parkinsonii and M. perbella along with 53 members of the Cacteae clade [3]. The chloroplast reads for each species in the Cacteae clade were obtained from GeneBank (SRA; Sequence Read Archive), which are associated with BioProject PRJNA671701 [39] and BioProject PRJNA934337 [3] (Table A3). The chloroplast reads were quality-filtered using TrimGalore version 0.4.3 [40]. From the filtered reads, Biopython [41] was used to map the accDψ and trnF-psbJ regions. The sequences were aligned using MAFFT v7.453 [42] and subsequently concatenated using AMAS [43], partitioning the final matrix by region.
Based on this matrix, a maximum likelihood (ML) tree was constructed, with Lophophora williamsii and Acharagma roseanum used as the outgroup. The ModelFinder Plus+Merge function was used to find the best substitution model and the optimal number of partitions, and the substitution model was estimated in IQTree2 v2.1.4-beta [44]. Based on this tree, divergence times were estimated in BEAST 2.5 [45]. The input file was constructed in Beauti, specifying a partitioned matrix, the GTR substitution model, an average clock rate of 1 × 10⁻⁹ substitutions per site per year [46], and the Yule birth–death speciation model. The priors included a relaxed lognormal clock and secondary calibration ages for the clades Cacteae (11.94 [8.33–17.27] Ma) and Core Mammilloyd (7.3 [4.86–10.63] Ma) [2]. The Markov Chain Monte Carlo (MCMC) run was set to 50 × 106 generations, with a sampling frequency of 5000 generations, resulting in 10,000 trees. The log files were reviewed in Tracer 1.7.2 [47] to confirm an effective sample size (ESS) > 200 for all parameters, as well as the convergence of the chains toward a stationary distribution. The first 2000 trees were discarded as burn-in, and the remainder were summarized into a single maximum-clade-credibility tree (MCCT) using Tree-Annotator v. 2.7.7 [48]. This tree includes the posterior probability (pp) of the clades, as well as the mean divergence times and the highest posterior density (95% HPD). The tree was visualized and edited in FigTree v. 1.4.4 [49].
In the second stage, the matrix comprising the accDψ and trnF-psbJ regions of the haplotypes from M. parkinsonii and M. perbella and their sister group derived in the first stage was used. A procedure similar to that described above was followed. The ML tree and the substitution model were estimated. The Beauti input file specifications included a partitioned matrix, the GTR substitution model, a relaxed lognormal clock, and the coalescent model with constant population growth. To calibrate the tree root, we used the age of divergence of the M. parkinsoniiM. perbella clade and its sister clade, which had been previously obtained. The MCMC was specified in the same way as in the previous step. An effective sample size (ESS) > 200 was confirmed, as well as the convergence of the chains. The MCCT was obtained, including the divergence times between haplotypes and the p-values of the nodes.

2.4.2. ISSR Genetic Diversity and Population Structure

For each species, the percentage of polymorphic loci (PPL) and the average expected genetic diversity (He) across all loci were estimated using Nei’s index [50], assuming Hardy–Weinberg equilibrium. Additionally, the Shannon diversity index (HS) was calculated to estimate genetic variation within each population.
A Molecular Analysis of Variance (AMOVA) was performed to estimate the distribution of genetic variation between and within populations of each species. Statistical significance was assessed using 999 permutations. The ΦST statistic, analogous to the FST for dominant markers [51], is reported as a measure of global differentiation. To examine the relationship between genetic differentiation and geographic distance, a Mantel test [52] was performed with 999 permutations, using geographic distance in kilometers calculated with the Haversine formula. In addition, Nei’s (1972) [53] genetic distances were calculated to construct a dendrogram and assess the degree of genetic differentiation between pairs of populations.
To visualize the spatial relationships between individuals and populations, a Principal Coordinate Analysis (PCoA) was performed based on Hamming distances [54], calculated using the ‘bitwise.dist’ function. All analyses were performed using the ade4 [55], adegenet 2.1.11 [56], ape 5.8-1 [57], poppr 2.9.8 [58], and ggplot2 [59] packages in the R environment [36].

2.4.3. Paleodistribution Modelling

In central Mexico, around the Trans-Mexican Volcanic Belt, temperatures fell by ~5 °C during the LGM and humidity was lower than it is today [60]. Meanwhile, during the Holocene Optimum, warm and humid conditions are reported in the southern part of the Chihuahuan Desert [61]. In line with the above, the Pleistocene glacial refuge hypothesis posits that the range of M. parkinsonii and M. perbella contracted during the Glacial period and subsequently expanded during the Holocene. This hypothesis was tested through ecological niche modeling, using the maximum entropy algorithm in MaxEnt v3.4.3 [62]. Given the limited number of occurrence records, together with the close phylogenetic relationship and overlapping distributions of the two species within the Querétaro–Hidalgo Desert (QHD), we assumed climatic niche conservatism between them and, following Castaño-Quintero et al. (2020) [63], modeled their climatic niche at a supraspecific level by combining occurrence records from both species.
To model the distribution of the species, 21 validated records of M. parkinsonii and 19 of M. perbella were used, obtained from the Cactaceae database for North and Central America [19] and from field surveys (Table S1). Current climate variables were obtained based on the Community Climate System Model (CCSM-4) general circulation model, with a spatial resolution of 30 arcseconds, approximately 900 m/pixel (http://www.worldclim.org, accessed on 21 January 2026) [64]. To reduce collinearity among the climate variables, a Pearson correlation analysis was conducted to select the least correlated variables (r < 0.85) that showed the greatest contribution to model development in the exploratory analyses. The variables used to perform the distribution model were BIO12: Annual Precipitation; BIO13: Precipitation of the Wettest Month; BIO16: Precipitation of the Wettest Quarter; and BIO19: Precipitation of the Coldest Quarter.
The potential distribution was modeled in MaxEnt using a regularization multiplier of 1 and including linear, quadratic, and hinge (LQH) features, which are appropriate for the 40 occurrence records available for the species [62]. From the total data, 75% of the occurrence records were used for model training and the remaining 25% for model testing. Model performance was evaluated using 20 bootstrap replicates. A maximum of 10,000 background points was used, and the minimum training presence threshold was applied to convert continuous suitability predictions into presence–absence maps. The model for the present conditions was validated by calculating the area under the receiver operating characteristic curve (AUROCC).
Subsequently, to assess changes in the potential distribution area during the Pleistocene and to identify areas of climatic stability, the ecological niche model was projected onto past climatic conditions. Areas of climatic stability were defined as regions predicted to provide suitable climatic conditions for the species across all modeled time periods (e.g., Carnaval et al., 2009) [65]. We used the palaeoclimate dataset simulated by the Community Climate System Model (CCSM-4) Glacial simulation, at a resolution of 30 arcs for the Last Interglacial (LIG; 120–140 kya), LGM (around 22 kya), and Mid-Holocene Climatic Optimum (MH; around 6 kya) [64].

3. Results

3.1. Genetic Diversity and Structure Using cpDNA Markers

All three sequences were successfully amplified in 57 and 37 individuals from M. parkinsonii and M. perbella respectively (Table 1). The length of the concatenated sequences was 2575 for M. parkinsonii and 2448 bp for M. perbella. A total of three polymorphic sites were detected in M. parkinsonii and 25 in M. perbella. Mammillaria parkinsonii exhibited low nucleotide diversity π = 0.0004, three haplotypes (h = 3), and haplotype diversity Hd = 0.509. The six populations of this species consisted of a single haplotype, and, thus, had zero values for both π and Hd (Table 1). Mammillaria perbella showed, at the species level, a nucleotide diversity value of π = 0.0044, h = 7, and Hd = 0.815, whereas within its populations, the ranges of values were π = 0 to 0.00049, h = 1 to 3, and Hd = 0.0 to 0.5 (Table 1 and Table A4).
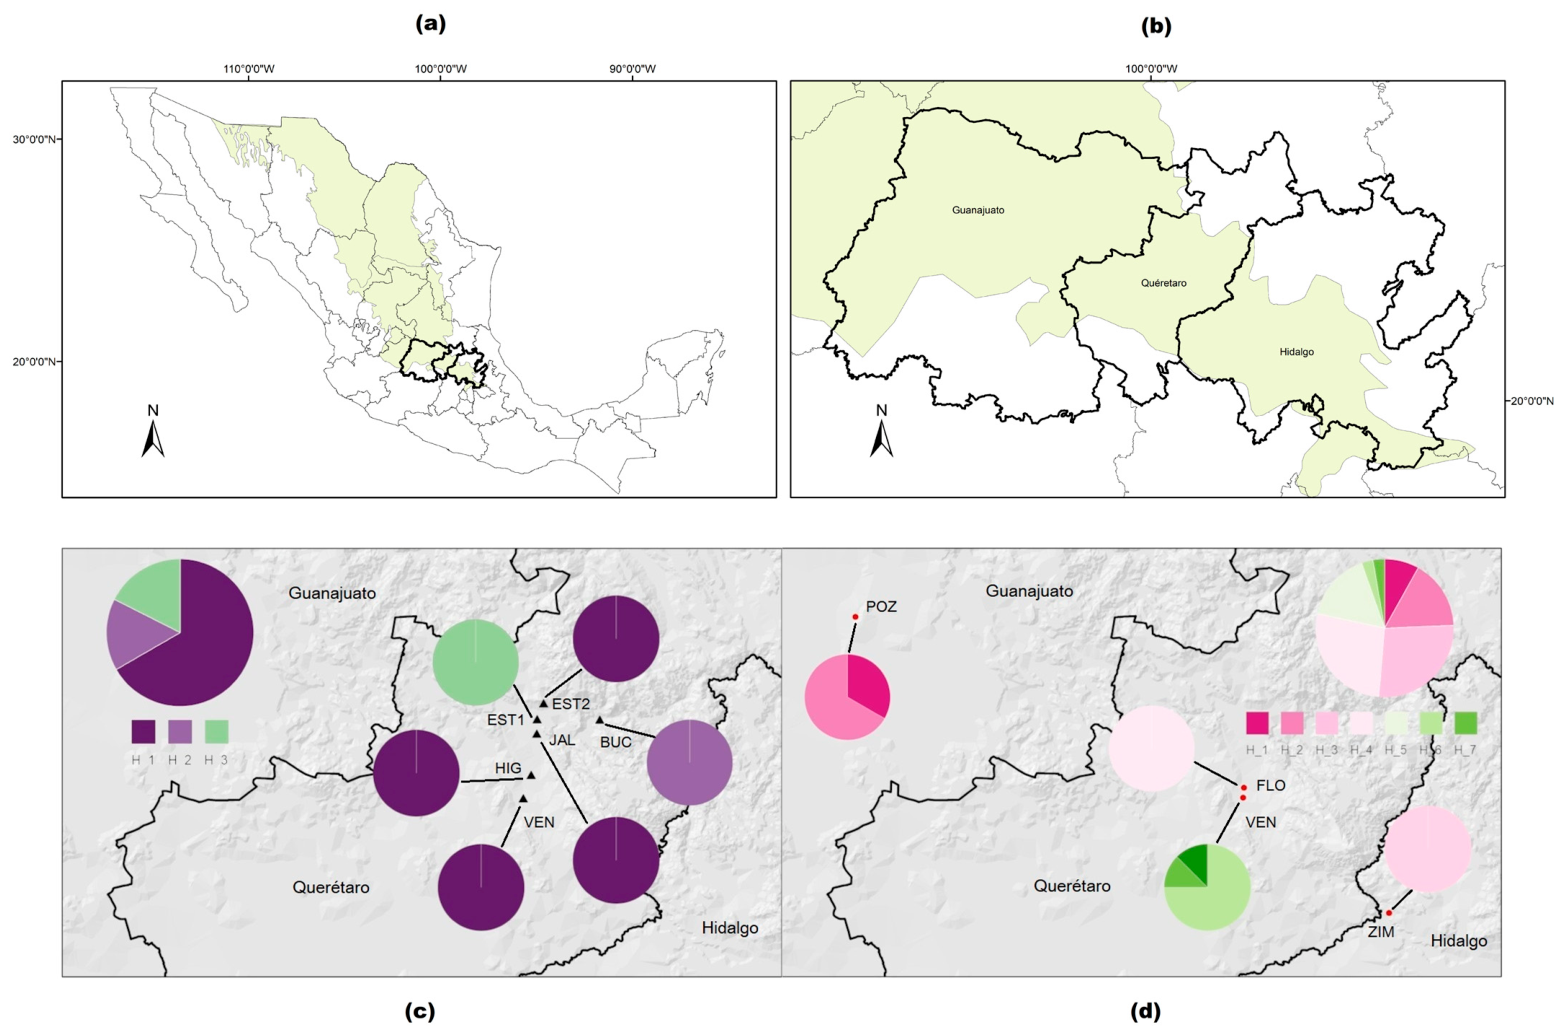
Based on the specific distribution of haplotype frequencies, M. parkinsonii exhibited a fixed haplotype in each population: haplotype H_1 was fixed in HIG, JAL, EST2, and VEN, while haplotypes H_3 and H_2 were fixed in EST1 and BUC, respectively (Figure 1c). Regarding M. perbella, haplotypes H_1 and H_2 were found in the POZ population; both ZIM and FLO showed a single haplotype (H_3 and H_4, respectively), while the VEN population stands out for the presence of three haplotypes: H_5, H_6, and H_7 (Figure 1d).
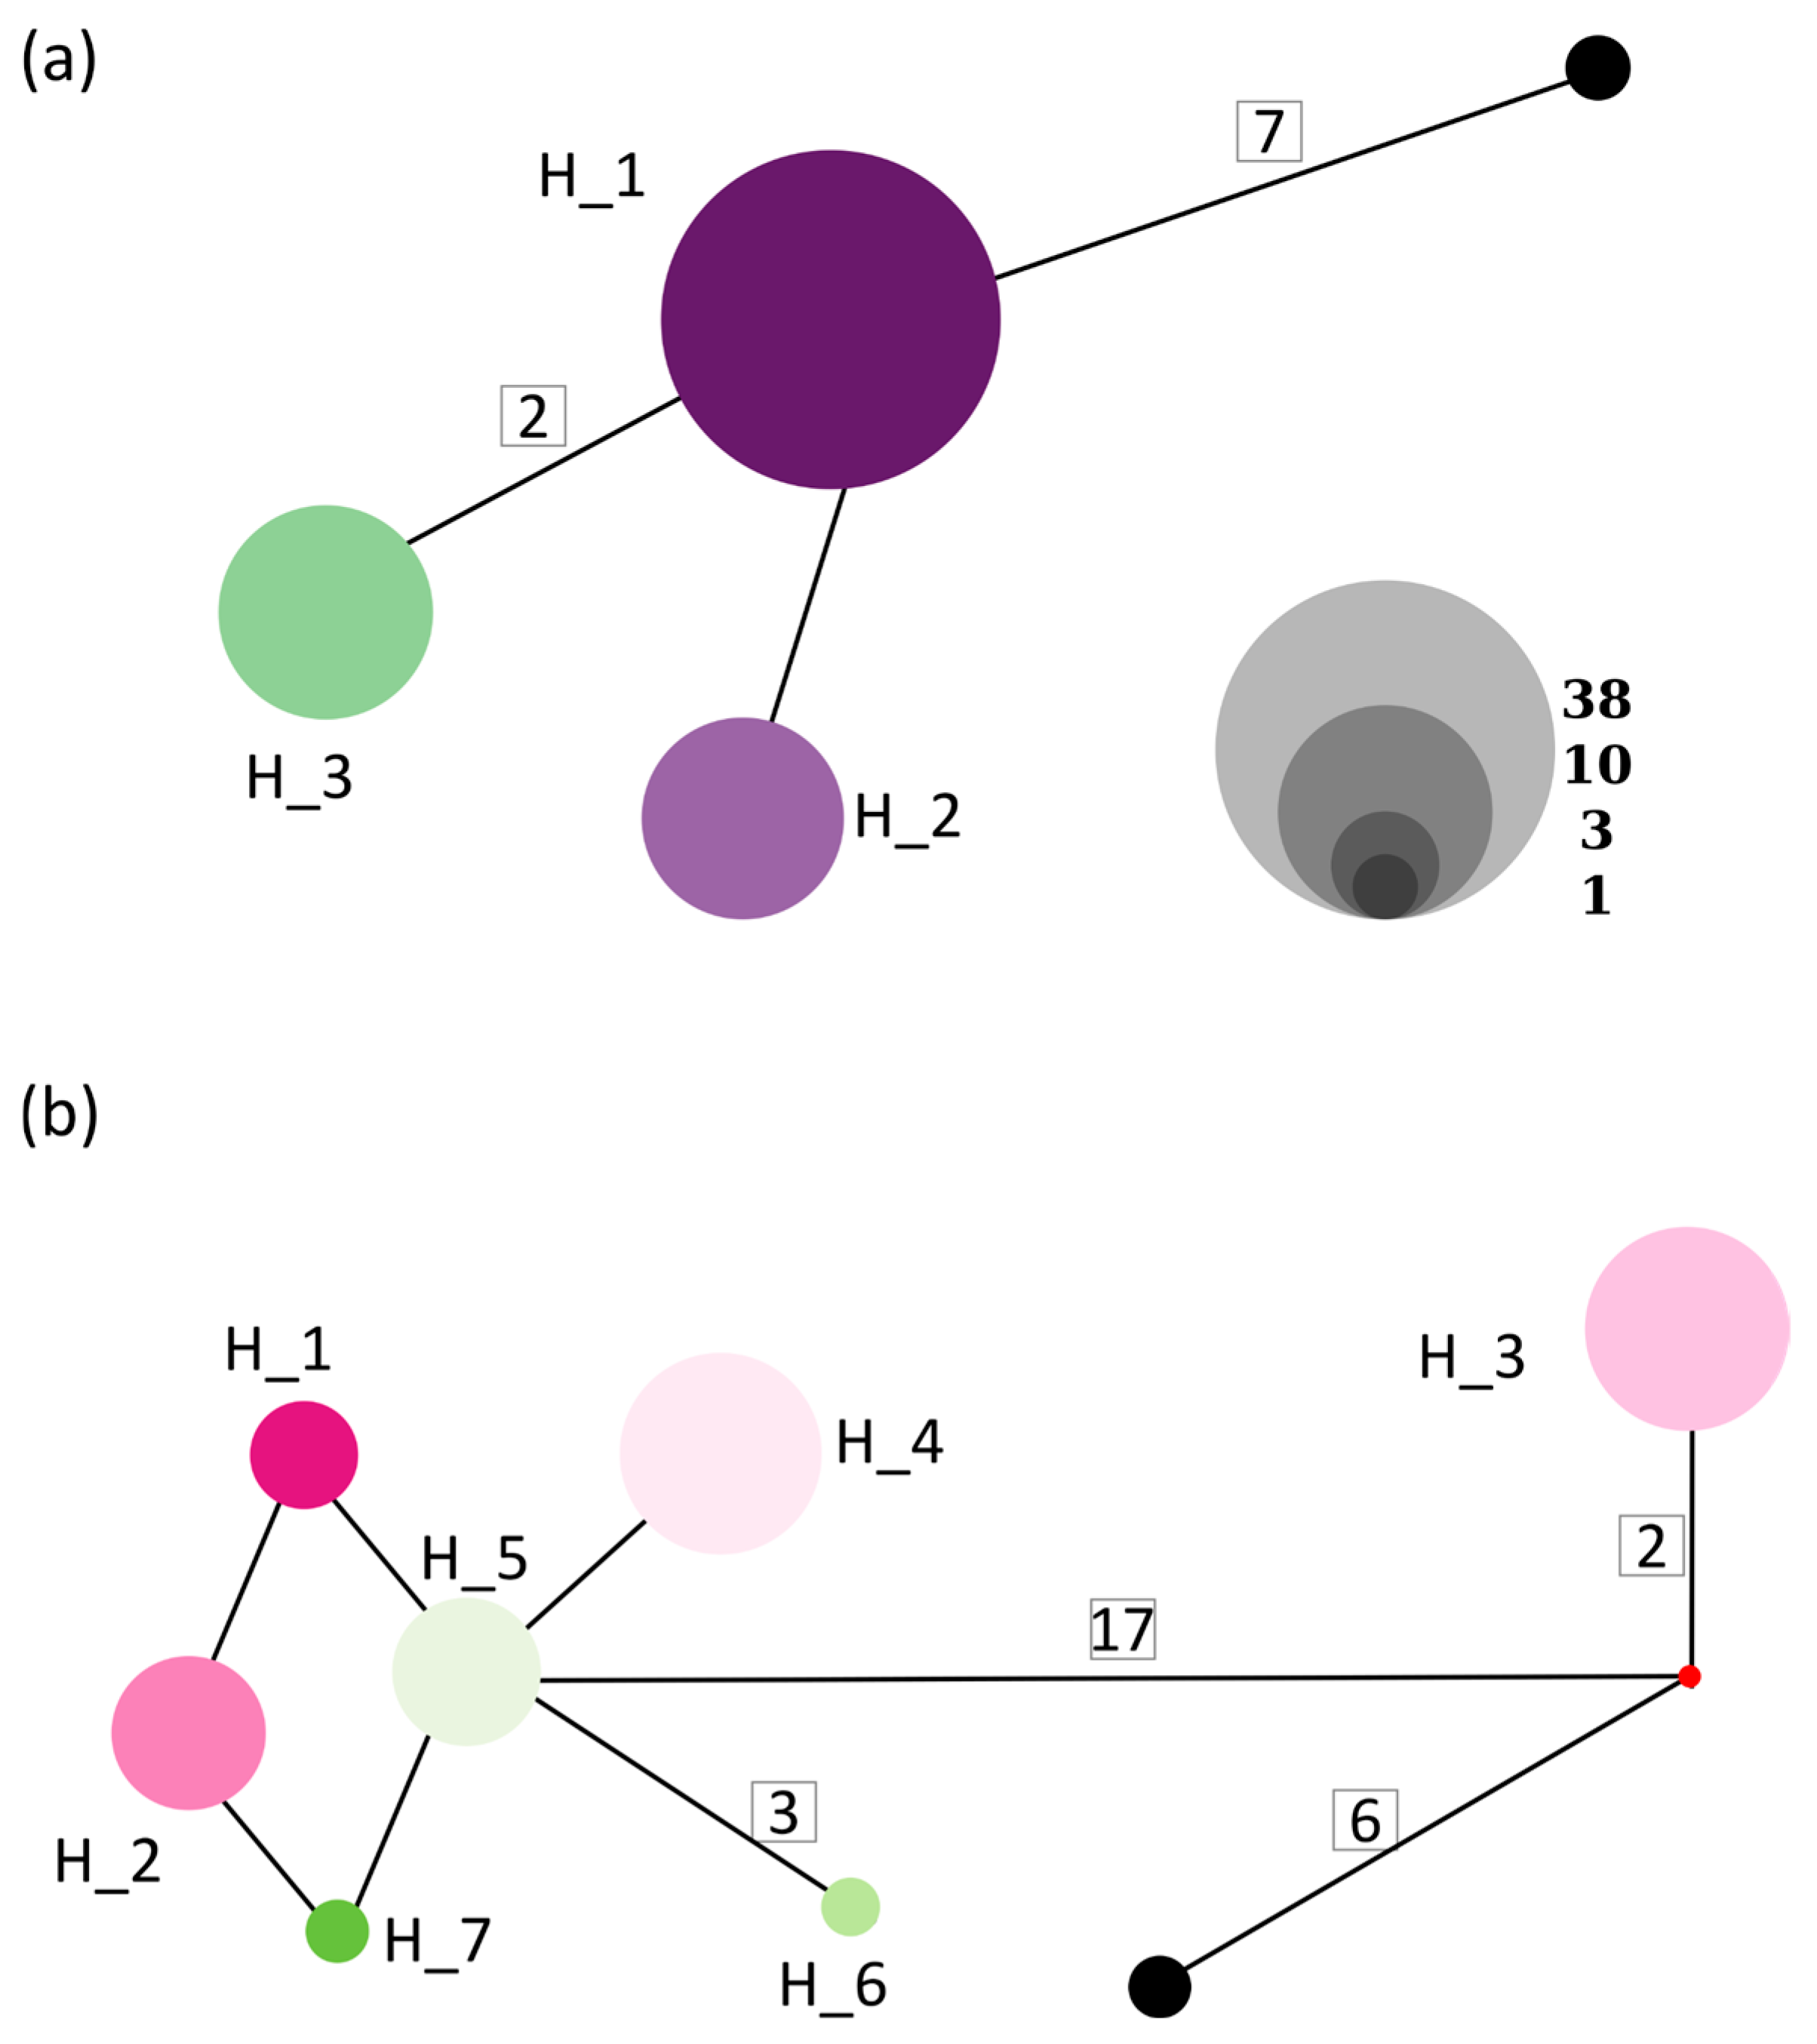
The haplotype network for M. parkinsonii showed that the haplotype H_1 is the most frequent (38), present in the EST2, HIG, JAL and VEN populations, which are located in the north and center of the distribution range. In contrast, haplotype H_2 was found only in BUC, whereas H_3 was found in EST1 (Figure 2a). In M. perbella, the haplotype H_3 showed the highest number of mutational steps (17) and is found in the east (ZIM); this haplotype is linked to haplotype H_5 observed in the central population (VEN). Haplotype H_5 is linked to H_6 (VEN), H_7 (VEN) and H_4 (FLO), which are also situated in the center. Haplotype H_2 (POZ), to the west of the distribution range, is connected to H_1 (POZ) and H_7 (Figure 2b).

3.2. Population Genetic Structure and Neutrality Tests

At the species level, genetic differentiation was high in both M. parkinsonii and M. perbella. In the former, the overall value was GST = 1, indicating complete interpopulation differentiation, while in the latter, the value was GST = 0.722, reflecting strong subdivision, as most of the variation is due to differences between populations. The effective number of migrants is zero in M. parkinsonii (Nm = 0) and close to zero in M. perbella (Nm = 0.19), whereas the neutrality tests, at the species level, were positive but not significant in both species (Table 1).

3.3. Haplotype Divergence Times

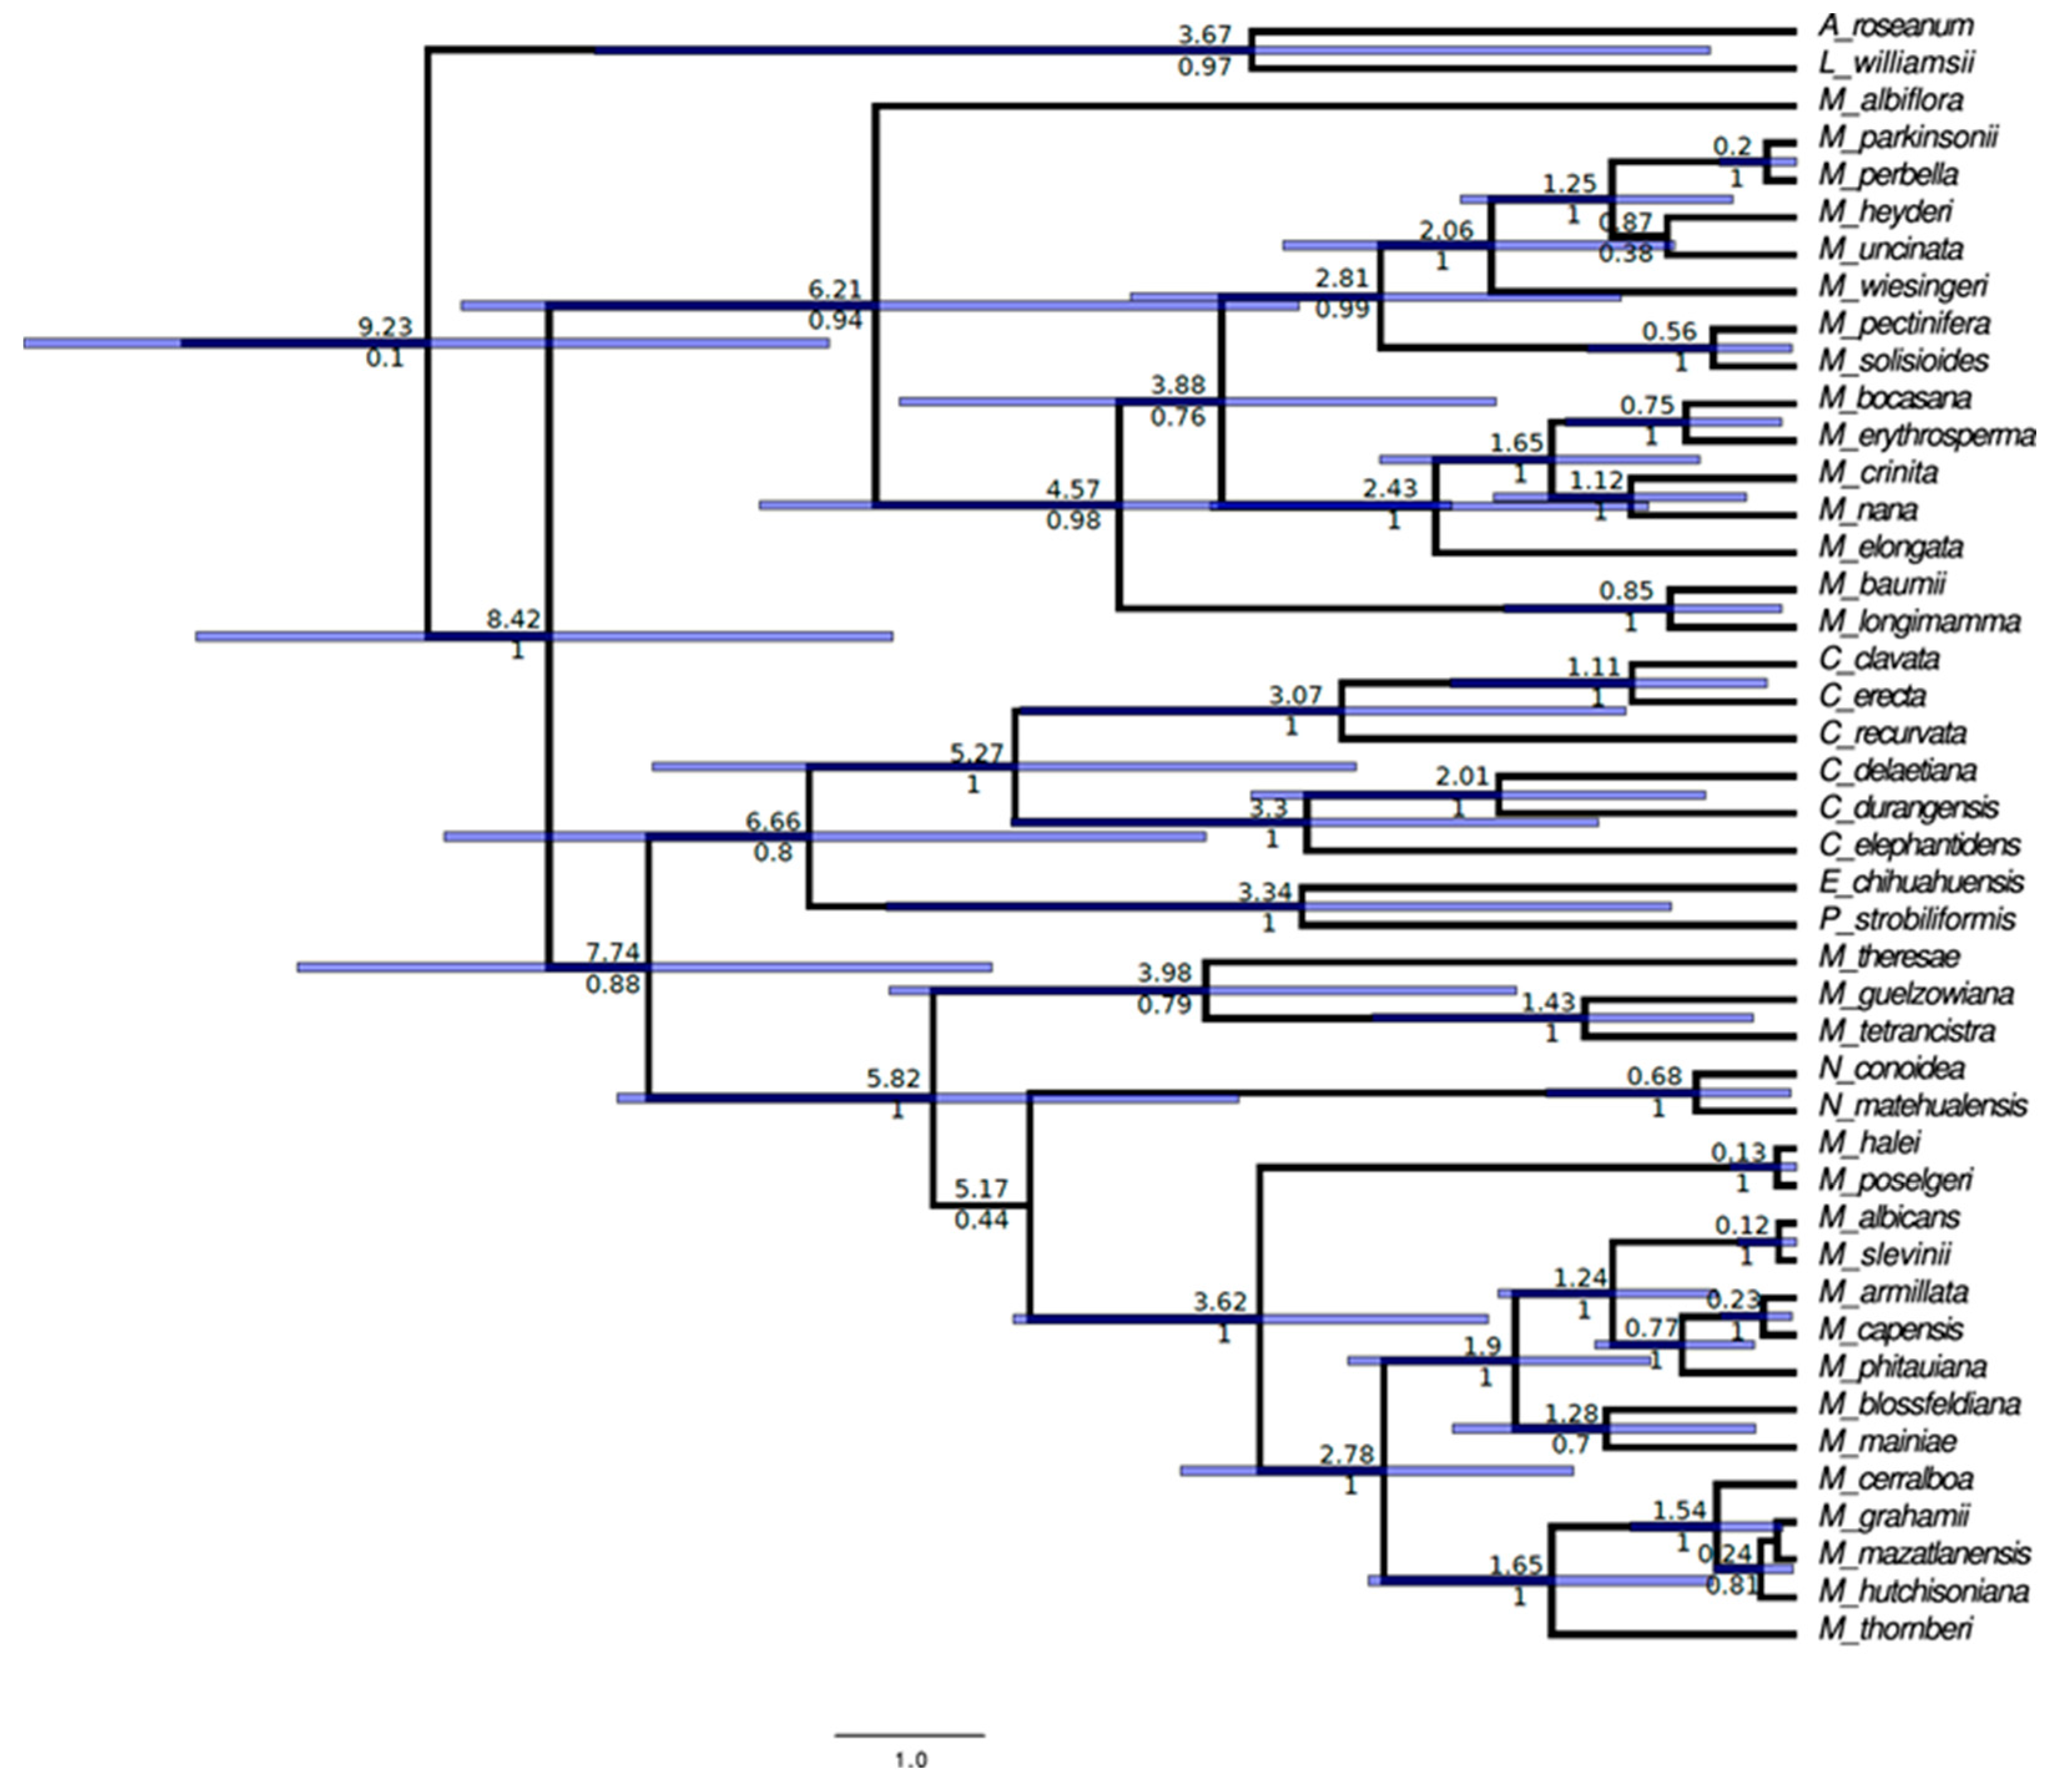
The phylogenetic tree of the Mammilloide clade obtained was generally consistent in terms of topology and estimated divergence times with those reported by Chincoya et al. (2023) [3]. Mammillaria parkinsonii and M. perbella formed a clade that merged with the clade comprising M. heyderi and M. uncinata; these clades diverged approximately 1.25 Mya (0.4–2.6 Mya; PP = 1) during the early Pleistocene (Figure A1). This estimated age, along with the 95% HPD intervals, was used to calibrate the ages of the haplotypes.
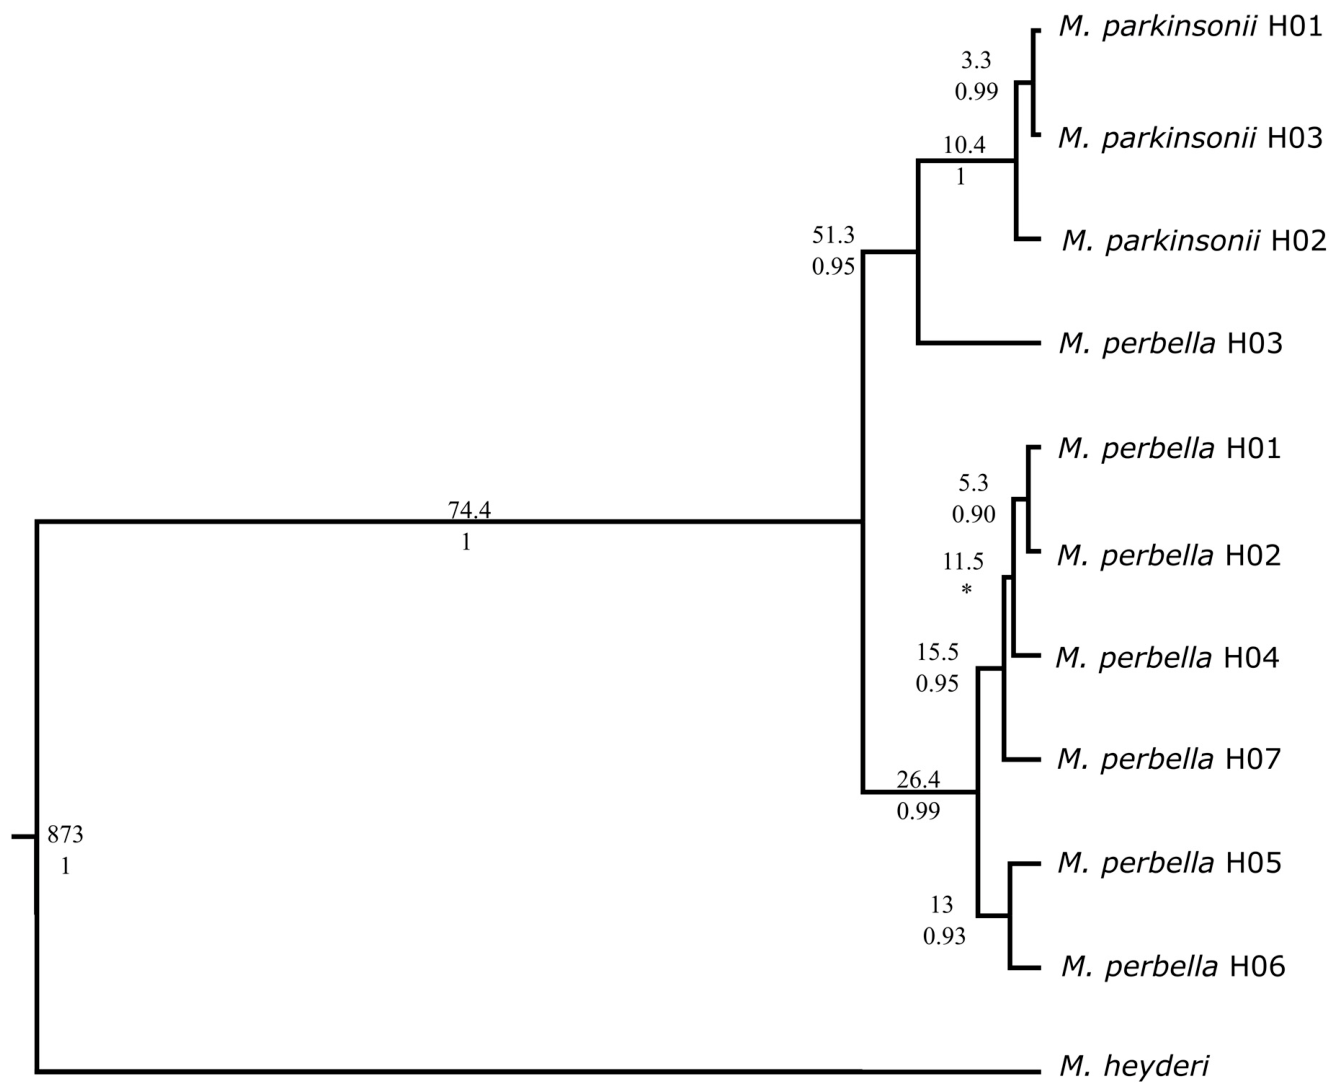
The calibrated haplotype phylogeny indicates that M. heyderi diverged from M. parkinsonii and M. perbella approximately 873 kya (0.0003–1.874, PP = 1; Figure 3), within the previously estimated age range (1.25, 0.4–2.6 Mya). Meanwhile, the haplotypes of M. parkinsonii and M. perbella diverged 74.4 kya (0–0.178, PP = 1). It is noteworthy that, in M. perbella, haplotype H03 forms part of the M. parkinsonii clade, and that the two diverged 51.3 kya, during the Last Glacial. Most of the haplotypes of M. perbella diverged during the Last Glacial. The clade comprising haplotypes H05 and H06 from the center (VEN) diverged from the rest approximately 26.4 kya. Three subsequent divergence events were inferred: between H07 (VEN) and H04 (FLO), approximately 15.5 kya; between H04 and H01–H02 (POZ), at the beginning of the Holocene, 11.5 thousand years ago; and between haplotypes H01 and H02, in the middle of the Holocene, approximately 5.3 kya. The divergence of M. parkinsonii haplotypes occurred during the Holocene; haplotype H02 from the eastern BUC population diverged from H03–H01 approximately 10.4 kya, and these latter two haplotypes diverged 3.3 kya.
Figure 3. Estimated timeline for the haplotypes of M. parkinsonii and M. perbella. The maximum-likelihood trees are shown, with divergence times in thousands of years (above the branches) and posterior probability (below the branches). * PP < 0.5.
Diversity 18 00509 g003

3.4. Genetic Diversity and Structure Using ISSR Markers

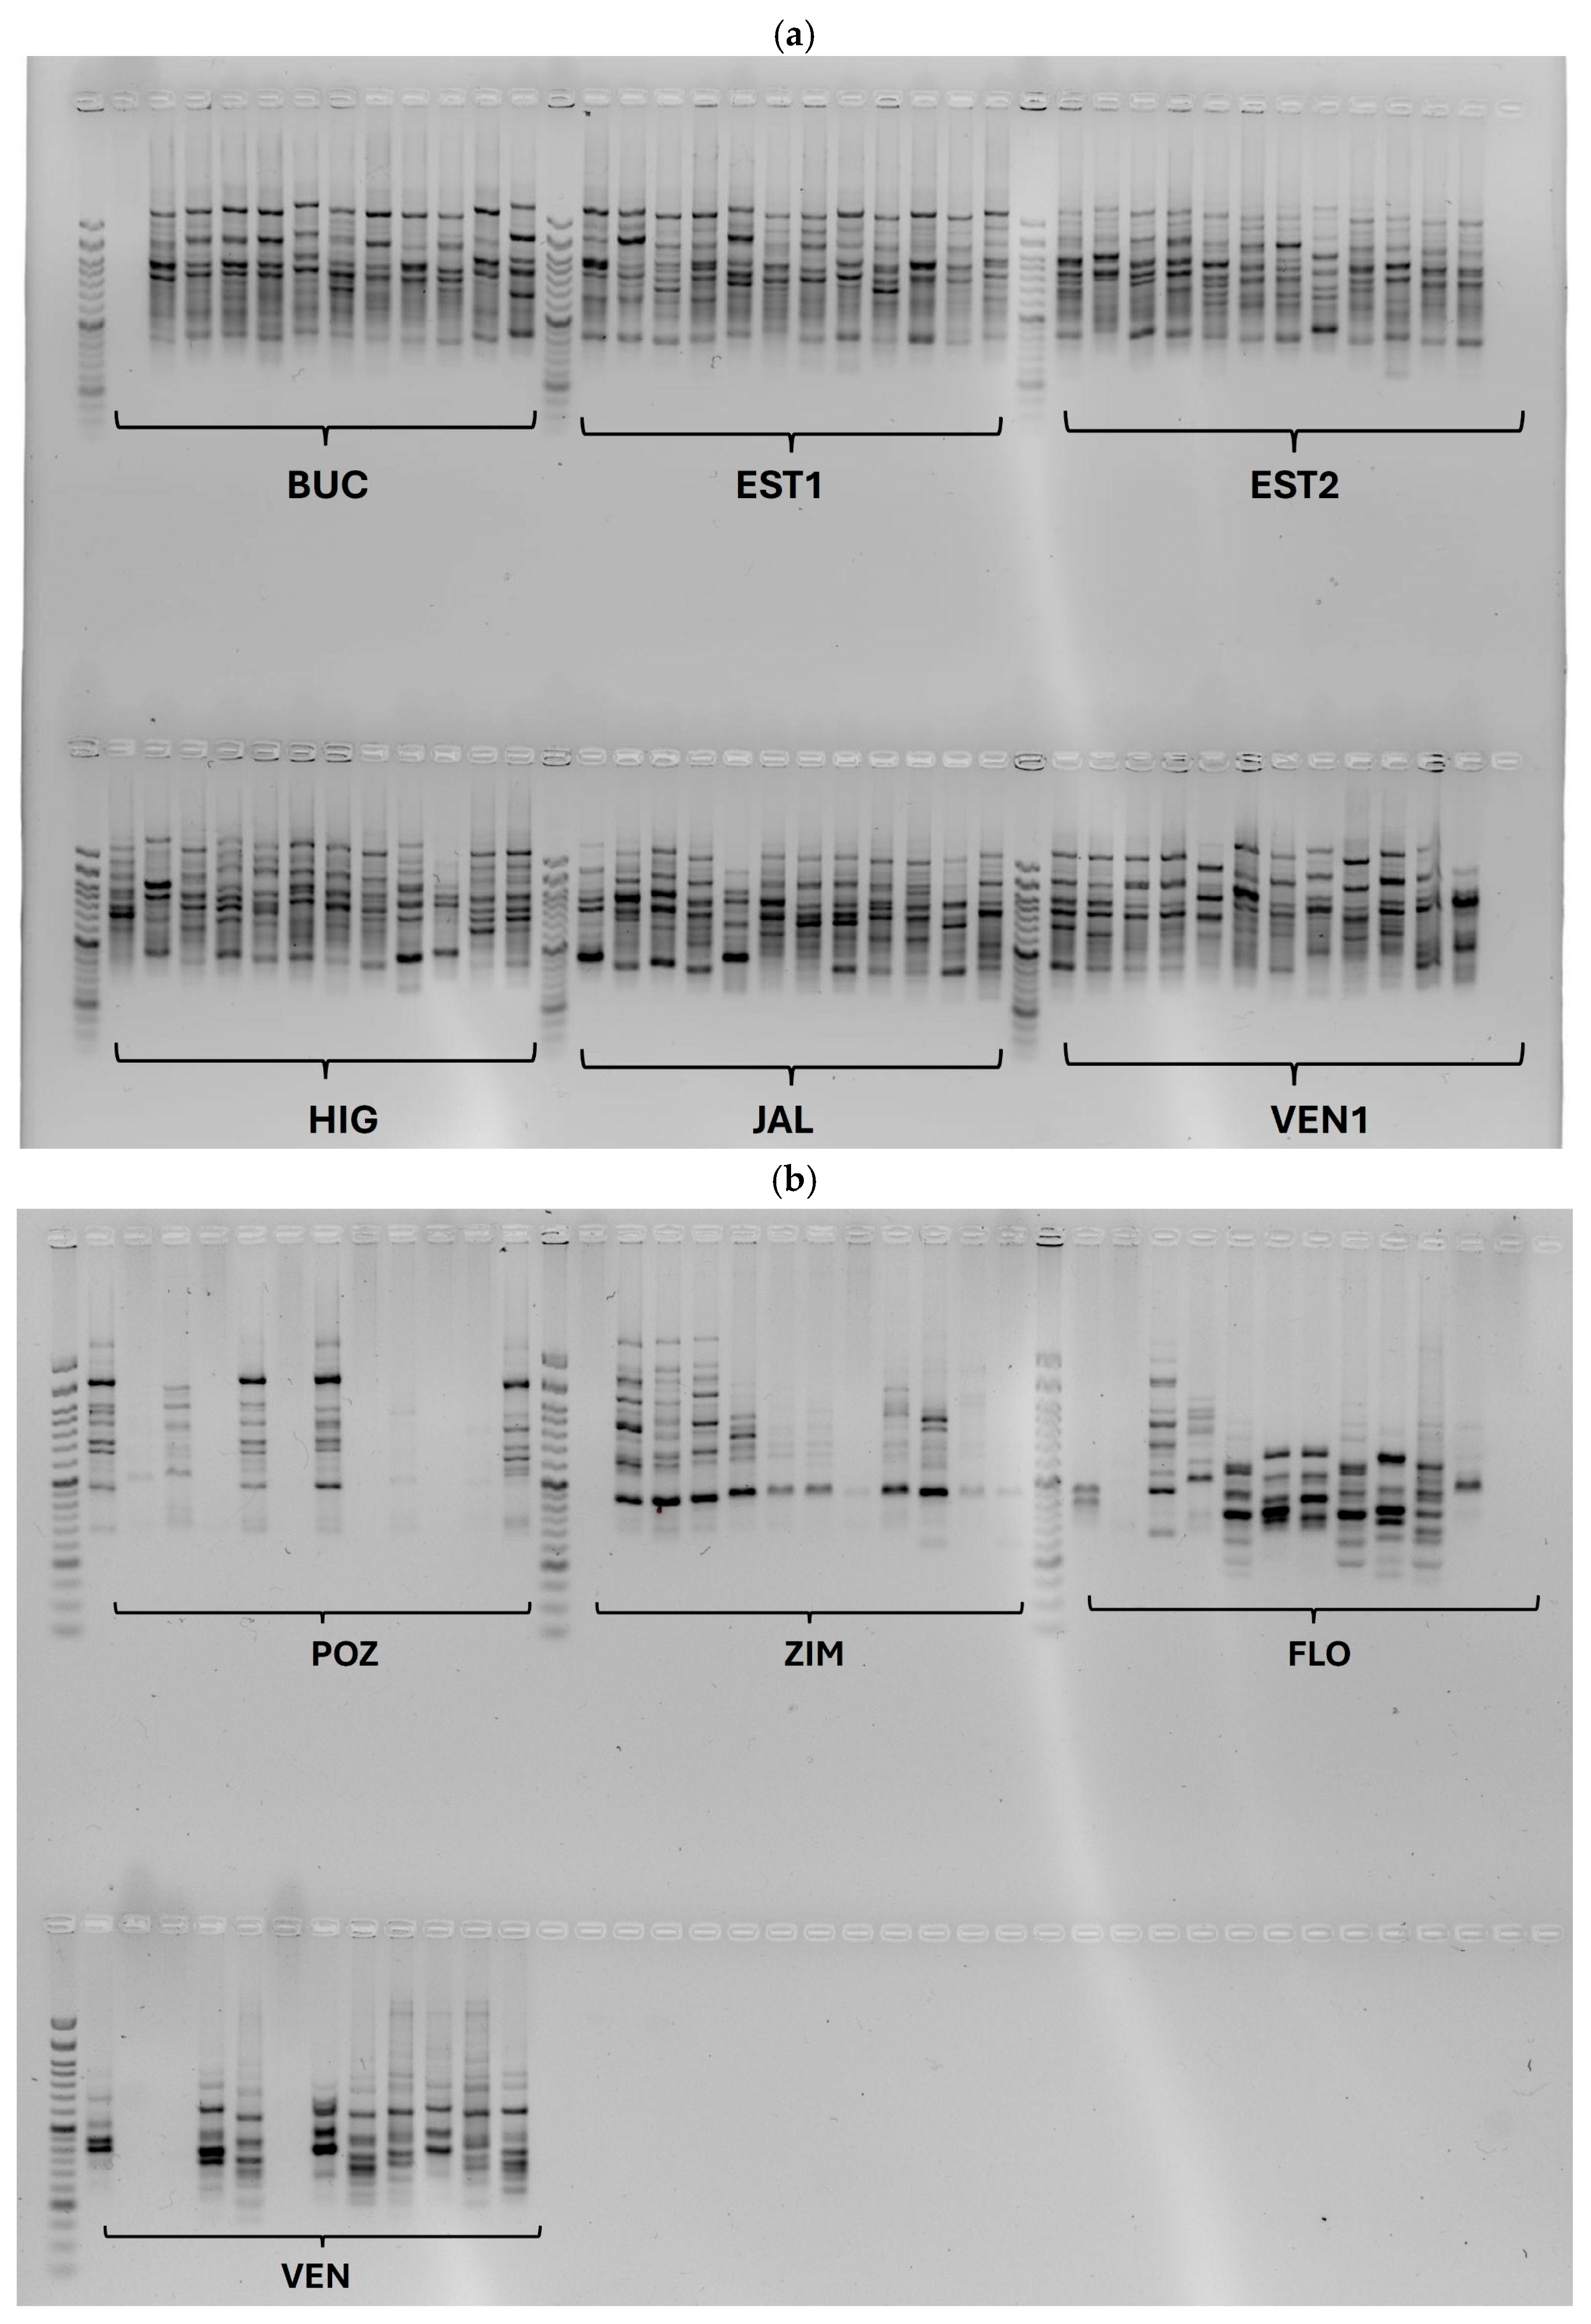
Banding patterns were obtained from 72 individuals of M. parkinsonii and 43 of M. perbella (Table 2). All loci evaluated were polymorphic for the 10 ISSR markers analyzed for each species (Figure A2). Individuals that did not show consistent amplification were excluded from the analysis. Table 2 shows the genetic diversity indices obtained from 167 polymorphic loci. In general, both species exhibited moderate levels of genetic diversity, although the values for M. parkinsonii were slightly higher than those for M. perbella. In M. parkinsonii, the average PPL ranged from 68.21% to 78.81%, while the average Nei’s diversity was 0.303 (I = 0.266–0.326). The EST1, HIG, and JAL populations exhibited the highest diversity values (He = 0.326, 0.314, and 0.314, respectively). In M. perbella, the average PPL ranged from 49.36% to 71.79%, with an average Nei diversity of 0.279 (0.255–0.300). The FLO population exhibited the highest genetic diversity (He = 0.300), while VEN showed the lowest values (He = 0.255, PPL = 49.36%). The estimation of diversity using the Shannon index showed a similar trend to He in both species (Table 1), in that genetic diversity was moderate, although higher in M. parkinsonii (HS = 0.362–0.434) compared to M. perbella (HS = 0.293–0.400).
AMOVA revealed significant genetic structure in both species (Table 3). Although the percentage of genetic variation within the populations was high in both M. parkinsonii and M. perbella (62.15% and 60.43%, respectively), overall differentiation was high and significant (ΦST = 0.378 and 0.3957, respectively), and very low gene flow was inferred in both species (Nm < 0.42), indicating that genetic drift has played a major role in the genetic structure of both species.
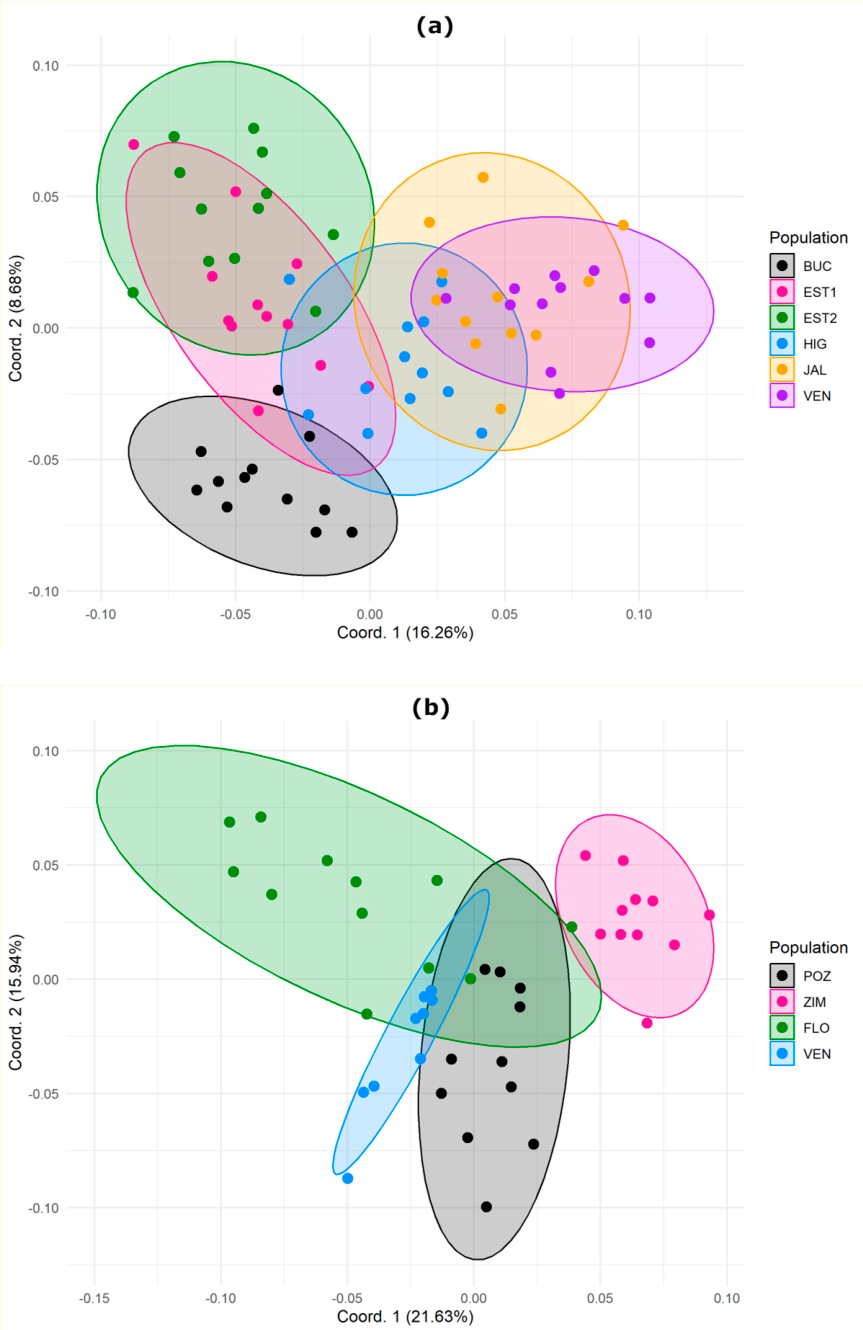
The PCoA revealed a marked structure within the species. In M. parkinsonii, the coordinates explain 24.94% of the variation; on coordinate 1 (16.26%), individuals from BUC are concentrated in the lower left quadrant and differ from the rest of the groups consisting of EST1, HIG, JAL, and VEN (Figure 4a). However, the last three populations, which are geographically closer, show the greatest overlap among themselves. Coordinate 2 (8.86%) reaffirms the pattern of differences between BUC and the other populations, particularly with EST1 and EST2. Regarding M. perbella, the first two coordinates explain 21.45% and 15.88% of the total variance. On coordinate 1, ZIM forms an independent cluster clearly separated from the rest of the populations, suggesting greater genetic distance. Populations POZ, FLO, and VEN show greater overlap among themselves on coordinate 2 (Figure 4b). In other words, the geographically isolated populations—BUC in the case of M. parkinsonii and ZIM in M. perbella—exhibited the greatest genetic distance in the multivariate space. Finally, the Mantel test obtained for M. parkinsonii (r = 0.445, p = 0.058) and M. perbella (r = 0.322, p = 0.292) did not reveal a pattern of distance-based isolation in either species. It should be noted that this analysis was also performed using chloroplast sequences, yielding the same results in M. parkinsonii (r = −0.1008, p = 0.5) and M. perbella (r = 0.375, p = 0.292).

3.5. Paleodistribution

The ecological niche models for M. parkinsonii and M. perbella performed well using the presence data and the selected climatic variables. Across all 20 bootstrap replicates, we found AUC values = 0.98 (sd = 0.023), indicating that the final model had high predictive accuracy for the species’ current distribution.
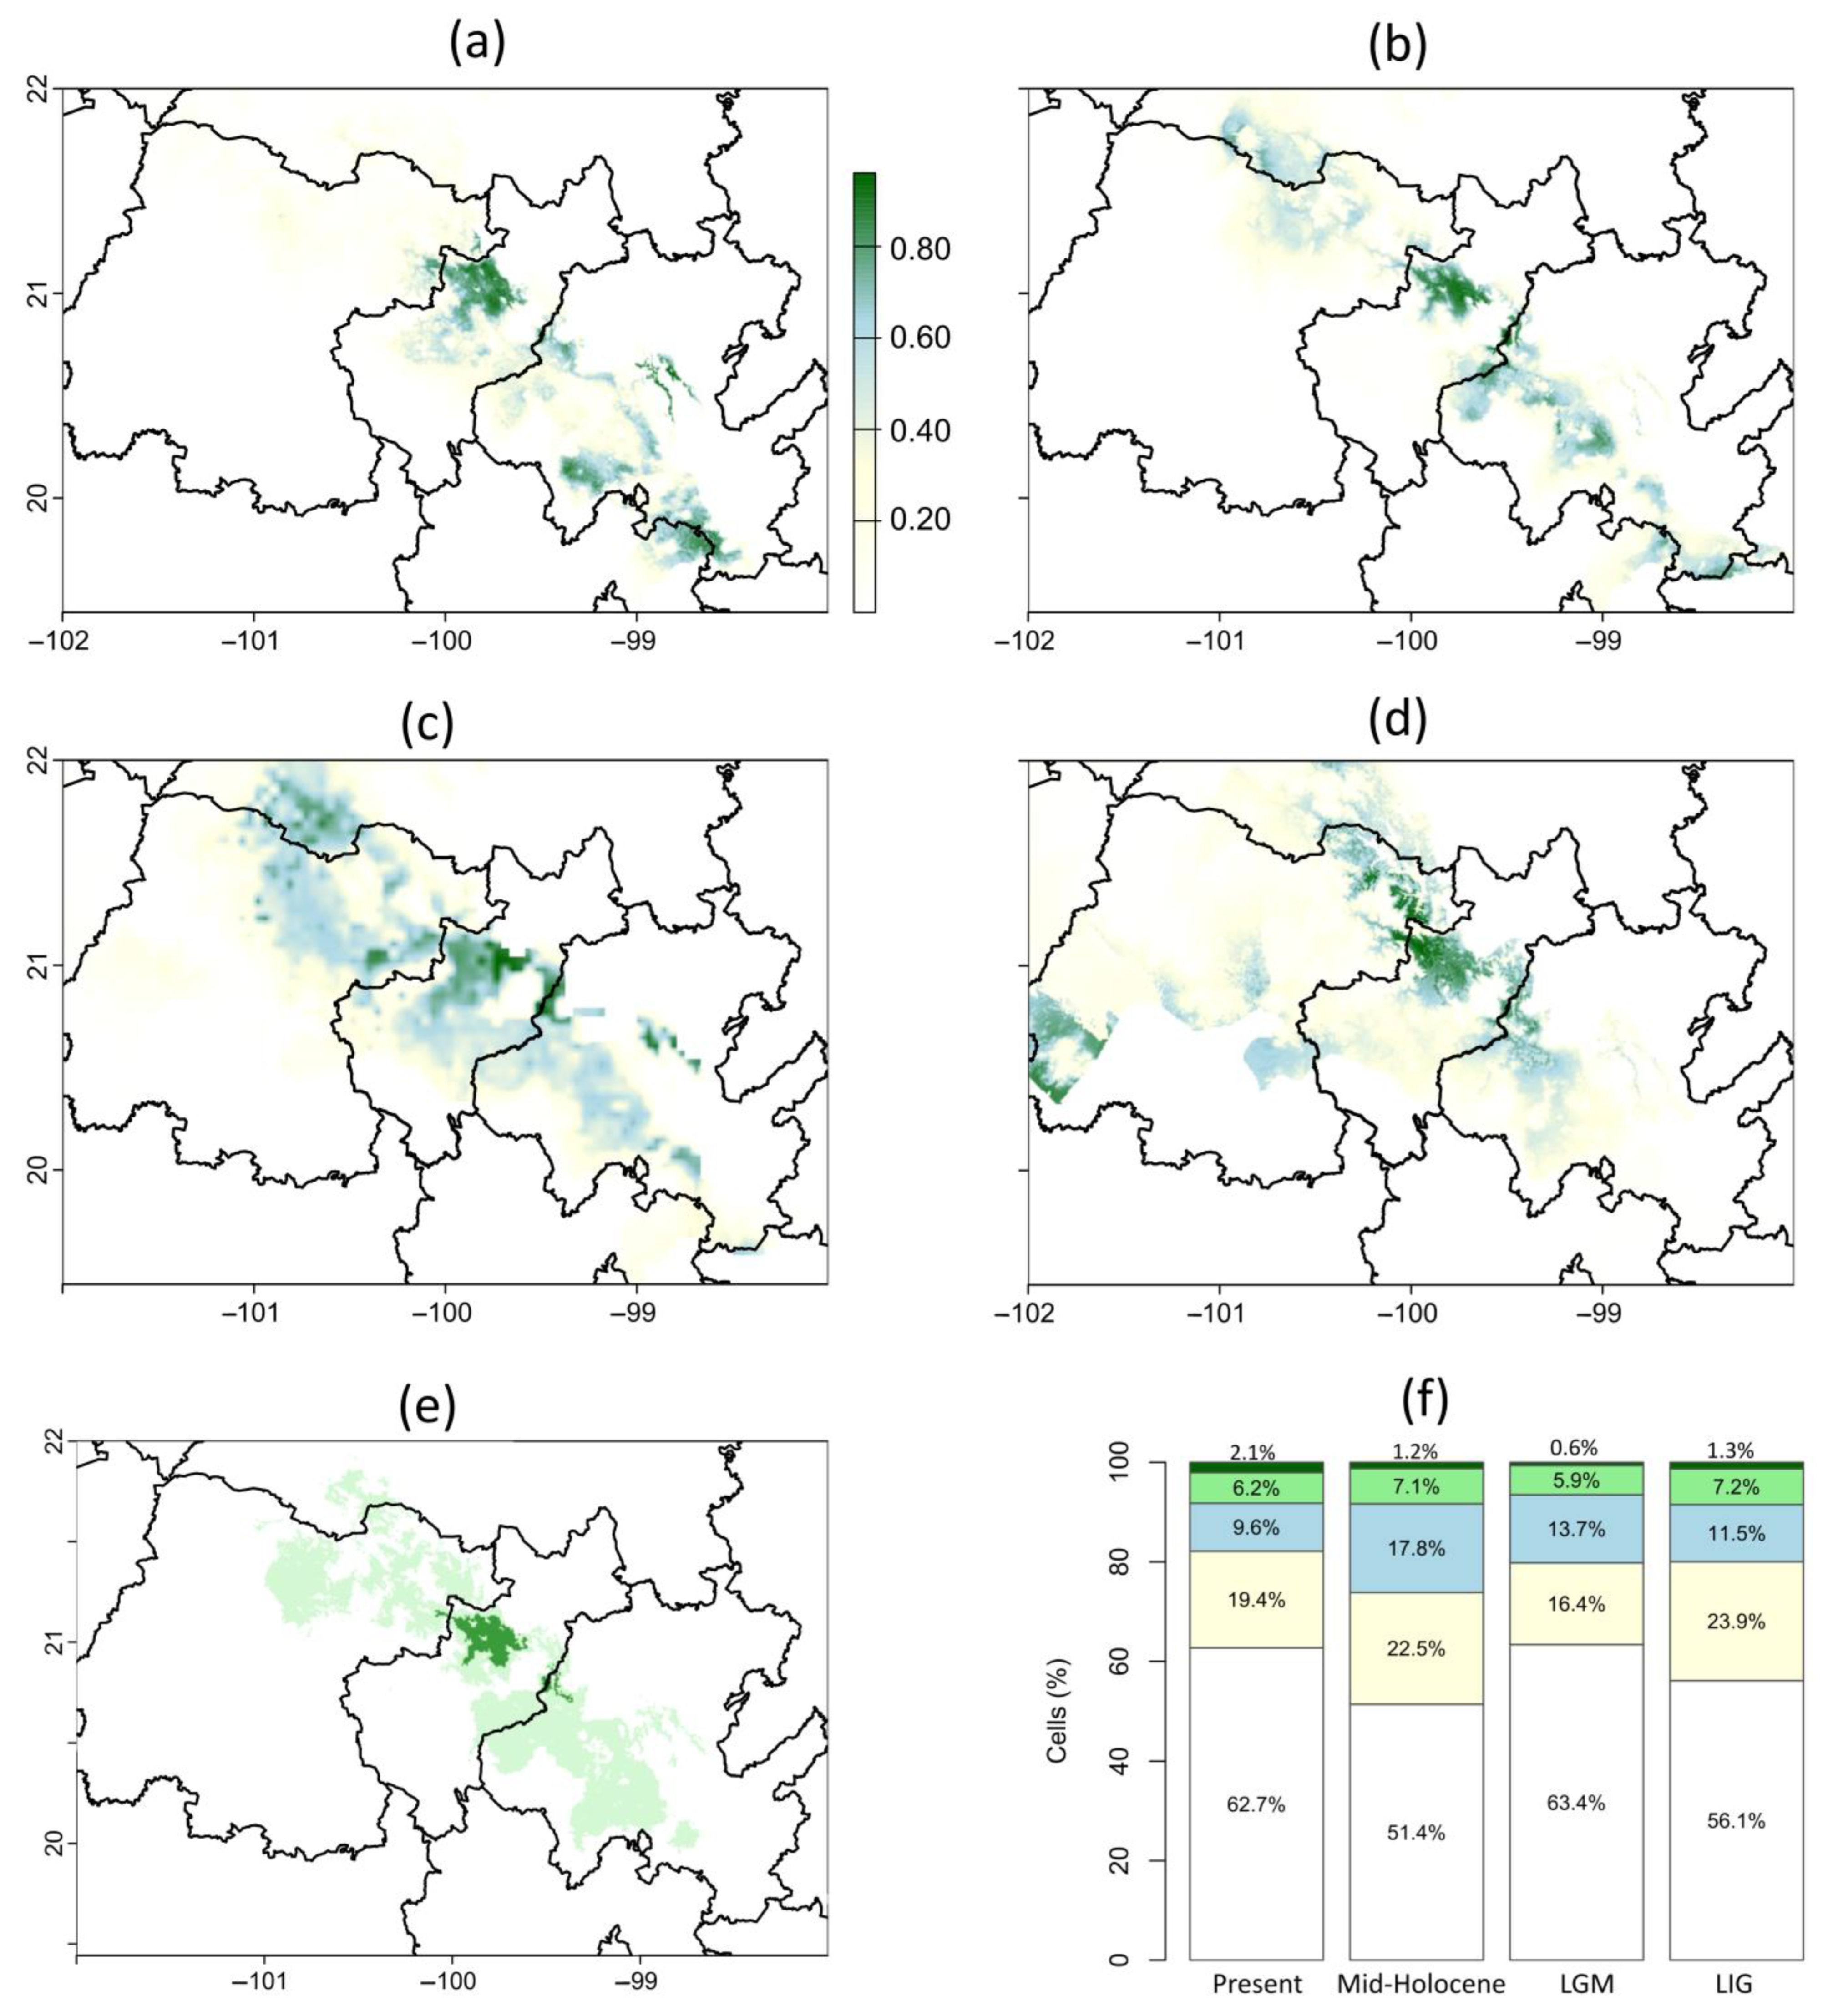
Palaeodistribution models showed that, under current climatic conditions, the potential distribution areas with conditions suitable for the species’ growth (>0.6) are located at the northern limit of the DQH, particularly in Querétaro and Hidalgo (Figure 5a). During the Middle Holocene, the area with the highest suitability (>0.6) remained in the north, in Querétaro (>0.6), although continuity was lost (Figure 5b). In contrast, during the Last Glacial Maximum, the area with suitable climatic conditions (>0.6) showed the greatest decline, and sites with high suitability (>0.8) remained in northern Querétaro (Figure 5c). During the Last Interglacial, the potential range was more extensive and continuous, and exhibited high suitability (0.6 to 1) compared with the LGM. This suggests that the warmer climatic conditions of the Last Interglacial (with temperatures 2 to 4 °C higher than today) allowed the species’ range to expand (Figure 5d). The areas predicted to have high suitability across all four modeled time periods (i.e., areas of climatic stability) indicate that the species might have persisted in the center of the QHD (Figure 5e).

4. Discussion

Our phylogenetic analyses indicate that M. parkinsonii and M. perbella are sister species that speciated in the Early Pleistocene. Meanwhile, the phylogeographic analysis indicates that population divergence occurred during glacial–interglacial cycles. Overall, our phylogeny, used to date the origin of both species, was consistent with a phylogeny of the Mammilloyd clade constructed using 52 loci [3]. Although our phylogeny was estimated using only two loci (accDψ, trnF-psbJ), it confirmed that both species belong to Lineage 2 in Chincoya et al., (2023) [3], whose recent origin is situated on the Mexican Plateau (Figure A1). The M. parkinsonniM. perbella clade (PP = 1) is the sister clade to Mammillaria heyderi subsp. heyderiM. uncinata and M. weisengeri (PP = 1); both clades are found in the QHD. According to the same authors, M. perbella diversified through dispersal within the QHD during the Pleistocene, probably giving rise to M. parkinsonii.
The calibrated haplotype tree revealed that the divergence between M. parkinsonii and M. perbella occurred during the Last Glacial period (74.4 kya). The grouping of M. perbella haplotype H03 with the three haplotypes of M. parkinsonii (Figure 3) suggests that M. parkinsonii is derived from M. perbella or, possibly, that lineage sorting is incomplete (e.g., Aguirre-Liguori et al., 2016) [66]. It is likely that M. perbella had a wide distribution during the QHD and that populations retreated to refugia that maintained warming and relatively stable climatic conditions, which allowed the haplotypes of the central VEN population (H05, H06, and H07) to diversify within glacial refugia. Subsequently, expansion might have taken place towards FLO (H04) and eastwards towards POZ (HO1 and H02) during the Holocene. Regarding M. parkinsonii, the three haplotypes also expanded during the Holocene from the easternmost population towards the north and center of the QHD, involving the divergence of haplotype H03 from EST1. According to the haplotype networks, overall, the populations of M. parkinsonii and M. perbella exhibited similar geographical patterns, with a probable dispersal from currently isolated populations located in the eastern part of their range (Figure 2a,b). However, the fact that the haplotype network of M. parkinsonii is not entirely consistent with the calibrated haplotype tree may be explained by limited sampling, as several of the previously reported populations no longer exist. Phylogeographic patterns observed in Berberis trifoliata and Ephedra compacta from the northern Chihuahuan Desert indicate that genetic differentiation in these species also occurred from east to west [67]. Particularly, in Ephedra compacta, the climatic stability of the refugia was positively associated with genetic diversity in northern Chihuahua [12].
Haplotype divergence was temporally consistent with changes in the distribution range of the species. The paleodistribution model revealed that, during the LIG, the area with climatic conditions suitable for both species was more extensive and continuous. However, during the LGM, when temperatures around the Trans-Mexican Volcanic Belt were ~5 °C lower than today [60], the area shrank, leading to the isolation of the eastern populations and possibly the contraction of the remaining populations. During the MH, when temperatures were slightly higher (~0.7 °C) than today, conditions were favorable for the expansion of the range, dispersal, and populations of both species. A similar paleodistribution pattern was detected in Agave lechuguilla and Ephedra compacta in the northern Chihuahuan Desert, as well as in the columnar cactus Cephalocereus columna-trajani from the Tehuacán–Cuicatlán Valley [12,19,68]. Brailovsky et al. (2026) [69] suggest that the colonization of cacti endemic to the Chihuahuan Desert, belonging to the Mammilloyd clade, occurred in a south-east to north-west direction, following the western flank of the Sierra Madre Oriental and the intermontane valleys. In this regard, our study partially supports this proposal and suggests that populations located in mountainous areas, such as BUC for M. parkinsonii and ZIM for M. perbella, may represent eastern refugia from which the species dispersed towards the central intermontane valleys, where the VEN, FLO, HIG and JAL populations are found, as well as the POZ population, located to the west. Overall, our studies also provide support for diversification through dispersal of the basal lineages of Mammilloyd [3] and show that the area of climatic stability where M. parkinsonii and M. perbella have persisted (Figure 5e) coincides with the areas of greatest species richness of Mammillaria within the QHD [1].
Climatic fluctuations during the Pleistocene played a key role in the spatial and evolutionary patterns of Mammillaria endemic to the Chihuahuan Desert, such as the species of the Leucocephalae and Stylothelae Series. The latter are also found in the QHD and on the continental slopes of the Eastern and Western Sierra Madre; it is estimated that they originated ~2.69 Mya, and that Pleistocene climatic fluctuations have been one of the determining factors in their recent diversification (1 to 0.4 Mya) [70]. Furthermore, our results support the proposal that the QHD represents one of the refugia of the family Cactaceae where modern taxa have arisen, as in the Tehuacán–Cuicatlán Valley, another center of endemism for Mammillaria species [1], whose diversity is associated with both climatic and geological events. Based on a calibrated phylogeny, six neoendemic species of Mammillaria were identified, all of which diversified before 2.48 Mya [71]. The distribution of these species is restricted to topographically complex habitats that were formed during the Pleistocene. Therefore, neoendemism may result from Pleistocene paleoclimatic changes, which favored the persistence and speciation of new taxa under the conditions of climatic stability available in refugia [71], as well as from geological processes. According to this criterion, M. parkinsonii and M. perbella would fall into the category of neoendemic species whose genetic differentiation occurred in the context of Pleistocene climate changes and geographic isolation resulting from the uplift of the Trans-Mexican Volcanic Belt during the Pliocene–Pleistocene [6]. It is, therefore, possible that during the interglacial periods, stable conditions persisted that allowed for species diversification; consequently, it is likely that these factors drove the formation of new Mammillaria species within the QHD. A similar pattern has been reported for globose cacti of the genus Eriosyce in central Chile, where Pleistocene climate fluctuations drove events of contraction and expansion that led to geographic isolation and speciation [72].
The topography of the Chihuahuan Desert, including the central valleys of the QHD, has changed little over the last few million years, and it is, therefore, considered that the endemic cacti that evolved there throughout the Pleistocene did so in a relatively stable landscape, with glacial cycles acting as the main drivers of this evolution [69]. Furthermore, it has been documented that habitat specificity associated with soil type is a determining factor in the distribution of certain globose cacti (M. pectinifera and M. candida) [20,21] and that the sand content of the soil is associated with the diversification of the Cactaceae family [73]; therefore, this edaphic property must be included in future studies as a selection factor that has likely influenced the intra- and interspecific divergence of Mammillaria species.
The low diversity and marked genetic structure detected using both markers suggest that most populations underwent severe bottlenecks, with no subsequent gene flow. The low haplotype diversity of M. parkinsonii and M. perbella (Hd = 0 and Hd = 0–0.5, respectively) and high genetic differentiation (GST = 1, GST = 0.722, respectively) indicate that most haplotypes belonged to a single population, with the exception of the VEN and POZ populations of M. perbella. The Tajima and Fu indexes of neutrality tests were positive but not significant, which indicates that following the expansion of M. parkinsonii, the populations remained in genetic isolation, favoring allele fixation. In line with this, cpDNA markers showed no evidence of gene flow to counteract the effects of genetic drift in any of the species (M. parkinsonii Nm = 0, M. perbella Nm = 0.29). This was despite the fact that the geographical distance between some populations was small, as in the case of M. perbella (VEN-FLO = 2.03 km) and M. parkinsonii (JAL-EST1 = 3 km, EST1-EST2 = 3.49 km). Likewise, in the subshrub Tidestromia anugionosa, in the north of the Chihuahuan Desert, the absence of shared haplotypes and high genetic differentiation (FST = 0.615) indicates that the haplotypes have remained isolated in four different refugia for relatively long periods of time, with little gene flow via seed, whilst the specific soil conditions have acted as a strong selective pressure [74]. Similarly, the columnar cirio (Fouquieria columnaris) in the Sonoran Desert exhibited lineages that do not share haplotypes, nor does gene flow occur, suggesting profound isolation due to geological barriers that led to high genetic differentiation (FST = 0.5) [13]. In general, in phylogeographic studies carried out in the northern part of the Chihuahuan Desert, plant populations tend to harbor fixed or unique haplotypes [75].
The results obtained using ISSR markers showed a similar trend to those for chloroplast sequences. The expected heterozygosity values for M. parkinsonii (HS = 0.362–0.434) and M. perbella (HS = 0.293–0.400) were moderate, whilst the differentiation values were high (ΦST = 0.378, ΦST = 0.3957, respectively). Both species reflect the influence of genetic drift and disruption of gene flow (Nm < 0.4). Similarly, in a study of three globose species of Uebelmania—microendemic to the dry savannah of eastern Brazil and distributed in patches—it was observed that moderate-to-high levels of heterozygosity (He = 0.398–0.625) and genetic differentiation (GST = 0.133–0.76) were associated with recent bottlenecks, as well as inbreeding [76]. Overall, the PCoA is consistent with the spatial distribution of haplotype diversity, in that the most geographically isolated populations are those with the greatest genetic distance: BUC in M. parkinsonii and ZIM and POZ in M. perbella.
Studies using microsatellites on globose cacti endemic to the Tehuacán–Cuicatlán Valley show the same trend: genetic drift and geographical barriers to gene flow have shaped genetic diversity and structure, such as in our Chihuahuan species. This can be seen from the genetic differentiation values for M. kraehenbuehlii (RST = 0.26, p = 0.02), M. albiflora (FST = 0.17, p < 0.05) and M. pectinifera (RST = 0.301) [77]. Furthermore, M. pectinifera showed an Nm value of 0.49, which is attributed to poor pollen and seed dispersal [20]. In general, seed and pollen dispersal in Mammillaria species is considered to be poor, and consequently, species tend to show limited gene flow. Mammillaria species exhibit melittophilous pollination syndrome [78,79]. The average maximum homing distances for the small Ceratina bees, the common local pollinators of several Mammillaria species, were 57.05 ± 9.28 m and 79.98 ± 18.01 m, so they are probably able to transfer pollen among individual plants and promote outcrossing within populations [80]. It is not known which vectors disperse the seeds of this genus, although it is thought that they are dispersed by gravity; however, we have recently observed that the fruits may be dispersed by small mammals (Callejas-Chavero and Cornejo-Romero, pers. obs). In any case, the seeds are dispersed over short distances, except under exceptional conditions that allow for occasional long-distance dispersal. The poor allele dispersal via seeds and pollen in M. parkinsonii and M. perbella is reflected in both markers (Figure 1 and Figure 4).
The QHD is an area where local events of rapid and recent speciation of Mammillaria have occurred, making it a priority area for the conservation of the Cactaceae family [81]. It represents one of the most important areas of floristic richness and genetic pools for globose cacti. Although M. parkinsonii and M. perbella are protected within the Sierra Gorda Biosphere Reserve in Querétaro, this area does not include the central region of the QHD. Among the main threats to the conservation of charismatic Mammillaria are habitat destruction, intense illegal harvesting, and the occurrence of micro-endemics [82]. In fact, M. parkinsonii is listed in the Special Protection (Pr) category on the List of Species at Risk under Mexican Official Standard NOM-059-SEMARNAT-2010 and in the Endangered category according to criteria B1ab (iii,v) on The IUCN Red List of Threatened Species (2017) [83] due to its continued population decline associated with illegal collection, habitat degradation, limited distribution (2500 km2), and severe fragmentation. Mammillaria perbella is considered less vulnerable because it is listed by the IUCN as vulnerable under criterion B1ab(iii). However, during our field trips, we were unable to collect specimens at several sites because they had been lost due to conversion to agricultural or urban areas. Our results indicate that each population maintains a unique gene pool, meaning that the region represents a unique genetic reservoir that must be urgently protected to ensure the continuity of evolutionary processes. According to the genetic structure observed for both species, populations with no shared haplotypes should be considered as separated conservation units with high conservation priorities. Based on our results, it is appropriate to suggest that both species should change their status in the national and international list of at-risk species, in order to guarantee the long-term conservation of these species due to the lack of Natural Protected Areas that include the intermontane valleys of the QHD.


5. Conclusions

Mammillaria parkinsonii and M. perbella populations exhibit spatial and temporal patterns of genetic divergence consistent with those expected under the dynamics of the Pleistocene glacial cycles. It is likely that these taxa are sister species, that M. perbella is ancestral to M. parkinsonii, and that they diversified in areas of climatic stability. Given that our study suggests that cyclical climatic changes during the Pleistocene and Holocene have driven intra- and interspecific divergence in both species, it is likely that these changes constitute a common factor that has favored the evolution of the genus in areas with high species richness. Finally, our results provide evidence that the QHD has served as a refuge for cactus flora, as well as for the genetic diversity of globose cacti.

Supplementary Materials

The following supporting information can be downloaded at: https://www.mdpi.com/article/10.3390/d18090509/s1, Table S1. Geographically referenced Mammillaria parkinsonii and M. perbella records used in MNE. Available by sending an email to C.G.H.

Author Contributions

Conceptualization, A.C.-R.; methodology, A.C.-R., Y.I.-B., A.C.-C., C.G.-H.; formal analysis, A.C.-R., V.d.J.C.-C. and Y.I.-B.; investigation, A.C.-R., A.C.-C., C.G.-H. and Y.I.-B.; resources, A.C.-R. and Y.I.-B.; writing—original draft preparation, A.C.-R., V.d.J.C.-C. and Y.I.-B.; writing—review and editing, A.C.-R., Y.I.-B., V.d.J.C.-C., A.C.-C. and C.G.-H.; supervision, A.C.-R.; project administration, A.C.-R. and Y.I.-B.; funding acquisition, A.C.-R. All authors have read and agreed to the published version of the manuscript.

Funding

This research was funded by Secretaría de Investigación y Posgrado, Instituto Politécnico Nacional, grants numbers SIP-20221909, PICPAE-2023, SIP-20242266.

Data Availability Statement

Specific details of this study are available by sending an email to A.C.R.

Acknowledgments

Iván Fernando Fuentes-Jiménez, Marco Antonio González-Servín, and Fanny Anaid Zuñiga-Ramírez, students at the IPN and UAMI, participated in the collection of plant tissue, DNA extraction, and the PCR’s from cpDNA regions and ISSRs markers. Haydeé González-Martínez (Centro de Micro y Nanotecnologías at the Instituto Politécnico Nacional) provided liquid nitrogen for transporting plant tissue samples and access to the Laboratorios Limpios for DNA extraction from six populations. DNA extraction and PCR’s were performed at Laboratorio Divisional de Biología Molecular, UAMI. Technicians L.M. Márquez-Valdelamar and N.M. López-Ortiz performed the sequencing at LANaBio, IB, UNAM. We thank two anonymous peer reviewers for their valuable suggestions. During the preparation of this manuscript, the authors used DeepL for English translation.

Conflicts of Interest

The authors declare no conflicts of interest.

Appendix A

Table A1. Sequences and length (base pair) of the specific primers designed to amplify the accDψ, rrn5-rrn4.5, and trnF-psbJ regions of M. parkinsonii and M. perbella.
PrimerSequenceLength (bp)
accD_FAGCCATTTGCATCAAGCTCA20
accD_RAGACATGATTTCTAYGGATCCCA23
rrn5-4.5_FCGTCCTACATAACCCGATCCA21
rrn5-4.5_RCGAACCAAGAACTAAGAAAGGCA22
trnF-psbJ_FGGACTGAAAATCCTCGTGTC20
trnF-psbJ_RGGCATTCTTGTGATCGGTTT23
Table A2. Sequences of the ten UBC primer set from the University of British Columbia in Canada, for amplifying dominant ISSR markers in M. parkinsonii and M. perbella.
SpeciesMarker NameSequence (5′–3′)Tm (°C)Average PIC
M. parkinsoniiUBC 809AGA GAG GAG AGA AGA GG48.60.3
UBC 810GAG AGA AGA GAG GAG AT46.20.2
UBC 815CTC TCT CTC TCT CTC TG51.00.39
UBC 823TCT CTC TCT CTC TCT CC50.60.4
UBC 827ACA ACA CAC CAC ACA CG51.90.4
UBC 835AGA AGA GAG GAG AGA GYC52.20.3
UBC 841GAG GAG AGA AGA GAG AYC44.90.36
UBC 852TCT CTC TCT CTC TCT CRA45.20.3
UBC 858TGT GTG TGT GTG TGT TRB55.00.3
UBC 873GAC AGA CAG ACA GAC A47.40.4
M. perbellaUBC 809AGA GAG GAG AGA AGA GG48.60.39
UBC 810GAG AGA AGA GAG GAG AT46.20.4
UBC 815CTC TCT CTC TCT CTC TG51.00.39
UBC 823TCT CTC TCT CTC TCT CC50.60.32
UBC 827ACA ACA CAC CAC ACA CG51.90.4
UBC 835AGA AGA GAG GAG AGA GYC52.20.24
UBC 841GAG GAG AGA AGA GAG AYC44.90.37
UBC 852TCT CTC TCT CTC TCT CRA45.20.16
UBC 858TGT GTG TGT GTG TGT TRB55.00.29
UBC 873GAC AGA CAG ACA GAC A47.40.31
Tm, melting temperature; PIC, Polymorphism Information Content.
Table A3. Sequence reads of the accDψ and trnF-psbJ regions from members of the Cacteae Clade obtained from GeneBank (SRA; Sequence Read Archive), Belonging to BioProject PRJNA671701 [31] and BioProject PRJNA934337 [2].
Specimen NameSourceAccession Number
Acharagma roseanum subsp. galeanense 35149[39] SRR12935149
Coryphantha clavata[3]SRR23441694
Coryphantha delaetiana[3]SRR23441683
Coryphantha durangensis[39]SRR12935157
Coryphantha elephantidens[39]SRR12935165
Coryphantha erecta[39]SRR12935151
Coryphantha recurvata[39]SRR12935166
Cumarinia odorata[39]SRR12935150
Escobaria chihuahuensis[39]SRR12935122
Lophophora williamsii[39]SRR12935152
Mammillaria albicans 35107[39]SRR12935107
Mammillaria albiflora[84]MN517610.1
Mammillaria armillata 35089[39]SRR12935089
Mammillaria baumii[3]SRR23441649
Mammillaria blossfeldiana[39]SRR12935112
Mammillaria bocasana[3]SRR23441647
Mammillaria bocensis[39]SRR12935135
Mammillaria brandegeei 35098[39]SRR12935098
Mammillaria capensis[39]SRR12935169
Mammillaria cerralboa[39]SRR12935094
Mammillaria crinita[3]SRR23441691
Mammillaria elongata[3]SRR23441688
Mammillaria erythrosperma[70]
Mammillaria evermanniana[39]SRR12935108
Mammillaria grahamii[39]SRR12935133
Mammillaria guelzowiana[39]SRR12935138
Mammillaria halei[39]SRR12935093
Mammillaria heyderi subsp. heyderi 20[3]SRR23441684
Mammillaria hutchisoniana 35173[39]SRR12935173
Mammillaria johnstonii 35129[39]SRR12935129
Mammillaria longimamma[3]SRR23441680
Mammillaria mainiae[39]SRR12935121
Mammillaria mazatlanensis[3]SRR23441677
Mammillaria nana[3]SRR23441675
Mammillaria pectinifera[84]MN519716.1
Mammillaria petrophila[39]SRR12935096
Mammillaria phitauiana 35111[39]SRR12935111
Mammillaria polyedra[3]SRR23441668
Mammillaria poselgeri 35143[39]SRR12935143
Mammillaria pottsii[39]SRR12935141
Mammillaria sartorii[3]SRR23441665
Mammillaria slevinii[39]SRR12935110
Mammillaria solisioides[84]MN518341.1
Mammillaria tayloriorum[39]SRR12935097
Mammillaria tetrancistra 35140[39]SRR12935140
Mammillaria theresae[3]SRR23441660
Mammillaria thornberi subsp. yaquensis[39]SRR12935128
Mammillaria uncinata[3]SRR23441653
Mammillaria voburnensis subsp. eichlamii[3]SRR23441689
Mammillaria wiesingeri[3]SRR23441659
Neolloydia conoidea 20[3]SRR23441658
Neolloydia matehualensis[3]SRR23441657
Pelecyphora strobiliformis[3]SRR23441655
Table A4. GenBank Accession Numbers of accDψ, rrn5-rrn4.5 and trnF-psbJ sequences from M. parkinsonii and M. perbella, used for haplotypes identification.
SpeciesLocusAccesion NumberHaplotype
M. parkinsoniiaccDψPZ862220H_02
PZ862221H_03
PZ862222H_01
trnF-psbJPZ862223H_02
PZ862224H_03
PZ862225H_01
rrn5-rrn4.5PZ862226H_02
PZ862227H_03
PZ862228H_01
M. perbellaaccDψPZ862229H_01
PZ862230H_02
PZ862231H_03
PZ862232H_04
PZ862233H_05
PZ862234H_06
PZ862235H_07
rrn5-rrn4.5PZ862236H_01
PZ862237H_02
PZ862238H_03
PZ862239H_04
PZ862240H_05
PZ862241H_06
PZ862242H_07
trnF-psbJPZ862243H_01
PZ862244H_02
PZ862245H_03
PZ862246H_04
PZ862247H_05
PZ862248H_06
PZ862249H_07

Appendix B

Figure A1. Estimated divergence time tree for Mammillaria parkinsonii and M. perbella from the Queretano–Hidalgalguense Desert. The divergence times in million years are shown above the branch, and the posterior probability below. The blue bars show the 95% HPD intervals for the node ages.
Diversity 18 00509 g0a1
Figure A2. Agarose gel image of PCR products amplified with ISSR primer UBC-841 for (a) Mammillaria parkinsonii and (b) M. perbella DNA ladder (50–1500 bp).
Diversity 18 00509 g0a2

References

  1. Hernández, H.M.; Gómez-Hinostrosa, C. Mapping the Cacti of Mexico. In Part II: Mammillaria; DH Books: Milborne Port, UK, 2015; p. 189. [Google Scholar]
  2. Hernández-Hernández, T.; Brown, J.W.; Schlumpberger, B.O.; Eguiarte, L.E.; Magallón, S. Beyond aridification: Multiple explanations for the elevated diversification of cacti in the New World Succulent Biome. New Phytol. 2014, 202, 1382–1397. [Google Scholar] [CrossRef] [Scilit] [PubMed]
  3. Chincoya, D.A.; Arias, S.; Vaca-Paniagua, F.; Dávila, P.; Solórzano, S. Phylogenomics and Biogeography of the Mammilloid Clade Revealed an Intricate Evolutionary History Arose in the Mexican Plateau. Biology 2023, 12, 512. [Google Scholar] [CrossRef] [Scilit] [PubMed]
  4. Arakaki, M.; Christin, P.-A.; Nyffeler, R.; Lendel, A.; Eggli, U.; Ogburn, R.M.; Spriggs, E.; Moore, M.J.; Edwards, E.J. Contemporaneous and recent radiations of the world’s major succulent plant lineages. Proc. Natl. Acad. Sci. USA 2011, 108, 8379–8384. [Google Scholar] [CrossRef] [Scilit] [PubMed]
  5. Vázquez-Sánchez, M.; Terrazas, T.; Arias, S.; Ochoterena, H. Molecular phylogeny, origin and taxonomic implications of the tribe Cacteae (Cactaceae). Syst. Biodivers. 2013, 11, 103–116. [Google Scholar] [CrossRef] [Scilit]
  6. Hernández, H.M.; Bárcenas, R.T. Endangered cacti in the Chihuahuan Desert: I. Distribution patterns. Conserv. Biol. 1995, 9, 1176–1188. [Google Scholar] [CrossRef] [Scilit] [PubMed]
  7. Hernández, H.M.; Bárcenas, R.T. Endangered Cacti in the Chihuahuan Desert: II. Biogeography and Conservation. Conserv. Biol. 1996, 10, 1200–1209. [Google Scholar] [CrossRef] [Scilit]
  8. Hewitt, G.M. Genetic consequences of climatic oscillations in the Quaternary. Philos. Trans. R. Soc. Lond. B Biol. Sci. 2004, 359, 183–195. [Google Scholar] [CrossRef] [Scilit] [PubMed]
  9. Hewitt, G.M. Some genetic consequences of ice ages, and their role in divergence and speciation. Biol. J. Linn. Soc. Lond. 1996, 58, 247–276. [Google Scholar] [CrossRef]
  10. Tzedakis, P.C.; Lawson, I.T.; Frogley, M.R.; Hewitt, G.M.; Preece, R.C. Buffered tree population changes in a Quaternary refugium: Evolutionary implications. Science 2002, 297, 2044–2047. [Google Scholar] [CrossRef] [Scilit] [PubMed]
  11. Sork, V.L.; Gugger, P.F.; Chen, J.; Werth, S. Evolutionary lessons from California plant phylogeography. Proc. Natl. Acad. Sci. USA 2016, 113, 8064–8071. [Google Scholar] [CrossRef] [Scilit] [PubMed]
  12. Loera, I.; Ickert-Bond, S.M.; Sosa, V. Pleistocene refugia in the Chihuahuan Desert: The phylogeographic and demographic history of the gymnosperm Ephedra compacta. J. Biogeogr. 2017, 44, 2706–2716. [Google Scholar] [CrossRef] [Scilit]
  13. Martínez-Noguez, J.J.; León de la Luz, J.L.; Delgadillo Rodríguez, J.; García-De León, F.J. Phylogeography and genetic structure of an iconic tree of the Sonoran Desert, the Cirio (Fouquieria columnaris), based on chloroplast DNA. Biol. J. Linn. Soc. Lond. 2020, 130, 433–446. [Google Scholar] [CrossRef] [Scilit]
  14. Van Devender, T.R. Late Quaternary vegetation and climate of the Sonoran Desert, United States and Mexico. In Packrat Middens: The Last 40,000 Years of Biotic Change; Betancourt, J.L., Van Devender, T.R., Martin, P.S., Eds.; University of Arizona Press: Tucson, AZ, USA, 1990; pp. 134–165. [Google Scholar] [CrossRef] [Scilit]
  15. Van Devender, T.R.; Burgess, T.L.; Piper, J.C.; Turner, R.M. Paleoclimatic implications of Holocene plant remains from the Sierra Bacha, Sonora, Mexico. Quat. Res. 1994, 41, 99–108. [Google Scholar] [CrossRef] [Scilit]
  16. Nason, J.D.; Hamrick, J.L.; Fleming, T.H. Historical vicariance and postglacial colonization effects on the evolution of genetic structure in Lophocereus gumosus, a Sonoran Desert columnar cactus. Evolution 2002, 56, 2214–2226. [Google Scholar] [CrossRef] [Scilit] [PubMed]
  17. Clark-Tapia, R.; Molina-Freaner, F. The genetic structure of a columnar cactus with a disjunct distribution: Stenocereus gummosus in the Sonoran Desert. Heredity 2003, 90, 443–450. [Google Scholar] [CrossRef] [Scilit] [PubMed]
  18. Gutiérrez-Flores, C.; Cota-Sánchez, J.H.; León-de la Luz, J.L.; García-de León, F.J. Disparity in floral traits and breeding systems in the iconic columnar cactus Pachycereus pringlei (Cactaceae). Flora 2017, 235, 18–28. [Google Scholar] [CrossRef] [Scilit]
  19. Scheinvar, E.; Gámez, N.; Castellanos-Morales, G.; Aguirre-Planter, E.; Eguiarte, L.E. Neogene and Pleistocene history of Agave lechuguilla in the Chihuahuan Desert. J. Biogeogr. 2017, 44, 322–334. [Google Scholar] [CrossRef] [Scilit]
  20. Cornejo-Romero, A.; Medina-Sánchez, J.; Hernández-Hernández, T.; Rendón-Aguilar, B.; Valverde, P.L.; Zavala-Hurtado, A.; Rivas-Arancibia, S.P.; Pérez-Hernández, M.A.; López-Ortega, G.; Jiménez-Sierra, C.; et al. Quaternary origin and genetic divergence of the endemic cactus Mammillaria pectinifera in a changing landscape in the Tehuacán Valley, Mexico. Genet. Mol. Res. 2014, 13, 73–88. [Google Scholar] [CrossRef] [Scilit] [PubMed]
  21. Solórzano, S.; Arias, S.; Dávila, P. Genetics and Conservation of Plant Species of Extremely Narrow Geographic Range. Diversity 2016, 8, 31. [Google Scholar] [CrossRef] [Scilit]
  22. Gorelick, R. Evolution of cacti is largely driven by genetic drift, not selection. Bradleya 2009, 27, 37–48. [Google Scholar] [CrossRef] [Scilit]
  23. Mandujano, M.C.; Carrillo, A.I.; Martínez, P.C.; Golubov, J. Reproductive biology of Cactaceae. In Desert Plants: Biology and Biotechnology; Ramawat, K.G., Ed.; Springer: Berlin, Germany, 2010; pp. 197–230. [Google Scholar] [CrossRef] [Scilit]
  24. Hernández, H.M.; Gómez-Hinostrosa, C. Cactus diversity and Endemism in the Chihuahuan Desert Region. In Biodiversity, Ecosystems, and Conservation in Northern Mexico; Cartron, Jean-Luc, E., Ceballos, G., Felger, R.S., Eds.; Oxford University Press: New York, NY, USA, 2005; pp. 264–275. [Google Scholar] [CrossRef] [Scilit]
  25. Cervantes, C.R.; Hinojosa-Álvarez, S.; Wegier, A.; Rosas, U.; Arias-Montes, S. Evaluating the monophyly of Mammillaria series Supertextae (Cactaceae). PhytoKeys 2021, 177, 25–42. [Google Scholar] [CrossRef] [Scilit] [PubMed]
  26. Scheinvar, L. Flora Cactológica del Estado de Querétaro: Diversidad y Riqueza; Fondo de Cultura Económica: Ciudad de México, Mexico, 2004; 392p. [Google Scholar]
  27. Chincoya, D.A.; Sánchez-Flores, A.; Estrada, K.; Díaz-Velásquez, C.E.; González-Rodríguez, A.; Vaca-Paniagua, F.; Dávila, P.; Arias, S.; Solórzano, S. Identification of High Molecular Variation Loci in Complete Chloroplast Genomes of Mammillaria (Cactaceae, Caryophyllales). Genes 2020, 11, 830. [Google Scholar] [CrossRef] [Scilit] [PubMed]
  28. Gene Codes Corporation. Sequencher, Version 4.8; Gene Codes Corporation: Ann Arbor, MI, USA, 2007. Available online: http://www.genecodes.com (accessed on 2 April 2026).
  29. Edgar, R.C. MUSCLE: Multiple sequence alignment with high accuracy and high throughput. Nucleic Acids Res. 2004, 32, 1792–1797. [Google Scholar] [CrossRef] [Scilit] [PubMed]
  30. Hall, T.A. BioEdit: A User-Friendly Biological Sequence Alignment Editor and Analysis Program for Windows 95/98/NT. Nucleic Acids Symp. Ser. 1999, 41, 95–98. [Google Scholar]
  31. Kumar, S.; Stecher, G.; Suleski, M.; Sanderford, M.; Sharma, S.; Tamura, K. MEGA12: Molecular Evolutionary Genetics Analysis Version 12 for Adaptive and Green Computing. Mol. Biol. Evol. 2024, 41, msae263. [Google Scholar] [CrossRef] [Scilit] [PubMed]
  32. Çilesiz, Y. Genetic relationship among grape (Vitis vinifera L.) genotypes grown in inner Anatolia region Turkey analyzed by ISSR and RAPD markers. Sci. Rep. 2025, 15, 32842. [Google Scholar] [CrossRef] [Scilit] [PubMed]
  33. Ng, W.L.; Tan, S.G. Inter-Simple Sequence Repeat (ISSR) Markers: Are We Doing It Right? ASM Sci. J. 2015, 9, 30–39. [Google Scholar]
  34. Trejo, L.; Alvarado-Cárdenas, L.O.; Scheinvar, E.; Eguiarte, L.E. Population genetic analysis and bioclimatic modeling in Agave striata in the Chihuahuan Desert indicate higher genetic variation and lower differentiation in drier and more variable environments. Am. J. Bot. 2016, 103, 1020–1029. [Google Scholar] [CrossRef] [Scilit] [PubMed]
  35. Rozas, J.; Ferrer-Mata, A.; Sánchez-DelBarrio, J.C.; Guirao-Rico, S.; Librado, P.; Ramos-Onsins, S.E.; Sánchez-Gracia, A. DnaSP 6: DNA Sequence Polymorphism Analysis of Large Datasets. Mol. Biol. Evol. 2017, 34, 3299–3302. [Google Scholar] [CrossRef] [Scilit] [PubMed]
  36. R Core Team. R: A Language and Environment for Statistical Computing; R Foundation for Statistical Computing: Vienna, Austria, 2021. Available online: https://www.R-project.org/ (accessed on 16 June 2026).
  37. Fluxus Technology Ltd. NETWORK Version 10.2.0.0 User Guide; Fluxus Technology Ltd.: Colchester, UK, 2020; Available online: http://www.fluxus-engineering.com (accessed on 25 June 2026).
  38. Korneliussen, T.S.; Moltke, I.; Albrechtsen, A.; Nielsen, R. Calculation of Tajima’s D and other neutrality test statistics from low-depth next-generation sequencing data. BMC Bioinform. 2013, 14, 289. [Google Scholar] [CrossRef] [Scilit] [PubMed]
  39. Breslin, P.B.; Wojciechowski, M.F.; Majure, L.C. Molecular phylogeny of the Mammilloid clade (Cactaceae) resolves the monophyly of Mammillaria. Taxon 2021, 70, 308–323. [Google Scholar] [CrossRef] [Scilit]
  40. Krueger, F. Trim Galore. 2012. Available online: https://github.com/FelixKrueger/TrimGalore (accessed on 1 September 2025).
  41. Cock, P.J.; Antao, T.; Chang, J.T.; Chapman, B.A.; Cox, C.J.; Dalke, A.; Friedberg, I.; Hamelryck, T.; Kauff, F.; Wilczynski, B.; et al. Biopython: Freely available Python tools for computational molecular biology and bioinformatics. Bioinformatics 2009, 25, 1422–1423. [Google Scholar] [CrossRef] [Scilit] [PubMed]
  42. Katoh, K.; Standley, D.M. MAFFT multiple sequence alignment software version 7: Improvements in performance and usability. Mol. Biol. Evol. 2013, 30, 772–780. [Google Scholar] [CrossRef] [Scilit] [PubMed]
  43. Borowiec, M.L. AMAS: A fast tool for alignment manipulation and computing of summary statistics. PeerJ 2016, 4, e1660. [Google Scholar] [CrossRef] [Scilit] [PubMed]
  44. Minh, B.Q.; Schmidt, H.A.; Chernomor, O.; Schrempf, D.; Woodhams, M.D.; von Haeseler, A.; Lanfear, R. IQ-TREE 2: New models and efficient methods for phylogenetic inference in the genomic era. Mol. Biol. Evol. 2020, 37, 1530–1534. [Google Scholar] [CrossRef] [Scilit] [PubMed]
  45. Bouckaert, R.; Vaughan, T.G.; Barido-Sottani, J.; Duchêne, S.; Fourment, M.; Gavryushkina, A.; Heled, J.; Jones, G.; Kühnert, D.; De Maio, N.; et al. BEAST 2.5: An advanced software platform for Bayesian evolutionary analysis. PLoS Comput. Biol. 2019, 15, e1006650. [Google Scholar] [CrossRef] [Scilit] [PubMed]
  46. Wolfe, K.H.; Li, W.-H.; Sharp, P.M. Rates of nucleotide substitution vary greatly among plant mitochondrial, chloroplast, and nuclear DNAs. Proc. Natl. Acad. Sci. USA 1987, 84, 9054–9058. [Google Scholar] [CrossRef] [Scilit] [PubMed]
  47. Rambaut, A.; Drummond, A.J.; Xie, D.; Baele, G.; Suchard, M.A. Posterior summarization in Bayesian phylogenetics using Tracer 1.7. Syst. Biol. 2018, 67, 901–904. [Google Scholar] [CrossRef] [Scilit] [PubMed]
  48. Drummond, A.J.; Rambaut, A. BEAST: Bayesian evolutionary analysis by sampling trees. BMC Evol. Biol. 2007, 7, 214. [Google Scholar] [CrossRef] [Scilit] [PubMed]
  49. Rambaut, A. FigTree, Version 1.3.1; Institute of Evolutionary Biology, University of Edinburgh: Edinburgh, UK, 2010. Available online: https://tree.bio.ed.ac.uk/software/figtree/ (accessed on 2 June 2026).
  50. Nei, M. Analysis of gene diversity in subdivided populations. Proc. Natl. Acad. Sci. USA 1973, 70, 3321–3323. [Google Scholar] [CrossRef] [Scilit] [PubMed]
  51. Excoffier, L.; Smouse, P.E.; Quattro, J.M. Analysis of molecular variance inferred from metric distances among DNA haplotypes: Application to human mitochondrial DNA restriction data. Genetics 1992, 131, 479–491. [Google Scholar] [CrossRef] [Scilit] [PubMed]
  52. Mantel, N. Detection of disease clustering and a generalized regression approach. Cancer Res. 1967, 27, 209–220. [Google Scholar] [PubMed]
  53. Nei, M. Genetic distance between populations. Am. Nat. 1972, 106, 283–292. [Google Scholar] [CrossRef] [Scilit] [PubMed]
  54. Deaton, R.C.; Murphy, R.C.; Garzon, M.H.; Franceschetti, D.R.; Stevens, S.E., Jr. Good encodings for DNA-based solutions to combinatorial problems. In DNA Based Computers; DIMACS Series in Discrete Mathematics and Theoretical Computer Science; Landweber, L.F., Baum, E.B., Eds.; American Mathematical Society: Providence, RI, USA, 1999; Volume 44, pp. 247–258. [Google Scholar]
  55. Dray, S.; Dufour, A.B. The ade4 package: Implementing the duality diagram for ecologists. J. Stat. Softw. 2007, 22, 1–20. [Google Scholar] [CrossRef] [Scilit]
  56. Jombart, T. adegenet: A R package for the multivariate analysis of genetic markers. Bioinformatics 2008, 24, 1403–1405. [Google Scholar] [CrossRef] [Scilit] [PubMed]
  57. Paradis, E.; Schliep, K. ape 5.0: An environment for modern phylogenetics and evolutionary analyses in R. Bioinformatics 2019, 35, 526–528. [Google Scholar] [CrossRef] [Scilit] [PubMed]
  58. Kamvar, Z.N.; Tabima, J.F.; Grünwald, N.J. poppr: An R package for genetic analysis of populations with clonal, partially clonal, and/or sexual reproduction. PeerJ 2014, 2, e281. [Google Scholar] [CrossRef] [Scilit] [PubMed]
  59. Wickham, H. ggplot2: Elegant Graphics for Data Analysis, 2nd ed.; Springer: New York, NY, USA, 2016. [Google Scholar] [CrossRef] [Scilit]
  60. Caballero, M.; Lozano-García, S.; Ortega-Guerrero, B.; Correa-Metrio, A. Quantitative estimates of orbital and millennial scale climatic variability in central Mexico during the last ~40,000 years. Quat. Sci. Rev. 2019, 205, 62–75. [Google Scholar] [CrossRef] [Scilit]
  61. Chávez-Lara, C.M.; Palacios-García, N.B.; García-Macedo, K.; Ibarra-Morales, D.; Caballero, M. Late Pleistocene–Holocene environmental fluctuations of southern Chihuahua Desert, Mexico. J. Quat. Sci. 2025, 40, 634–644. [Google Scholar] [CrossRef] [Scilit]
  62. Phillips, S.J.; Anderson, R.P.; Dudik, M.; Schapire, R.E.; Blair, M.E. Opening the black box: An open-source release of Maxent. Ecography 2017, 40, 887–893. [Google Scholar] [CrossRef] [Scilit]
  63. Castaño-Quintero, S.; Escobar-Luján, J.; Osorio-Olvera, L.; Peterson, A.T.; Chiappa-Carrara, X.; Martínez-Meyer, E.; Yañez-Arenas, C. Supraspecific units in correlative niche modeling improves the prediction of geographic potential of biological invasions. PeerJ 2020, 8, e10454. [Google Scholar] [CrossRef] [Scilit] [PubMed]
  64. Hijmans, R.; Brown, A.; Barbosa, M. Terra: Spatial Data Analysis. R Package Version 1.9-6. Available online: https://CRAN.Rproject.org/package=terra (accessed on 28 April 2026).
  65. Carnaval, A.C.; Hickerson, M.J.; Haddad, C.F.; Rodrigues, M.T.; Moritz, C. Stability predicts genetic diversity in the Brazilian Atlantic Forest hotspot. Science 2009, 323, 785–789. [Google Scholar] [CrossRef] [Scilit] [PubMed]
  66. Aguirre-Liguori, J.A.; Scheinvar, E.; Eguiarte, L.E. Gypsum soil restriction drives genetic differentiation in Fouquieria shrevei (Fouquieriaceae). Am. J. Bot. 2014, 101, 730–736. [Google Scholar] [CrossRef] [Scilit] [PubMed]
  67. Angulo, D.F.; Amarilla, L.D.; Anton, A.M.; Sosa, V. Colonization in North American Arid Lands: The Journey of Agarito (Berberis trifoliolata) Revealed by Multilocus Molecular Data and Packrat Midden Fossil Remains. PLoS ONE 2017, 12, e0168933. [Google Scholar] [CrossRef] [Scilit] [PubMed]
  68. Cornejo-Romero, A.; Vargas-Mendoza, C.F.; Aguilar-Martínez, G.F.; Medina-Sánchez, J.; Rendón-Aguilar, B.; Valverde, P.L.; Zavala-Hurtado, J.A.; Serrato, A.; Rivas-Arancibia, S.; Pérez-Hernández, M.A.; et al. Alternative glacial-interglacial refugia demographic hypotheses tested on Cephalocereus columna-trajani (Cactaceae) in the intertropical Mexican drylands. PLoS ONE 2017, 12, e0175905. [Google Scholar] [CrossRef] [Scilit] [PubMed]
  69. Brailovsky-Signoret, D.; Hernández, H.M.; Castaño-Meneses, G. Climatic and Evolutionary Trends in Endemic Cacti of the Chihuahuan Desert Biome: Distribution Models and Track Analyses. Diversity 2026, 18, 408. [Google Scholar] [CrossRef] [Scilit]
  70. Ortíz-Brunel, J.P. Evolución y Biogeografía de Mammillaria Serie Stylothelae (Cactaceae). Ph.D. Thesis, Universidad de Guadalajara, Guadalajara, Mexico, January 2025. [Google Scholar]
  71. Soto-Trejo, F.; Robles, F.; Lira, R.; Sánchez-González, L.A.; Ortiz, E.; Dávila, P. The evolution of paleo- and neo-endemic species of Cactaceae in the isolated Valley of Tehuacán-Cuicatlán, Mexico. Plant. Ecol. Evol. 2024, 157, 42–54. [Google Scholar] [CrossRef] [Scilit]
  72. Meriño, B.M.; Villalobos-Barrantes, H.M.; Guerrero, P.C. Pleistocene climate oscillations have shaped the expansion and contraction speciation model of the globose Eriosyce sect. Neoporteria cacti in Central Chile. Ann. Bot. 2024, 134, 651–664. [Google Scholar] [CrossRef] [Scilit] [PubMed]
  73. Thompson, J.B.; Hernández-Hernández, T.; Keeling, G.; Vásquez-Cruz, M.; Priest, N.K. Identifying the multiple drivers of cactus diversification. Nat. Commun. 2024, 15, 7282. [Google Scholar] [CrossRef] [Scilit] [PubMed]
  74. Sánchez-del Pino, I.; Alfaro, I.; Andueza-Noh, R.; Mora-Olivo, A.; Chávez-Pesqueira, M.; Ibarra-Morales, A.; Moore, M.; Flores-Olvera, H. High phylogeographic and genetic diversity of Tidestromia lanuginosa supports full-glacial refugia for arid-adapted plants in southern and central Coahuila, Mexico. Am. J. Bot. 2020, 107, 1296–1308. [Google Scholar] [CrossRef] [Scilit] [PubMed]
  75. Scheinvar, E.; Gámez, N.; Moreno-Letelier, A.; Aguirre-Planter, E.; Eguiarte, L.E. Phylogeography of the Chihuahuan Desert: Diversification and Evolution Over the Pleistocene. In Plant Diversity and Ecology in the Chihuahuan Desert; Mandujano, M.C., Pisanty, I., Eguiarte, L.E., Eds.; Springer: Cham, Switzerland, 2020; pp. 19–44. [Google Scholar] [CrossRef] [Scilit]
  76. Rodriguez-Silva, G.A.; Khan, G.; Ribeiro-Silva, S.; Aona, L.Y.S.; Machado, M.C.; Bonatelli, I.A.S.; Moraes, E.M. Extreme genetic structure in a relict cactus genus from campo rupestre landscapes: Implications for conservation. Biodivers. Conserv. 2020, 29, 1263–1281. [Google Scholar] [CrossRef] [Scilit]
  77. Solórzano, S.; Téllez, O.; Álvarez-Espino, R.; Dávila, P. Unidades genéticas para la conservación de Mammillaria (Cactaceae). Rev. Fitotec. Mex. 2017, 40, 119–129. [Google Scholar] [CrossRef] [Scilit]
  78. Callejas-Chavero, A.; Vargas-Mendoza, C.F.; Gómez-Hinostrosa, C.; Arriola-Padilla, V.J.; Cornejo-Romero, A. Breeding system in a population of the globose cactus Mammillaria magnimamma at Valle del Mezquital, Mexico. Bot. Sci. 2021, 99, 229–241. [Google Scholar] [CrossRef] [Scilit]
  79. Callejas-Chavero, A.; Sánchez-Serano, S.; Flores-Martínez, A.; Cornejo-Romero, A. Mating system of a Mammillaria magnimamma (Cactaceae) population of the semi-arid central Mexican region. J. Arid Environ. 2023, 209, 104885. [Google Scholar] [CrossRef] [Scilit]
  80. Valverde, P.L.; Jimenez-Sierra, C.; López-Ortega, G.; Zavala-Hurtado, J.A.; Rivas-Arancibia, S.; Rendon-Aguilar, B.; Perez-Hernandez, M.A.; Cornejo-Romero, A.; Carrillo-Ruiz, H. Floral morphometry, anthesis, and pollination success of Mammillaria pectinifera (Cactaceae), a rare and threatened endemic species of Central Mexico. J. Arid Environ. 2015, 116, 29–32. [Google Scholar] [CrossRef] [Scilit]
  81. Téllez-Valdés, O.; Talonia, C.M.; Arenas-Navarro, M.; Solórzano-Lujano, S.; Lira-Saade, R.; Dávila-Aranda, P. Identification of Priority Areas for Cactaceae Conservation. In Arid and Semi-Arid Zones of Mexico: A Comprehensive Exploration of Biodiversity, Ecology, and Conservation; Solórzano-Lujano, S., Ávila-Acevedo, J.G., Valencia-Quiroz, I., Eds.; Bentham Books: Singapore, 2025; pp. 308–334. [Google Scholar] [CrossRef] [Scilit]
  82. Goettsch, B.; Hilton-Taylor, C.; Cruz-Piñón, G.; Duffy, J.P.; Frances, A.; Hernández, H.M.; Inger, R.; Pollock, C.; Schipper, J.; Superina, M.; et al. High proportion of cactus species threatened with extinction. Nat. Plants 2015, 1, 15142. [Google Scholar] [CrossRef] [Scilit] [PubMed]
  83. IUCN Red List of Threatened Species; IUCN: Gland, Switzerland, 2017; Available online: https://www.iucnredlist.org/ (accessed on 18 January 2026).
  84. Solórzano, S.; Chincoya, D.A.; Sánchez-Flores, A.; Estrada, K.; Díaz-Velásquez, C.E.; González-Rodríguez, A.; Vaca-Paniagua, F.; Dávila, P.; Arías, S. De Novo Assembly Discovered Novel Structures in Genome of Plastids and Revealed Divergent Inverted Repeats in Mammillaria (Cactaceae, Caryophyllales). Plants 2019, 8, 392. [Google Scholar] [CrossRef] [Scilit]
Figure 1. Study sites: (a) Mexican Plateau or Chihuahuan Desert, Mexico, in green pale; (b) Queretano–Hidalguense Desert (Guanajuato, Querétaro, Hidalgo); (c) haplotype frequencies of M. parkinsonii; and (d) M. perbella.
Diversity 18 00509 g001
Figure 2. Haplotype networks for (a) M. parkinsonii and (b) M. perbella based on the chloroplast accDψ, rrn5-rrn4.5, and trnF-psbJ regions. Node colors are the same as haplotype colors of Figure 1. The size of the circles indicates haplotype frequencies in the different populations. The numbers in squares indicate the mutational steps. The dark circle represents the outgroup.
Diversity 18 00509 g002
Figure 4. Principal Coordinate Analysis (PCoA) based on ISSR markers from (a) M. parkinsonii and (b) M. perbella from the Queretano–Hidalguense Desert, Mexico. Each point represents an individual; the colors indicate the population of origin, and the ellipses represent 95% confidence intervals. The percentages on the axes indicate the variance explained by each coordinate.
Diversity 18 00509 g004
Figure 5. Potential distribution of M. parkinsonii and M. perbella in the Queretano–Hidalguense Desert, Mexico, during (a) current distribution; (b) Middle Holocene (HM; around 6 kya); (c) Last Glacial Maximum (LGM; around 22 kya); (d) Last Interglacial (LIG; around 120,000–140,000 kya); (e) predicted areas of climatic stability. Light green indicates areas above the minimum training presence threshold (0.06), and dark green indicates areas with suitability values > 0.8 (high suitability). (f) Percentage of cells across suitability ranges (0.06–0.2, white; 0.2–0.4, yellow; 0.4–0.6, blue; 0.6–0.8, green; >0.8, dark green).
Diversity 18 00509 g005
Table 1. Estimates of genetic diversity obtained from the accDψ, rrn5-rrn4.5, and trnF-psbJ regions in M. parkinsonii and M. perbella populations from the Queretano–Hidalguense Desert, Mexico.
Species/Populationnπ (SD)hHd (SD)D (P)Fs
Mammillaria parkinsonii570.00042 30.509 0.650 1.767
(0.00007) (0.063)(0.10)(0.87)
Higuerillas, HIG10010
Jalpan, JAL10010
Bucarelli, BUC9010
Estación 1, EST110010
Estación 2, EST210010
Venado, VEN8010
Mammillaria perbella370.0044 70.815 1.707.91
(0.00056) (0.029)(0.10)(0.99)
San Luis de los Pozos, POZ90.0002520.5−0.067.91
(0.10)(0.99)
Zimapán, ZIM10010
Florida, FLO10010
Venado, VEN80.0004930.4643−0.690.10
(0.29)(0.45)
n, sample size; π, nucleotide diversity; h, number of haplotypes; Hd, haplotype diversity; SD, standard deviation; Tajima’s D; Fu’s Fs.
Table 2. Genetic diversity indices estimated using ISSR markers for populations of M. parkinsonii and M. perbella from the Queretano–Hidalguense Desert, Mexico.
SpeciesPopulationnPPL (%) HeHS
Mammillaria parkinsoniiBUC1274.830.3090.417
EST11278.810.3140.424
EST21278.810.2920.403
HIG1276.820.3260.434
JAL1268.210.2660.362
VEN1274.830.3140.414
Mammillaria perbellaPOZ1167.310.2920.376
ZIM1164.100.2720.361
FLO1271.790.3000.400
VEN949.360.2550.293
n, sample size; PPL, percentage of polymorphic loci; He, Nei’s genetic diversity; HS, Shannon diversity index.
Table 3. Molecular analysis of variance (AMOVA) based on ISSR markers for M. parkinsonii and M. perbella from the Queretano–Hidalguense Desert, Mexico.
Varianced.f.SSDSigma2% of VariationΦST
Mammillaria parkinsonii
Among populations50.34360.00537.850.378 *
Within populations660.5460.008362.15
Total711.77920.0133100
Mammillaria perbella
Among populations30.13170.003639.570.396 *
Within populations390.21360.005560.43
Total420.69060.0091100
d.f. degrees of freedom; SSD, sum of squared deviations; Sigma22), estimated variance component; ΦST, fixation index analogous to FST for dominant markers. * p < 0.001.
Disclaimer/Publisher’s Note: The statements, opinions and data contained in all publications are solely those of the individual author(s) and contributor(s) and not of MDPI and/or the editor(s). MDPI and/or the editor(s) disclaim responsibility for any injury to people or property resulting from any ideas, methods, instructions or products referred to in the content.