1. Introduction
Urbanization is one of the main drivers of landscape transformation and an increasing threat to biodiversity because it reduces, fragments, and simplifies natural habitats [
1,
2]. In this context, birds are widely used to evaluate the effects of urbanization because they are sensitive to changes in habitat structure and perform ecological functions such as seed dispersal, insect control, and organic matter recycling [
3,
4].
Urban parks can serve as biodiversity refuges within highly modified matrices. However, their ecological value does not depend only on size or the amount of green area, but also on the structural complexity and vegetation composition they contain. Previous studies have shown that bird richness and composition respond to attributes such as tree cover, the presence of shrub and herbaceous layers, floristic diversity, and vegetation-related resource availability [
2,
5,
6,
7].
In Latin America, research on urban birds has grown considerably, but information gaps remain for arid and intermediate cities. In Peru, most studies have focused on inventories, urbanization gradients, or broad associations with vegetation cover [
8,
9,
10]. Few studies have jointly evaluated how floristic composition, vegetation structure, and habitat heterogeneity simultaneously influence the taxonomic and functional diversity of bird communities.
This limitation is particularly relevant in arid cities such as Arequipa, where urban parks constitute some of the main green spaces available for wildlife. Previous studies have shown that parks with greater vegetation cover and better internal structure can harbor more diverse bird communities [
9,
11]. However, it remains unclear which vegetation attributes best explain patterns of bird richness, composition, and functional diversity.
In addition to spatial differences among parks, bird activity can vary throughout the day, modifying patterns of abundance, diversity, and community composition because of changes in behavior, resource availability, and human disturbance [
12]. Incorporating this temporal dimension allows a more precise understanding of how birds use urban green spaces.
Therefore, this study aimed to evaluate the relationship between urban vegetation structure and composition and the taxonomic and functional diversity of birds in parks of metropolitan Arequipa, while also considering variation among daily time periods. We hypothesized that parks with greater structural complexity and floristic diversity support more diverse, functionally heterogeneous, and taxonomically differentiated bird communities, whereas abundance, diversity, and composition vary among time periods owing to daily changes in bird activity and detectability.
2. Materials and Methods
2.1. Study Area and Selection of Urban Parks
The study was conducted in urban parks of metropolitan Arequipa, a city located in southern Peru within an arid Andean context. The metropolitan area includes 21 districts and covers approximately 50,246 ha, with elevations between 2041 and 2810 m a.s.l. The city is located in a valley crossed by the Chili River, where urban parks, remaining agricultural countryside, and other irrigated green spaces form a heterogeneous network of habitats within a predominantly urban matrix.
Arequipa has an arid climate, with low annual precipitation of approximately 95 mm, high solar radiation, and a strong dependence on irrigation for the maintenance of urban green areas. Mean annual temperatures fluctuate approximately between 7 °C and 22 °C, with a warmer period from November to March and a colder period from June to July. Rainfall is scarce and concentrated mainly during the wet season, whereas relative humidity generally ranges from 20% to 80%, with lower values during the dry season.
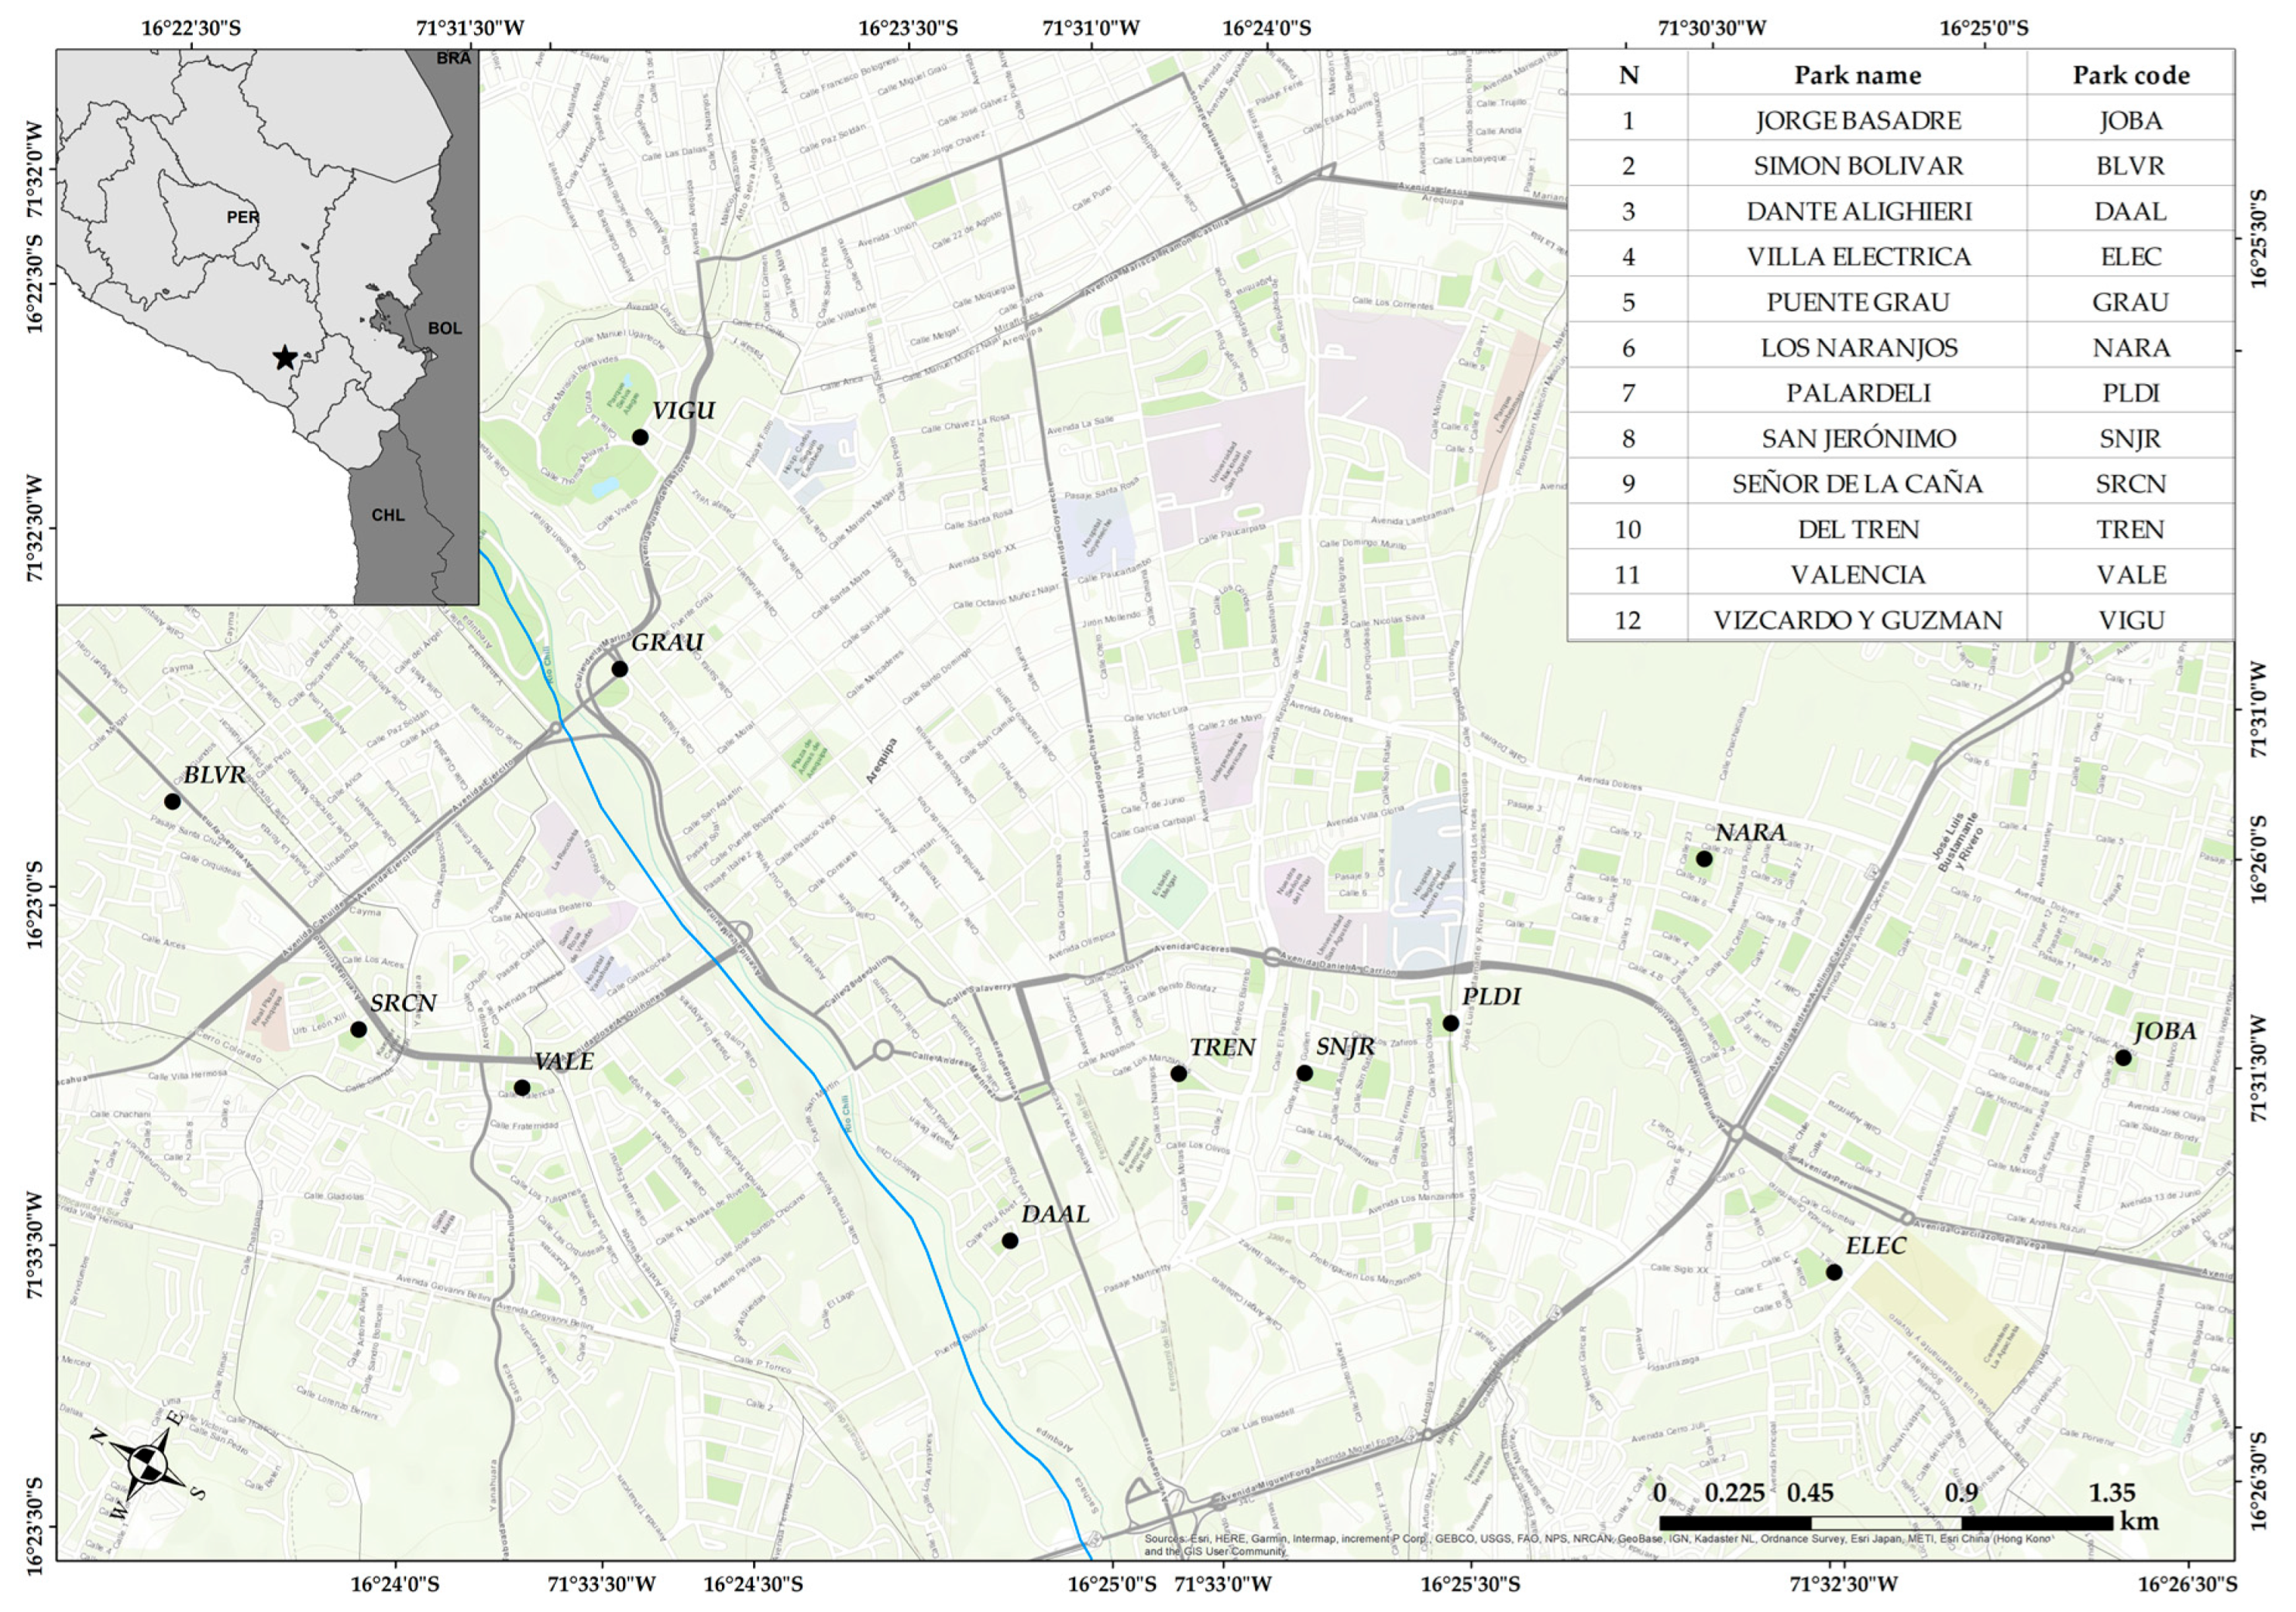
The study included 12 urban parks in which both bird surveys and vegetation assessments were conducted. These parks were selected based on suitable access conditions and municipal authorization and represented a gradient of park size, green area proportion, paved cover, plant richness, vegetation structure, and floristic composition. Restricting the study to parks with both biological and habitat data allowed direct evaluation of the relationships between vegetation attributes and bird diversity (
Figure 1).
2.2. Characterization of Urban Vegetation
Park vegetation was characterized using variables of cover, structure, and floristic composition. For each park, we recorded total area, green area proportion, paved area proportion (green area was defined as the proportion of the park surface covered by vegetation, whereas paved area represented built or paved surfaces. These variables therefore describe vegetated and paved cover rather than general permeable and impermeable surface categories), plant species richness by stratum (tree, shrub, and herbaceous), cover by vegetation stratum, total number of plant families, and number of families by stratum. Green area and paved area were treated as complementary proportions; therefore, to avoid statistical redundancy, green area proportion was used as the main predictor in the analyses.
In addition, we built a presence–absence matrix of plant species by park to represent floristic composition. From the full floristic inventory, we estimated total plant richness, richness by growth habit, richness by biogeographic origin, and the proportion of native and introduced species. This information allowed us to characterize floristic heterogeneity among parks and evaluate its relationship with bird alpha, beta, and functional diversity.
2.3. Bird Sampling
Birds were surveyed using 15-min point counts [
13] with predefined radii ranging from 25 to 50 m. The radius assigned to each point depended on the dimensions and geometry of its sampling sector, with the aim of covering the sector as completely as possible. Each park was divided into three or four sectors that jointly represented the park area, including vegetated, open, and paved surfaces. One point was established within each sector, and distances between neighboring points generally ranged from 50 to 100 m. Points within a park were surveyed simultaneously by different observers, and point locations and radii were adjusted to reduce spatial overlap while maintaining coverage of the park.
During each count, observers recorded species identity and the number of individuals detected. Double counting was minimized through coordination among observers and by checking movements of birds between adjacent sectors. At the end of each survey, the numbers recorded at the different points were summed by species. Therefore, individual points were treated as spatial subsamples of the same park survey and not as independent replicates. The resulting analytical unit was the integrated abundance of each species for a given park, date, and time period.
Surveys were conducted during three time periods: morning (06:00–08:00 h), noon (11:00–13:00 h), and afternoon (16:00–18:00 h). Noon surveys were intentionally included to evaluate daily variation in recorded richness, abundance, diversity, and community composition rather than solely to maximize bird detections. Because the three time periods were not always surveyed on the same calendar date, individual parks accumulated between 8 and 14 distinct survey dates (
Table S1 in the Supplementary Materials). Overall, 291 park × date × time-period units were analyzed. The survey period extended from September to December 2024, corresponding to months preceding the main rainy season and with intermediate environmental conditions of humidity and temperature. Survey dates were considered temporal replicates. The three daily periods were applied consistently across parks, but differences among periods were interpreted as variation in recorded bird activity and detectability rather than direct changes in the absolute number of birds present.
2.4. Bird Functional Traits
To complement the taxonomic analysis, we built a functional trait matrix for the recorded bird species. We included morphometric and ecological traits, including body mass, total length, bill length, bill width, bill depth, wing length, tarsus length, tail length, Kipp’s distance, and hand-wing index. We also included categorical traits related to local origin, trophic guild, main diet, foraging stratum, mobility, water dependence, and urban tolerance.
Morphometric traits were obtained primarily from local records of the Natural History Museum of the Universidad Nacional de San Agustín de Arequipa (MUSA-UNSA). When a species or trait was unavailable in the local database, information was complemented using AVONET, a global database of morphological, ecological, and geographic traits of birds [
14]. Ecological traits related to diet and foraging stratum were checked and complemented by the authors using bibliographic information, including EltonTraits 1.0 [
15].
2.5. Statistical Analyses
2.5.1. Alpha Diversity and Inventory Completeness
From the bird abundance matrix, we calculated total abundance, observed species richness, and Shannon diversity for each park × date × time-period unit. For park-level summaries, abundances were summed by species before calculating the same metrics. Shannon diversity was selected as the principal composite alpha-diversity metric because it incorporates both species richness and relative abundance and is sensitive to changes in community evenness without assigning the same influence to rare records as richness alone. These calculations were performed using functions from the
vegan package (2.7-5) [
16].
Inventory completeness was evaluated using the Chao1 non-parametric richness estimator. In addition, rarefaction and extrapolation curves were generated to compare sampling completeness among parks following the Hill-number and sample-coverage framework [
17]. These analyses were performed with the
iNEXT package (3.0.2) [
18].
2.5.2. Dimensionality Reduction in Vegetation Attributes
To reduce structural heterogeneity in vegetation, we applied principal component analysis (PCA). Continuous vegetation variables were standardized beforehand. Redundancy among predictors was evaluated using Pearson correlations, and highly correlated variables were removed when |r| > 0.70. We then calculated the variance inflation factor (VIF) and removed variables with VIF > 5 to reduce collinearity in subsequent analyses.
The PCA was applied to eight standardized vegetation variables retained after the correlation and VIF screening: park area, green area proportion, tree richness, herbaceous richness, shrub cover, herbaceous cover, cumulative vegetation cover across strata, and number of shrub families. The PCA scores were used as synthetic descriptors of vegetation structure, and each axis was interpreted from the magnitude and direction of the original-variable loadings. PC1 and PC2 were used in the main candidate models because they represented the principal interpretable gradients associated with park size, tree-shrub structure, and shrub-herbaceous vegetation cover. PC3 was retained for descriptive interpretation but was not included in the principal models.
2.5.3. Models of Bird Richness, Abundance, and Diversity
Generalized linear mixed models were fitted to evaluate the effects of vegetation and time period on bird richness, total abundance, and Shannon diversity. Richness was modeled using a Poisson distribution, total abundance using a negative binomial distribution, and Shannon diversity using a Gaussian distribution. In all cases, park was included as a random effect to account for non-independence among repeated surveys within parks. Models were fitted with the
glmmTMB package (1.1.14) [
19].
Candidate models represented separate vegetation hypotheses. Raw vegetation variables, vegetation PCA scores, floristic ordination scores, and floristic uniqueness were evaluated in alternative models and were not entered simultaneously into the same model. The raw-variable candidates included green area proportion, park area, total plant richness, and total number of plant families. The structural-gradient candidate included PC1 and PC2 from the vegetation PCA. Floristic composition was represented by the first two axes of a PCoA based on Jaccard dissimilarity, whereas floristic uniqueness was calculated as the mean Jaccard dissimilarity of each park relative to all other parks. All models included time period, and park was included as a random intercept. Candidate models were compared using Akaike information criterion corrected for small sample size (AICc) with the
MuMIn package (1.48.19) [
20]. Model adequacy was evaluated using simulated residuals with the
DHARMa package (0.5.0) [
21]. Estimated marginal means and post hoc comparisons among time periods were obtained with
emmeans package (2.0.4), using Tukey adjustment for multiple comparisons [
22]. Model performance was checked with the performance package (0.17.1) when necessary [
23].
2.5.4. Bird Community Composition
Bird community composition was evaluated using abundance matrices. To reduce the influence of extremely abundant species, abundances were Hellinger-transformed before ordination analyses. Bray–Curtis dissimilarity among samples was calculated [
24], and non-metric multidimensional scaling (NMDS) was used to represent community composition patterns.
To test differences in bird composition among time periods, we applied permutational multivariate analysis of variance (PERMANOVA) using the
adonis2 function from
vegan package (2.7-5) [
16,
25]. Because surveys were temporally repeated within parks, permutations were restricted by park. To evaluate the effect of vegetation attributes on accumulated bird composition at park scale, we performed a park-level PERMANOVA using green area proportion, total park area, and the main vegetation components derived from the PCA as predictors. Environmental vectors were fitted onto the ordination using the
envfit function to identify the vegetation gradients most strongly associated with compositional variation.
2.5.5. Bird Functional Diversity
Functional diversity was calculated from the functional trait matrix and bird abundance matrices. Because the trait matrix included continuous and categorical variables, we used Gower distance, which is appropriate for mixed data [
26]. Functional indices were calculated with the
FD package (1.0-12.5) using the
dbFD function [
27,
28].
We estimated functional richness (FRic), functional evenness (FEve), functional divergence (FDiv), functional dispersion (FDis), and Rao’s quadratic entropy (RaoQ). FRic, FEve, and FDiv indicate the functional space occupied by the community, whereas FDis and RaoQ were treated as abundance-weighted metrics [
27,
29,
30]. We also calculated community-weighted means (CWM) for morphometric traits and abundance-weighted functional proportions for categorical traits such as diet, foraging stratum, origin, and urban tolerance.
2.5.6. Taxonomic Beta Diversity
Taxonomic beta diversity among parks was evaluated from the accumulated bird presence–absence matrix by park. We used the
betapart package (1.6.1) to decompose total Sørensen dissimilarity into species turnover and nestedness components [
31,
32]. In addition, Bray–Curtis dissimilarity was calculated from abundances to evaluate differences in the quantitative structure of communities. Principal coordinates analysis (PCoA) was used to represent taxonomic dissimilarity among parks. To evaluate whether parks with more distinct vegetation compositions also had more differentiated bird communities, Mantel tests with Spearman correlation were applied between bird dissimilarity matrices and floristic or vegetation-attribute dissimilarity matrices [
33]. Finally, homogeneity of multivariate dispersion among groups of parks defined by vegetation gradients was evaluated using
PERMDISP to distinguish compositional differences from dispersion differences. All analyses were conducted in R (4.6.0) [
34].
3. Results
3.1. Recorded Avifauna and Vegetation Characterization of Urban Parks
We recorded 21 bird species in the 12 urban parks evaluated in metropolitan Arequipa, with a total of 17,591 individuals counted across 291 surveys (
Table S2 in the Supplementary Materials). Accumulated richness per park ranged from 4 to 12 species, with an average of 9.5 species per park. The richest parks were Villa Eléctrica (ELEC), Jorge Basadre (JOBA), and Vizcardo y Guzmán (VIGU), with 12 species each, whereas Simón Bolívar (BLVR) had the lowest richness, with four species (
Table 1).
Total abundance was concentrated in a few parks. Villa Eléctrica (ELEC) had the highest accumulated abundance, with 3194 individuals, followed by Jorge Basadre (JOBA), with 3022 individuals, and Vizcardo y Guzmán (VIGU), with 2304 individuals. In contrast, Del Tren (TREN) had the lowest accumulated abundance, with 715 individuals. The most abundant species were Turdus chiguanco, with 4823 individuals; Columba livia, with 4012; Zonotrichia capensis, with 2729; Zenaida auriculata, with 1871; and Columbina cruziana, with 1867 individuals. These species accounted for most records, indicating a community dominated by a few species frequent in urban environments.
Accumulated Shannon diversity per park ranged from 1.36 to 1.97. The highest values were recorded in Del Tren (TREN), Palardelli (PLDI), and Dante Alighieri (DAAL), whereas the lowest values corresponded to Simón Bolívar (BLVR) and Valencia (VALE). Inventory completeness was high, averaging 97.7% according to Chao1. Only Grau (GRAU), Palardelli (PLDI), and Vizcardo y Guzman (VIGU) had completeness below 95% (
Table 1).
The floristic characterization of the parks recorded 157 plant species (
Table S3 in the Supplementary Materials), with an average of 29.25 species per park and a range of 17 to 42 species. Of all recorded plant species, 15.3% were native to Peru, indicating an urban flora dominated mainly by introduced or ornamental species. San Jeronimo (SNJR) had the highest plant richness, with 42 species, followed by Del Tren (TREN), Palardelli (PLDI), and Villa Eléctrica (ELEC).
Among the 12 parks with bird surveys, total area ranged from 0.29 to 3.67 ha, with a mean of 0.82 ha. Green area proportion ranged from 0.62 to 0.93, with a mean of 0.79. Total plant richness ranged from 17 to 42 species per park, and the total number of plant families ranged from 14 to 27. San Jerónimo (SNJR) had the highest plant richness, with 42 species and 27 families, followed by Del Tren (TREN) and Palardelli (PLDI). Simón Bolívar (BLVR) had the lowest plant richness, with 17 species and 14 families. By strata, Palardelli (PLDI) stood out for its high tree richness, whereas San Jerónimo (SNJR) and Del Tren (TREN) had the highest herbaceous richness values (
Table 2).
3.2. Gradients of Vegetation Structure and Composition
The principal component analysis summarized the main gradients of vegetation heterogeneity among parks. The first two components explained 48.0% of the total variation in vegetation attributes, whereas the first three reached 67.7%. PC1 explained 27.5% of the variation and was mainly associated with park area, tree richness, number of shrub families, and shrub cover. This axis was interpreted as a gradient of park size and tree-shrub structure. Low PC1 values characterized larger parks with greater tree richness and shrub-family diversity, whereas high values corresponded to parks with greater shrub cover but a lower representation of the tree component.
PC2 explained 20.5% of the variation and was associated with cumulative vegetation cover by strata, herbaceous richness, shrub cover, shrub families, herbaceous cover, and green area proportion. This axis was interpreted as a gradient of shrub-herbaceous vegetation cover. Low PC2 values represented parks with greater cumulative vegetation cover by strata and a stronger shrub-herbaceous component, whereas high values were associated with parks with a higher green proportion but more open or simplified vegetation (
Table 3).
PC3 explained 19.7% of the variation. Positive PC3 values were associated mainly with greater herbaceous cover and a higher number of shrub families, whereas negative values were associated with a higher green area proportion and greater tree richness. This axis therefore represented a contrast between parks with a stronger herbaceous-shrub component and parks with a greater proportion of green area and a more developed tree component. PC3 was used to complete the ecological description of vegetation variation but was not included in the principal bird-diversity models.
3.3. Time-Period Variation and Alpha-Diversity Response of the Bird Community
Estimated richness was similar across the three time periods. Estimated marginal means were 6.15 species in the morning, 6.07 at noon, and 5.80 in the afternoon. Pairwise comparisons among time periods were not significant: morning-noon, p = 0.971; morning-afternoon, p = 0.578; and noon-afternoon, p = 0.720. This indicates that the number of detected species remained relatively stable throughout the day.
Total abundance decreased toward the afternoon. Estimated marginal means were 57.0 individuals in the morning, 53.6 at noon, and 48.5 in the afternoon. The difference between morning and afternoon was significant, with an abundance ratio of 1.18 and
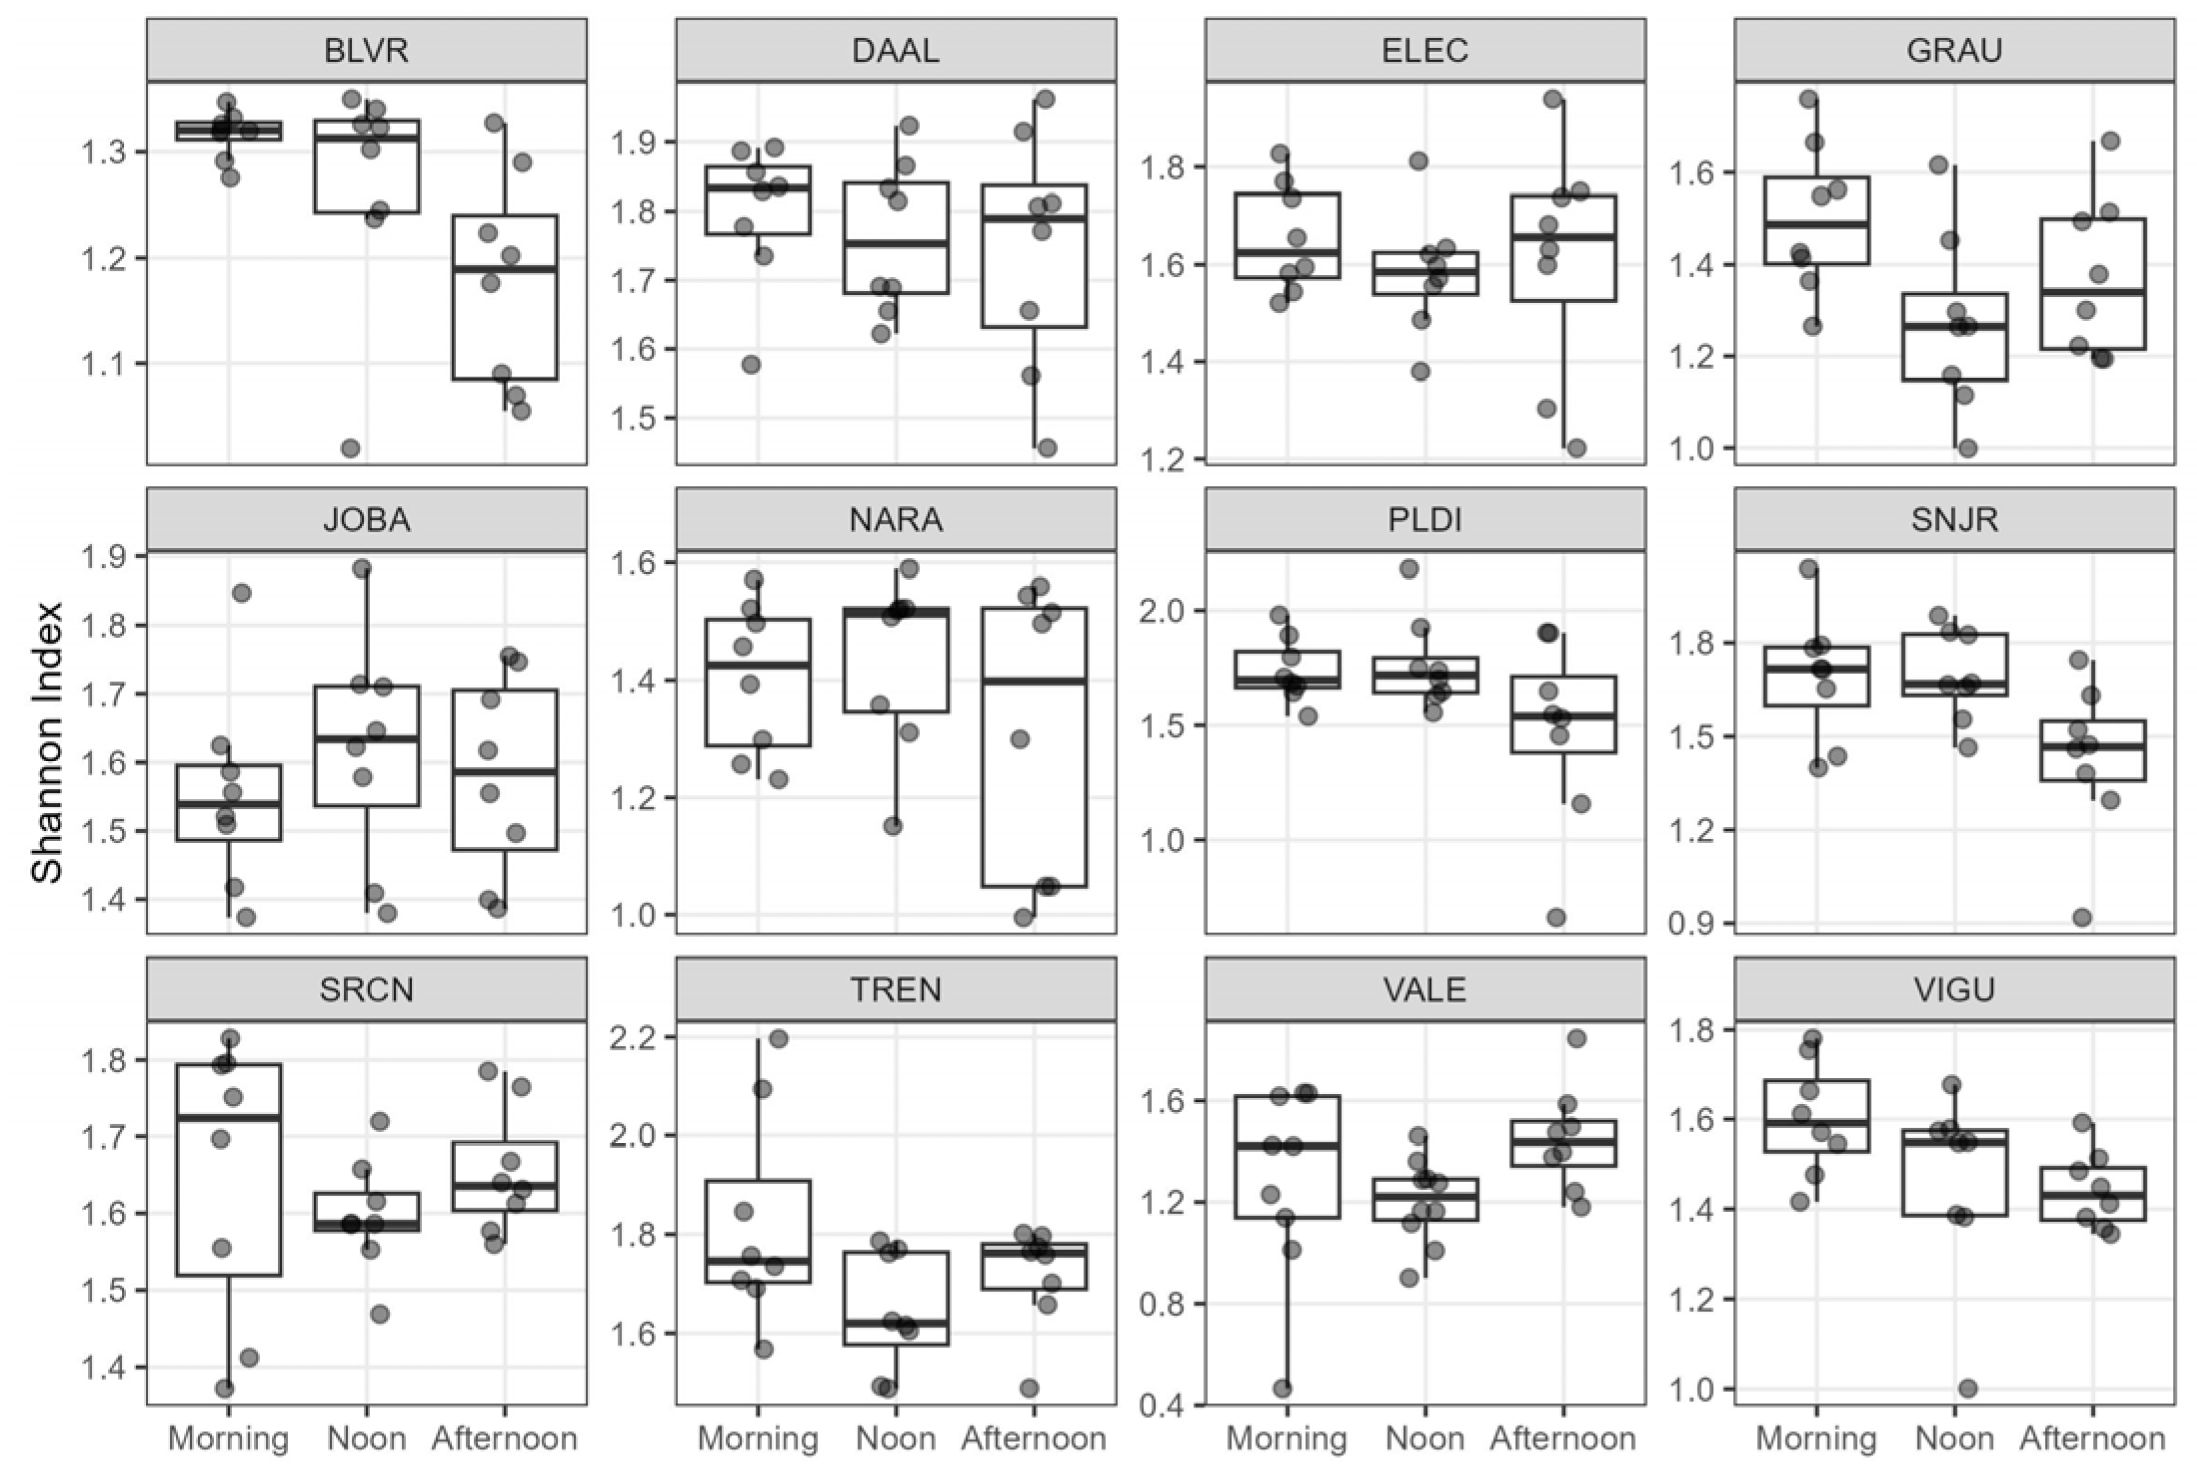
p = 0.0031. In contrast, no significant differences were observed between morning and noon or between noon and afternoon. Shannon diversity also declined during the day (
Figure 2). Estimated values were 1.58 in the morning, 1.52 at noon, and 1.50 in the afternoon. The comparison between morning and afternoon was significant, with an estimated difference of 0.087 and
p = 0.0034, whereas the comparison between morning and noon was marginal, with
p = 0.058.
Mixed models showed that bird richness responded mainly to integrated vegetation gradients rather than to time period. The best model for richness included time period and the first two vegetation PCA axes. The effect of the park-size and tree-shrub structure gradient was negative and significant (β = −0.0688 ± 0.0241, z = −2.86,
p = 0.0043), and the effect of the shrub-herbaceous vegetation cover gradient was stronger (β = −0.1546 ± 0.0279, z = −5.54,
p < 0.001). Therefore, richness was higher in parks tending toward low values of both gradients, associated with larger size, greater tree richness, greater shrub-family diversity, and greater vegetation cover by strata (
Table 4).
For total abundance, the best model was a negative binomial GLMM that included time period and floristic uniqueness. Abundance was significantly lower in the afternoon than in the morning (β = −0.1614 ± 0.0494, z = −3.27,
p = 0.0011), whereas noon did not differ significantly from the morning. Floristic uniqueness showed a marginal negative effect (β = −0.2479 ± 0.1277, z = −1.94,
p = 0.0523), suggesting that parks with more singular plant composition tended to have lower total bird abundance (
Table 4).
For Shannon diversity, the best model included time period and the total number of plant families. Diversity was lower at noon (β = −0.0612 ± 0.0268, z = −2.28,
p = 0.022) and in the afternoon (β = −0.0874 ± 0.0270, z = −3.24,
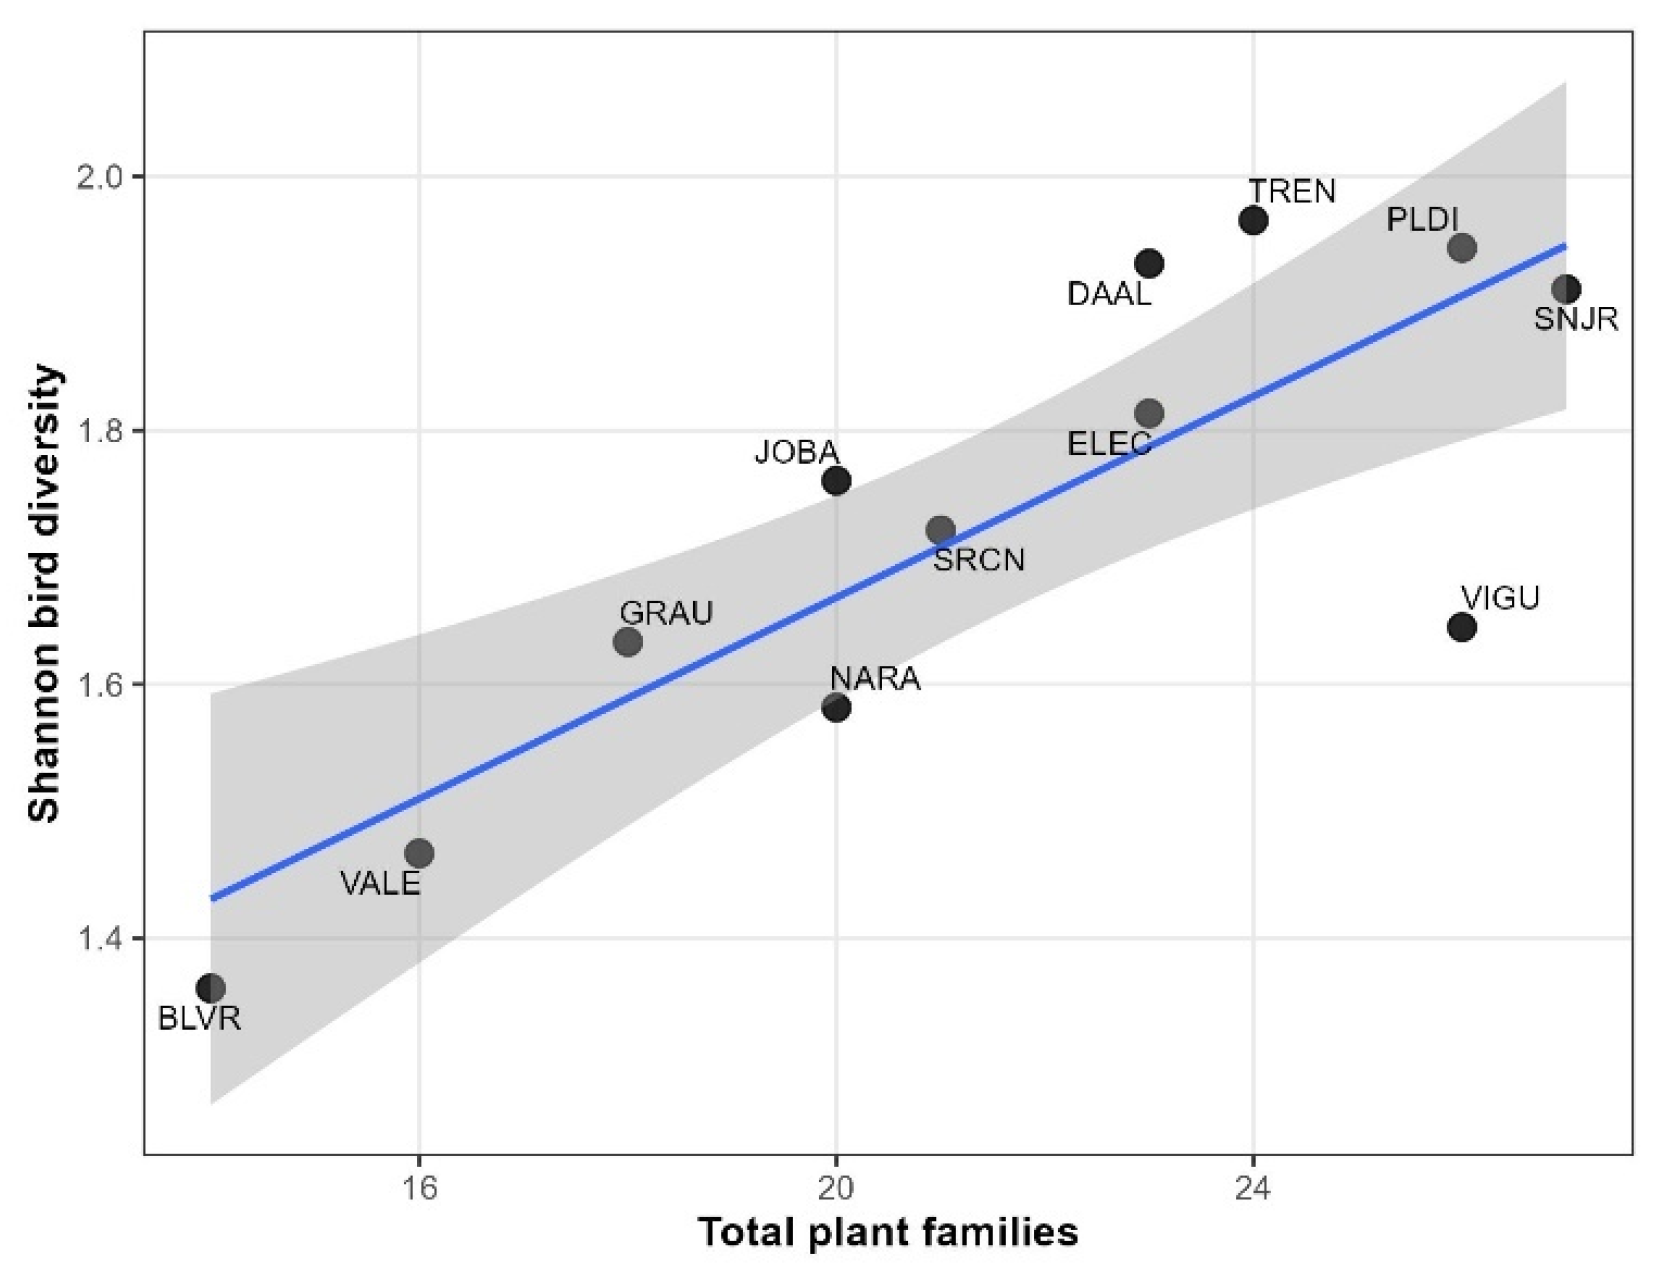
p = 0.0012) than in the morning. The total number of plant families had a positive and highly significant effect on Shannon diversity (β = 0.1234 ± 0.0303, z = 4.08,
p < 0.001), (
Figure 3) indicating that parks with greater plant taxonomic diversity supported more diverse bird communities that were less dominated by a few species (
Table 4).
3.4. Community Composition and Vegetation Gradients
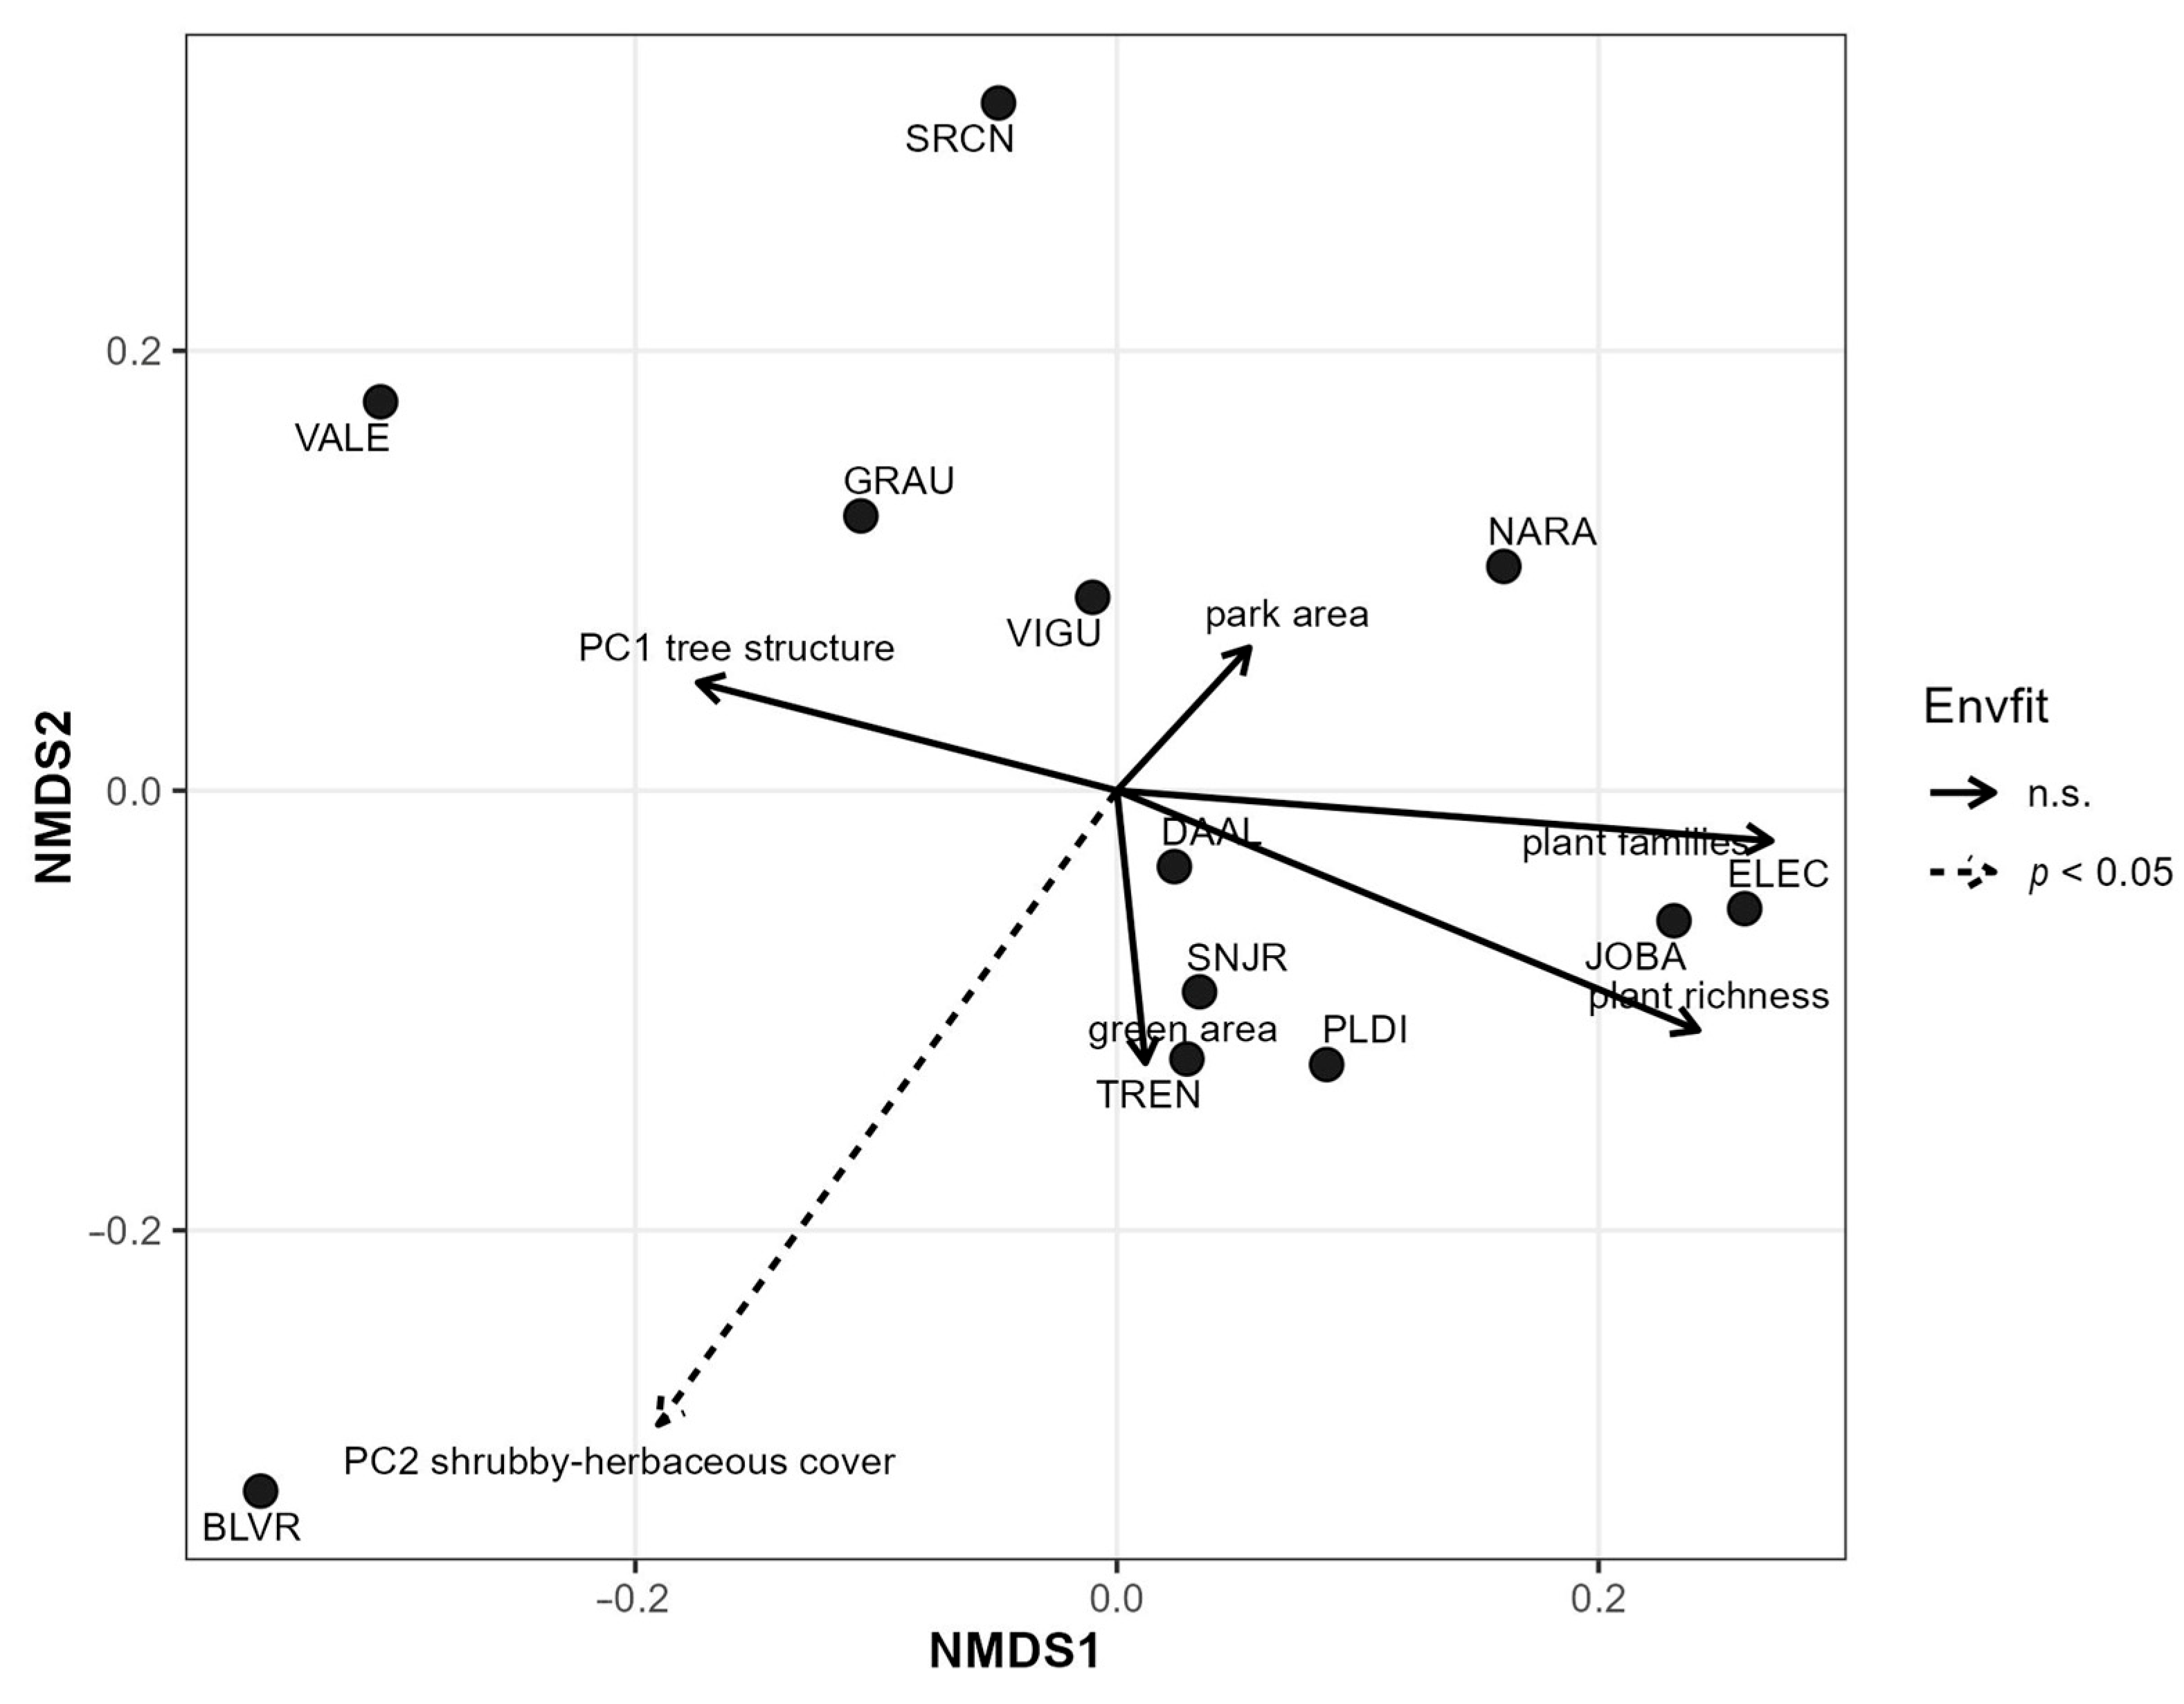
The NMDS based on accumulated bird composition by park had a stress value of 0.127. The ordination showed broad overlap among groups defined by vegetation gradient PC1; therefore, the evaluated parks did not form clearly separated groups along this gradient. Instead, their bird communities partially overlapped, suggesting that species composition changed gradually among parks.
The PERMANOVA restricted by park showed that bird composition varied significantly among time periods (F = 2.61, R2 = 0.0178, p = 0.001). However, time period explained only a small fraction of the total variation. At park scale, PERMANOVA showed that the park-size and tree-shrub structure gradient explained a significant fraction of the compositional variation in birds (R2 = 0.1816, F = 2.23, p = 0.041), whereas the shrub-herbaceous vegetation cover gradient showed a marginal trend (R2 = 0.1646, F = 2.02, p = 0.100). Green area proportion was not significant (R2 = 0.0352, p = 0.888), nor was total park area (R2 = 0.0987, p = 0.362).
Fitting environmental vectors onto the accumulated park-level NMDS identified the shrub-herbaceous vegetation cover gradient as the predictor most strongly associated with the bird community ordination (R
2 = 0.6017,
p = 0.024). Total plant richness and the number of plant families showed moderate but non-significant associations. These results indicate that bird composition responds more clearly to integrated vegetation gradients than to simple variables such as total area or green area proportion (
Figure 4).
3.5. Taxonomic and Functional Differentiation Among Parks
Taxonomic beta diversity among parks was high. Total Sørensen dissimilarity reached βSOR = 0.654. The species turnover component was greater (βSIM = 0.450) than the nestedness component (βSNE = 0.205). Thus, turnover explained approximately 68.8% of total beta diversity, whereas nestedness accounted for 31.3%. This indicates that differences among parks were determined mainly by replacement of species among communities, rather than only by species loss or gain among parks with different richness.
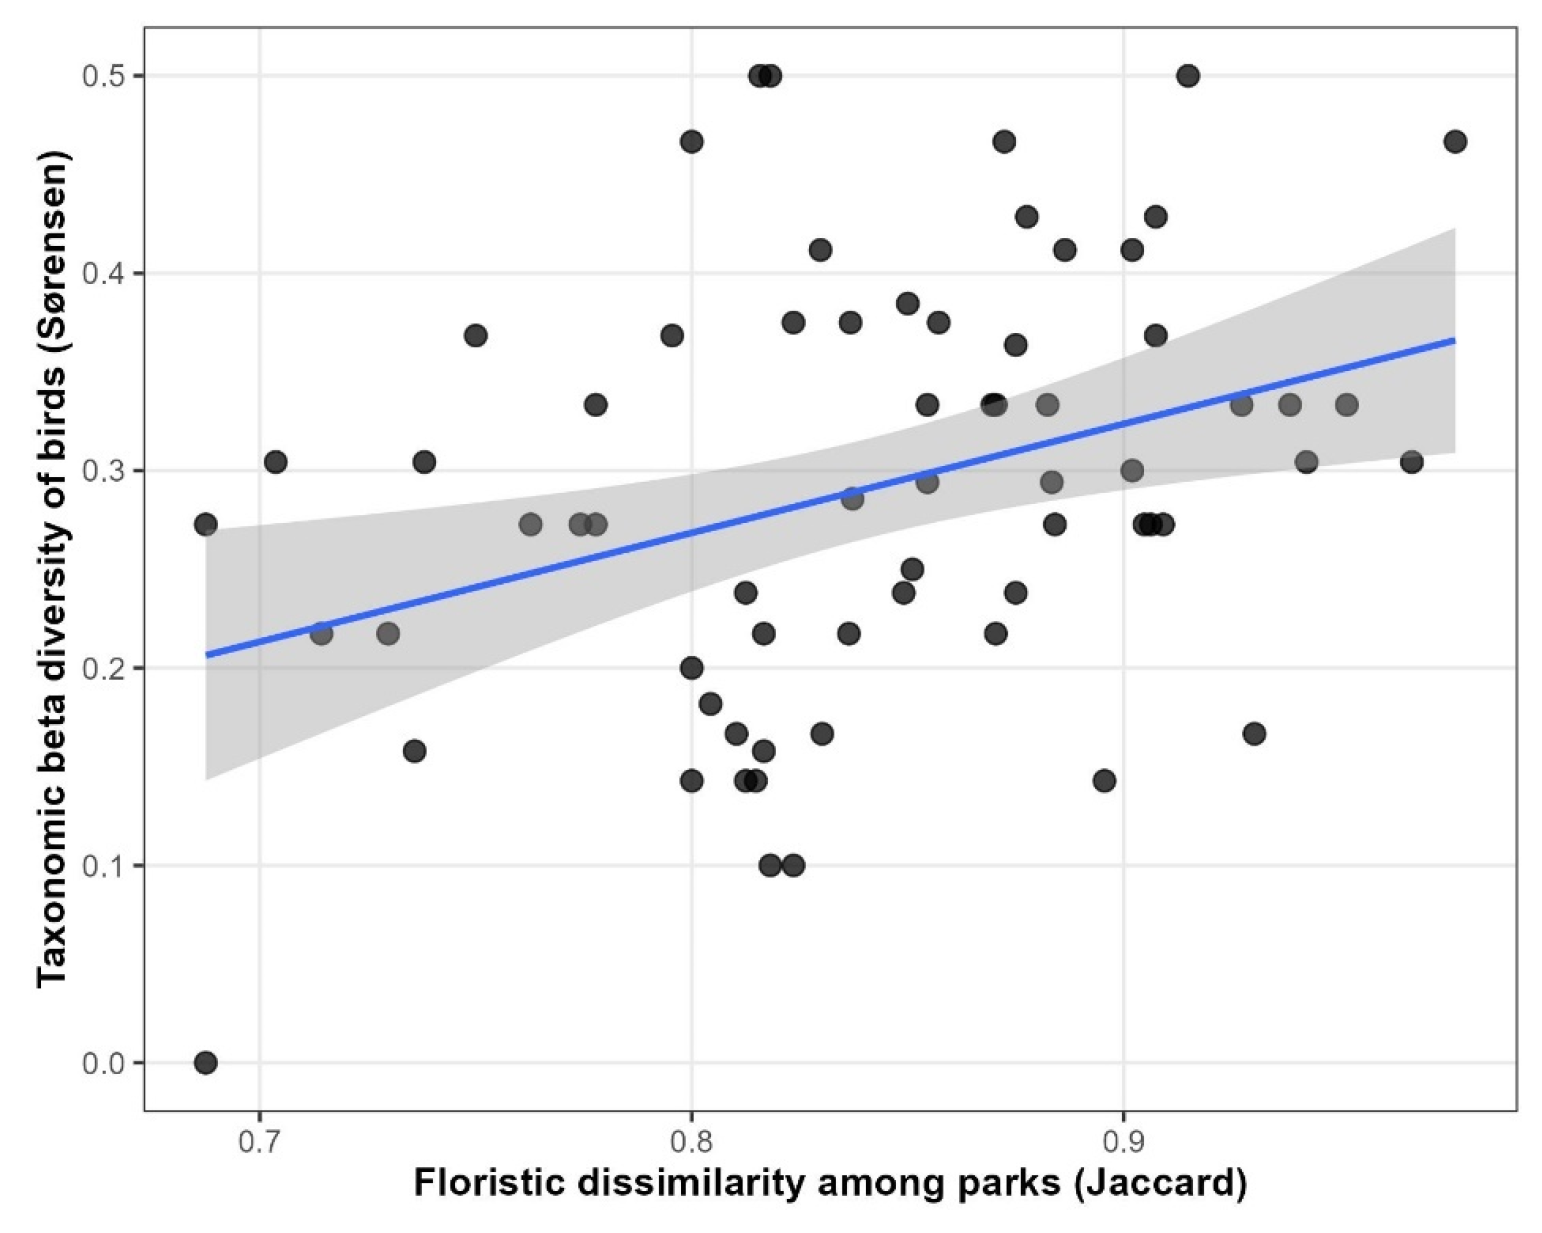
Floristic dissimilarity among parks was positively related to bird taxonomic beta diversity based on presence–absence. The Mantel test showed a significant correlation between floristic dissimilarity of vegetation, measured with Jaccard, and bird dissimilarity based on Sørensen (ρ = 0.3403,
p = 0.033). In contrast, floristic dissimilarity was not related to Bray–Curtis abundance dissimilarity of birds (ρ = −0.0999,
p = 0.732). Multivariate distance in vegetation attributes was also not significantly related to Sørensen bird beta diversity (ρ = 0.2531,
p = 0.120) or Bray–Curtis dissimilarity (ρ = −0.0576,
p = 0.617;
Figure 5).
Homogeneity of compositional dispersion among groups defined by vegetation gradient PC1 did not differ significantly (F = 0.0263, p = 0.969). Therefore, the observed compositional differences were not associated with unequal dispersion among park groups.
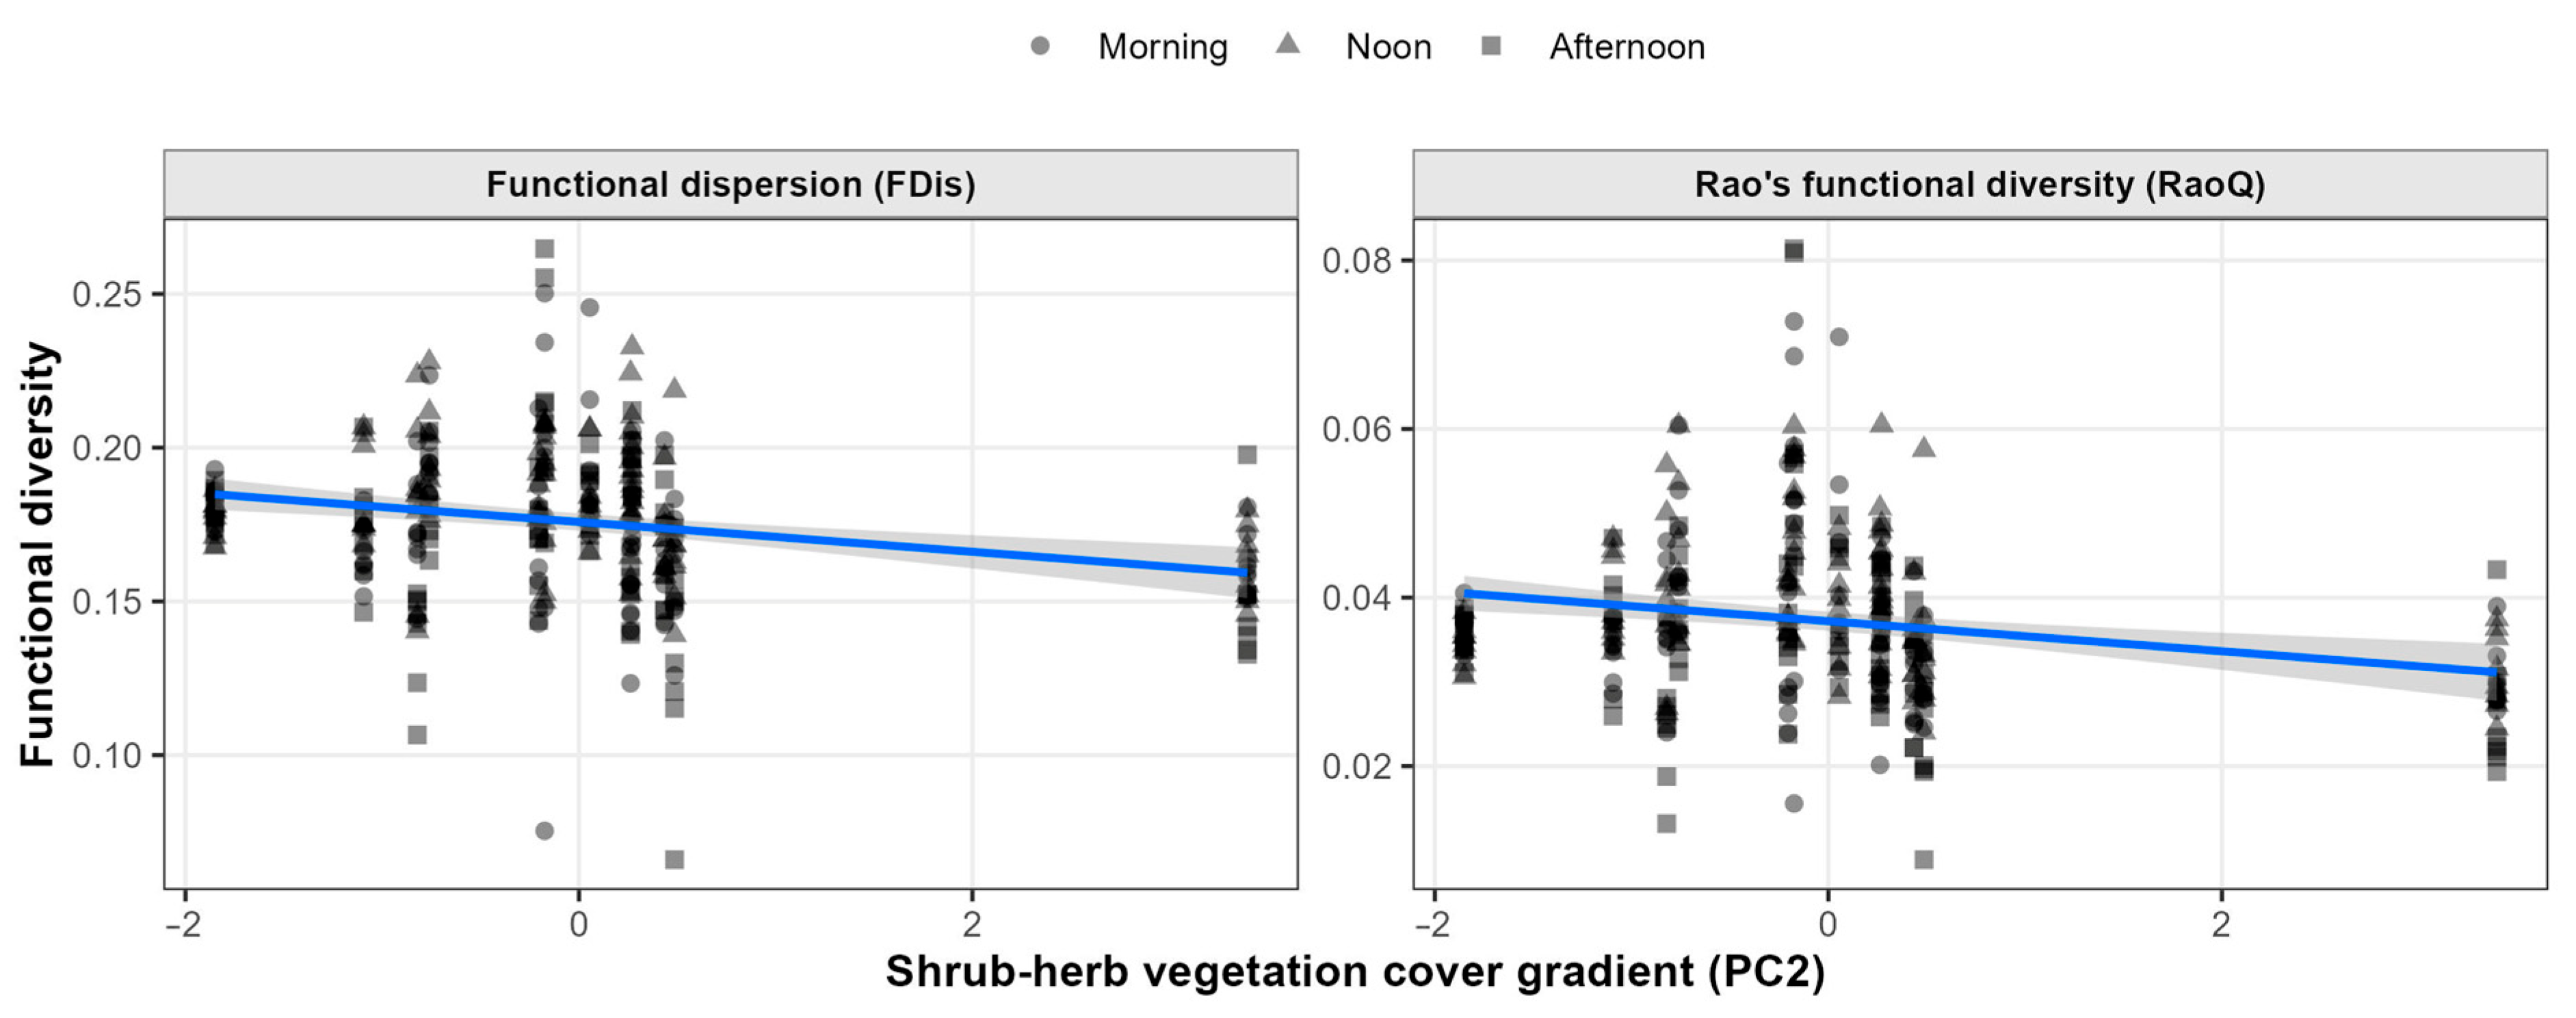
Functional analyses showed a complementary response to vegetation gradients. At the survey scale, the best model for functional dispersion included time period and the shrub-herbaceous vegetation cover gradient. This gradient had a negative and significant effect on FDis (β = −0.0057 ± 0.0025, z = −2.22,
p = 0.0262), indicating that functional dispersion decreased toward high values of vegetation PC2. Because low values of this gradient represent parks with greater cumulative vegetation cover and a stronger shrub-herbaceous component, this result suggests that vegetation cover and complexity favor functionally more dispersed communities (
Figure 6).
A similar pattern was observed for RaoQ. The shrub-herbaceous vegetation cover gradient had a significant negative effect (β = −0.0027 ± 0.0013, z = −2.02,
p = 0.0433), reinforcing the relationship between vegetation structure and abundance-weighted functional differentiation. The time-period effect on functional indices was weaker. For FDis, only the noon-afternoon comparison was significant (difference = 0.0071,
p = 0.0269). For RaoQ, a difference was also observed between noon and afternoon (difference = 0.0027,
p = 0.0350) (
Figure 6).
At park scale, functional relationships with vegetation were similar but had lower statistical significance. FDis showed a marginal negative relationship with the shrub-herbaceous vegetation cover gradient (β = −0.0054 ± 0.0025, R2 = 0.322, p = 0.0544), whereas RaoQ showed a similar trend (β = −0.0027 ± 0.0014, R2 = 0.273, p = 0.0815). In contrast, functional richness did not show a clear relationship with vegetation predictors, because the null model was selected as the best model for FRic.
4. Discussion
The results of this study show that bird communities in urban parks of Arequipa respond to vegetation at several levels of ecological organization. The structure of trees, shrubs, and herbaceous vegetation was related to local richness, plant-family diversity was associated with a more balanced bird community, floristic composition contributed to species turnover among parks, and shrub-herbaceous vegetation cover was linked to greater functional differentiation. This pattern reinforces the idea that urban green areas should not be evaluated only by their surface area or green cover proportion, but also by the ecological quality of their vegetation. In urban environments, vegetation can act as a local filter regulating the availability of food, shelter, perches, nesting sites, and microhabitats, especially in arid cities where these resources are naturally scarce [
2,
5,
35,
36].
The positive response of bird richness toward parks with larger size, greater tree richness, and stronger shrub-herbaceous development is consistent with a broadly documented trend in urban studies. Green-space area often favors richness because it increases habitat availability, reduces edge effects, and raises the probability of including different resource types [
2,
37,
38,
39]. However, our results indicate that area alone does not fully explain the community response. Richness was better associated with integrated vegetation gradients, suggesting that the internal organization of the park is as relevant as its size. This interpretation agrees with studies in urban parks of Asia and Latin America, where habitat heterogeneity, shrub cover, tree diversity, and structural complexity explain bird diversity better than simple measures of green area proportion [
6,
40,
41,
42].
The role of lower vegetation strata deserves particular attention. In many urban parks, ornamental management tends to favor lawns, isolated trees, and clean surfaces while reducing shrubs, spontaneous herbaceous vegetation, and dense patches. This simplification can reduce refuges, seeds, insects, and foraging substrates for birds using the understory or ground. In southern Chilean cities, shrub cover and native species in the shrub layer were important variables explaining bird diversity in urban green areas [
40]. Similarly, studies in Mexico and China have shown that combinations of trees, shrubs, and open areas favor more diverse communities, both taxonomically and functionally [
41,
42]. In Arequipa, where the urban matrix occurs in an arid context, these strata may have additional value by providing shade, higher local humidity, protection from disturbance, and resources for granivorous and insectivorous birds.
Shannon diversity responded to the total number of plant families, which allows plant taxonomic diversity to be interpreted as an indicator of resource variety rather than only as a floristic measure. Greater family diversity may reflect differences in plant architecture, phenology, and the supply of fruits, seeds, nectar, and associated insects. This relationship helps explain why some parks with moderate bird richness can sustain communities less dominated by a few species. Studies in green areas of San Cristóbal de Las Casas, Mexico, and in urban environments of Iquitos, Peru, have also found positive associations between bird diversity and vegetation attributes such as plant richness, tree presence, tree cover, and native species [
43,
44]. Thus, plant diversity can improve habitat quality by expanding resource availability for species with different ecological requirements.
Total bird abundance showed a less clear response to vegetation attributes. This result does not necessarily contradict the importance of vegetation; rather, it reflects a common feature of urban communities: abundance is often dominated by a few generalist, synanthropic, or disturbance-tolerant species [
5,
45,
46]. In these cases, abundance may be more strongly influenced by anthropogenic food, waste, human presence, irrigation, park maintenance, or temporary resource availability than by floristic composition in a strict sense [
12,
47]. The dominance of species such as
Columba livia,
Turdus chiguanco,
Zonotrichia capensis, and
Zenaida auriculata is consistent with this dynamic. These species have traits that facilitate persistence in modified environments, including trophic breadth, behavioral flexibility, use of infrastructure, and tolerance to human activity [
45,
46,
48].
The decrease in recorded abundance and Shannon diversity toward the afternoon indicates that time of day influenced either bird activity, park use, or detectability, although observed richness remained relatively stable. Noon surveys were included intentionally to test this temporal variation rather than solely to maximize species detection. Because detection probability was not estimated independently, differences among time periods should not be interpreted as direct changes in the absolute number of birds present. Instead, they describe variation in the birds recorded using the parks under standardized survey periods. Temperature, solar radiation, pedestrian activity, irrigation, and maintenance operations may contribute to these daily patterns [
12,
49].
Bird composition was more closely related to integrated vegetation gradients than to simple variables such as total area or green area proportion. This indicates that the community responds not only to how much green space a park contains, but also to the type of green space available. Urban ecology literature has shown that bird composition depends on the combination of local patch characteristics, connectivity with other green spaces, human disturbance, and landscape context [
10,
36,
50,
51]. In Latin American cities, where parks are embedded in heterogeneous matrices and managed under different regimes, bird responses may depend on specific local attributes such as tree cover, native vegetation, understory structure, water availability, and proximity to peri-urban areas [
10,
43,
52].
The evaluated parks should not be interpreted as closed ecological units. Several sites were relatively small and spatially close, and highly mobile birds may have used more than one park, as well as surrounding gardens, street trees, agricultural areas, and other elements of the urban matrix. Urban bird assemblages are shaped by both local habitat conditions and the composition and connectivity of the surrounding landscape [
50,
51]. Consequently, the communities recorded in this study represent local park use during each survey rather than isolated populations restricted to individual parks. The relationships detected with vegetation attributes therefore do not exclude the influence of movements among sites or broader landscape connectivity. This interpretation reinforces the need to manage urban parks as an interconnected network of habitats rather than as independent green-space units [
53,
54].
Species turnover was the dominant component of taxonomic beta diversity, indicating that parks did not function as ecologically redundant units. When beta diversity is driven mainly by turnover, differences among sites reflect the replacement of species rather than the progressive loss of species from richer assemblages [
31,
32]. Thus, parks with intermediate local richness may still make an important contribution to citywide diversity by supporting distinctive combinations of bird species. From a conservation perspective, this pattern indicates that prioritizing only the parks with the highest accumulated richness would not adequately represent the diversity of the urban bird assemblage.
The positive association between floristic dissimilarity and bird taxonomic dissimilarity is one of the main findings of this study. Parks with more distinct plant assemblages also tended to support more differentiated bird communities, suggesting that floristic composition contributes to ecological complementarity among urban green spaces. Plants provide differences in architecture, phenology, food resources, shelter, and microenvironmental conditions that can favor different bird species. The absence of a comparable relationship for abundance-based dissimilarity further suggests that floristic variation influenced species identity more clearly than the relative abundance of dominant urban birds. Urban planning should therefore avoid homogenizing parks through identical ornamental designs and should instead promote a connected network of structurally suitable but floristically varied green spaces [
50,
51,
53,
54].
The low proportion of native plant species in the evaluated parks raises an important discussion point. Although nativeness did not appear as the main predictor in the final models, its low representation may limit specialized resources for native birds and reduce the long-term ecological quality of parks. In cities, some bird species can use exotic plants as perches, shelter, or food, especially when native vegetation is scarce. Nevertheless, several studies show that native vegetation, particularly in shrub and tree strata, can favor greater bird diversity and improve habitat quality [
6,
40,
55]. In Arequipa, promoting native or arid-adapted plant species could increase resource availability for local birds and reduce dependence on homogeneous ornamental designs.
Functional diversity results provide further support, because the relationship between the shrub-herbaceous gradient and FDis and RaoQ indicates that vegetation complexity is associated with a functionally more differentiated community. This pattern suggests that parks with dense and more stratified vegetation allow the coexistence of species with different foraging strategies, mobility patterns, body sizes, bill shapes, and stratum use. Functional diversity is especially useful in urban environments because it evaluates changes in the ecological roles of species, not only changes in species number [
27,
29,
56]. Studies in Mexican green areas have shown that habitat heterogeneity can support not only greater taxonomic richness, but also greater functional and phylogenetic diversity [
41]. Therefore, urban bird conservation should consider the variety of ecological functions that parks can maintain, particularly through the inclusion of native plant species.
The lack of a clear response of FRic, compared with the more consistent response of FDis and RaoQ, may be explained by the dominance of generalist species and by the small size of the regional species pool in urban parks. Although functional richness describes the breadth of the trait space occupied by a community, it can be less sensitive when rare or low-abundance species define the extremes of that space. In contrast, FDis and RaoQ incorporate relative abundance and respond better to changes in the functional organization of dominant species [
27,
30]. This is relevant in urban landscapes, where habitat transformation may not immediately remove some functional traits but can alter which species and functions dominate the community [
45,
56].
In the context of Arequipa, these findings complement previous studies that highlighted the role of the Chili River, green area proportion, and park size in urban bird diversity [
9,
11]. Whereas those studies show the importance of the urban gradient and riparian connectivity, the present study emphasizes that the internal quality of vegetation is also decisive. A park close to ecological corridors can lose value if its vegetation is simplified, and a more interior park can support a relevant community if it maintains floristic diversity, tree cover, shrubs, and lower strata. This is consistent with evidence that internal park complexity can partially compensate for urban isolation and improve habitat availability for resident and migratory birds [
11,
53,
54].
From a management perspective, the results suggest that park planning in arid cities should go beyond increasing square meters of green area. In Arequipa, a biodiversity-oriented strategy should include larger trees, mixtures of native and climate-adapted species, shrubs, diverse herbaceous vegetation, dense vegetation patches, and reduction in unnecessary paved surfaces. It would also be advisable to avoid excessive pruning that eliminates vertical complexity, conserve less ornamental vegetation sectors, and promote connectivity among parks, countryside, and the Chili River. These measures agree with recommendations from other urban systems, where green-area design with greater structural heterogeneity and connectivity improves the ability of parks to sustain birds and other fauna groups [
2,
6,
36,
42].
Irrigation is also likely to influence the ecological functioning of urban parks in Arequipa. Within an arid urban matrix, irrigated vegetation can create oasis-like conditions by increasing the availability of shade, water, nectar, nesting sites, and plant productivity, resources that may otherwise be scarce in the surrounding landscape [
57]. These conditions may benefit native birds, but they may also favor widespread generalist and synanthropic species that readily exploit anthropogenic resources [
45,
46]. Because irrigation frequency, water consumption, and resource availability were not quantified, the present study cannot determine whether irrigation affected native and introduced species differently. Nevertheless, these considerations highlight the need to integrate biodiversity conservation with sustainable water management. Increasing habitat quality should prioritize native or arid-adapted plants and structurally diverse vegetation capable of providing resources for birds without requiring excessive irrigation [
40,
55].
Finally, the results should be interpreted within the temporal and spatial scope of the study. Sampling covered a defined seasonal period, and urban bird communities may vary during other stages of the annual cycle because of changes in breeding activity, seasonal movements, and resource availability [
10,
47]. Differences among daily time periods may also reflect variation in both bird activity and detectability. In addition, the evaluated parks were embedded within a connected urban matrix, so surrounding green spaces and movements among sites may have contributed to the communities recorded at each park [
50,
51]. Nevertheless, the repeated surveys conducted across the three daily periods, the high estimated inventory completeness, and the consistency of the taxonomic, compositional, and functional results provide a robust basis for identifying the vegetation relationships observed during the study period. Future year-round monitoring and the inclusion of irrigation and landscape-connectivity variables would help extend these findings.