Article

The Genetic Diversity of Old and Modern Accessions of Glycine max Revealed by Genotyping-by-Sequencing (GBS)


1
Research Center of Genetics and Life, Sirius University of Science and Technology, Sirius 354340, Russia
2
Federal Research Center All-Russian Institute of Plant Genetic Resources N.I. Vavilov, Saint Petersburg 190000, Russia
3
Institute of Cytology and Genetics of Siberian Branch of the Russian Academy of Sciences, Novosibirsk 630090, Russia
4
National Research Center “Kurchatov Institute”, 1 Kurchatov Square, Moscow 123182, Russia
*
Author to whom correspondence should be addressed.
Diversity 2026, 18(8), 480; https://doi.org/10.3390/d18080480
Submission received: 31 May 2026 / Revised: 31 July 2026 / Accepted: 31 July 2026 / Published: 10 August 2026
(This article belongs to the Special Issue Genetic Diversity, Breeding and Adaption Evolution of Plants)

Abstract

Soybean (Glycine max (L.) Merr.) is one of the most widely cultivated grain legumes worldwide. A genetic analysis of soybean samples around the world is essential for effective breeding programs and the development of genomic and marker-assisted selection. This study investigated the genetic diversity of soybean accessions from the VIR collection, one of the world’s largest seed banks. The sample consisted of 163 soybean (G. max) varieties. The study was conducted using Genotyping-by-Sequencing (GBS) technology. The aim of the study was to evaluate temporal changes in genetic diversity, population structure, and linkage disequilibrium in cultivated soybean. The material was divided according to two criteria: (1) three chronological groups of varieties, Group I (before 1959), Group II (1960–1989), and Group III (after 1990), and (2) regional characteristics. Linkage disequilibrium (LD) decay analysis revealed differences among chronological groups, with the longest LD decay distance observed in early accessions developed before 1959 and shorter LD decay distances in later groups. Nei’s gene diversity showed only slight differences among chronological groups, with a moderate decreasing trend in more recent accessions. Key loci were defined as SNPs showing the largest allele frequency differences between chronological groups and located within or near annotated genes. The results highlight the importance of comprehensive genomic analysis for the conservation and efficient utilization of genetic resources, as well as for the development of soybean breeding strategies in the future.

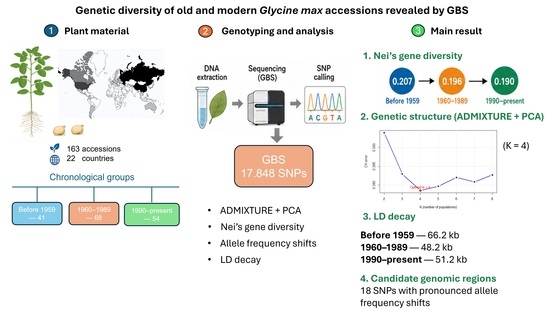
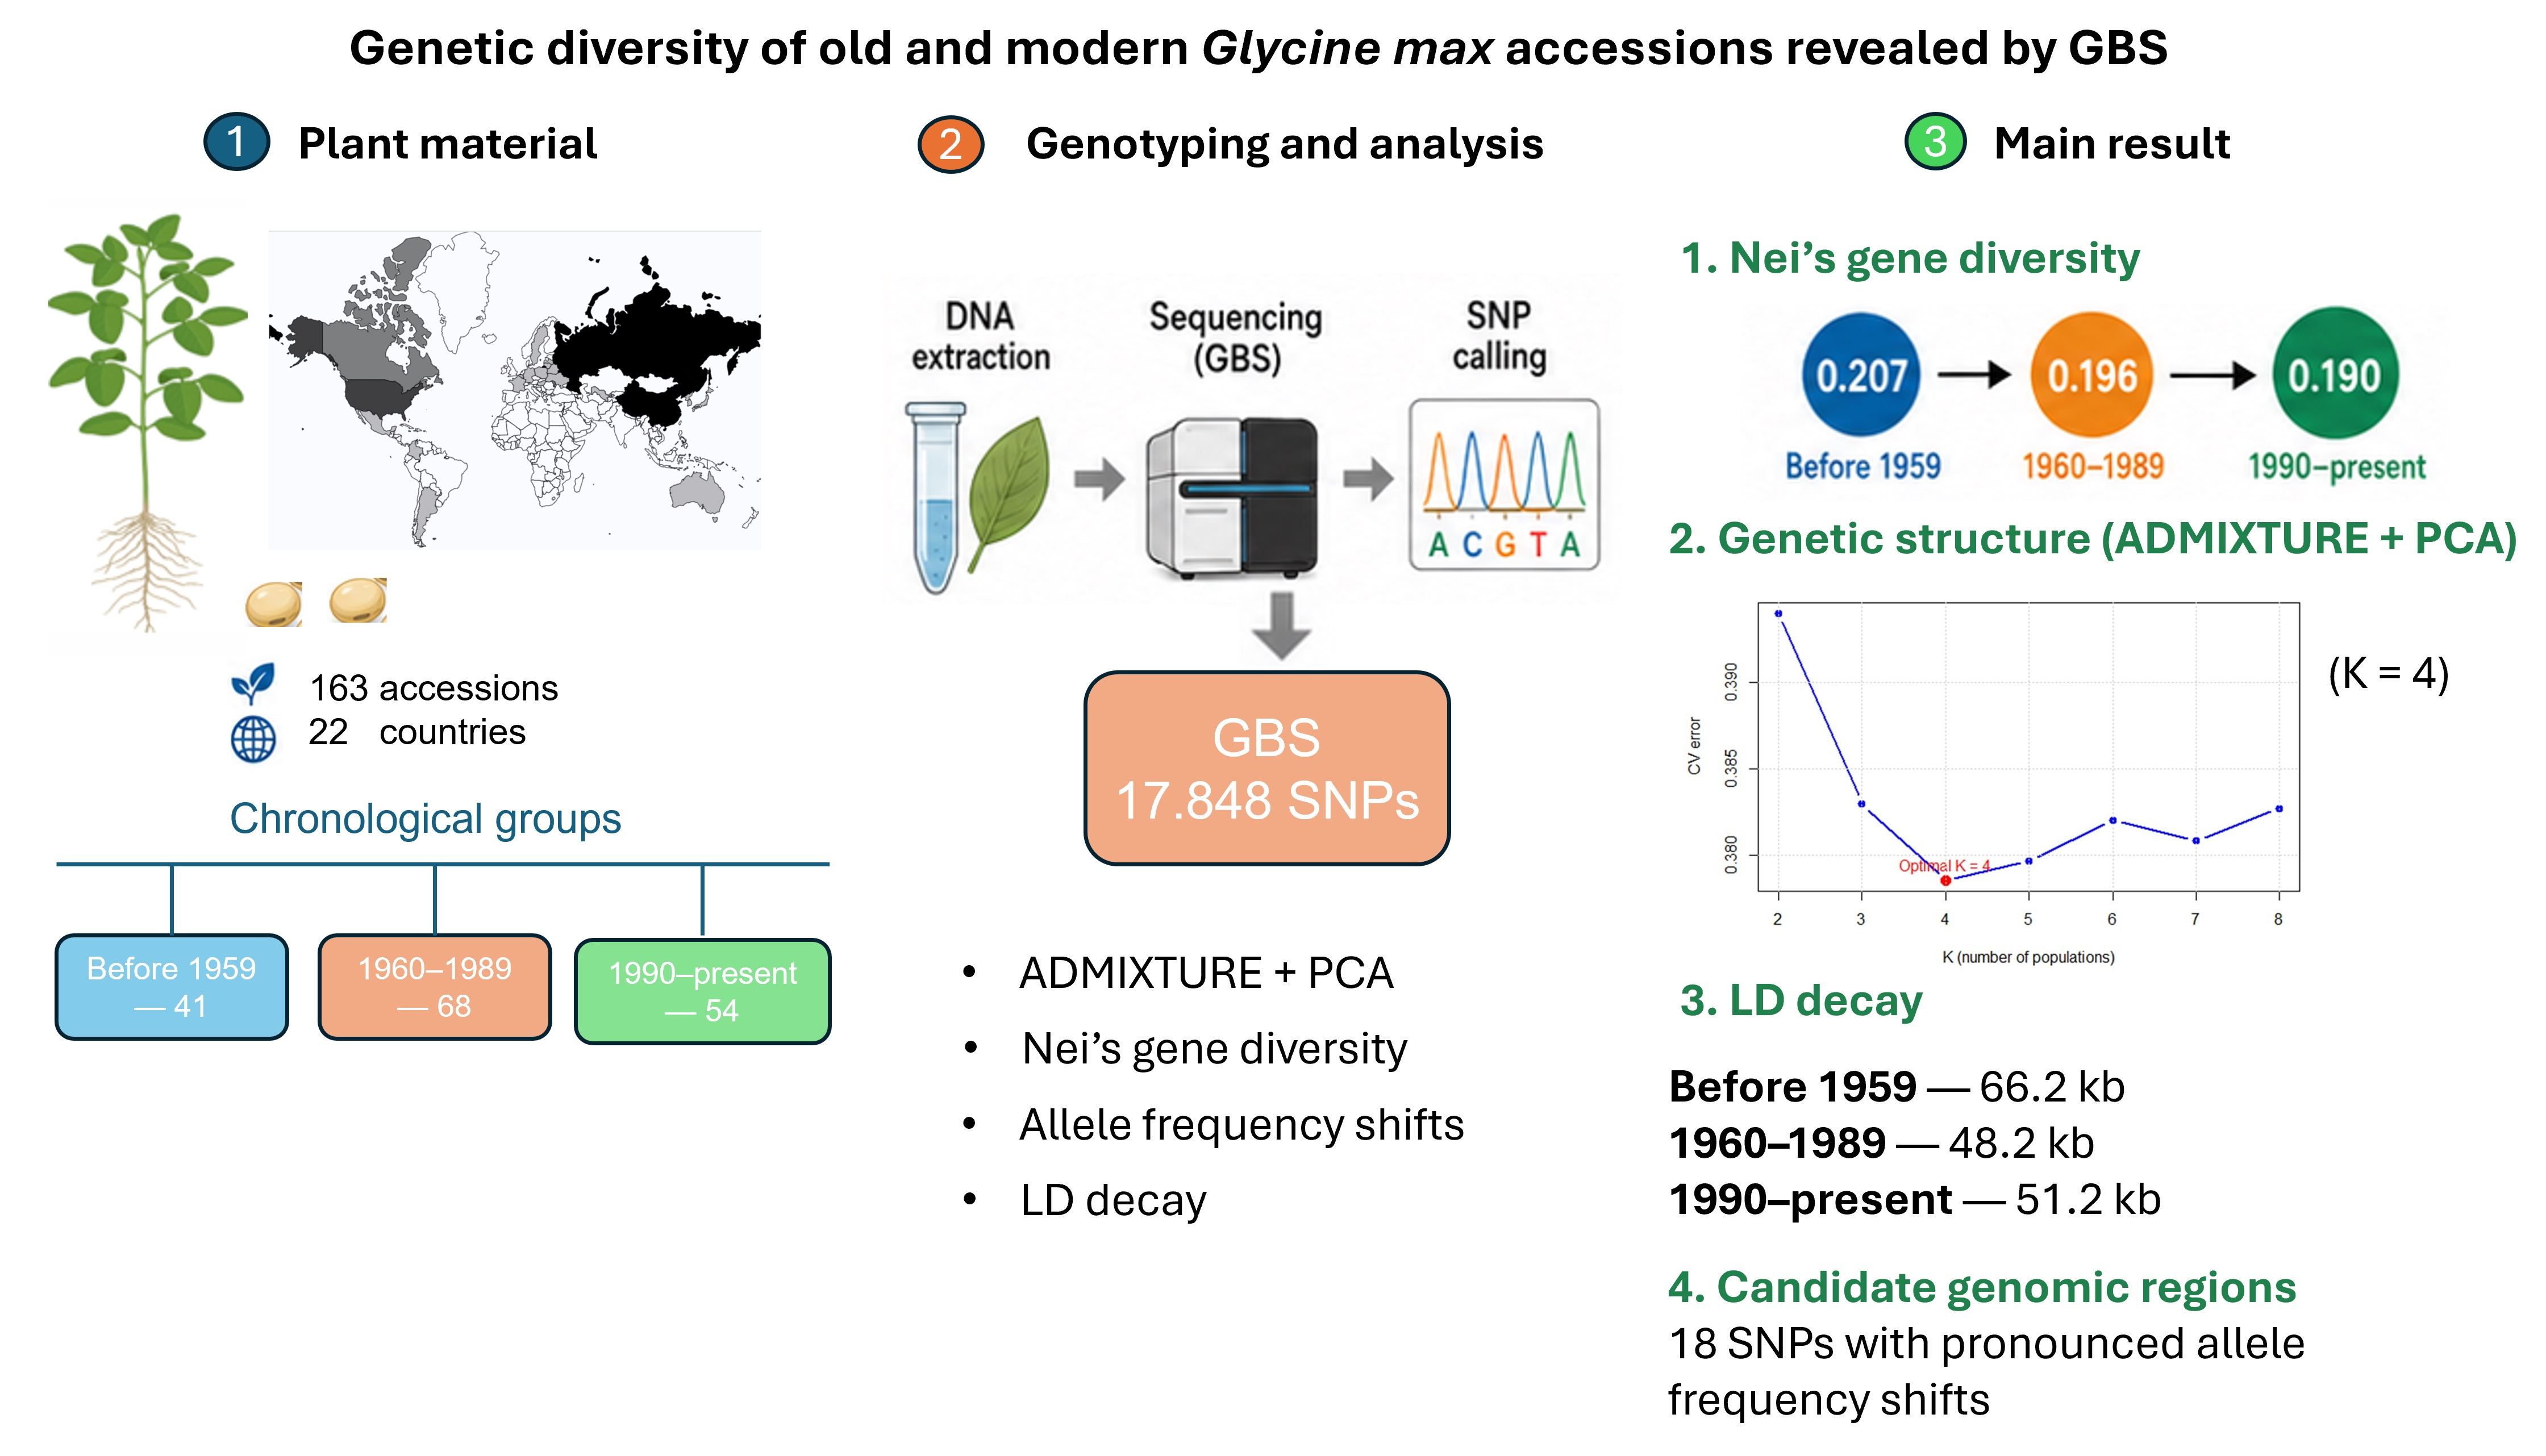
Graphical Abstract

1. Introduction

Originating in ancient China, the soybean (Glycine max (L.) Merr.) has evolved from a regional crop to one of the most widely cultivated grain legumes worldwide. Today, soybean is a major economically important agricultural species, ranking fourth globally in harvested area among major crops [1].
Wild soybean (Glycine soja Sieb. et Zucc.) originated over 270 thousand years ago in East Asia, according to population genomic studies [2], and is regarded as the progenitor of cultivated soybean (Glycine max), whose domestication took place approximately 5.5 to 6 thousand years ago in China [3].
Around the first century AD, soybean spread to many Asian countries. It was first introduced to Europe in the 18th century by travelers, missionaries, and sailors but only gained widespread cultivation from the late 19th to early 20th centuries [4]. Outside Asia, the crop became known and economically significant in the last 100–150 years [5]. Individual soybean varieties and large collection sets were repeatedly imported from China to the USA, including through scientific expeditions [6]. Varieties from China and new cultivars developed in the USA spread to Mexico and Latin American countries [7]. Numerous repeated introductions each time brought new alleles into the local gene pool, while intense artificial selection for desirable traits and genetic adaptation to new climatic conditions led to a reduction in genetic diversity.
In Russia, soybean appeared roughly at the same time as in Europe. In the Far East, the population was familiar with soybean due to proximity with China and Korea, where soybean cultivation was widespread. The crop gained significant economic importance only during the USSR period. Collections consisting of several thousand soybean samples, gathered by Russian scientists in China in the early 20th century, were transferred to the All-Russian Institute of Plant Genetic Resources named after N.I. Vavilov (VIR) and used as initial material in many breeding organizations [8].
Throughout the 20th century and to the present day, there has been an international exchange between scientific and breeding organizations, which introduced increasingly larger sample sets into use [9].
In traditional methods of classical breeding, diversity assessment and variety selection were based solely on morphological and agronomical traits, which could easily lead to the loss of some valuable alleles. Molecular markers for soybean began to be used from the 1980s (RFLP, then SSR and SNP), enabling the first genome mapping and tracking of allelic differences at the DNA level, independent of the environment and plant developmental stages. Markers became the basis for marker-assisted selection, accelerating the process of obtaining lines with target traits (QTL, GWAS) [10,11]. It also became possible to create genetic passports for varieties. NGS technologies have made it possible to analyze hundreds of thousands of SNPs. It has become evident that the set of modern varieties originates from a limited number of initial lines, leading to a reduction in genetic diversity [12].
Previous genome-wide studies based on SNP markers and next-generation sequencing have substantially expanded our understanding of soybean genetic diversity, domestication, and breeding history. Li et al. (2010) demonstrated that domestication was accompanied by a reduction in genetic diversity while preserving considerable variation within cultivated soybean [13]. Using genome-wide SNP data, Vaughn and Li (2016) showed that modern breeding altered the genomic composition of soybean while maintaining the level of genetic diversity [14]. Liu et al. (2017) further revealed differences in the genetic diversity and population structure of Chinese and North American soybean accessions associated with breeding history and germplasm introduction [15]. However, relatively few studies have investigated temporal changes in soybean genetic diversity using historical germplasm collections representing different breeding periods.
There are several major soybean germplasm banks, including the USDA in the USA [16], EMBRAPA in Brazil [17], Chinese National Soybean GeneBank [18], NIAS Genebank in Japan [19], and VIR in Russia [20]. These collections contain valuable genetic material that can serve as a source of new loci and genes involved in the formation of economically important traits. The VIR soybean collection is one of the largest in the world. The first samples were added to the collection in 1921. The largest influx of material occurred during the period of N. I. Vavilov’s work and in the 1980s. Currently, the soybean collection at VIR contains over 7800 samples originating from 72 countries around the world. The majority of samples come from Russia, China, the USA, Canada, and Japan. The main part of the collection consists of samples of the cultivated species Glycine max. There are also samples of wild species G. soja and G. gracilis Skvorts., originating from the Far Eastern region of Russia and northern China. Perennial soybean species from the Australian region are represented by five species, with several samples of each species [21].
Each time period is characterized by changes in the main breeding methods and priorities. Varieties bred before 1959 often maintain a high level of allelic diversity. They were predominantly based on traditional phenotypic selection and the genetic sources available to breeders at the time. From 1960 to 1990, methods of hybridization and systemic analysis of trait correlations began to be widely used in breeding, which made it possible to expand the gene pool and increase the adaptive capacity of cultivated forms [22]. The period after 1990 is characterized by the introduction of DNA marker technologies in plant breeding, laying the foundation for modern genomic research, including recent advances in GWAS. Differences among chronological groups of varieties reflect the dynamics of gene pool evolution and define strategic points for future breeding and sustainable soybean production [23,24].
The objective of this study was to investigate temporal changes in the genetic diversity and population structure of cultivated soybean using a historical collection from the N.I. Vavilov All-Russian Institute of Plant Genetic Resources (VIR). Specifically, we aimed to (i) compare genetic diversity among soybean accessions representing different breeding periods and geographical origins, (ii) assess temporal changes in linkage disequilibrium and allele frequencies, and (iii) identify genomic regions showing pronounced allele frequency shifts that may be associated with the history of soybean breeding and germplasm introduction.

2. Materials and Methods

2.1. Plant Material

A total of 163 accessions of G. max from the VIR collection were investigated.
The study sample consisted of 163 soybean accessions (Glycine max (L.) Merr.) originating from 22 countries (Australia, Argentina, Belarus, Belgium, Hungary, Germany, Canada, China, Colombia, Latvia, Lithuania, Mexico, Moldova, Poland, Russia, the USA, Ukraine, France, the Czech Republic, Sweden, South Korea, and Japan). The soybean accessions were divided into three groups according to their release period: Group I (before 1959)—41 accessions; Group II (1960–1989)—68 accessions; and Group III (1990–present)—54 accessions. In addition, genetic diversity was assessed for geographical groups represented by at least 12 accessions. The complete list of soybean accessions and their characteristics, such as their origin and year of inclusion in the collection, is presented in the Supplementary Materials (Table S1).

2.2. DNA Extraction, Library Preparation, and Sequencing

Genomic DNA extraction was performed from germinated seeds following the manufacturer’s protocol DNeasy Plant Mini Kit (QIAGEN, Venlo, The Netherlands, Cat. No. 69106). DNA quality was checked via 1% agarose gel electrophoresis, and concentration was measured by NanoDrop One (Thermo Fisher Scientific, Waltham, MA, USA). The DNA was diluted to a 20 ng/µL concentration and used for the next library preparation.
The GBS libraries were prepared using the modified Adapterama III protocol [25]. High-quality genomic DNA (50 ng) from individual soybean samples was simultaneously digested with MspI and PstI restriction enzymes (SibEnzyme, Novosibirsk, Russia) in a single reaction at 37 °C for 2 h. Following digestion, T4 DNA ligase (New England Biolabs, Ipswich, MA, USA) was added directly to the reaction mixture along with custom-designed adapters compatible with Illumina sequencing platforms for ligation of dual-indexed adapters to both ends of the restriction fragments. The adapter design incorporated double internal barcodes for sample identification within the sample pool and variable-length internal spacers to increase sequence diversity during sequencing.
Following adapter ligation, libraries were pooled in groups of 32 according to the number of internal barcodes to enable the second round of indexing with external barcodes. Full-length libraries were then generated through PCR amplification using a reduced cycle protocol with UDI primers (New England Biolabs, Ipswich, MA, USA).
Library purification was performed using a dual-step size selection protocol with Agencourt AMPure XP paramagnetic beads (Beckman Coulter, Brea, CA, USA) to remove adapter dimers and select fragments within the optimal size range of 200–600 bp. The dual purification approach ensured that DNA fragments fell within the specified size range, eliminating adapter dimers. Library concentrations were determined using a Qubit 4.0 fluorometer (Thermo Fisher Scientific, Waltham, MA, USA), according to the manufacturer’s instructions. Fragment size distribution analysis was performed using capillary electrophoresis systems (Bioanalyzer 2100 or Agilent TapeStation 4200, Agilent Technologies, Santa Clara, CA, USA). The resulting fragment size distribution of the libraries was consistent with standard GBS library profiles, showing the expected range of 200–600 bp fragments suitable for Illumina sequencing. Sequencing was performed on the NovaSeq™ 6000 platform (Illumina, San Diego, CA, USA) using 2 × 150 bp paired-end chemistry.

2.3. Primary Analysis of GBS Data and SNP Calling Procedures

Data preprocessing was conducted using FastQC v0.12.1 followed by MultiQC for comprehensive quality assessment of raw sequencing reads [26]. Following quality assessment, adapter sequences were removed, and low-quality reads were filtered using the fastp package. The preprocessing stage also included demultiplexing of barcoded samples using the process radtags script from the Stacks toolkit [27], which separated individual samples based on their unique molecular barcodes and removed low-quality read pairs and sequences lacking proper restriction enzyme recognition sites.
Filtered high-quality reads from each sample were aligned to the Glycine max reference genome (GCA_000004515.5, Williams variety [28]). Read mapping was performed using Bowtie2 v2.3.5.1 in local alignment mode with optimized parameters for GBS data alignment [29]. Following read alignment, sequencing depth coverage was calculated using SAMtools depth v1.6 to assess the distribution of read coverage across genomic regions for reliable variant calling [30]. The average value for all variants was 27.68x.
Variant calling was performed using the gstacks module from the Stacks pipeline [27] in conjunction with bcftools v1.9 [30]. The gstacks program assembled loci from aligned reads and identified polymorphic sites across all samples simultaneously, while bcftools call applied statistical models to determine genotype likelihoods and call variants. The gstacks module was run with the “min-mapq 30” option, ensuring a 99.9% probability that the read alignment is correct. The variant calling procedure utilized the multiallelic caller model (-m option) in BCFtools, which is specifically designed to handle complex variants and provides improved accuracy for rare variant detection compared to the original consensus caller. All software programs were executed using default parameters unless otherwise specified.
The resulting VCF file was filtered to retain only biallelic SNPs with a minor allele frequency >1% and a call rate >50% using BCFtools v.1.8 (options: -i ‘MAF > 0.01 & F_MISSING < 0.5’ -m2 -M2 -v snps). Subsequently, samples with less than 15% of genotyped loci were removed using PLINK v1.9 (option: --mind 0.85). The final dataset included 17,848 SNPs across 163 accessions. The filtered genotype dataset used for subsequent analyses is provided in Supplementary Table S3. The average call rate was 83%, ranging from 15.9% to 99.8% per sample. Missing genotype calls were treated as missing values and were excluded from locus-specific calculations of allele frequencies and genetic diversity. Although the sample call rate ranged from 15.9% to 99.8%, even the lowest value corresponded to approximately 2800 successfully genotyped SNPs in the final dataset of 17,848 markers. Accessions with relatively low call rates were retained because they represent historically valuable material from the VIR collection and were not concentrated within a single geographical or chronological group. Overall, 22 accessions had a call rate below 50%, and their distribution among countries was not significantly biased according to the Fisher–Freeman–Halton exact test (p = 0.1249).
Because reduced-representation sequencing by GBS inherently produces uneven genome coverage and missing genotype calls [12,27], the selected filtering strategy allowed preservation of historically valuable accessions while minimizing the effect of missing data through locus-level filtering. These filtering thresholds were selected to balance marker quality and genome coverage. The MAF threshold of 1% was used to remove extremely rare variants with limited contribution to population-level analyses while retaining low-frequency polymorphisms present in the historical germplasm. The call rate threshold of 50% was chosen to exclude loci with excessive missing data while preserving a sufficient number of informative markers.
Functional information for candidate genes was obtained from the NCBI Gene database and supplemented by information from published studies.

2.4. Population Structure, Statistical Analyses, and LD

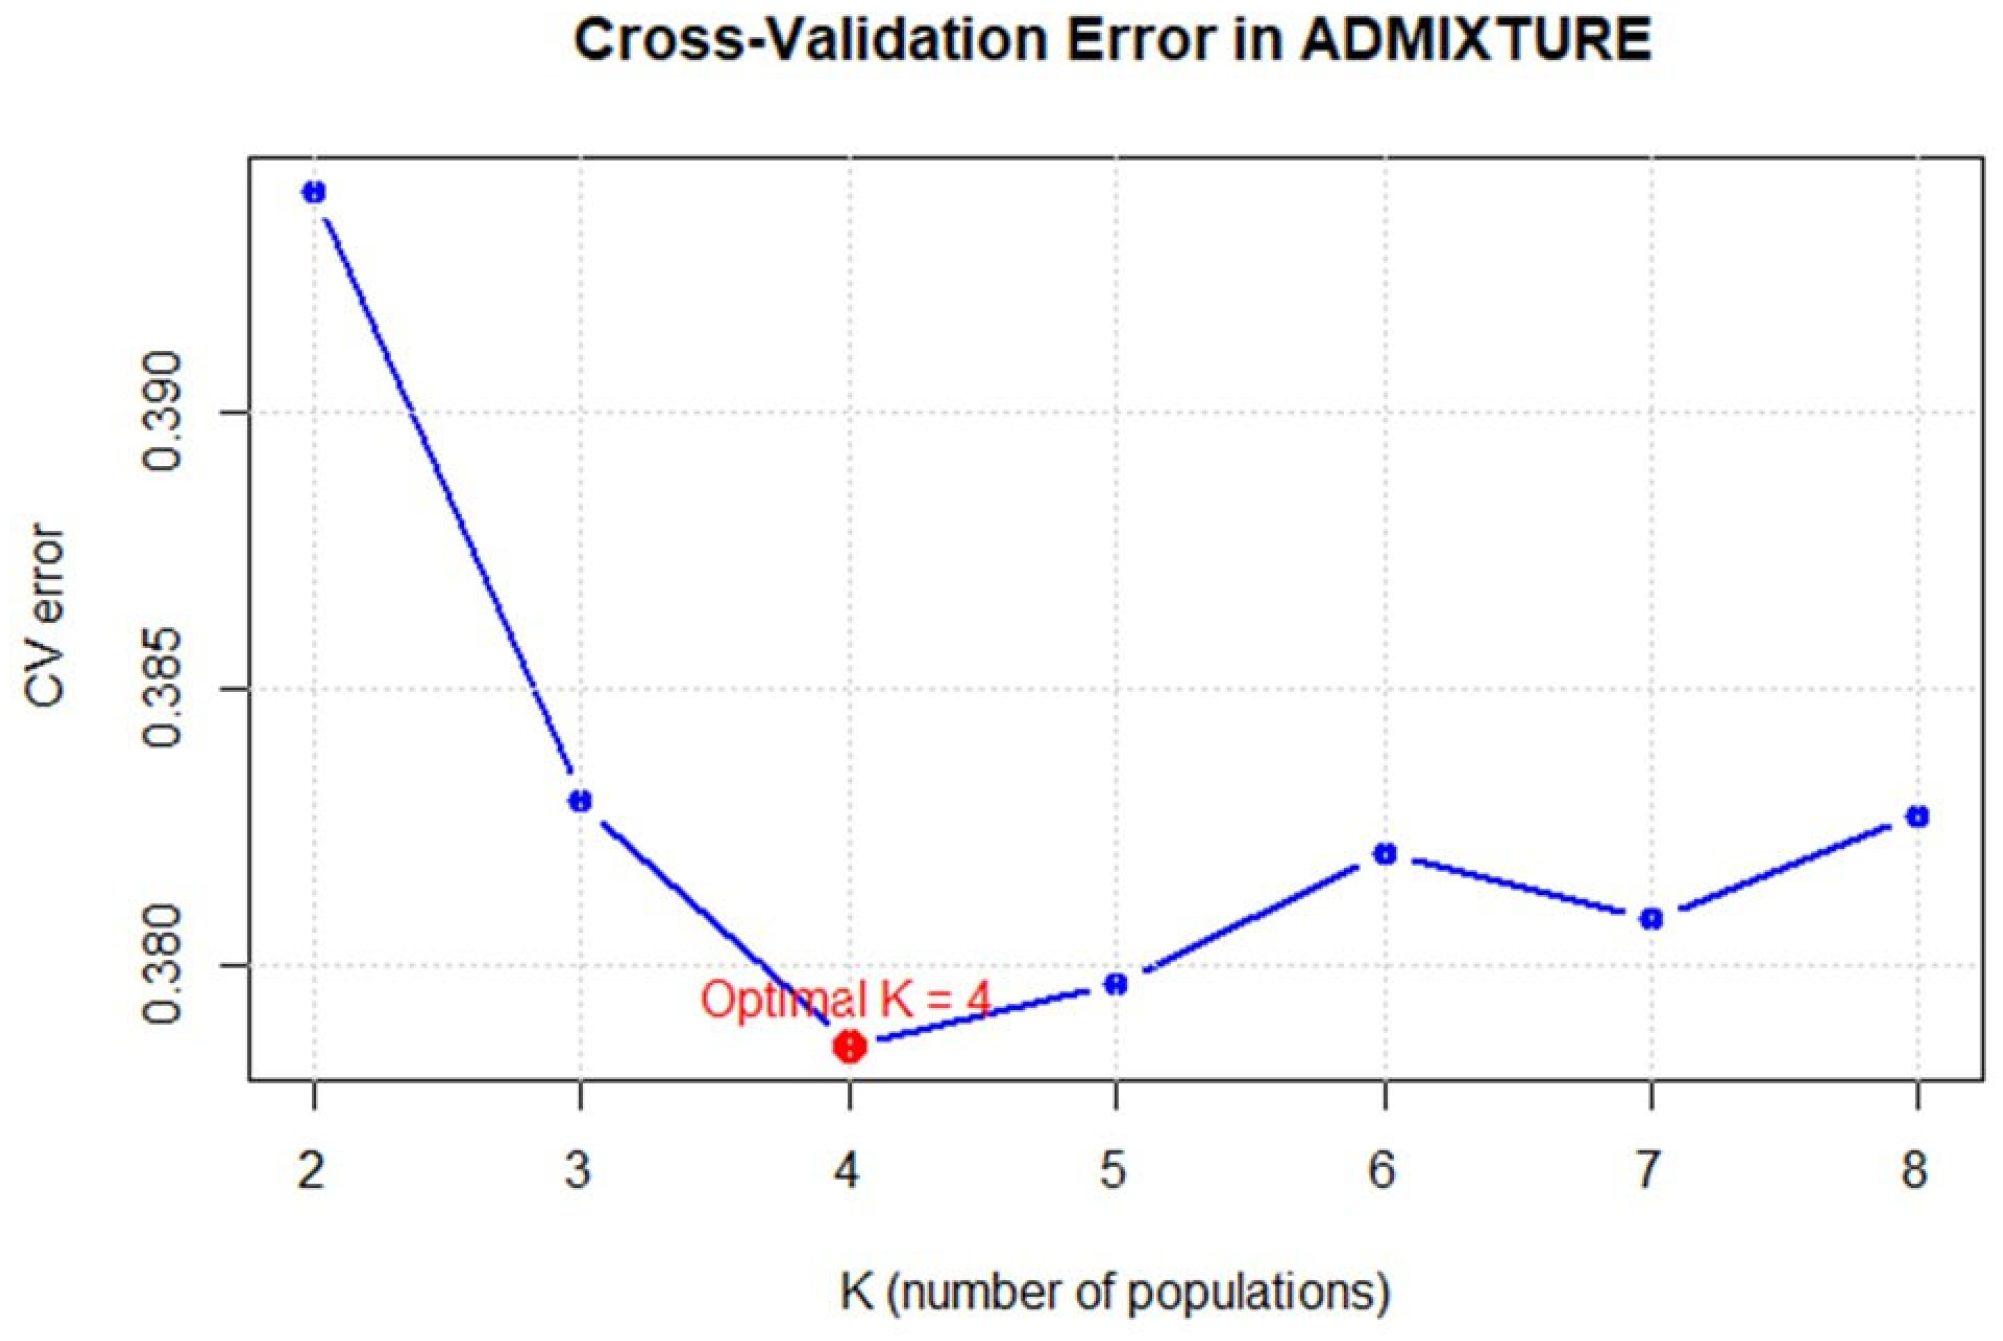
Population structure was inferred using the filtered SNP dataset that was also used for genetic diversity analysis. For this purpose, we used ADMIXTURE v1.3 software [31]. To determine the number of populations, we used the method of estimating the number of clusters by the minimum value of cross-validation (CV), implemented in the ADMIXTURE program for optimizing K. As an additional approach to validate population structure inferred by ADMIXTURE, principal component analysis (PCA) was performed using PLINK v1.9 based on the same filtered SNP dataset. The PCA plot is included in the Supplementary Materials as Figure S1.
Gene diversity was calculated according to Nei [32] using the following formula:
H i = 1 j p i j 2
where Pij2 is the frequency of the jth allele for the ith locus summed across all alleles of the SNP marker. The 95% confidence intervals (95% CIs) for Nei’s gene diversity were estimated using bootstrap resampling. Genetic diversity was calculated for the complete dataset and separately for the chronological and geographical subsets of accessions.
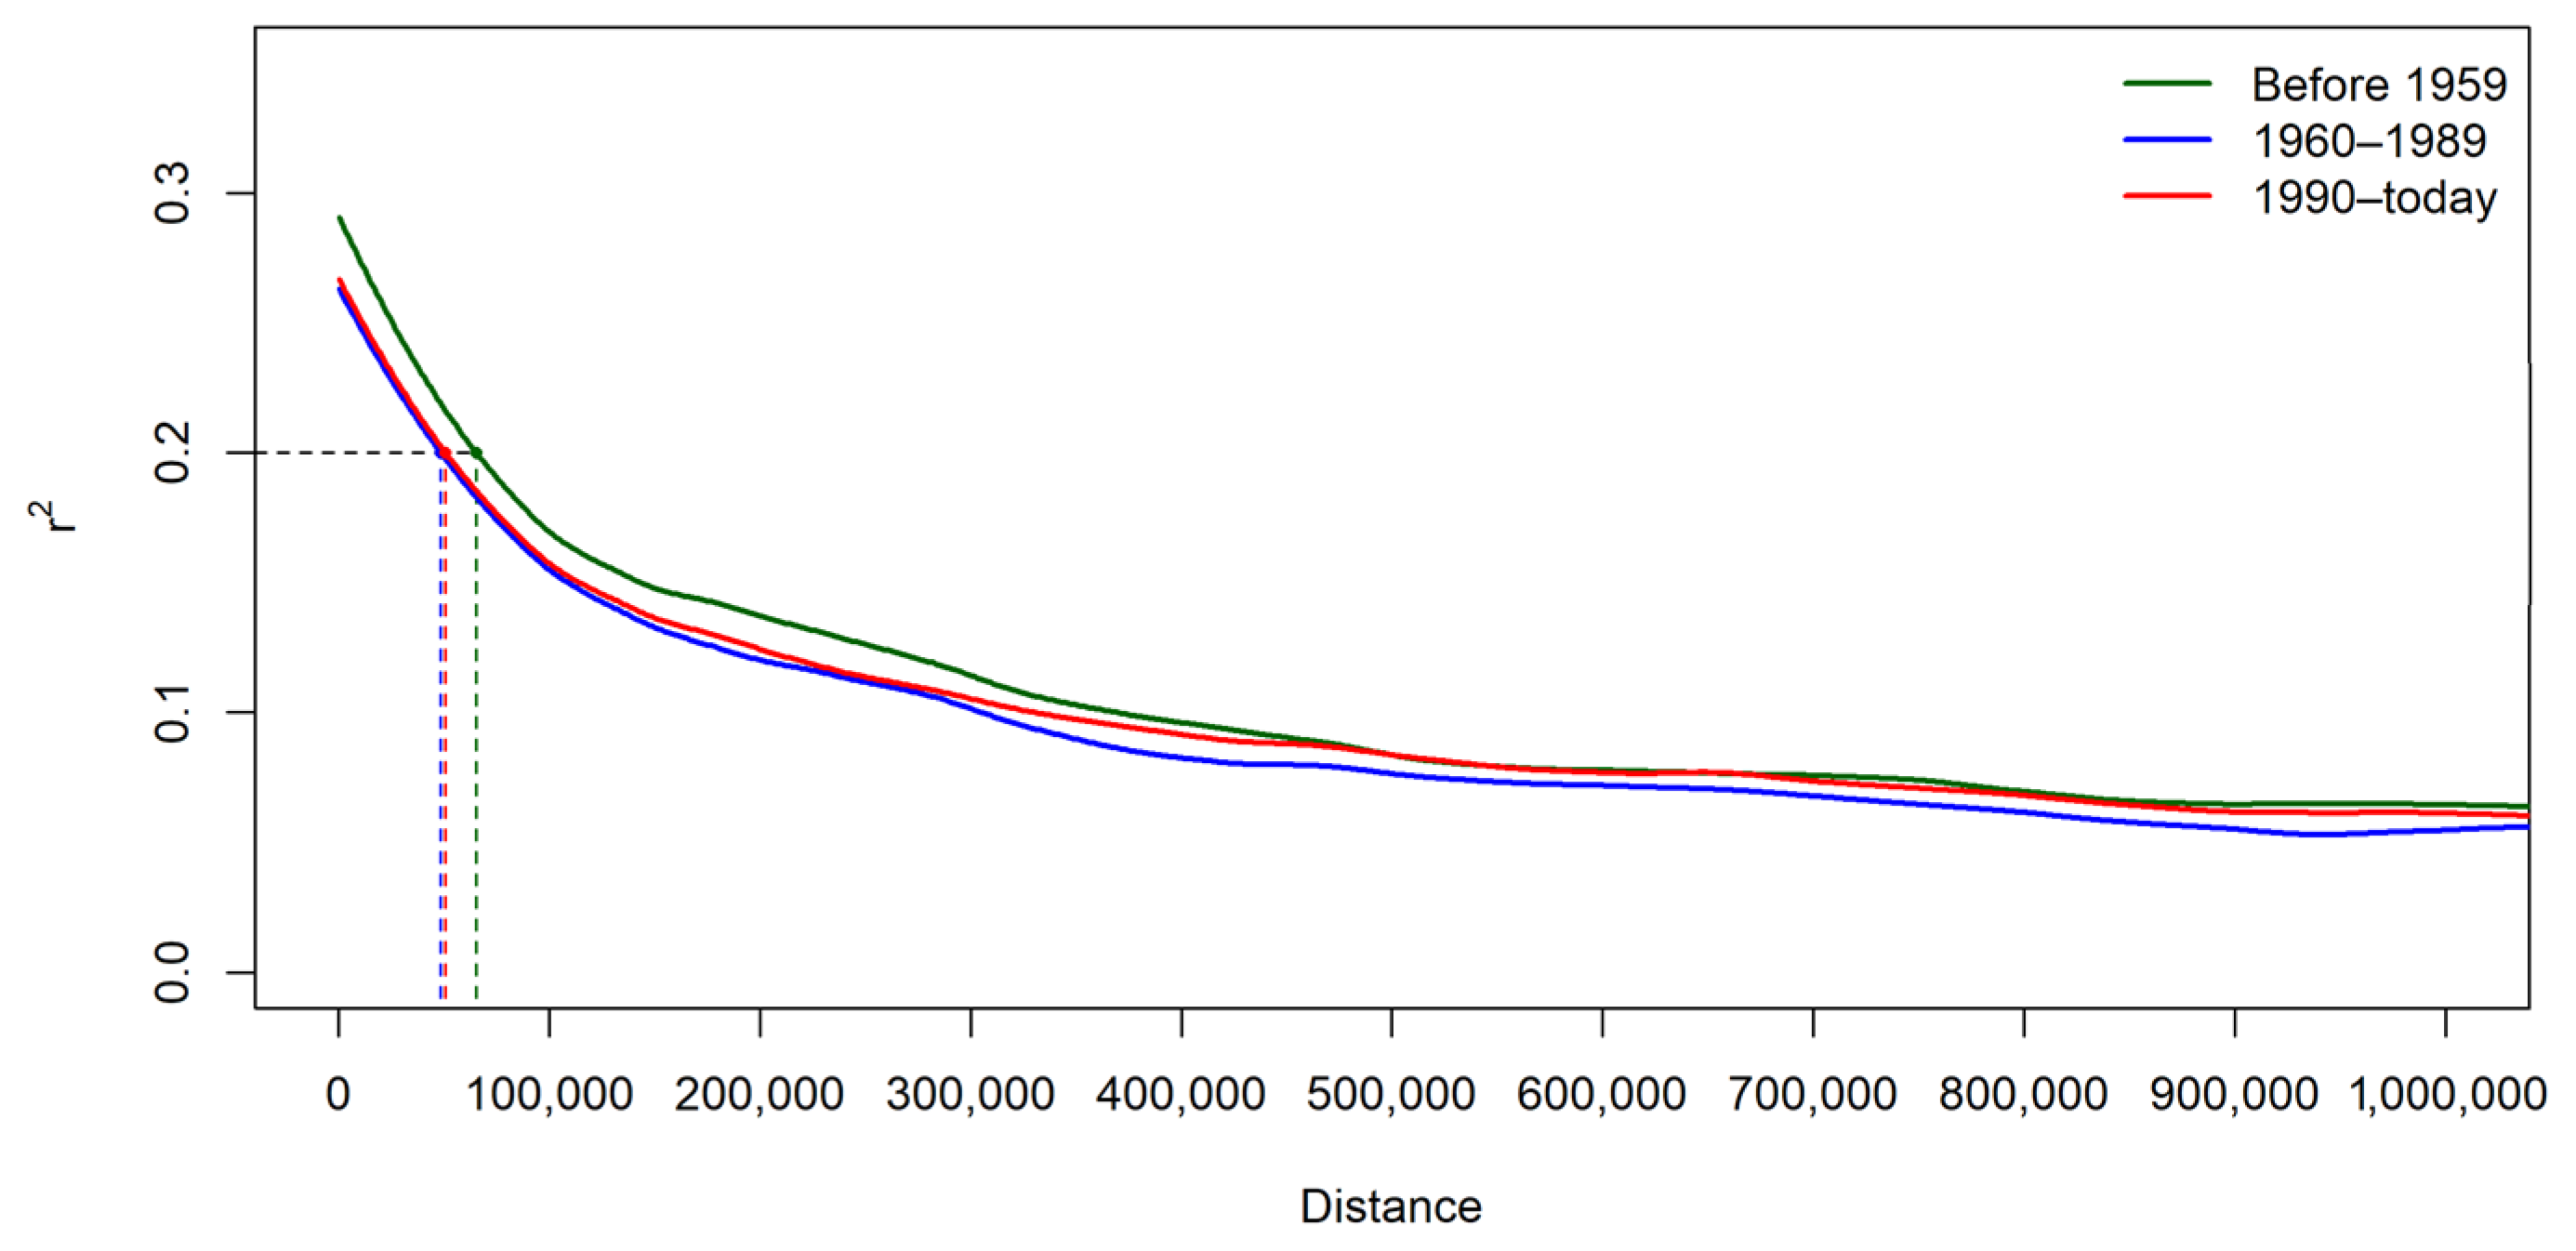
Linkage disequilibrium (LD) decay was calculated for three subsets of 41 (Group 1), 68 (Group 2), and 54 (Group 3) Glycine max (L.) Merr. accessions, up to a genomic distance of 3 Mb, using PopLDdecay v3.43. The LD decay curve was fitted using the “loess” R function, with a smoothing parameter “span = 0.1”, based on r2 values averaged within 1 Kb bins.
To assess allele frequency changes among chronological groups, the absolute difference in allele frequency between Group I and Group III was calculated. SNP markers showing the largest allele frequency differences between early accessions and modern cultivars were selected for further analysis. The genomic positions of the selected SNPs were compared with the fourth version of the Glycine max Williams 82 reference genome, Glyma.Wm82.a4.v1. For each marker, annotated genes located in the corresponding genomic region were identified using the NCBI Gene database and Genome Data Viewer. Functional annotations of candidate genes were obtained from the NCBI Gene database and supplemented with information from published literature.

3. Results

3.1. Population Structure

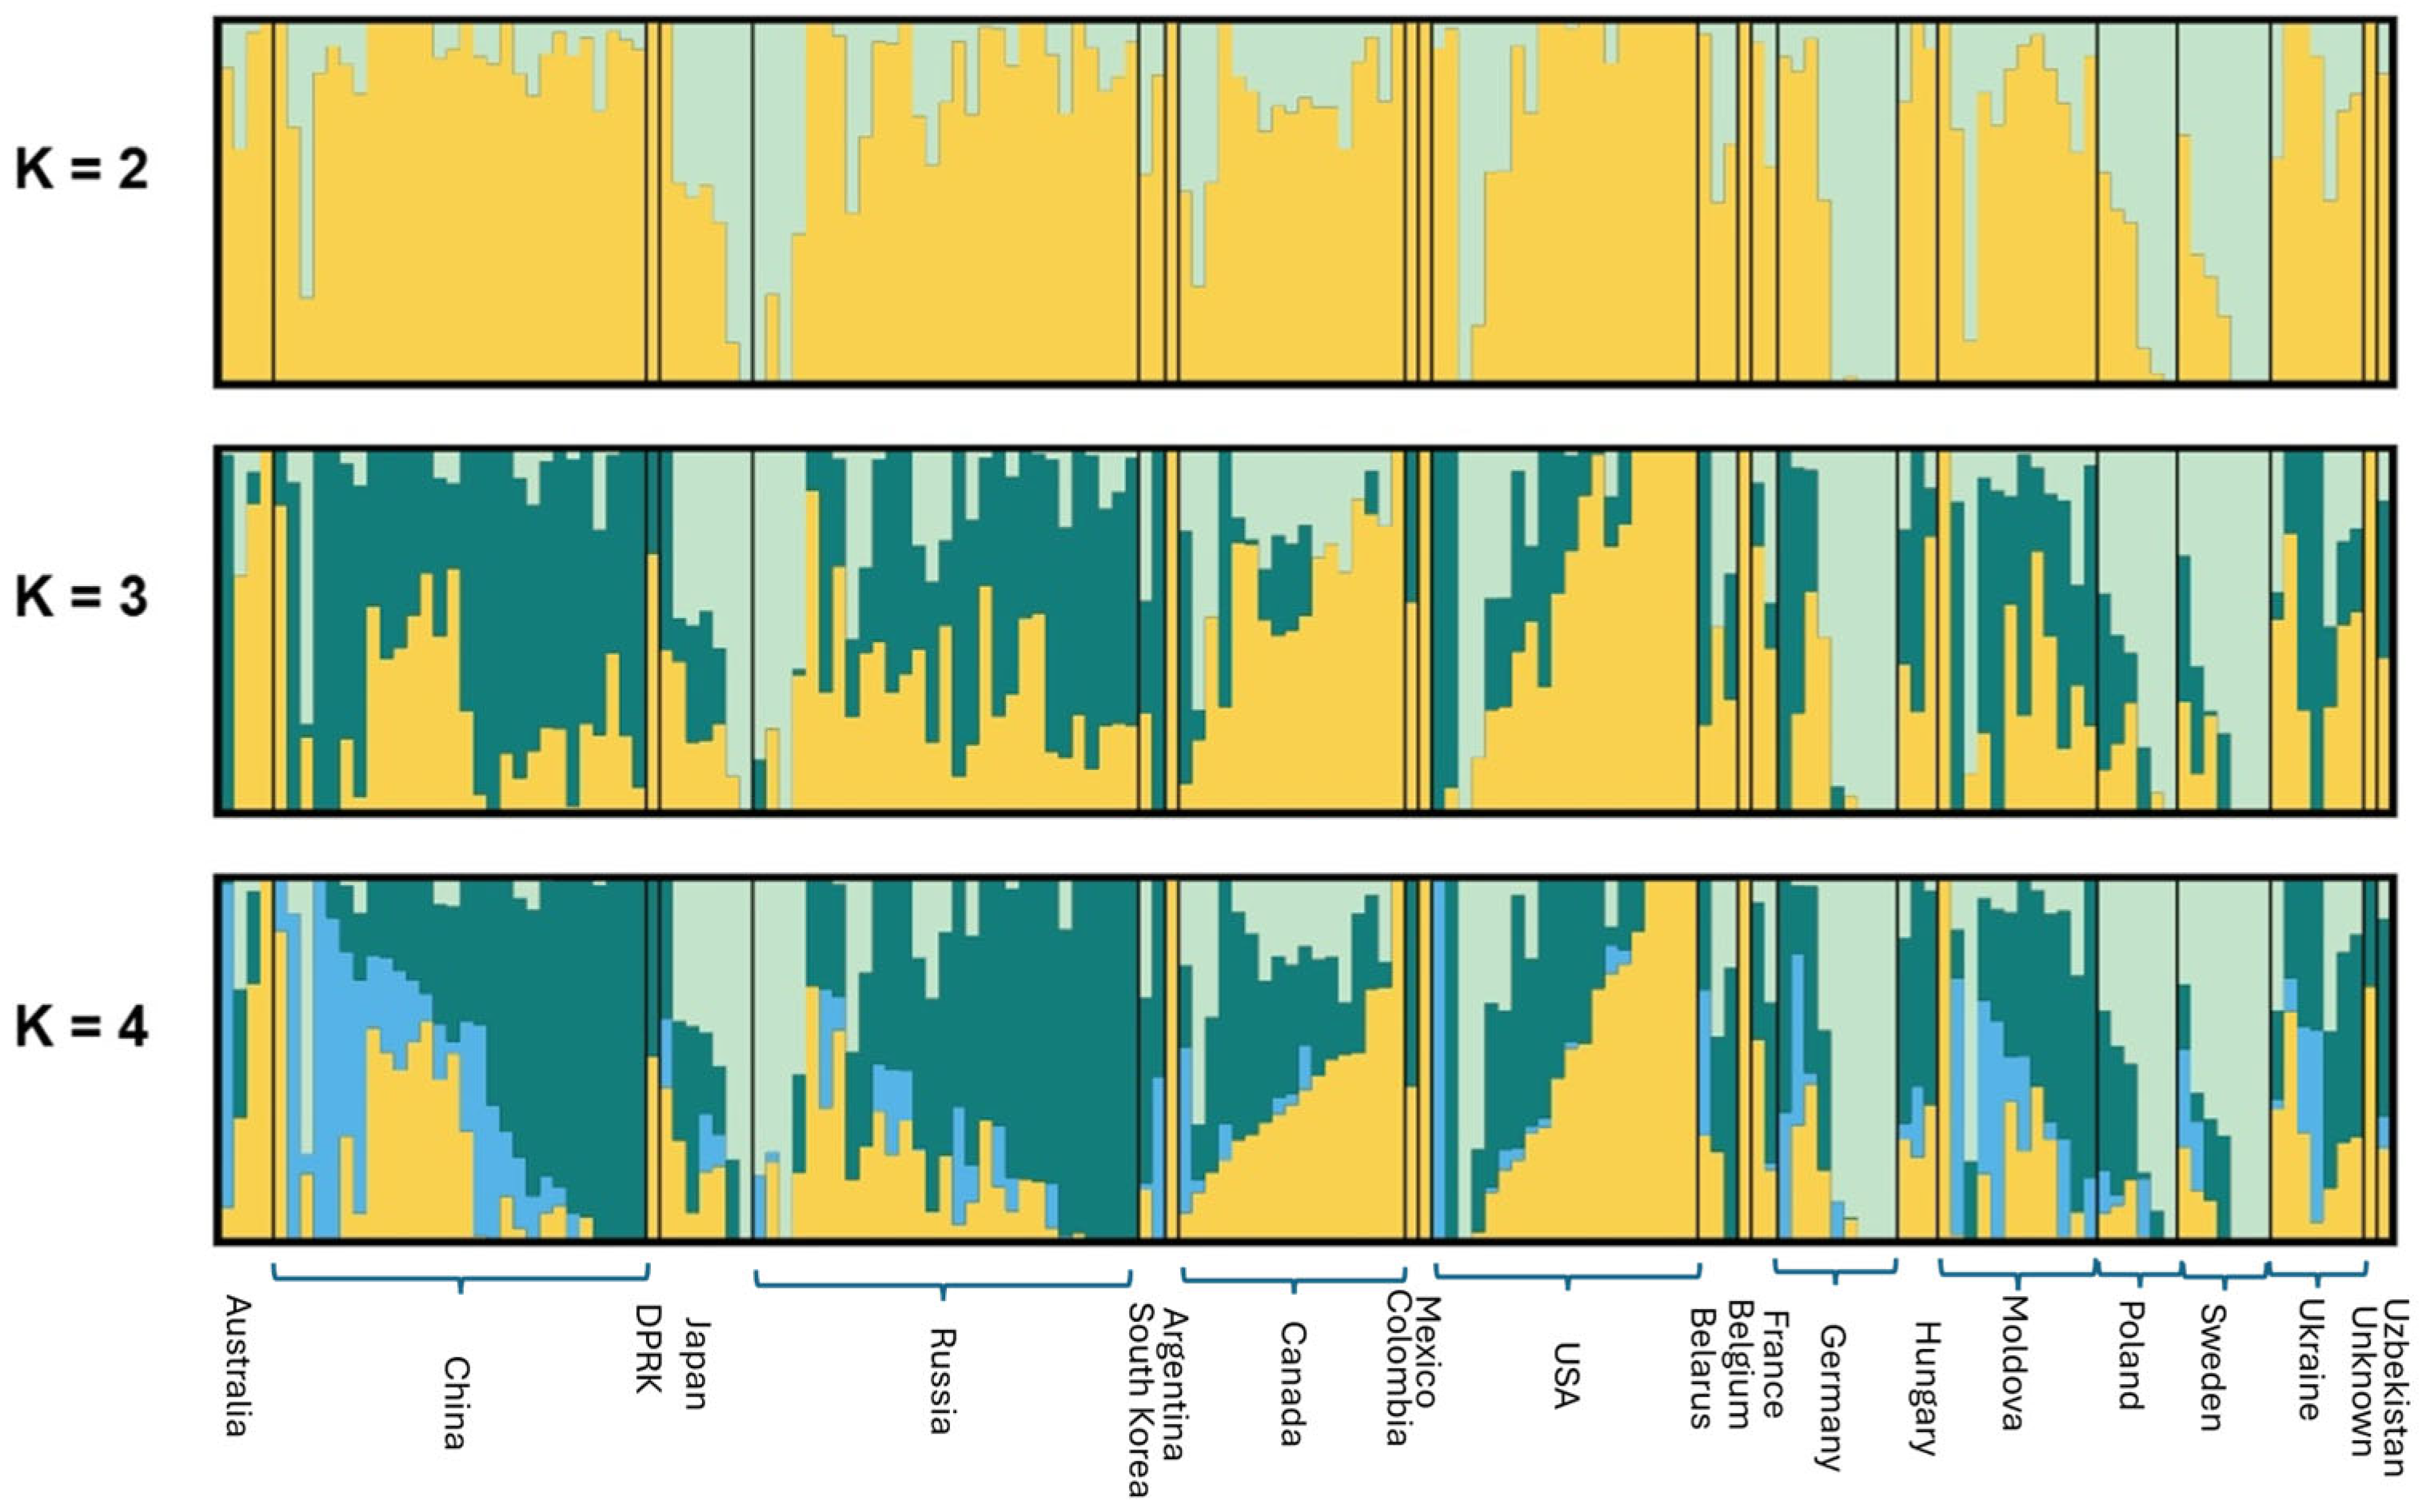
The population structure of the 163 soybean cultivars from different countries was analyzed. According to a cross-validation procedure, the most likely number of genetic clusters was K = 4, which was subsequently used to characterize the population structure using ADMIXTURE analysis (Figure 1 and Figure 2).
The population structure analysis of soybean varieties, performed by grouping by country of origin, demonstrated a stepwise differentiation of genotypes at various K values. At K = 2, a cluster characteristic of varieties from Japan, Germany, Poland, Sweden, and some from Russia was identified, reflecting their genetic similarity and homogeneity. With an increase in the number of clusters to three (K = 3), further differentiation was observed: varieties from China, Russia, Moldova, and Ukraine formed one group, while the structure of samples from Canada and the USA was clearly distinct. With a further increase to four clusters (K = 4), a specific group was additionally distinguished, including some varieties from China and a few samples from Moldova and Ukraine. Principal component analysis (PCA) was additionally performed to validate the ADMIXTURE results (Figure S1). The PCA plot did not reveal strict separation of accessions according to country of origin: most accessions from different geographical groups overlapped and formed a common cluster. At the same time, partial separation of several accessions along PC1 and PC2 was observed, indicating moderate genetic differentiation within the collection. Overall, the PCA results support a cautious interpretation of the ADMIXTURE analysis and suggest only partial correspondence between genetic structure and geographical origin.

3.2. Genetic Diversity Analysis

Genetic diversity was assessed across soybean cultivars, which were subsequently grouped according to two criteria: chronological periods (Table 1).
Gene diversity according to Nei [32] for 17,848 loci varied around 0.2. The average value was 0.202. It proved to be practically equivalent across all three groups (Table 1).
An analysis of allele frequencies at 17,848 SNP markers in 163 soybean accessions revealed a redistribution of allele frequencies between early and modern varieties. Across 17,848 loci, marker frequencies were found to change by more than 0.1 in 25% of cases (Table S2). About 7% of loci showed changes greater than 0.2, while a smaller proportion of loci showed larger shifts: approximately 300 markers showed changes of 0.3, about 90 markers showed changes of 0.4, and 18 markers showed changes of 50% or more (Table S1). Comparative analysis of SNP allele frequencies among the three chronological groups revealed pronounced temporal changes during the development of soybean varietal diversity (Table 2).
The largest changes were characteristic of SNPs localized in several chromosomal regions, including regions associated with the Glyma.13G045400, Glyma.17G205700, Glyma.20G016100 genes and other annotated loci (Table 2).
Locus NC_038253.2:33499993 showed the largest allele frequency difference between Group I and Group III: its frequency decreased from 0.77 in early accessions to 0.13 in modern varieties, corresponding to a maximum difference of 0.64. This locus is located in an intergenic region, where no annotated gene overlaps the SNP position (NO) (Table 3). In contrast, most of the selected markers (16 out of 18) were located within or near annotated genes.
Loci NC_038253.2:33359512, NC_038253.2:33359616, and NC_038253.2:33359638 are located in the Glyma.17G205700 gene and showed similar allele frequency decline patterns between early and modern groups. Pronounced allele frequency differences were also observed for loci located in the Glyma.13G045400 and LOC100777354 genes. In total, fifteen SNPs showed a decrease in allele frequency in modern varieties compared with early accessions, whereas three SNPs on chromosome 4, located in or near the Glyma.04G181200, Glyma.04G183600, and Glyma.04G182900 genes, demonstrated the opposite trend, with allele frequencies increasing in Group III. Since SNP alleles are defined relative to the reference genome, changes in reference or alternative allele frequencies cannot be interpreted as direct evidence of positive or negative selection. Therefore, these markers should be considered candidate genomic regions showing substantial frequency shifts during the historical development of soybean breeding and require further validation.
Next, we divided the sample by regional origin (Table 4).
The calculation of genetic diversity by geographical origin showed values ranging from 0.172 in Canadian accessions to 0.203 in Chinese accessions. The regional analysis revealed moderate differences among geographical groups.

3.3. Linkage Disequilibrium

The extent of LD decay was calculated in all 163 soybean genotypes with PopLDdecay (Figure 3).
The r2 value was below 0.2 and amounted to 66,186 bp in Group I, 48,170 bp in Group II, and 51,174 bp in Group III.

4. Discussion

Unlike previous studies focused primarily on contemporary breeding material or national collections, the VIR collection provides a unique opportunity to trace long-term genomic changes across breeding periods while preserving broad geographic representation. This makes it possible to distinguish temporal trends from regional patterns of diversity.
The ADMIXTURE clustering pattern may be partly explained by the history of soybean germplasm introduction and exchange. The cluster observed at K = 2, which included accessions from Japan, Germany, Poland, Sweden, and several Russian varieties, may reflect the contribution of Japanese-derived germplasm to soybean breeding in northern Europe and Russia. This interpretation is consistent with the work of S. A. Holmberg, who collected soybean material in Japan and Sakhalin and used it to develop varieties adapted to cool-temperature climates [46]. In addition, Japanese accessions were introduced into the VIR collection during early collecting expeditions, including the 1928 expedition of E. N. Sinskaya.
The groups observed at K = 3 and K = 4, which included accessions from China, Russia, Moldova, and Ukraine, may be related to the large-scale introduction of Chinese soybean germplasm into the USSR. In 1923–1929, soybean accessions collected through agricultural institutions of the Chinese Eastern Railway were transferred to VIR, and by the early 1930s, the collection included more than 3000 accessions, mainly from Northeastern China [8]. These materials were subsequently distributed to breeding institutions in different Soviet regions and could have served as common source material for soybean breeding in Russia, Moldova, and Ukraine.
To evaluate temporal changes in the genetic composition of soybean varieties, the material was divided into three chronological groups: Group I included 41 early varieties developed before 1959, Group II comprised 68 mid-period varieties bred between 1960 and 1989, and Group III contained 54 modern varieties bred from 1990 to the present. For the early group, the breeding date was inferred from their inclusion date in the VIR collection, whereas for the mid-period and modern groups, the year of breeding was used.
Notably, comparison of SNP marker frequencies among the three chronological groups of soybean accessions revealed that fifteen SNPs showed a pronounced decrease in frequency in modern varieties compared with early accessions. These changes may reflect the reduced representation of certain alleles in modern breeding material, possibly as a result of changing selection pressures and breeding objectives. Conversely, an increase in alternative allele frequencies was observed (e.g., SNP NC_016091.4:43540133, NC_016091.4:43996995, and NC_016091.4:43761594), likely due to incorporation of traits favored in modern yield improvement programs.
In addition, candidate genes harboring SNP markers with pronounced allele frequency shifts were identified. Functional annotation of these genes suggests their possible involvement in adaptation-related processes and soybean improvement. Among them, Glyma.09G052000 is potentially involved in ion homeostasis and stress tolerance [33], and its association with soybean mosaic virus infection has also been reported [47]. Glyma.13G045400 is related to central carbon and energy metabolism and has been associated with flavonoid biosynthesis [35]. Other candidate genes may be involved in membrane transport and protective responses (Glyma.14G193300/LOC100777354) [37], as well as light-dependent regulation and the formation of seed composition traits (Glyma.17G205700 and Glyma.20G099500) [38,48]. Despite the fact that their direct role in domestication or breeding improvement requires additional functional verification, the data obtained suggest that the identified temporary changes in SNP frequencies may reflect the effect of selection on adaptive and economically important traits in the process of improving cultivated soybeans. However, further validation using an independent sample set, as well as comparative transcriptomic analysis of contrasting soybean cultivars, is required to obtain a more comprehensive understanding of these loci.
Analysis of linkage disequilibrium (LD) decay among the three chronological groups revealed temporal changes in the genomic structure of cultivated soybean. The earliest cultivars (Group I) showed the longest LD decay distance (66.2 kb), whereas Group II exhibited the shortest distance (48.2 kb). In modern cultivars (Group III), LD decay increased slightly to 51.2 kb but remained lower than in the earliest group. Similar trends have been reported in previous studies, where historical changes in breeding strategies and repeated incorporation of diverse germplasm influenced the extent of LD across the soybean genome [14,49]. The reduction in LD observed from the earliest to the intermediate breeding period may reflect an expansion of the genetic base through hybridization and the introduction of new parental lines. The slightly higher LD observed in modern cultivars may be associated with the intensive use of elite breeding material and the accumulation of favorable haplotypes during selection for agronomically important traits. However, these patterns should be interpreted cautiously, as LD is affected by multiple factors, including population history, recombination, effective population size, and breeding practices.
Nei’s gene diversity was 0.207, 0.196, and 0.190 in Groups I, II, and III, respectively. The overall gene diversity calculated across all 163 accessions was 0.202.
Regional comparative analysis revealed relatively comparable values of genetic diversity among the analyzed groups (0.172, 0.186, 0.188, 0.192, and 0.203 for Canada, Russia, the USA, Moldova, and China, respectively). Bisen A. et al. conducted a microsatellite analysis of 38 soybean genotypes in India and estimated the average genetic diversity as 0.2339, which is generally comparable to our results [50]. In 2017, Liu Z. and colleagues conducted a comparative analysis of the genetic diversity of Chinese and American soybean populations using SNP genotyping on SoySNP6k iSelect BeadChip. According to the results, the level of genetic diversity in the Chinese accessions was higher than that in the American accessions. Using a set of 5361 SNPs, the genetic diversity value was 0.3307 in the Chinese population and 0.2988 in the American population. In the study, the authors note that the reduction in the number of alleles in the American soybean population is a consequence of the limited number of original soybean varieties introduced to North America [15].
Comparisons with previous studies should be interpreted with caution, since estimates of genetic diversity and LD decay depend on the genotyping technology used. In particular, studies based on SNP arrays are not always directly comparable with sequencing-based approaches such as GBS, because the SNPs included in arrays are not randomly selected and may introduce ascertainment bias. As shown by Lachance and Tishkoff (2013), this bias can affect population genetic estimates based on different marker datasets [51]. Therefore, comparisons between chip-based estimates of genetic diversity and the present GBS-based results should be considered approximate.
The data obtained confirm the phenomenon of a “bottleneck” in the soybean germplasm—the formation of distinct national gene pools due to a limited number of original lines. Chinese varieties showed a higher level of diversity in the analyzed dataset (0.203), reflecting China’s status as the center of soybean domestication and its abundance of original lines. In contrast, “new” regions of distribution (the USA, Moldova, Canada, and Russia) exhibit more limited variation.
Analysis of allele frequency dynamics for key SNPs identified loci associated with domestication and improvement processes; genes in these loci (identified in the article: Glyma.09G052000, Glyma.13G045400, Glyma.14G193300, LOC100777354, Glyma.17G205700, Glyma.20G016100, Glyma.20G099500, Glyma.04G181200, Glyma.04G183600, and Glyma.04G182900) may serve as priority targets for further marker-assisted breeding efforts. Results from linkage disequilibrium (LD) and genetic diversity analyses highlight the significant role of historical and geographic factors in shaping the modern soybean gene pool.
The present study has several limitations that should be considered when interpreting the results. First, the number of accessions differed among the analyzed geographical groups, which may have influenced estimates of genetic diversity. Second, although stringent quality filtering was applied, the GBS approach inevitably results in missing genotype data and uneven marker coverage across accessions. Finally, the candidate genomic regions identified in this study were inferred from patterns of allele frequency changes and therefore require further validation using larger populations, additional germplasm collections, and functional analyses. Nevertheless, the use of a diverse soybean collection representing different breeding periods and geographical origins provides a robust framework for investigating long-term changes in the genetic structure of cultivated soybean.
Overall, this study illustrates the genetic evolution of cultivated soybean under historical and breeding influences. Established patterns of allele frequency shifts and LD dynamics provide a framework for developing strategies to preserve genetic diversity within soybean breeding programs.

5. Conclusions

A study conducted using the Genotyping-by-Sequencing (GBS) method on 163 cultivated soybean (Glycine max) accessions from the VIR collection revealed important features of the dynamics of genetic diversity and gene pool structure. The obtained data suggest that multiple introductions and adaptive processes have contributed to shaping the diversity of modern soybean varieties. Analysis of SNP marker frequencies and the dynamics of linkage disequilibrium (LD) decay showed that early varieties exhibit slightly higher LD levels, indicating less genetic recombination and a narrower source of breeding material, whereas modern varieties appear to have a broader genetic base, consistent with the incorporation of more diverse breeding material over time. The average level of genetic diversity remained stable across all temporal groups and was comparable to the results of previous studies, although minor changes reflecting evolutionary transformations in the gene pool were identified. Regional variability was also observed, with varieties from China displaying the highest level of diversity. The loci showing variable allele frequencies may represent candidate regions potentially associated with domestication and breeding improvement and therefore warrant further functional validation before their use in marker-assisted selection. No strict correspondence was observed between genetic clustering and geographic origin, which may reflect the complex history of germplasm introduction and exchange. These results highlight the potential value of comprehensive genomic analyses for the conservation, monitoring, and effective utilization of soybean genetic resources. Future studies are planned to expand the sample size and integrate phenotypic data to gain a better understanding of the mechanisms underlying soybean adaptation and improvement.

Supplementary Materials

The following supporting information can be downloaded at https://www.mdpi.com/article/10.3390/d18080480/s1, Table S1: Complete list of studied varieties. Table S2: Marker frequencies changed by more than 0.1 in 25% of cases. Table S3. Genotype data. Figure S1: Principal component analysis (PCA) of 163 soybean accessions based on 17,848 SNP markers. Each point represents an individual accession and is colored according to country of origin. The PCA plot shows substantial overlap among accessions from different geographical groups, indicating the absence of strict geographical separation, while partial differentiation along PC1 and PC2 suggests moderate genetic structuring within the collection.

Author Contributions

Conceptualization, E.K. and I.V.R.; methodology, I.S. and M.T.M.; software, A.V.I.; formal analysis, A.K., F.S. and S.V.T.; investigation, M.T.M., A.V.I. and I.V.R.; writing—original draft preparation, I.V.R.; writing—review and editing, I.S. and E.K. All authors have read and agreed to the published version of the manuscript.

Funding

This review was supported by a grant from the state program of the “Sirius” Federal Territory “Scientific and technological development of the Sirius Federal Territory” (Agreement No. 18-03; date: 10 September 2024).

Data Availability Statement

Data are contained within the article and Supplementary Materials.

Acknowledgments

GBS genotyping of the studied accession set was performed at the National Research Center “Kurchatov Institute” with support from the Ministry of Science and Higher Education of the Russian Federation under the agreement on the provision of a grant in the form of subsidies from the federal budget for state support of the establishment and development of the world-class scientific center “Agrotechnologies for the Future”.

Conflicts of Interest

The authors declare no conflicts of interest.

References

  1. Food and Agriculture Organization of the United Nations. FAOSTAT: Crops and Livestock Products 2024; Food and Agriculture Organization of the United Nations: Rome, Italy, 2024. [Google Scholar]
  2. Kim, M.Y.; Lee, S.; Van, K.; Kim, T.-H.; Jeong, S.-C.; Choi, I.-Y.; Kim, D.-S.; Lee, Y.-S.; Park, D.; Ma, J.; et al. Whole-Genome Sequencing and Intensive Analysis of the Undomesticated Soybean (Glycine Soja Sieb. and Zucc.) Genome. Proc. Natl. Acad. Sci. USA 2010, 107, 22032–22037. [Google Scholar] [CrossRef] [Scilit] [PubMed]
  3. Wang, L.; Lin, F.; Li, L.; Li, W.; Yan, Z.; Luan, W.; Piao, R.; Guan, Y.; Ning, X.; Zhu, L.; et al. Genetic Diversity Center of Cultivated Soybean (Glycine max) in China—New Insight and Evidence for the Diversity Center of Chinese Cultivated Soybean. J. Integr. Agric. 2016, 15, 2481–2487. [Google Scholar] [CrossRef] [Scilit]
  4. Liu, X.; He, J.; Wang, Y.; Xing, G.; Li, Y.; Yang, S.; Zhao, T.; Gai, J. Geographic Differentiation and Phylogeographic Relationships among World Soybean Populations. Crop J. 2020, 8, 260–272. [Google Scholar] [CrossRef] [Scilit]
  5. Hymowitz, T.; Kaizuma, N. Soybean Seed Protein Electrophoresis Profiles from 15 Asian Countries or Regions: Hypotheses on Paths of Dissemination of Soybeans from China. Econ. Bot. 1981, 35, 10–23. [Google Scholar] [CrossRef] [Scilit]
  6. Hymowitz, T. Dorsett-Morse Soybean Collection Trip to East Asia: 50 Year Retrospective. Econ. Bot. 1984, 38, 378–388. [Google Scholar] [CrossRef] [Scilit]
  7. Wysmierski, P.T.; Vello, N.A. The Genetic Base of Brazilian Soybean Cultivars: Evolution over Time and Breeding Implications. Genet. Mol. Biol. 2013, 36, 547–555. [Google Scholar] [CrossRef] [Scilit] [PubMed]
  8. Seferova, I.; Vishnyakova, M. Role of Agricultural Institutions of Chinese-Eastern Railway in the Formation of the Soybean Collection at the Vavilov Institute of Plant Industry and Its Breeding in the USSR. Vavilov J. Genet. Breed. 2015, 18, 572–577. [Google Scholar]
  9. Vishnyakova, M.A.; Alexandrova, T.G.; Buravtseva, T.V.; Burlyaeva, M.O.; Egorova, G.P.; Semenova, E.V.; Seferova, I.V.; Stepanova, I.L.; Yankov, I.I. International Collaboration of VIR as an Important Factor of Replenishing the Collection of Grain Legume Genetic Resources. Proc. Appl. Bot. Genet. Breed. 2018, 179, 23–38. [Google Scholar] [CrossRef] [Scilit]
  10. Sonah, H.; O’Donoughue, L.; Cober, E.; Rajcan, I.; Belzile, F. Identification of Loci Governing Eight Agronomic Traits Using a GBSGWAS Approach and Validation by QTL Mapping in Soya Bean. Plant Biotechnol. J. 2015, 13, 211–221. [Google Scholar] [CrossRef] [Scilit] [PubMed]
  11. Fang, C.; Ma, Y.; Wu, S.; Liu, Z.; Wang, Z.; Yang, R.; Hu, G.; Zhou, Z.; Yu, H.; Zhang, M.; et al. Genome-Wide Association Studies Dissect the Genetic Networks Underlying Agronomical Traits in Soybean. Genome Biol. 2017, 18, 161. [Google Scholar] [CrossRef] [Scilit] [PubMed]
  12. Bhat, J.A.; Yu, D. High-throughput NGS-based Genotyping and Phenotyping: Role in Genomics-assisted Breeding for Soybean Improvement. Legume Sci. 2021, 3, e81. [Google Scholar] [CrossRef] [Scilit]
  13. Li, Y.; Li, W.; Zhang, C.; Yang, L.; Chang, R.; Gaut, B.S.; Qiu, L. Genetic Diversity in Domesticated Soybean (Glycine max) and Its Wild Progenitor (Glycine soja) for Simple Sequence Repeat and Single-nucleotide Polymorphism Loci. New Phytol. 2010, 188, 242–253. [Google Scholar] [CrossRef] [Scilit] [PubMed]
  14. Vaughn, J.N.; Li, Z. Genomic Signatures of North American Soybean Improvement Inform Diversity Enrichment Strategies and Clarify the Impact of Hybridization. G3 GenesGenomesGenetics 2016, 6, 2693–2705. [Google Scholar] [CrossRef] [Scilit] [PubMed]
  15. Liu, Z.; Li, H.; Wen, Z.; Fan, X.; Li, Y.; Guan, R.; Guo, Y.; Wang, S.; Wang, D.; Qiu, L. Comparison of Genetic Diversity between Chinese and American Soybean (Glycine Max (L.)) Accessions Revealed by High-Density SNPs. Front. Plant Sci. 2017, 8, 2014. [Google Scholar] [CrossRef] [Scilit] [PubMed]
  16. Bandillo, N.; Jarquin, D.; Song, Q.; Nelson, R.; Cregan, P.; Specht, J.; Lorenz, A. A Population Structure and Genome-Wide Association Analysis on the USDA Soybean Germplasm Collection. Plant Genome 2015, 8, plantgenome2015.04.0024. [Google Scholar] [CrossRef] [Scilit] [PubMed]
  17. Silva, A.C.D.; Gregorio Da Silva, D.C.; Ferreira, E.G.C.; Abdelnoor, R.V.; Borém, A.; Arias, C.A.; Oliveira, M.F.; Oliveira, M.E.F.D.; Marcelino-Guimarães, F.C. Genetic Diversity, Population Structure in a Historical Panel of Brazilian Soybean Cultivars. PLoS ONE 2025, 20, e0313151. [Google Scholar] [CrossRef] [Scilit] [PubMed]
  18. Li, Y.; Li, D.; Jiao, Y.; Schnable, J.C.; Li, Y.; Li, H.; Chen, H.; Hong, H.; Zhang, T.; Liu, B.; et al. Identification of Loci Controlling Adaptation in Chinese Soya Bean Landraces via a Combination of Conventional and Bioclimatic GWAS. Plant Biotechnol. J. 2020, 18, 389–401. [Google Scholar] [CrossRef] [Scilit] [PubMed]
  19. Kaga, A.; Shimizu, T.; Watanabe, S.; Tsubokura, Y.; Katayose, Y.; Harada, K.; Vaughan, D.A.; Tomooka, N. Evaluation of Soybean Germplasm Conserved in NIAS Genebank and Development of Mini Core Collections. Breed. Sci. 2012, 61, 566–592. [Google Scholar] [CrossRef] [Scilit] [PubMed]
  20. Khlestkina, E.K. Genetic Resources in Russia: From Collections to Bioresource Centers. Proc. Appl. Bot. Genet. Breed. 2022, 183, 9–30. [Google Scholar] [CrossRef] [Scilit]
  21. Vishnyakova, M.A.; Seferova, I.V.; Samsonova, M.G. Genetic sources required for soybean breeding in the context of new biotechnologies (review). Agric. Biol. 2017, 52, 905–916. [Google Scholar] [CrossRef] [Scilit]
  22. Gizlice, Z.; Carter, T.E.; Gerig, T.M.; Burton, J.W. Genetic Diversity Patterns in North American Public Soybean Cultivars Based on Coefficient of Parentage. Crop Sci. 1996, 36, 753–765. [Google Scholar] [CrossRef] [Scilit]
  23. Kanukova, K.; Gazaev, I.; Sabanchieva, L.; Bogotova, Z.; Appaev, S. DNA Markers in Crop Production. Proc. Kabard.-Balkar. Sci. Cent. Russ. Acad. Sci. 2019, 6, 220–232. [Google Scholar] [CrossRef] [Scilit]
  24. Stepochkin, P. Creation and Selective Use of the Wheat and Triticale Gene Pool at SIBNIIRS. Vavilov J. Genet. Breed. 2014, 16, 33–36. [Google Scholar]
  25. Bayona-Vásquez, N.J.; Glenn, T.C.; Kieran, T.J.; Pierson, T.W.; Hoffberg, S.L.; Scott, P.A.; Bentley, K.E.; Finger, J.W.; Louha, S.; Troendle, N.; et al. Adapterama III: Quadruple-Indexed, Double/Triple-Enzyme RADseq Libraries (2RAD/3RAD). PeerJ 2019, 7, e7724. [Google Scholar] [CrossRef] [Scilit] [PubMed]
  26. Ewels, P.; Magnusson, M.; Lundin, S.; Käller, M. MultiQC: Summarize Analysis Results for Multiple Tools and Samples in a Single Report. Bioinformatics 2016, 32, 3047–3048. [Google Scholar] [CrossRef] [Scilit] [PubMed]
  27. Rochette, N.C.; Rivera-Colón, A.G.; Catchen, J.M. Stacks 2: Analytical Methods for Paired-end Sequencing Improve RADseq-based Population Genomics. Mol. Ecol. 2019, 28, 4737–4754. [Google Scholar] [CrossRef] [Scilit] [PubMed]
  28. Schmutz, J.; Cannon, S.B.; Schlueter, J.; Ma, J.; Mitros, T.; Nelson, W.; Hyten, D.L.; Song, Q.; Thelen, J.J.; Cheng, J.; et al. Genome Sequence of the Palaeopolyploid Soybean. Nature 2010, 463, 178–183. [Google Scholar] [CrossRef] [Scilit] [PubMed]
  29. Langmead, B.; Salzberg, S.L. Fast Gapped-Read Alignment with Bowtie 2. Nat. Methods 2012, 9, 357–359. [Google Scholar] [CrossRef] [Scilit] [PubMed]
  30. Danecek, P.; Bonfield, J.K.; Liddle, J.; Marshall, J.; Ohan, V.; Pollard, M.O.; Whitwham, A.; Keane, T.; McCarthy, S.A.; Davies, R.M.; et al. Twelve Years of SAMtools and BCFtools. GigaScience 2021, 10, giab008. [Google Scholar] [CrossRef] [Scilit] [PubMed]
  31. Alexander, D.H.; Novembre, J.; Lange, K. Fast Model-Based Estimation of Ancestry in Unrelated Individuals. Genome Res. 2009, 19, 1655–1664. [Google Scholar] [CrossRef] [Scilit] [PubMed]
  32. Nei, M. Analysis of Gene Diversity in Subdivided Populations. Proc. Natl. Acad. Sci. USA 1973, 70, 3321–3323. [Google Scholar] [CrossRef] [Scilit] [PubMed]
  33. Fang, X.; Wang, L.; Deng, X.; Wang, P.; Ma, Q.; Nian, H.; Wang, Y.; Yang, C. Genome-Wide Characterization of Soybean P 1B -ATPases Gene Family Provides Functional Implications in Cadmium Responses. BMC Genom. 2016, 17, 376. [Google Scholar] [CrossRef] [Scilit] [PubMed]
  34. Contador, C.A.; Liu, A.; Ng, M.; Ku, Y.; Chan, S.H.J.; Lam, H. Contextualized Metabolic Modelling Revealed Factors Affecting Isoflavone Accumulation in Soybean Seeds. Plant Cell Environ. 2026, 49, 3543–3559. [Google Scholar] [CrossRef] [Scilit] [PubMed]
  35. Rosa-Téllez, S.; Anoman, A.D.; Flores-Tornero, M.; Toujani, W.; Alseek, S.; Fernie, A.R.; Nebauer, S.G.; Muñoz-Bertomeu, J.; Segura, J.; Ros, R. Phosphoglycerate Kinases Are Co-Regulated to Adjust Metabolism and to Optimize Growth. Plant Physiol. 2018, 176, 1182–1198. [Google Scholar] [CrossRef] [Scilit] [PubMed]
  36. Mishra, A.K.; Choi, J.; Rabbee, M.F.; Baek, K.-H. In Silico Genome-Wide Analysis of the ATP-Binding Cassette Transporter Gene Family in Soybean (Glycine Max L.) and Their Expression Profiling. BioMed Res. Int. 2019, 2019, 8150523. [Google Scholar] [CrossRef] [Scilit] [PubMed]
  37. Huang, J.; Li, X.; Chen, X.; Guo, Y.; Liang, W.; Wang, H. Genome-Wide Identification of Soybean ABC Transporters Relate to Aluminum Toxicity. Int. J. Mol. Sci. 2021, 22, 6556. [Google Scholar] [CrossRef] [Scilit] [PubMed]
  38. Zhu, X.; Wang, H.; Li, Y.; Rao, D.; Wang, F.; Gao, Y.; Zhong, W.; Zhao, Y.; Wu, S.; Chen, X.; et al. A Novel 10-Base Pair Deletion in the First Exon of GmHY2a Promotes Hypocotyl Elongation, Induces Early Maturation, and Impairs Photosynthetic Performance in Soybean. Int. J. Mol. Sci. 2024, 25, 6483. [Google Scholar] [CrossRef] [Scilit] [PubMed]
  39. Kafri, M.; Patena, W.; Martin, L.; Wang, L.; Gomer, G.; Ergun, S.L.; Sirkejyan, A.K.; Goh, A.; Wilson, A.T.; Gavrilenko, S.E.; et al. Systematic Identification and Characterization of Genes in the Regulation and Biogenesis of Photosynthetic Machinery. Cell 2023, 186, 5638–5655.e25. [Google Scholar] [CrossRef] [Scilit] [PubMed]
  40. Van, K.; McHale, L. Meta-Analyses of QTLs Associated with Protein and Oil Contents and Compositions in Soybean [Glycine Max (L.) Merr.] Seed. Int. J. Mol. Sci. 2017, 18, 1180. [Google Scholar] [CrossRef] [Scilit] [PubMed]
  41. Paraskevopoulos, K.; Kriegenburg, F.; Tatham, M.H.; Rösner, H.I.; Medina, B.; Larsen, I.B.; Brandstrup, R.; Hardwick, K.G.; Hay, R.T.; Kragelund, B.B.; et al. Dss1 Is a 26S Proteasome Ubiquitin Receptor. Mol. Cell 2014, 56, 453–461. [Google Scholar] [CrossRef] [Scilit] [PubMed]
  42. Li, C.; Li, Y.; Li, Y.; Lu, H.; Hong, H.; Tian, Y.; Li, H.; Zhao, T.; Zhou, X.; Liu, J.; et al. A Domestication-Associated Gene GmPRR3b Regulates the Circadian Clock and Flowering Time in Soybean. Mol. Plant 2020, 13, 745–759. [Google Scholar] [CrossRef] [Scilit] [PubMed]
  43. Song, Z.; Liu, J.; Qian, X.; Xia, Z.; Wang, B.; Liu, N.; Yi, Z.; Li, Z.; Dong, Z.; Zhang, C.; et al. Functional Verification of the Soybean Pseudo-Response Factor GmPRR7b and Regulation of Its Rhythmic Expression. Int. J. Mol. Sci. 2025, 26, 2446. [Google Scholar] [CrossRef] [Scilit] [PubMed]
  44. Waterworth, W.M.; Footitt, S.; Bray, C.M.; Finch-Savage, W.E.; West, C.E. DNA Damage Checkpoint Kinase ATM Regulates Germination and Maintains Genome Stability in Seeds. Proc. Natl. Acad. Sci. USA 2016, 113, 9647–9652. [Google Scholar] [CrossRef] [Scilit] [PubMed]
  45. Yoshiyama, K.O.; Kobayashi, J.; Ogita, N.; Ueda, M.; Kimura, S.; Maki, H.; Umeda, M. ATM-mediated Phosphorylation of SOG1 Is Essential for the DNA Damage Response in Arabidopsis. EMBO Rep. 2013, 14, 817–822. [Google Scholar] [CrossRef] [Scilit] [PubMed]
  46. Holmberg, S. Soybeans for Cool Temperate Climates. Agri Hort. Genet. 1973, 31, 1–20. [Google Scholar]
  47. Li, B.; Wang, T.; Liu, M.; Wang, L.; Liu, H.; Jin, T.; Hu, T.; Li, K.; Zhi, H. Characterization of the Soybean GmCCS-GmCSN5B-GmVTC1 Pathway and Its Functional Roles Under Soybean Mosaic Virus Infection. Plants 2026, 15, 1020. [Google Scholar] [CrossRef] [Scilit] [PubMed]
  48. Kim, W.J.; Kang, B.H.; Moon, C.Y.; Kang, S.; Shin, S.; Chowdhury, S.; Choi, M.-S.; Park, S.-K.; Moon, J.-K.; Ha, B.-K. Quantitative Trait Loci (QTL) Analysis of Seed Protein and Oil Content in Wild Soybean (Glycine soja). Int. J. Mol. Sci. 2023, 24, 4077. [Google Scholar] [CrossRef] [Scilit] [PubMed]
  49. Saleem, A.; Muylle, H.; Aper, J.; Ruttink, T.; Wang, J.; Yu, D.; Roldán-Ruiz, I. A Genome-Wide Genetic Diversity Scan Reveals Multiple Signatures of Selection in a European Soybean Collection Compared to Chinese Collections of Wild and Cultivated Soybean Accessions. Front. Plant Sci. 2021, 12, 631767. [Google Scholar] [CrossRef] [Scilit] [PubMed]
  50. Bisen, A.; Khare, D.; Nair, P.; Tripathi, N. SSR Analysis of 38 Genotypes of Soybean (Glycine Max (L.) Merr.) Genetic Diversity in India. Physiol. Mol. Biol. Plants 2015, 21, 109–115. [Google Scholar] [CrossRef] [Scilit] [PubMed]
  51. Lachance, J.; Tishkoff, S.A. SNP Ascertainment Bias in Population Genetic Analyses: Why It Is Important, and How to Correct It. BioEssays 2013, 35, 780–786. [Google Scholar] [CrossRef] [Scilit] [PubMed]
Figure 1. The estimation of the population number according to a.
Diversity 18 00480 g001
Figure 2. Genome-wide SNP-based population genetic structure of 163 Glycine max cultivars with different origins from the VIR collection. Bar plots illustrating the admixture coefficients from an ADMIXTURE analysis (K = 2–4) based on 17,848 SNPs. Different colors represent different clusters. Each vertical bar represents an accession and is divided into proportions based on the contribution of different ancestral components.
Diversity 18 00480 g002
Figure 3. Linkage disequilibrium (LD) decay in soybean accessions from different chronological groups. LD decay was estimated as the decrease in pairwise r2 values with increasing physical distance between SNP markers. Curves represent accessions developed before 1959, during 1960–1989, and from 1990 to the present. The dashed horizontal line indicates the r2 = 0.2 threshold used to estimate LD decay distance; vertical dashed lines indicate the corresponding decay distances for each chronological group.
Diversity 18 00480 g003
Table 1. Genetic diversity in three groups of varieties considering different chronological periods.
Parameter Group I
(Before 1959)
Group II
(1960–1989)
Group III
(1990–Today)
All Accessions
Number of varieties416854163
Genetic diversity0.2070.1960.1900.202
95% CI0.204–0.2100.194–0.1990.187–0.1930.200–0.205
Table 2. Markers with the highest allele frequency change in the three study groups.
Marker IDChromosome Polymorphism Group I Group IIGroup III The Difference Between Group 1 and Group 3
NC_016091.4:44171244T/A 0.720.330.20.52
NC_038245.2:44916469C/G 0.860.450.330.53
NC_038245.2:44916999C/T 0.860.430.330.53
NC_038249.2:12995229 13C/T 0.640.390.090.55
NC_038249.2:12995259 13A/G 0.640.390.090.55
NC_038249.2:12995292 13T/C 0.640.390.090.55
NC_038249.2:1299529913T/G0.640.390.090.55
NC_038250.2:4668142314G/T0.680.230.170.51
NC_038252.2:3297557916A/T0.780.530.260.53
NC_038253.2:3335951217A/G0.740.380.190.55
NC_038253.2:3335961617T/C0.740.380.210.53
NC_038253.2:3335963817G/A0.710.350.190.52
NC_038253.2:3349999317T/C0.770.330.130.64
NC_038256.2:146927520G/A0.720.330.20.52
NC_038256.2:3424049620A/T0.860.450.330.53
NC_016091.4:435401334A/G0.110.330.590.48
NC_016091.4:439969954G/T0.140.320.610.48
NC_016091.4:437615944T/C0.130.350.600.47
Table 3. Functional annotation of candidate genes that contain SNP markers with pronounced shifts in allele frequencies.
Marker IDChromosome Polymorphism Gene NameFunction
NC_016091.4:4417124 4T/A NO *No annotated gene overlaps this SNP position
NC_038245.2:4491646 9C/G Glyma.09G052000Putative heavy metal P1B-type ATPase/HMA protein; potentially involved in metal ion transport, ion homeostasis, and heavy-metal stress response [33]
NC_038245.2:4491699 9C/T
NC_038249.2:12995229 13C/T Glyma.13G045400Phosphoglycerate kinase; involved in glycolysis, central carbon metabolism, ATP production, and energy metabolism [34,35]
NC_038249.2:12995259 13A/G
NC_038249.2:12995292 13T/C
NC_038249.2:1299529913T/G
NC_038250.2:4668142314G/TGlyma.14G193300Putative ABC transporter; potentially involved in membrane transport, metabolite/ion transport, and stress-related responses [36,37]
NC_038252.2:3297557916A/TLOC100777354Predicted protein; specific molecular function requires further validation.
NC_038253.2:3335951217A/GGlyma.17G205700Putative PIIR1-like protein; potentially associated with photosynthetic machinery, chloroplast-related processes, and light response [38,39]
NC_038253.2:3335961617T/C
NC_038253.2:3335963817G/A
NC_038253.2:3349999317T/CNONo annotated gene overlaps this SNP position.
NC_038256.2:146927520G/AGlyma.20G016100Predicted/uncharacterized protein; no experimentally supported functional annotation is currently available.
NC_038256.2:3424049620A/TGlyma.20G099500Candidate gene located within a seed oil-related QTL region; possible association with seed composition traits requires further validation [40]
NC_016091.4:435401334A/GGlyma.04G181200Putative DSS1/26S proteasome complex subunit; potentially involved in ubiquitin-mediated protein degradation and protein turnover [41]
NC_016091.4:439969954G/TGlyma.04G183600Putative pseudo-response regulator gene; potentially involved in circadian clock regulation, flowering time, and photoperiodic response [42,43]
NC_016091.4:437615944T/CGlyma.04G182900ATM-related serine/threonine kinase; potentially involved in DNA repair, DNA damage response, protein phosphorylation, and genome stability [44,45]
* NO indicates that no annotated gene overlaps the corresponding SNP position.
Table 4. Genetic diversity in groups of varieties of different origins.
ParameterCanadaRussiaUSA ChinaMoldova
Number of varieties1729202812
Genetic diversity0.1720.1860.1880.2030.192
95% CI0.169–0.1740.184–0.1890.186–0.1910.201–0.2060.189–0.195
Disclaimer/Publisher’s Note: The statements, opinions and data contained in all publications are solely those of the individual author(s) and contributor(s) and not of MDPI and/or the editor(s). MDPI and/or the editor(s) disclaim responsibility for any injury to people or property resulting from any ideas, methods, instructions or products referred to in the content.