Article

Structure and Spatio-Temporal Dynamics of Marine Communities Associated with the Kelp Forests at Cape Froward, Strait of Magellan


by
Mathias Hüne
1,
Mauricio Palacios
1,2,*,
Benjamín Rodríguez-Stepke
1,3,
Jonathan Poblete
1,
Mauricio F. Landaeta
3,4,
Alexandra Camilla-Vivar
3,
Tamara Segovia-Jara
3,5,
Dayane Osman
1,
Javiera Álvarez
1 and
Ignacio Garrido
6
1
Fundación Rewilding Chile, Puerto Varas 5550447, Chile
2
Centro de Investigación de Ecosistemas de la Patagonia (CIEP/PATSER), Coyhaique 5951369, Chile
3
Laboratorio de Ictiología e Interacciones Biofísicas (LABITI), Instituto de Biología, Facultad de Ciencias, Universidad de Valparaíso, Valparaíso 6513482, Chile
4
Centro de Observación y Análisis del Océano Costero (COSTA-R), Universidad de Valparaíso, Viña del Mar 7750000, Chile
5
Laboratorio de Ecología y Morfometría Evolutiva, Instituto One Health, Universidad Andrés Bello, Santiago 8370035, Chile
6
Laboratorio Costero de Recursos Acuáticos de Calfuco (ICML), Facultad de Ciencias, Universidad Austral de Chile, Valdivia 5090000, Chile
*
Author to whom correspondence should be addressed.
Diversity 2026, 18(8), 472; https://doi.org/10.3390/d18080472
Submission received: 22 June 2026 / Revised: 30 July 2026 / Accepted: 31 July 2026 / Published: 5 August 2026
(This article belongs to the Section Marine Diversity)

Abstract

Giant kelp forests, Macrocystis pyrifera, dominate the coasts of southern Patagonia and are particularly abundant in the coastal ecosystems of Cape Froward, where they play a key role in biodiversity conservation and the provision of multiple ecosystem services, establishing themselves as one of the most resilient kelp forest ecosystems on the planet. This study constitutes one of the first spatiotemporal assessments of the diverse components inhabiting kelp forests in the Strait of Magellan (Cape Froward). In total, 238 taxa belonging to zooplankton, benthic invertebrates, fish, and understory of macroalgae inhabiting the understory were identified in these ecosystems, including species that are key to the coastal communities of the Magellan region. In general terms, the results show that the coastal ecosystems of Cape Froward support highly diverse, dynamic, and complex communities, with characteristics representative of ecological systems of regional and global significance. In this regard, the present study provides a solid scientific basis for promoting conservation measures for these ecosystems at the southern tip of Patagonia.

1. Introduction

Strait of Magellan (54° S) is the result of a series of geodynamic, tectonic, and glacial events that affected southern South America during the Last Glacial Maximum (LGM), between 23,000 and 19,000 years ago, a period during which the largest glacial ice sheets in South American Patagonia were recorded [1,2,3]. Currently, this extensive geographic area forms part of the Patagonian Fjords and Channels System (PFCS), which extends between 42° and 56° S. It is characterized by a distinctive geomorphology, including fjords, channels, and islands, with a marked glacial influence on the water bodies [4]. This condition results in the region exhibiting notable environmental heterogeneity, where temperature, salinity, tidal range, and circulation patterns are strongly influenced by water masses originating from the southeastern Pacific [5]. These water masses define its thermohaline characteristics, which are modulated by freshwater inflows, the tidal regime, and winds [6].
In the southernmost segment of the Strait of Magellan, Cape Froward stands out. It forms part of the central sub-basin that extends from Carlos III Island to Segunda Angostura. This area is characterized by estuarine and brackish waters [7]. Furthermore, it has been described as a zone of upwelling, resulting from the differences in depth between Carlos III Island (~60 m) and Cape Froward (>500 m) [8]. Due to these conditions, Cape Froward and its surroundings constitute a rich marine ecosystem. These oceanographic and geomorphological characteristics have allowed for a wide variety of habitats and biotopes in this region of Southern Patagonia [9], where the substrate is highly variable, ranging from soft-bottom areas to rocky reef systems [10]. Key ecosystem components include extensive kelp forests, primarily giant kelp Macrocystis pyrifera (Linnaeus) C. Agardh 1820. This species is described as a keystone species [11] and is considered the most resilient kelp species on the planet, with a stability for almost 200 years in Patagonia [12].
The M. pyrifera forests in southern Patagonia have been identified as marine biodiversity hotspots [13,14,15,16]. In fact, Darwin, upon his first encounter with the Southern Ocean, recognized and highlighted their importance in the coastal marine ecosystem [17]. This significance is directly linked to their three-dimensional morphology and highly plastic, adaptable physiological characteristics [18]. The heterogeneous structure that these forests form in the environment determines relevant physicochemical and hydrological properties in the coastal setting [19,20,21,22]. This feedback has implications for ecological processes within the forest, where important community attributes—such as structure, diversity, dominance, food web dynamics, and productivity [11]—can vary significantly depending on the architectural and functional traits of the kelp forest [20,23,24,25,26].
Much of the research on the components of the marine ecosystem in the Cape Froward area has been limited to descriptions of the abundance, richness, and spatial variation in the macro-benthic community [27,28,29], as well as specific studies of pico- and nano-phytoplankton assemblages [30]. In addition, some studies have examined specific taxa, such as the 14 species of echinoderms described by Mutschke and Ríos [31], and others have aimed to describe the trophic structure in the area, including Cape Froward, which identifies the interactions among 135 taxa of marine organisms [32]. On the other hand, there are only isolated studies that partially describe the population dynamics and morpho-functional aspects of M. pyrifera forest ecosystems, as well as the diversity of macroinvertebrates and macroalgae associated with them in the Águila bay area [33], leaving much of the eastern section of the Brunswick Peninsula, including Cape Froward, without data. However, despite the fragmented nature of the available data, in other areas of southern Patagonia, the structural role of kelp forests on certain components of these marine ecosystems—such as macroinvertebrates and fish—has been documented [34,35,36], without including others such as zooplankton and macroalgae.
It is well known that the highly heterogeneous composition of benthic systems in the PFCS results in strong gradients in physical disturbances, including changes in water column optics and movement, substrate type, depth, and seasonality, which affect biological processes and interactions within kelp forests [18,37,38,39,40,41,42]. Given this background, it is particularly important to understand the composition of the biota associated with these southern ecosystems and their spatiotemporal changes, not only by focusing on specific components but also by seeking to expand this knowledge. Therefore, assessing whether the population structure of the kelp forest overlaps with abiotic engineering processes regarding the structuring of associated assemblages of zooplankton, macroinvertebrates, fish, and macroalgae [25,43,44] is a line of research that has been explored little in high-latitude ecosystems in the Southern Hemisphere.
This study presents one of the first spatio-temporal assessments of various components of the kelp forest ecosystems of southern Patagonia and aims to highlight their structural role in an area of the Strait of Magellan (Cape Froward) that has been identified as a major marine ecosystem critical for biodiversity conservation and with a great potential to mitigate the effects of global climate change. For all the reasons outlined above, the objective of this study is to characterize the biodiversity of the communities comprising zooplankton, invertebrates, fish, and understory macroalgae, as well as their spatiotemporal variation in the marine ecosystems of Cape Froward, which are dominated by M. pyrifera forests. We hypothesize that biodiversity and community structure of zooplankton, benthic invertebrates, fish, and understory macroalgae that inhabit the M. pyrifera forests at Cape Froward exhibit spatio-temporal variation. Our study will provide background information on the role of the kelp forests at Cape Froward and Strait of Magallan as keystone species [11], capable of providing refuge, food resources, and reproductive areas for numerous marine species [45], thereby modulating the composition and structure of these communities.

2. Materials and Methods

2.1. Study Site and Data Collection

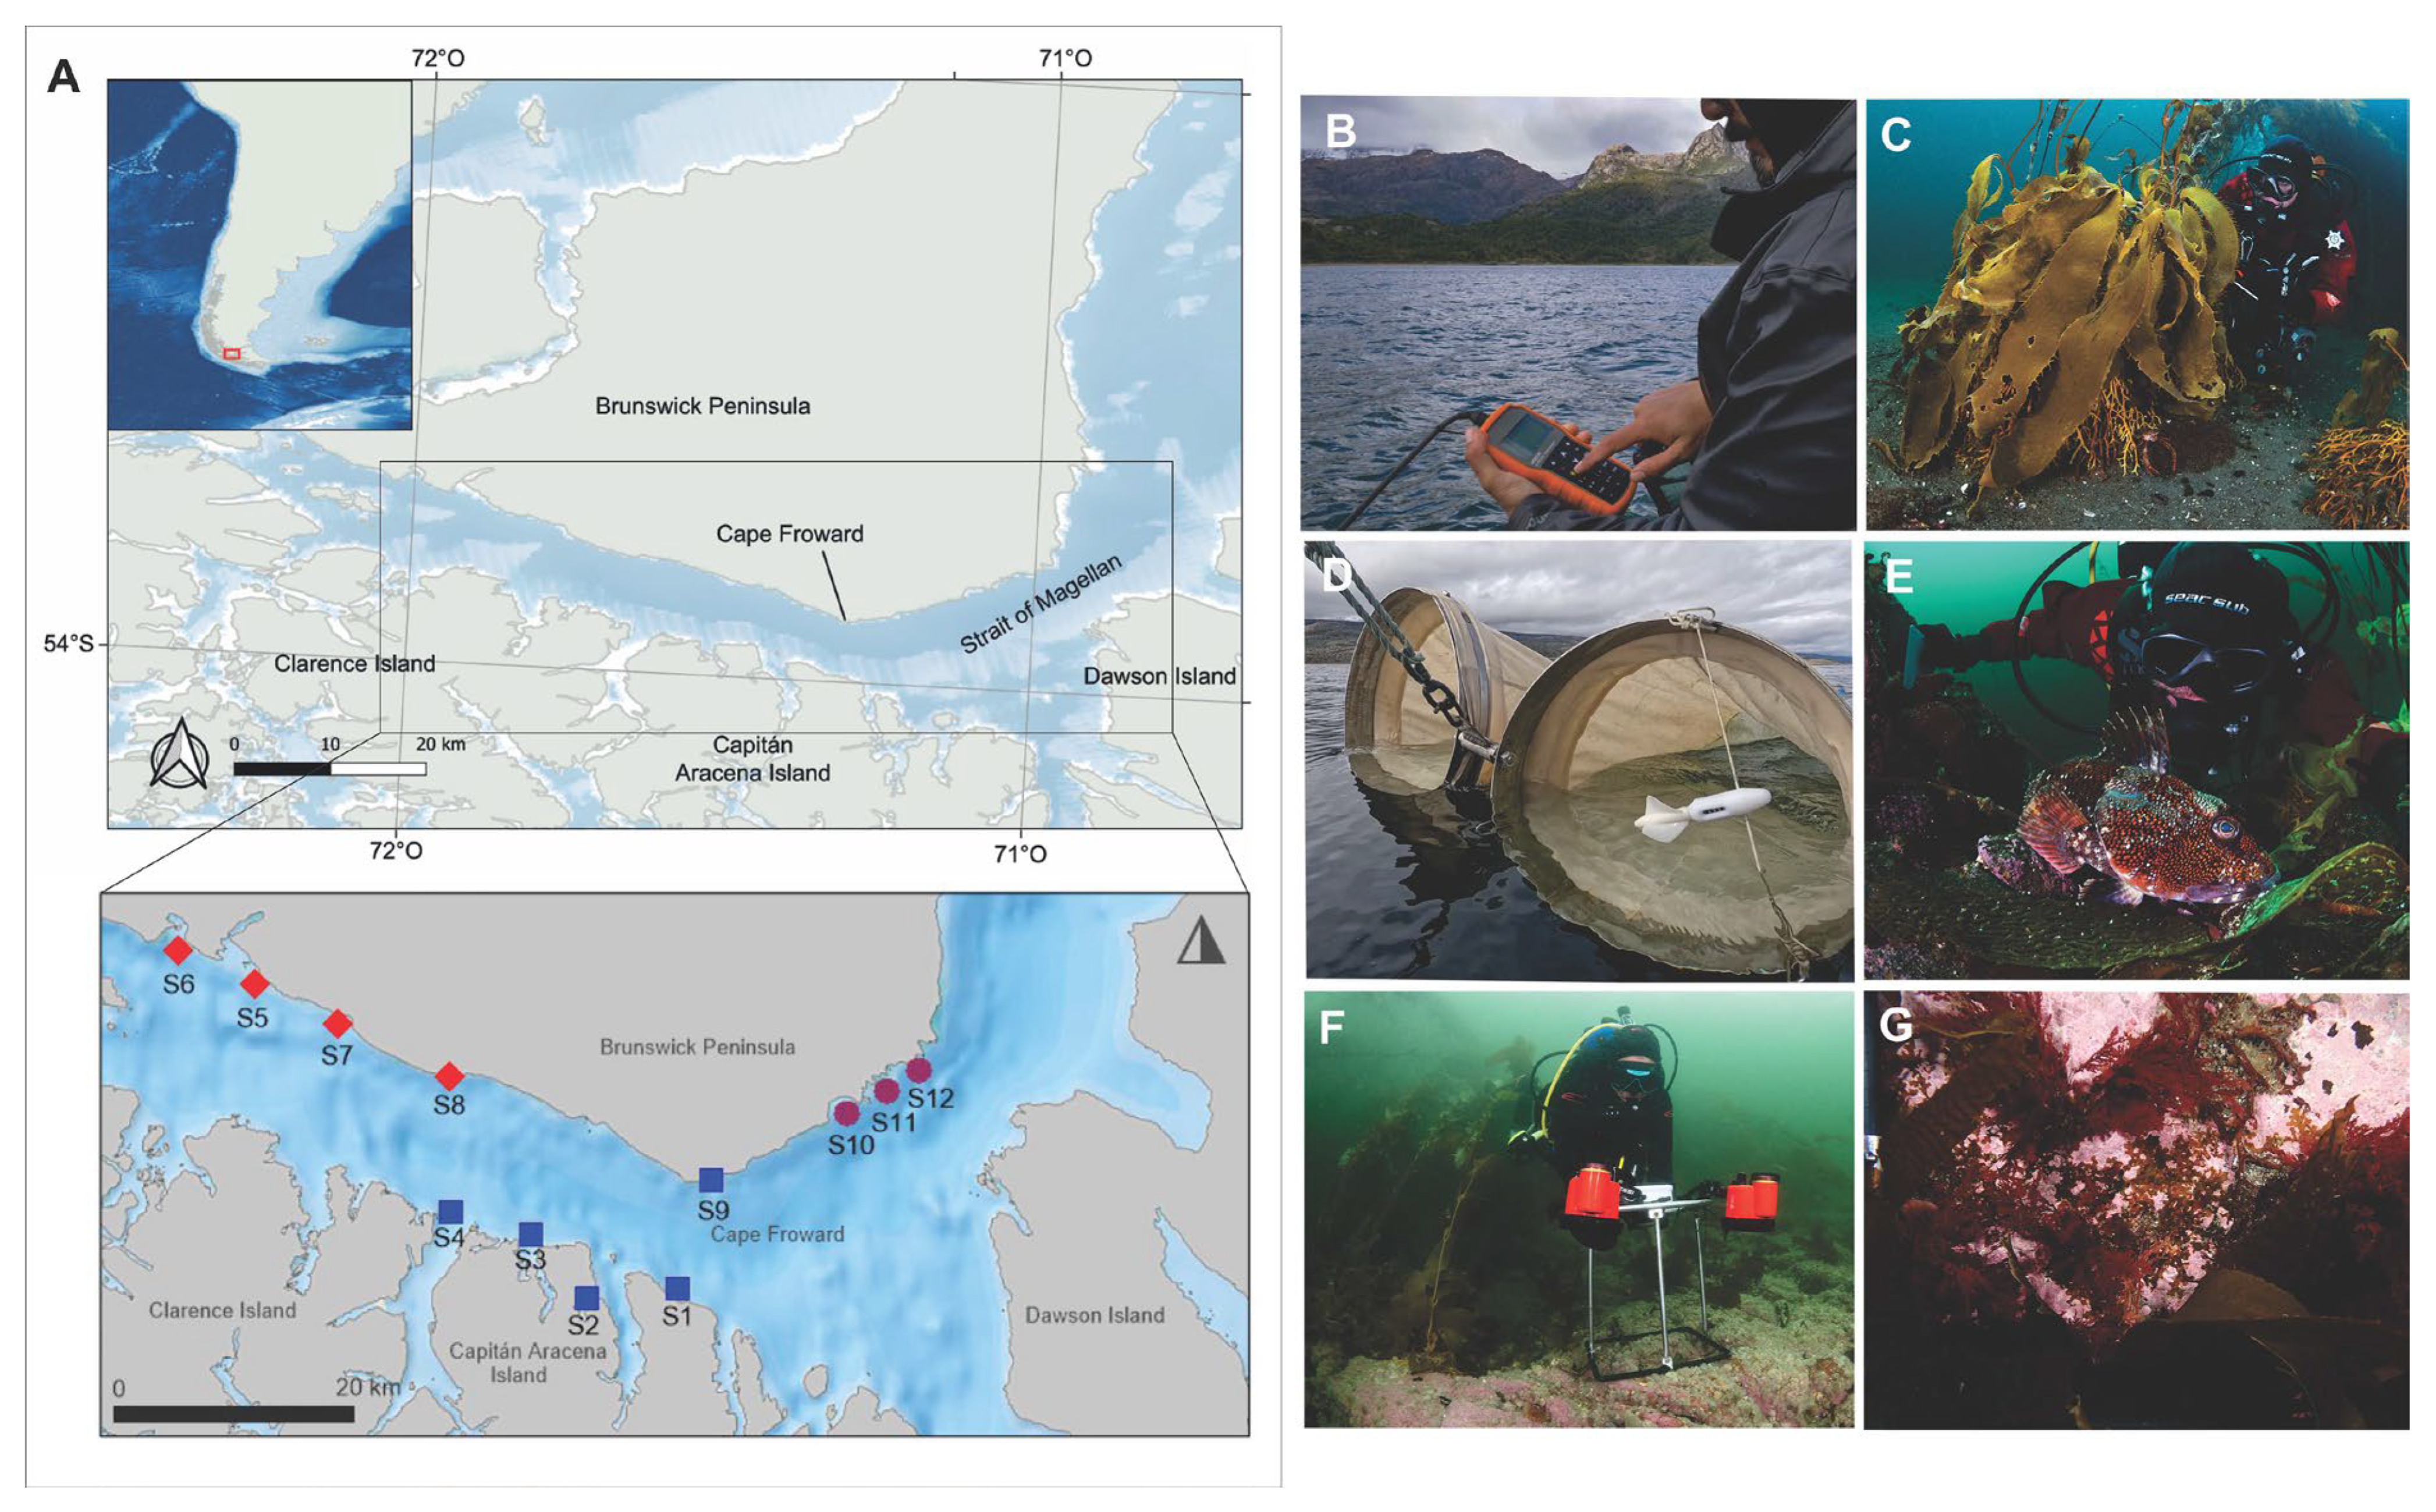
Two field surveys were conducted nearby and inside shallow forests of giant kelp, M. pyrifera, located in Cape Froward area, Magellan Strait, southern Chilean Patagonia. The first survey was carried out from 5–11 November 2024 (spring), and the second from 14–20 May 2025 (autumn). A total of 12 stations per season were surveyed (Figure 1). Sampling sites were selected to represent the spatial variability of the study area along the western side of the Strait of Magellan, with stations classified as west, central, and east, according to the Cape Froward area.
Prior to each survey, temperature (°C), salinity (psu) and dissolved oxygen (mg·L−1) measurements were taken at a depth of 5 m below the surface using a Hanna Instruments HI98494 multiparameter probe (Hanna Instruments, Inc., Smithfield, RI, USA), and a Secchi disk was used to measure water transparency (m).

2.2. Abundance and Density of Kelp Forests

To estimate wet biomass (kg ind−1), we collected whole M. pyrifera individuals across a representative range of size classes (>20 per sector). For everyone, we recorded the maximum holdfast diameter (cm), maximum holdfast height (cm), number of stipites, total length (m), and individual wet biomass (kg) to develop an allometric model for estimating individual wet biomass. To identify the most robust morphometric variable for individual wet biomass (kg ind−1), we applied a stepwise multiple regression analysis [46]. The regression models were fitted using linear least squares, forced to pass through the origin (b0 = 0), and evaluated using analysis of variance (ANOVA). Next, individual wet biomass (kg) was estimated using a power-law allometric relationship; wet biomass = α × modelb, where a represents the predictor variable, modelb is the multiplicative scaling constant derived from the regression analysis. This allometric approach is standard practice for estimating individual biomass in large brown algae [33,47,48].
Each 25 m transect was then surveyed by a diver, who covered a 1 m wide area on either side of the line, resulting in a total sampled area of 50 m2 per transect (n = 2 transects at each station). For each transect, we recorded the density of M. pyrifera individuals per m2 and the morphometric variable identified as an estimator of wet biomass (e.g., diameter and height of holdfast, or number of stipites) estimated from the regression models. After recording the morphometric variable that best describes the wet biomass of M. pyrifera, we estimated biomass at the individual level (kg ind−1) and then quantified biomass per unit area (kg m−2). This analysis was conducted at the level of the 50 m2 transect, allowing estimation of the density and abundance of M. pyrifera per m2.

2.3. Marine Communities Associated with the Kelp Forests

2.3.1. Zooplankton

At each of the 12 stations, oblique tows were conducted from a maximum depth of 20–30 m to the surface, at a distance of 20–30 m from the kelp forest. A standard Bongo net (60 cm in diameter, 300 μm mesh size) equipped with a Hydro-Bios flowmeter (Altenholz, Germany) was used to estimate the volume of filtered seawater. The tows lasted 20–35 min, depending on the site’s depth. Samples were fixed using 5% formalin buffered with sodium borate. Each sample was examined thoroughly under a Leica EZ4 stereomicroscope (Leica Microsystems, Wetzlar, Germany). All organisms were counted and identified to the lowest possible taxonomic level, using specialized literature [49,50].

2.3.2. Visual Kelp Forest Fish Census

Subtidal transects were surveyed at each of the stations where kelp forests were present during the spring and autumn surveys. At each study site, a diver identified and counted all fish species within 1 m on either side of a 25 m transect line (50 m2) (n = 2 transects at each station). Since most fish species are benthic and cryptic, the transects were conducted by the same diver between 0.5 and 1 m above the sea floor at a uniformly slow swimming speed of 2 m min−1 [36,51]. The transects were conducted parallel to the shoreline.

2.3.3. Invertebrates and Macroalgae of the Understory

After completing the fish survey in the 25 m transect (50 m2), a second diver photographed a 0.06 m2 quadrant (n = 40) in situ, alternating between both sides of the transect within 1 m on either side, recording the presence of invertebrates and understory vegetation inhabiting the kelp forest. To ensure complete coverage of each quadrant, the camera was kept approximately 1 m above the substrate. The photo-transects were conducted using an Olympus TG-7 camera (OM Digital Solutions Corporation, Hachioji-City, Tokyo) in an Ikelite waterproof housing, a wide-angle lens, and two Inon strobes at approximately 1 m above the benthos. Identification of invertebrates and the understory components was performed at the lowest possible taxonomic level, using specialized literature.

2.4. Statistical Analysis

2.4.1. Abiotic and Biotic Factors

Environmental variables (temperature (°C), salinity (psu), dissolved oxygen (mg L−1) and transparency (m)) and structural characteristics of the M. pyrifera forest, represented by density (ind. m−2) and biomass (kg m−2), were first evaluated in terms of their distribution using the Shapiro–Wilk normality test. Based on these results, relationships between M. pyrifera density and wet biomass and environmental variables were explored using bivariate correlation analyses, applying Pearson’s correlation coefficient for normally distributed variables and Spearman’s rank correlation otherwise. All multivariate analyses were conducted in PRIMER-e v7 [52], while diversity calculations were performed in PAST v4.03 [53].

2.4.2. Structure and Diversity of Marine Communities

Richness was interpreted as mixed-level taxonomic [54], rather than strict species richness, due to the identification of taxa at different hierarchical levels. Taxon accumulation curves were generated based on presence/absence data to assess the representativeness of the sampling effort. Additionally, expected richness was estimated using the non-parametric Chao2 estimator [55], which is appropriate for incidence data and accounts for the frequency of rare taxa (i.e., those occurring in one or two samples). This approach allowed the evaluation of sampling completeness and the potential underestimation of observed richness. These analyses were conducted using the EstimateS v9.1 software [56].
To assess spatial and temporal patterns in community composition, a two-way PERMANOVA was first applied based on a Jaccard similarity matrix derived from presence/absence data, evaluating differences among spatial sectors (west, central and east coast) and seasons (spring and autumn). Subsequently, a similarity percentage analysis (SIMPER) was conducted to decompose community variability and identify the taxa contributing most to significant differences among groups. Patterns in assemblage structure were then visualized using non-metric multidimensional scaling (nMDS), hierarchical clustering (CLUSTER), and clustered heatmaps. In addition, richness maps were generated to represent spatial patterns of taxonomic richness across sampling events.

3. Results

3.1. General Observations

Environmental conditions showed low variability between sampling periods. Temperature ranged from 7.2 to 8.4 °C in spring 2024 and from 7.3 to 8.5 °C in autumn 2025. During spring, slightly higher values were recorded in the central sector (7.3–8.4 °C), whereas the eastern sector showed lower values (7.2–7.4 °C). In autumn, the highest temperatures were observed in the western sector (8.1–8.5 °C), while the remaining sectors showed similar values. Salinity remained stable across all stations and sampling periods, ranging between 28.2 and 28.9 psu, with no clear spatial differences (Table 1).
The main seasonal differences were observed in dissolved oxygen and water transparency. During spring 2024, oxygen concentrations ranged between 7.2 and 9.3 mg L−1, with relatively similar values among sectors, while transparency was low (4.5–9 m). In autumn 2025, dissolved oxygen concentrations ranged between 5.5 and 7.6 mg L−1, whereas transparency increased markedly across the study area, reaching up to 18 m in the western sector and between 13 and 16 m in the central and eastern sectors (Table 1).
The wet biomass and density of the kelp forests showed spatial variation; however, regarding seasonal patterns, it was not possible to identify clear patterns of change across the entire study area. During spring 2024, the western sector recorded the highest biomass values, with S5 reaching the maximum of the entire dataset (4.5 kg m−2), while the remaining stations in this sector showed considerably lower values (S6: 0.3 kg m−2; S7–S8: 0.6 kg m−2). The central sector presented intermediate biomass (1.0–2.9 kg m−2), with S2 as the most productive station (2.9 kg m−2), whereas the western sector recorded the lowest overall values (0.8–1.9 kg m−2). Density followed a similar spatial pattern, ranging from 0.10 ind. m−2 (S4) to 0.37 ind. m−2 (S5) across all sectors (Table A1). In autumn of 2025, wet biomass increased at most stations compared to the spring, along with a change in the spatial pattern of abundance. The central and eastern sectors showed more homogeneous values (1.1–2.3 kg m−2), with S10 and S12 reaching the highest values of the season (2.0 and 2.3 kg m−2, respectively), while the eastern sector recorded the lowest abundance in the kelp forests, particularly in S6 (0.6 kg m−2). Density also decreased across all sectors during autumn, with values ranging from 0.09 ind. m−2 (S11) to 0.23 ind. m−2 (S9), with the lowest densities recorded in the eastern sector (Table A1).

3.2. Richness Composition

3.2.1. Zooplankton

A marked seasonal shift in zooplankton composition was observed, with a total of 106 taxonomic groups recorded and a clear decline from spring (95 taxa) to autumn (62 taxa). During spring, 30 taxa were identified, whereas this number decreased to 14 in autumn. The spring assemblage was occurrence by early larval stages of cirripedes (Cirripedia nauplii: 100%; Table 2), along with the presence of ophiuroid larvae (Ophiura larvae: 100%) and bryozoan larvae (Cyphonaute larvae: 100%). In contrast, autumn was mainly characterized by the predominance of bryozoan larvae (Cyphonaute larvae: 100%) and the persistence of Muggiaea atlantica (Cunningham, 1892) (92%). Additionally, a higher diversity of early crustacean stages was observed in spring, including brachyuran zoeae (100%) and cirripede nauplii (100%), whereas in autumn, this diversity declined considerably, being largely restricted to cypris larvae (8%). Regarding ichthyoplankton, eight taxonomic groups were recorded in spring (fish eggs: 100%), whereas only one group was detected in autumn. Accordingly, both meroplankton and ichthyoplankton showed higher proportions in spring (24.7% and 0.7%, respectively), decreasing markedly in autumn (2.4% and 0.001%).
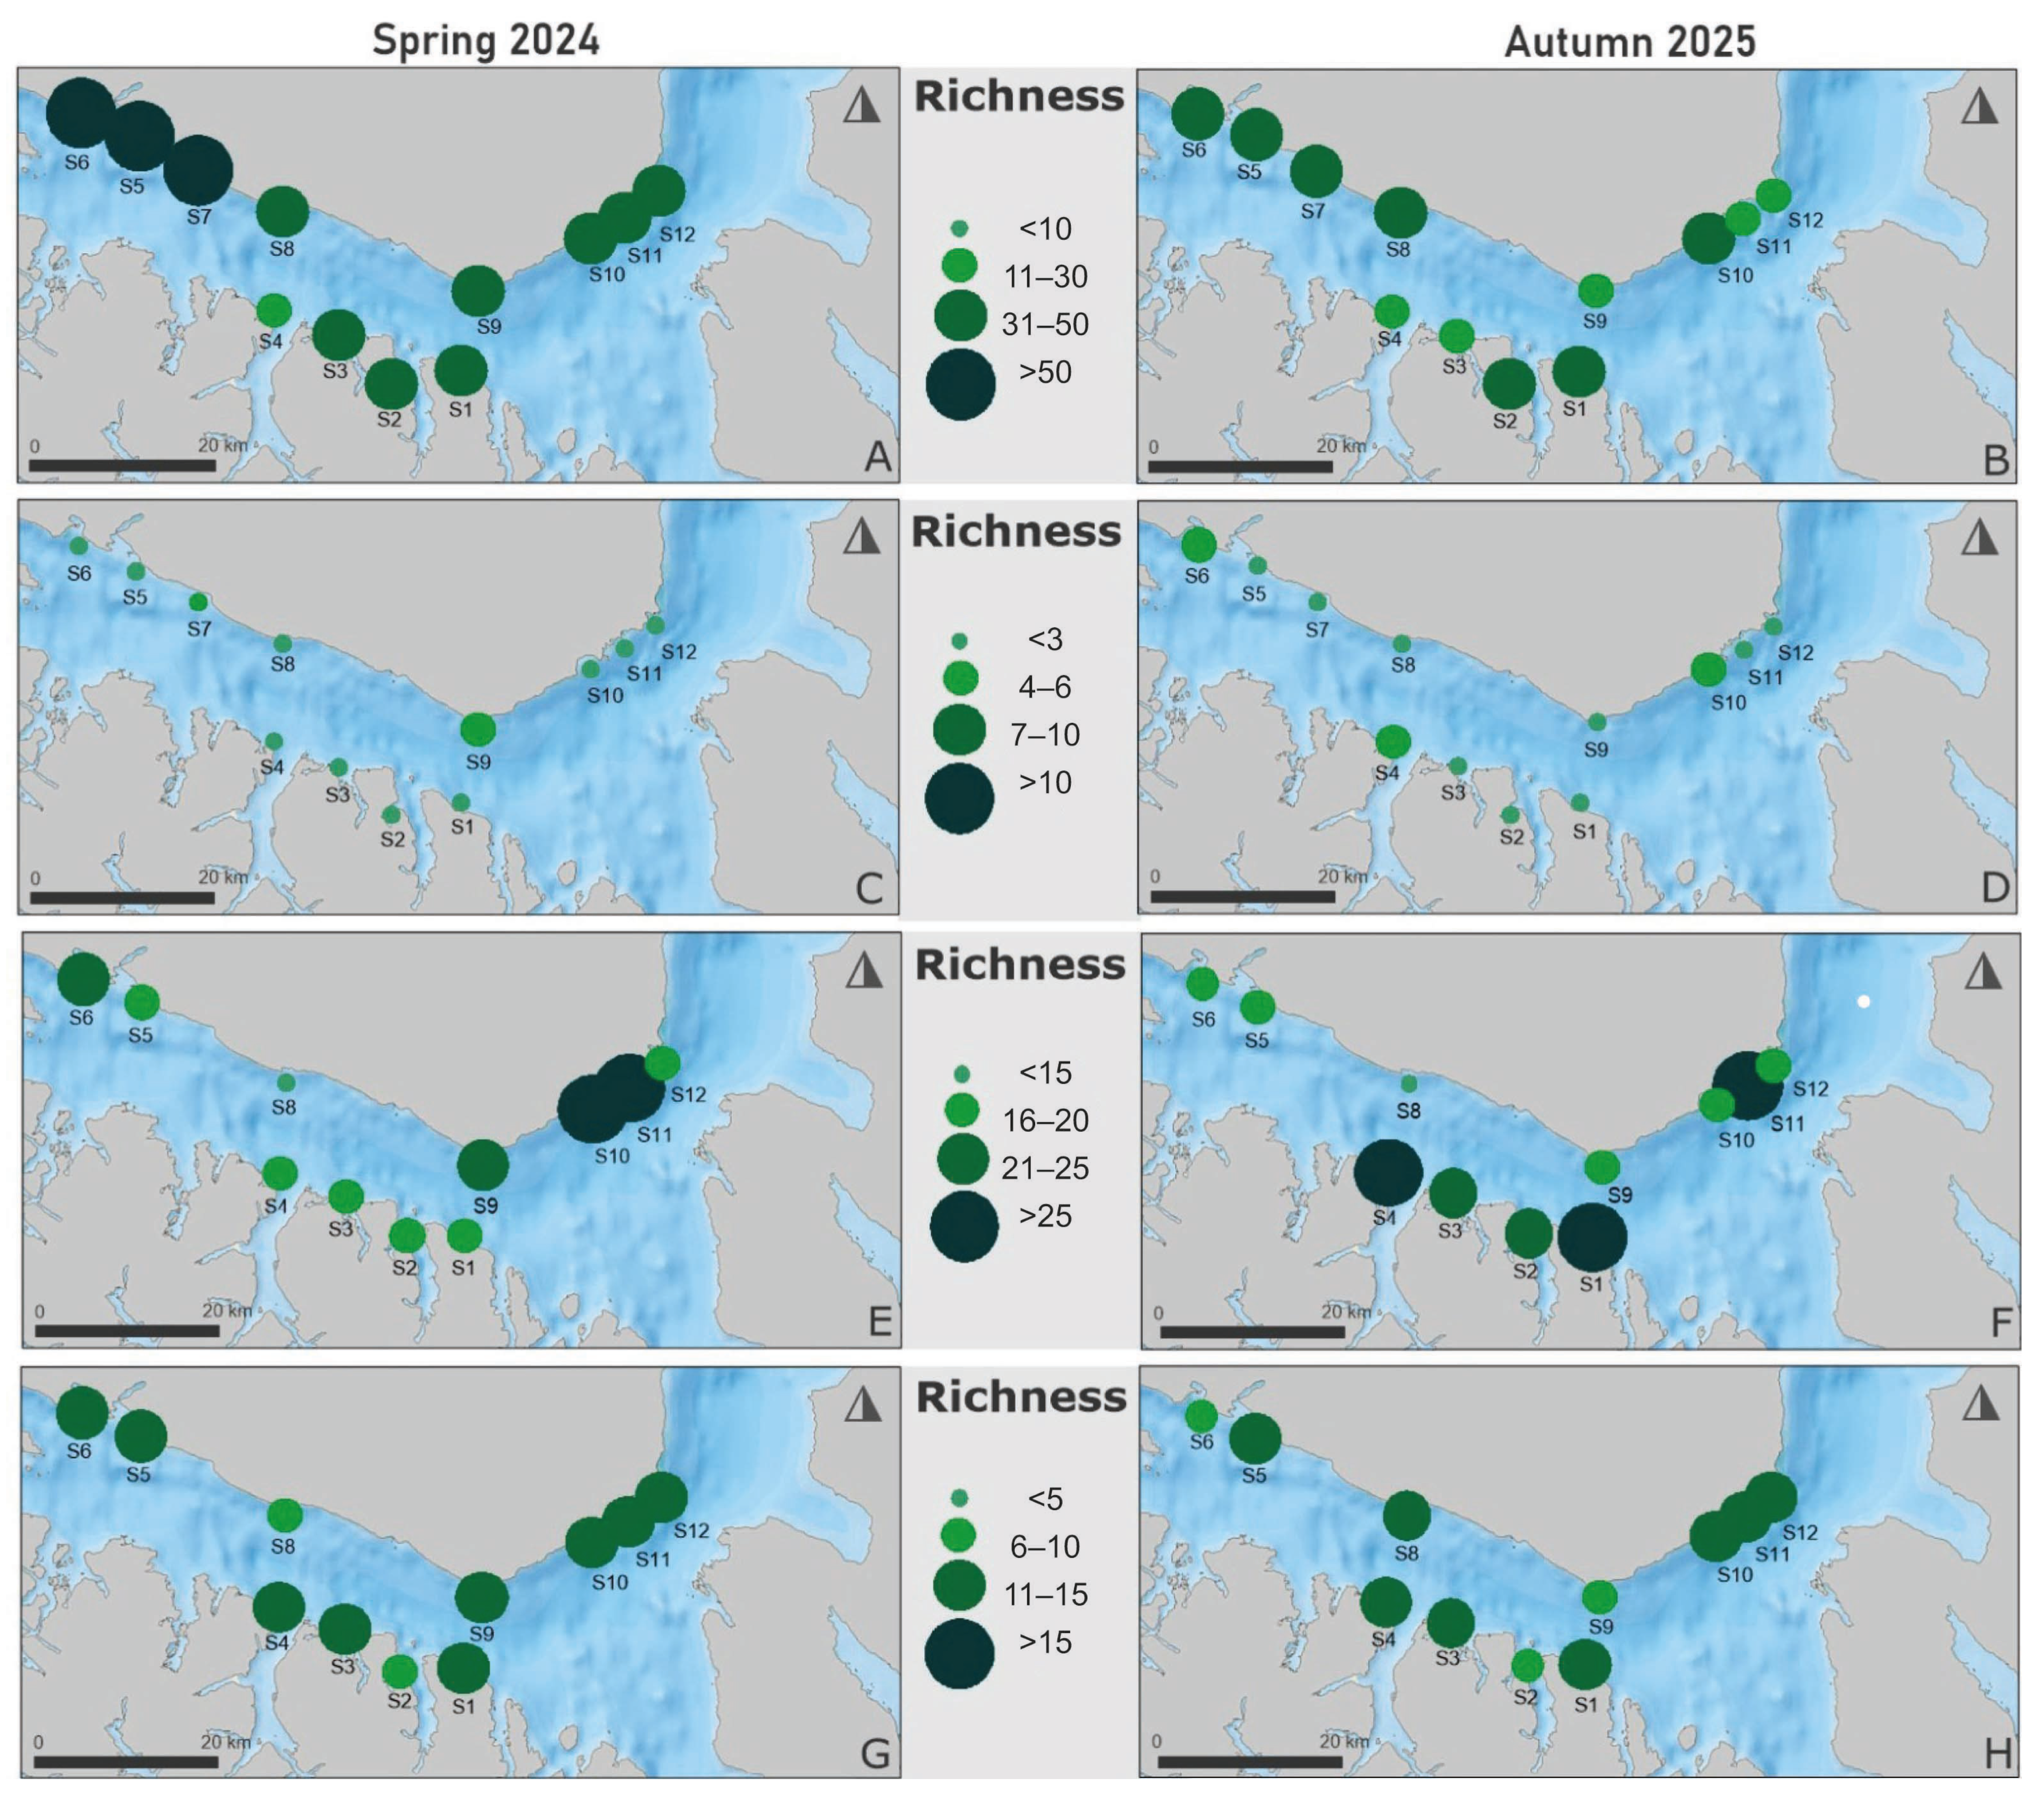
The spatiotemporal distribution of taxonomic richness decreased consistently across all sampling stations toward autumn 2025. During spring, richness exhibited a longitudinal gradient along the study area (Figure 2A,B). The highest values were concentrated in the western sector, particularly at stations S5–S7, where 51–56 taxa were recorded, while the eastern sector showed intermediate values (38–41 taxa) and the central sector displayed greater variability (21–50 taxa; Figure 2A,B). In contrast, during autumn, species richness was considerably lower and more homogeneous, ranging between 17 and 26 taxa. During this period, the longitudinal gradient disappeared, with an overall reduction in maximum values and lower spatial differentiation among stations.
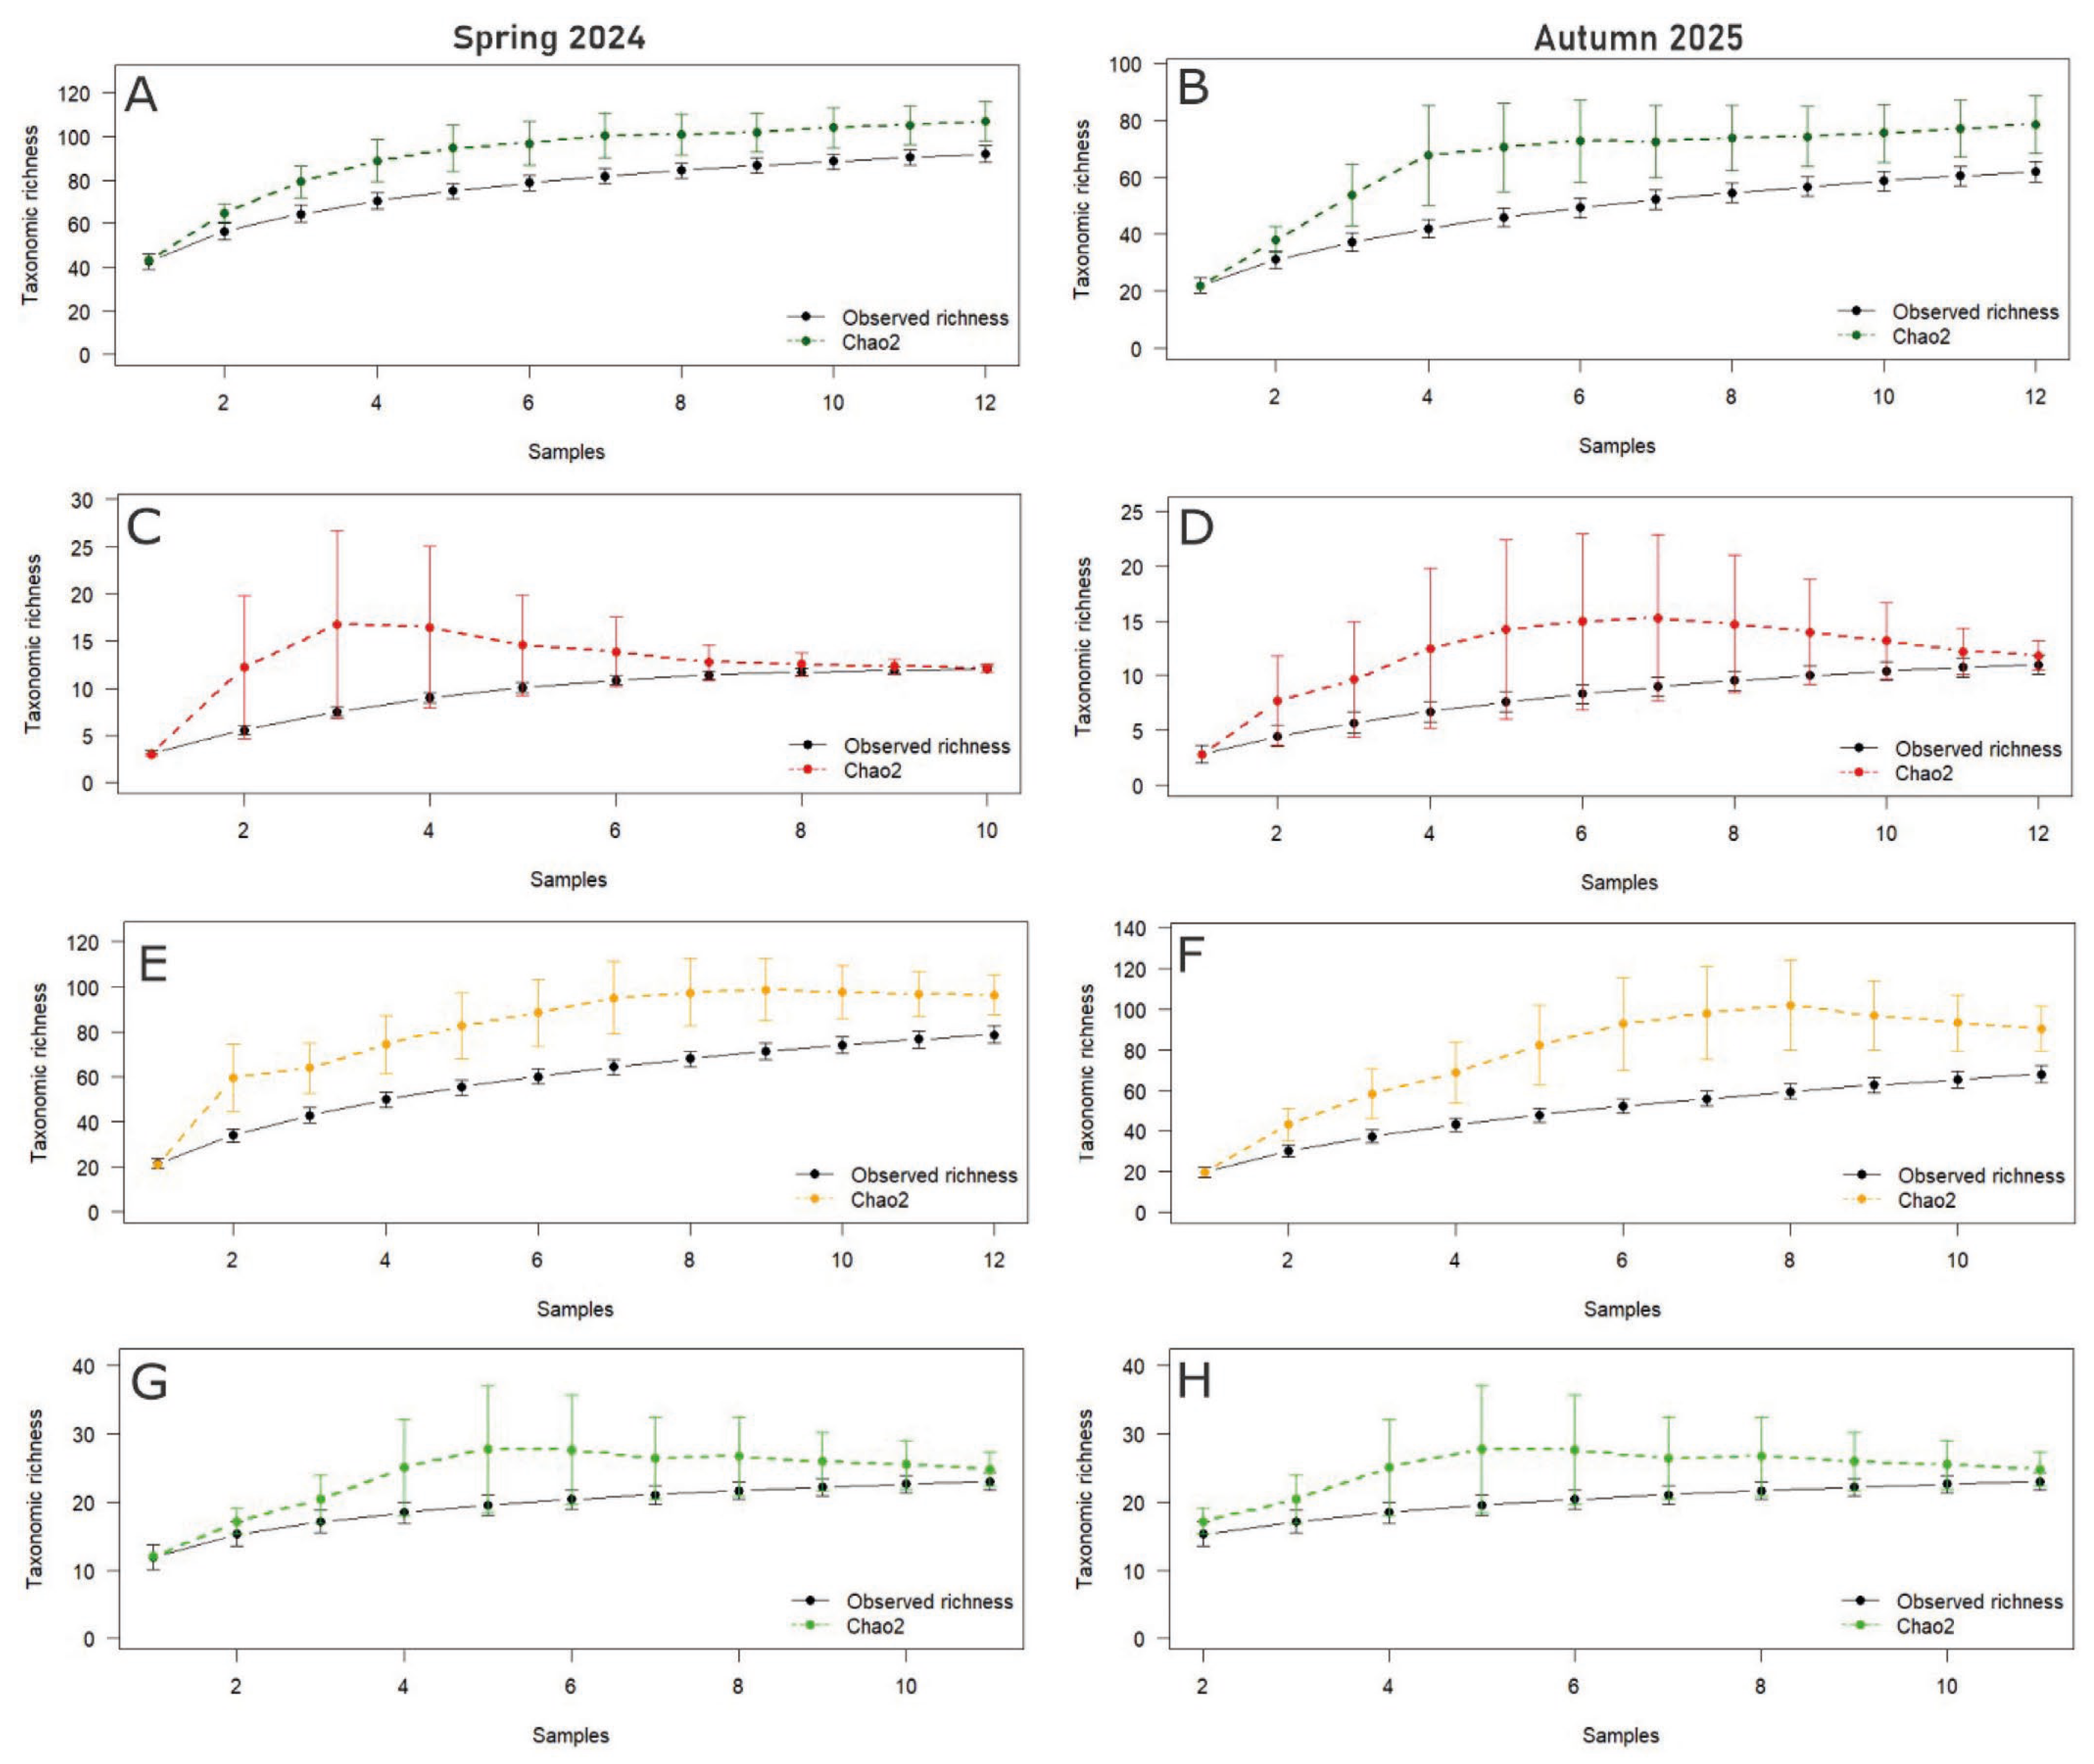
In the early stages of sampling, zooplankton showed a rapid increase in observed richness, followed by a more gradual rise without reaching a clear asymptote in either season. In spring, observed richness approached 90–95 taxa toward the final samples, while the Chao2 estimator stabilized around 100–105 taxa, maintaining a consistent difference from observed richness. In autumn, observed richness increased to 60–65 taxa, whereas Chao2 reached values close to 75–80 taxa, remaining higher than observed values throughout the sampling effort. The lack of convergence between observed richness and Chao2 indicates that additional taxa could be recorded with increased sampling effort (Figure A1A,B).
Significant relationships were found between zooplankton richness and several abiotic variables. Richness was strongly and negatively correlated with water transparency (m; rs = −0.57, p = 0.01), while showing a positive association with dissolved oxygen concentration (mg L−1; rs = 0.51, p = 0.01). No significant trends were found with temperature (T°C; rs = −0.08, p = 0.73) or salinity (psu; rs = 0.29, p = 0.17). Zooplankton richness was also not significantly correlated with kelp forest structure, including biomass (rs = −0.16, p = 0.46) and density (rs = 0.35, p = 0.09) (Table A6).

3.2.2. Kelp Forest Fish

A total of 12 fish species were recorded during the study, half of which (6 species) belong to the family Nototheniidae, representing 50% of the total assemblage richness. In spring, 10 species were identified, with Patagonotothen tessellata (Richardson, 1845) being the most frequent (75%), followed by Patagonotothen cornucola (Richardson, 1844) and Patagonotothen spp. (both 50%), all of them broadly distributed across sampling stations. Of these, about 67% are fish in the invertebrate-feeding group, while only 33% are piscivorous and invertebrate-feeding. (Table 3). By autumn, richness increased slightly to 11 species. During this period, Patagonotothen spp. became the most frequent taxon (83%), while P. cornucola remained relatively common (58%), and P. tessellata decreased in frequency (33%). Seasonal changes were also evident in the occurrence of less frequent species. For instance, Pogonolychus marinae (Lloris, 1988) and Patagonotothen longipes (Steindachner, 1876) (0–17%) were only recorded in autumn, whereas Myxine sp. was restricted to spring (8–0%). In contrast, species such as Cottoperca trigloides (Forster, 1801), Austrolycus depressiceps (Regan, 1913), and Leptonotus blainvilleanus (Eydoux & Gervais, 1837) showed similar frequencies between seasons, although their overall occurrence remained low (Table 3).
Spatially, fish richness displayed a relatively homogeneous pattern between spring 2024 and autumn 2025, with no clear differences along the longitudinal gradient of the strait (Figure 2C,D). During spring, richness ranged from 1 to 4 species per station, with slightly higher values at central and eastern stations (e.g., S9–S10). In autumn, richness varied between 0 and 4 species, maintaining a similar spatial structure but with greater variability, particularly in the western sector, where both low and relatively high values were observed (Figure 2C,D).
In both seasons, species accumulation curves for fish taxa showed a gradual increase in observed richness, approaching an asymptote toward the final samples. In spring, observed richness approached ~12 taxa, and the Chao2 estimator, after an early peak (16–17 taxa), declined and overlapped with observed values around ~12–13 taxa. In autumn, observed richness increased progressively to ~11–12 taxa, while Chao2 reached ~14–15 taxa at intermediate sampling effort and then decreased slightly toward ~12–13 taxa, also reducing the difference toward the end. These patterns indicate good sampling representativeness, with a low proportion of undetected species, particularly in spring (Figure A1C,D).
Spearman rank correlations did not reveal significant relationships between fish richness and abiotic variables, including temperature (T°C; rs = 1.00, p = 0.40), salinity (psu; rs = −0.03, p = 0.90), dissolved oxygen (mg L−1; rs = −0.30, p = 0.15), and water transparency (m; rs = 0.27, p = 0.21). In contrast, fish richness showed significant negative associations with kelp forest structure, including biomass (rs = −0.54, p = 0.01) and density (rs = −0.46, p = 0.02), indicating a decrease in fish richness as the kelp forest increases (Table A6).

3.2.3. Benthic Invertebrates

During spring 2024, a total of 76 benthic invertebrate taxa associated with the M. pyrifera forest were recorded at Cape Froward. The assemblage was dominated by Mollusca (21 taxa; 27.6%), followed by Echinodermata (15 taxa; 19.7%), Arthropoda (12 taxa; 15.8%), Cnidaria (8 taxa; 10.5%), and Porifera (6 taxa; 7.9%) (Table 4). Together, these groups accounted for more than 80% of the total recorded taxa. Within these dominant groups, Gastropoda and Decapoda contributed the highest taxonomic richness. The most frequent taxa, recorded across multiple stations, included Nacella spp., Cosmasterias lurida (Philippi, 1858), Pseudechinus magellanicus (Philippi, 1857), and representatives of Holothuroidea. In autumn 2025, the benthic invertebrate assemblage at Cape Froward comprised 75 taxa. As in spring, Mollusca was the dominant group (20 taxa; 26.7%), followed by Echinodermata (14 taxa; 18.7%), Arthropoda (12 taxa; 16.0%), Cnidaria (7 taxa; 9.3%), and Annelida (5 taxa; 6.7%). Together, these groups accounted for more than 75% of the total recorded taxa (Table 4).
At the species level, several taxa exhibited marked differences in frequency between seasons, while others remained relatively constant. During spring, high frequencies were observed for Actiniaria (58%), Hydrozoa (58%), Nacella spp. (83%), Cirripedia (83%), C. lurida (83%), and P. magellanicus (75%), many of which were recorded in more than 75% of the stations. In contrast, during autumn, taxa such as Porifera (92%), Polychaeta (83%), Cirripedia (92%), and C. lurida (92%) increased in frequency, with some reaching values above 80–90%, indicating a broader spatial occurrence during this period. Conversely, species such as Pagurus comptus (White, 1847) (58% to 33%) and Nacella deaurata (Gmelin, 1791) (58% to 42%) showed a decrease in frequency from spring to autumn. A subset of taxa displayed relatively stable frequencies across both seasons, including Actiniaria (58% in both periods), Fissurella sp. (50% in both periods), and Gastropoda (83% in both periods), suggesting temporal persistence in their spatial distribution (Table 4).
During spring, the highest richness values were recorded at stations located in the eastern sector of the fjord (S10 and S11), both with 35 taxa. Intermediate richness values were observed at stations S6 and S9 (23 taxa), whereas the lowest richness was recorded at station S8, with only 7 taxa (Figure 2E). In contrast, during autumn, the spatial pattern shifted, with the highest richness recorded at station S4 (36 taxa), followed by S11 (28 taxa). In addition, stations S6 and S9 exhibited decreases in richness of more than 20% relative to spring season (Figure 2F).
The Chao2 estimator was higher than observed richness in both spring and autumn, suggesting that additional species could be recorded (Figure A1E,F). However, differences in the shape of the curves were observed between seasons. In spring, observed richness did not reach a clear asymptote, maintaining an increasing trend toward the final samples (~80 taxa), whereas the Chao2 estimator tended to stabilize in the last samples at around 95–100 taxa, maintaining a gap with observed richness. In autumn, observed richness also continued to increase progressively (~65–70 taxa), without reaching full stabilization, while the Chao2 estimator reached maximum values close to 95–100 taxa in the intermediate samples, remaining relatively stable toward the end.
A significant negative relationship was found between benthic invertebrate richness and temperature (rs = −0.43, p = 0.03), indicating a decrease in richness with increasing temperature. No significant relationships were detected with other abiotic variables, including salinity (rs = −0.14, p = 0.51), dissolved oxygen (mg L−1; rs = −0.02, p = 0.92), and water transparency (rs = −0.04, p = 0.87). Similarly, benthic richness showed no significant association with kelp forest structure, including biomass (rs = −0.25, p = 0.25) and density (rs = −0.11, p = 0.60) (Table A6).

3.2.4. Understory of Macroalgae

During the sampling, a total of 27 understories of macroalgal taxa associated with kelp forests were recorded. In spring, 25 taxa were identified, dominated by Rhodophyta (60%), followed by Ochrophyta (28%) and Chlorophyta (12%), whereas 24 taxa were recorded in autumn (Table 5). Differences in the frequency of occurrence of several taxa were observed between seasons. Some species showed high frequency in both periods, including Ulva sp. (spring–autumn; 75–82%), Codium sp. (60–64%), and Desmarestia confervoides (Bory) M.E. Ramírez & A.F. Peters 1993 (91–82%), suggesting their role as persistent components of the assemblage. In contrast, several taxa increased their frequency during autumn, notably crustose red algae (75–100%), Desmarestia ligulata (Stackhouse) J.V. Lamouroux 1813 (33–64%), Sarcopeltis skottsbergii (Setchell & N.L. Gardner) Hommersand, Hughey, Leister & P.W. Gabrielson 2020 (33–82%), Corallina sp. (67–91%), and Ptilonia magellanica (Montagne) J. Agardh 1852 (42–90%). On the other hand, some taxa showed a marked decrease or absence in autumn, such as Iridaea cordata (Turner) Bory 1826 (50–0%), Phycodrys rubens (Linnaeus) Batters 1902 (68–0%), Plocamium secundatum (Kützing) Kützing 1866 (58–9%), and Palmaria sp. (50–9%), evidencing a seasonal turnover in macroalgal assemblage composition (Table 5).
Richness exhibited a consistent spatial pattern between spring 2024 and autumn 2025, maintaining an overall structure along the longitudinal gradient (Figure 2G,H). During spring, mean richness was approximately ~13 taxa in the western sector, compared to ~10.8 taxa in the central sector and ~10.7 taxa in the eastern sector of Cape Froward. In contrast, during autumn, although the general spatial structure was maintained, differences among sectors tended to decrease, with mean values of ~12.3 taxa in the eastern sector, ~12 taxa in the central sector, and ~8.5 taxa in the western sector (Figure 2G,H). The latter also showed higher variability, including extreme values that increased dispersion among stations.
Observed richness increased gradually with sampling effort in both seasons, approaching an asymptote toward the final samples. In spring, observed richness tended to stabilize between samples 8–11, reaching values close to 22 taxa, while the Chao2 estimator converged around 25–27 taxa. In autumn, stabilization occurred earlier, approximately from sample 6 onward, with similar observed richness values (22–24 taxa) and Chao2 estimates close to 24–26 taxa (Figure A1G,H). The Chao2 estimator was consistently higher than observed richness, particularly at early sampling stages, but tended to converge with observed values as sampling effort increased.
Regarding environmental conditions, Spearman rank correlations revealed no significant relationships between macroalgal taxonomic richness and abiotic variables, including temperature (°C; rs = −0.22, p = 0.30), salinity (psu; rs = −0.37, p = 0.08), dissolved oxygen (mg L−1; rs = 0.14, p = 0.52), and water transparency (m; rs = −0.04, p = 0.84), although a marginal negative trend was observed with salinity. Additionally, local variability in M. pyrifera does not directly explain patterns of richness across sampling sites, as richness showed no significant association with kelp forest structure, including biomass (rs = −0.09, p = 0.68) and density (rs = −0.02, p = 0.93) (Table A6).

3.3. Spatial and Temporal Patterns

3.3.1. Zooplankton

Zooplankton assemblage composition did not show significant differences among sectors (central, western, and eastern; PERMANOVA, pseudo-F = 0.927, p = 0.437). Pairwise comparisons confirmed the absence of differences between all sector combinations (central vs. western: p = 0.316; central vs. eastern: p = 0.801; western vs. eastern: p = 0.134), indicating a lack of spatial structuring in assemblage composition. In contrast, assemblage composition differed significantly between sampling periods (spring and autumn; PERMANOVA, pseudo-F = 14.96, p < 0.001). Pairwise comparisons confirmed these differences (p < 0.001), indicating a marked temporal shift in zooplankton assemblage structure. The SIMPER analysis indicated an overall average dissimilarity of 69.55% between spring and autumn zooplankton assemblages (Table A2). This dissimilarity was mainly explained by a set of taxa with relatively low individual contributions. The taxa contributing most to the observed differences included Ctenocalanus citer (Heron & Bowman, 1971) (cumulative contribution: 13.0%), followed by fish eggs (15.1%), Themisto gaudichaudii (Guérin, 1825) (17.2%), Ophiuroidea larvae (19.3%), cirripede nauplii (21.4%), brachyuran zoea (23.5%), and euphausiid nauplii (25.6%). Additional contributions were provided by Bougainvillia spp. (27.6%), Calyptopis stages (29.5%), and Evadne tergestina (Claus, 1864) (31.4%; Table A2).
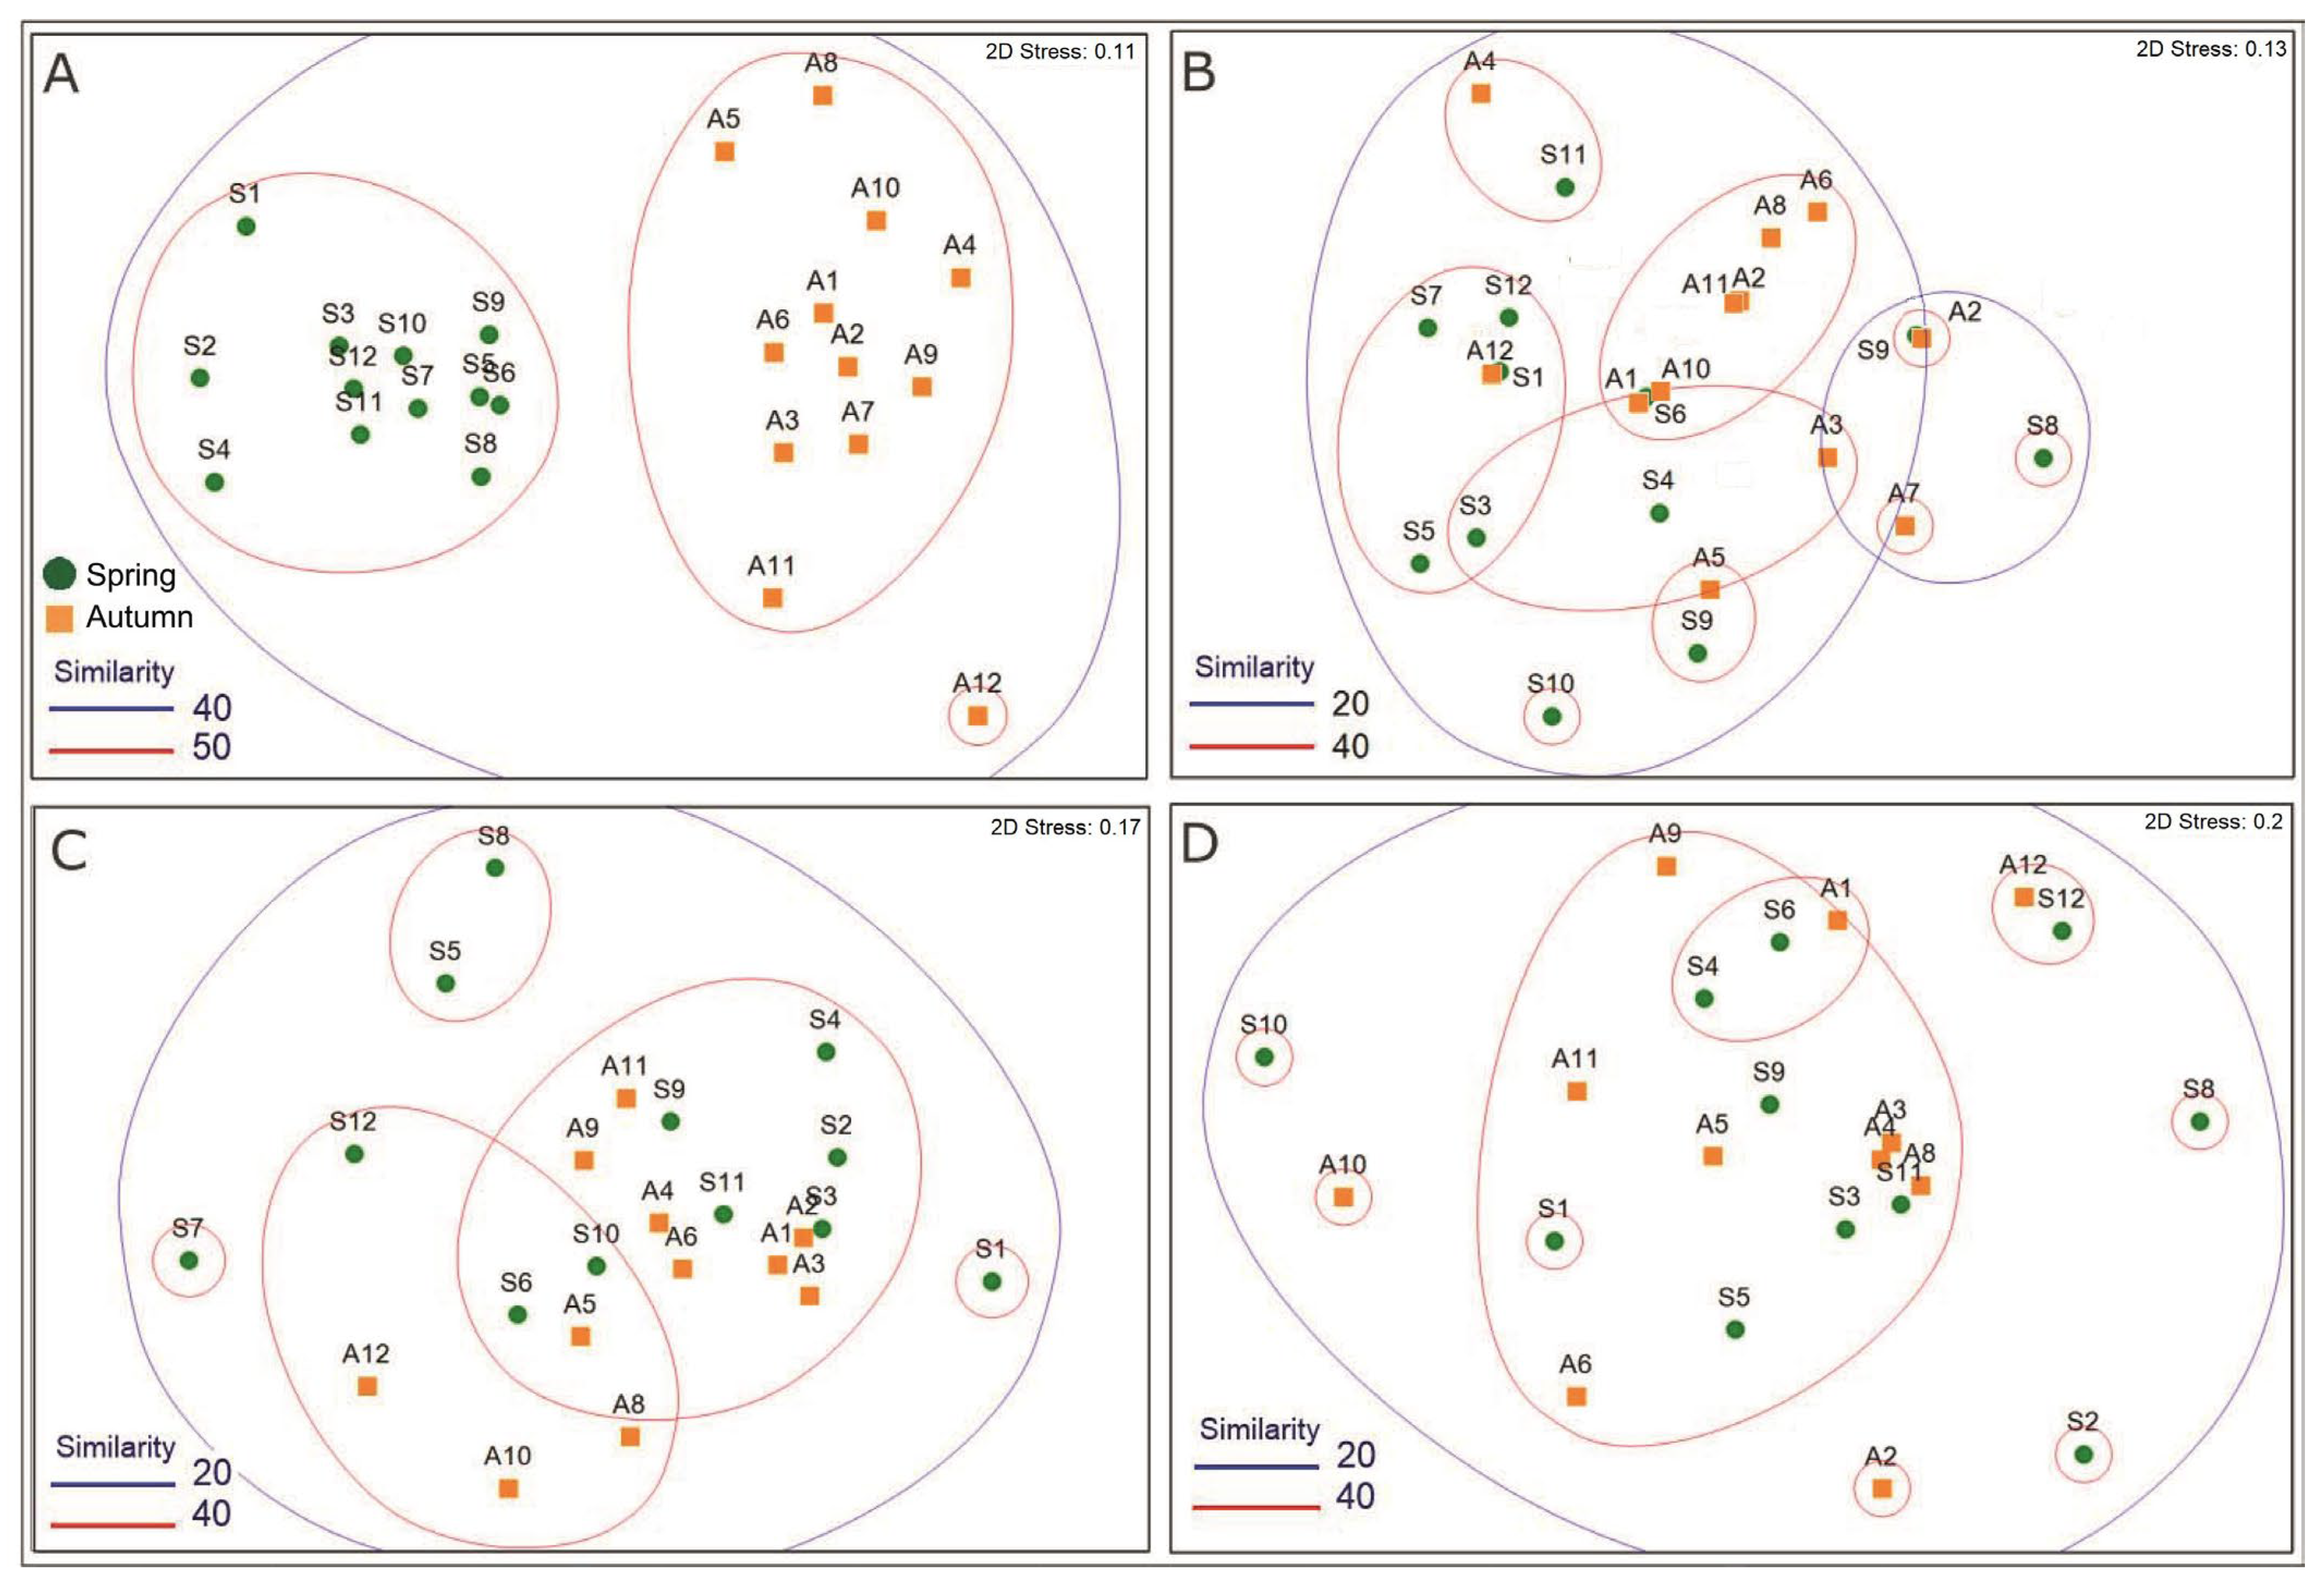
The nMDS ordination revealed a clear separation between spring and autumn zooplankton samples, forming two well-defined clusters (Figure 3A). Spring samples were tightly grouped, indicating relatively high similarity among stations, whereas autumn samples showed a more dispersed distribution. The grouping pattern was supported by similarity contours, with most samples within each season clustering at approximately 40–50% similarity (Figure 3A).
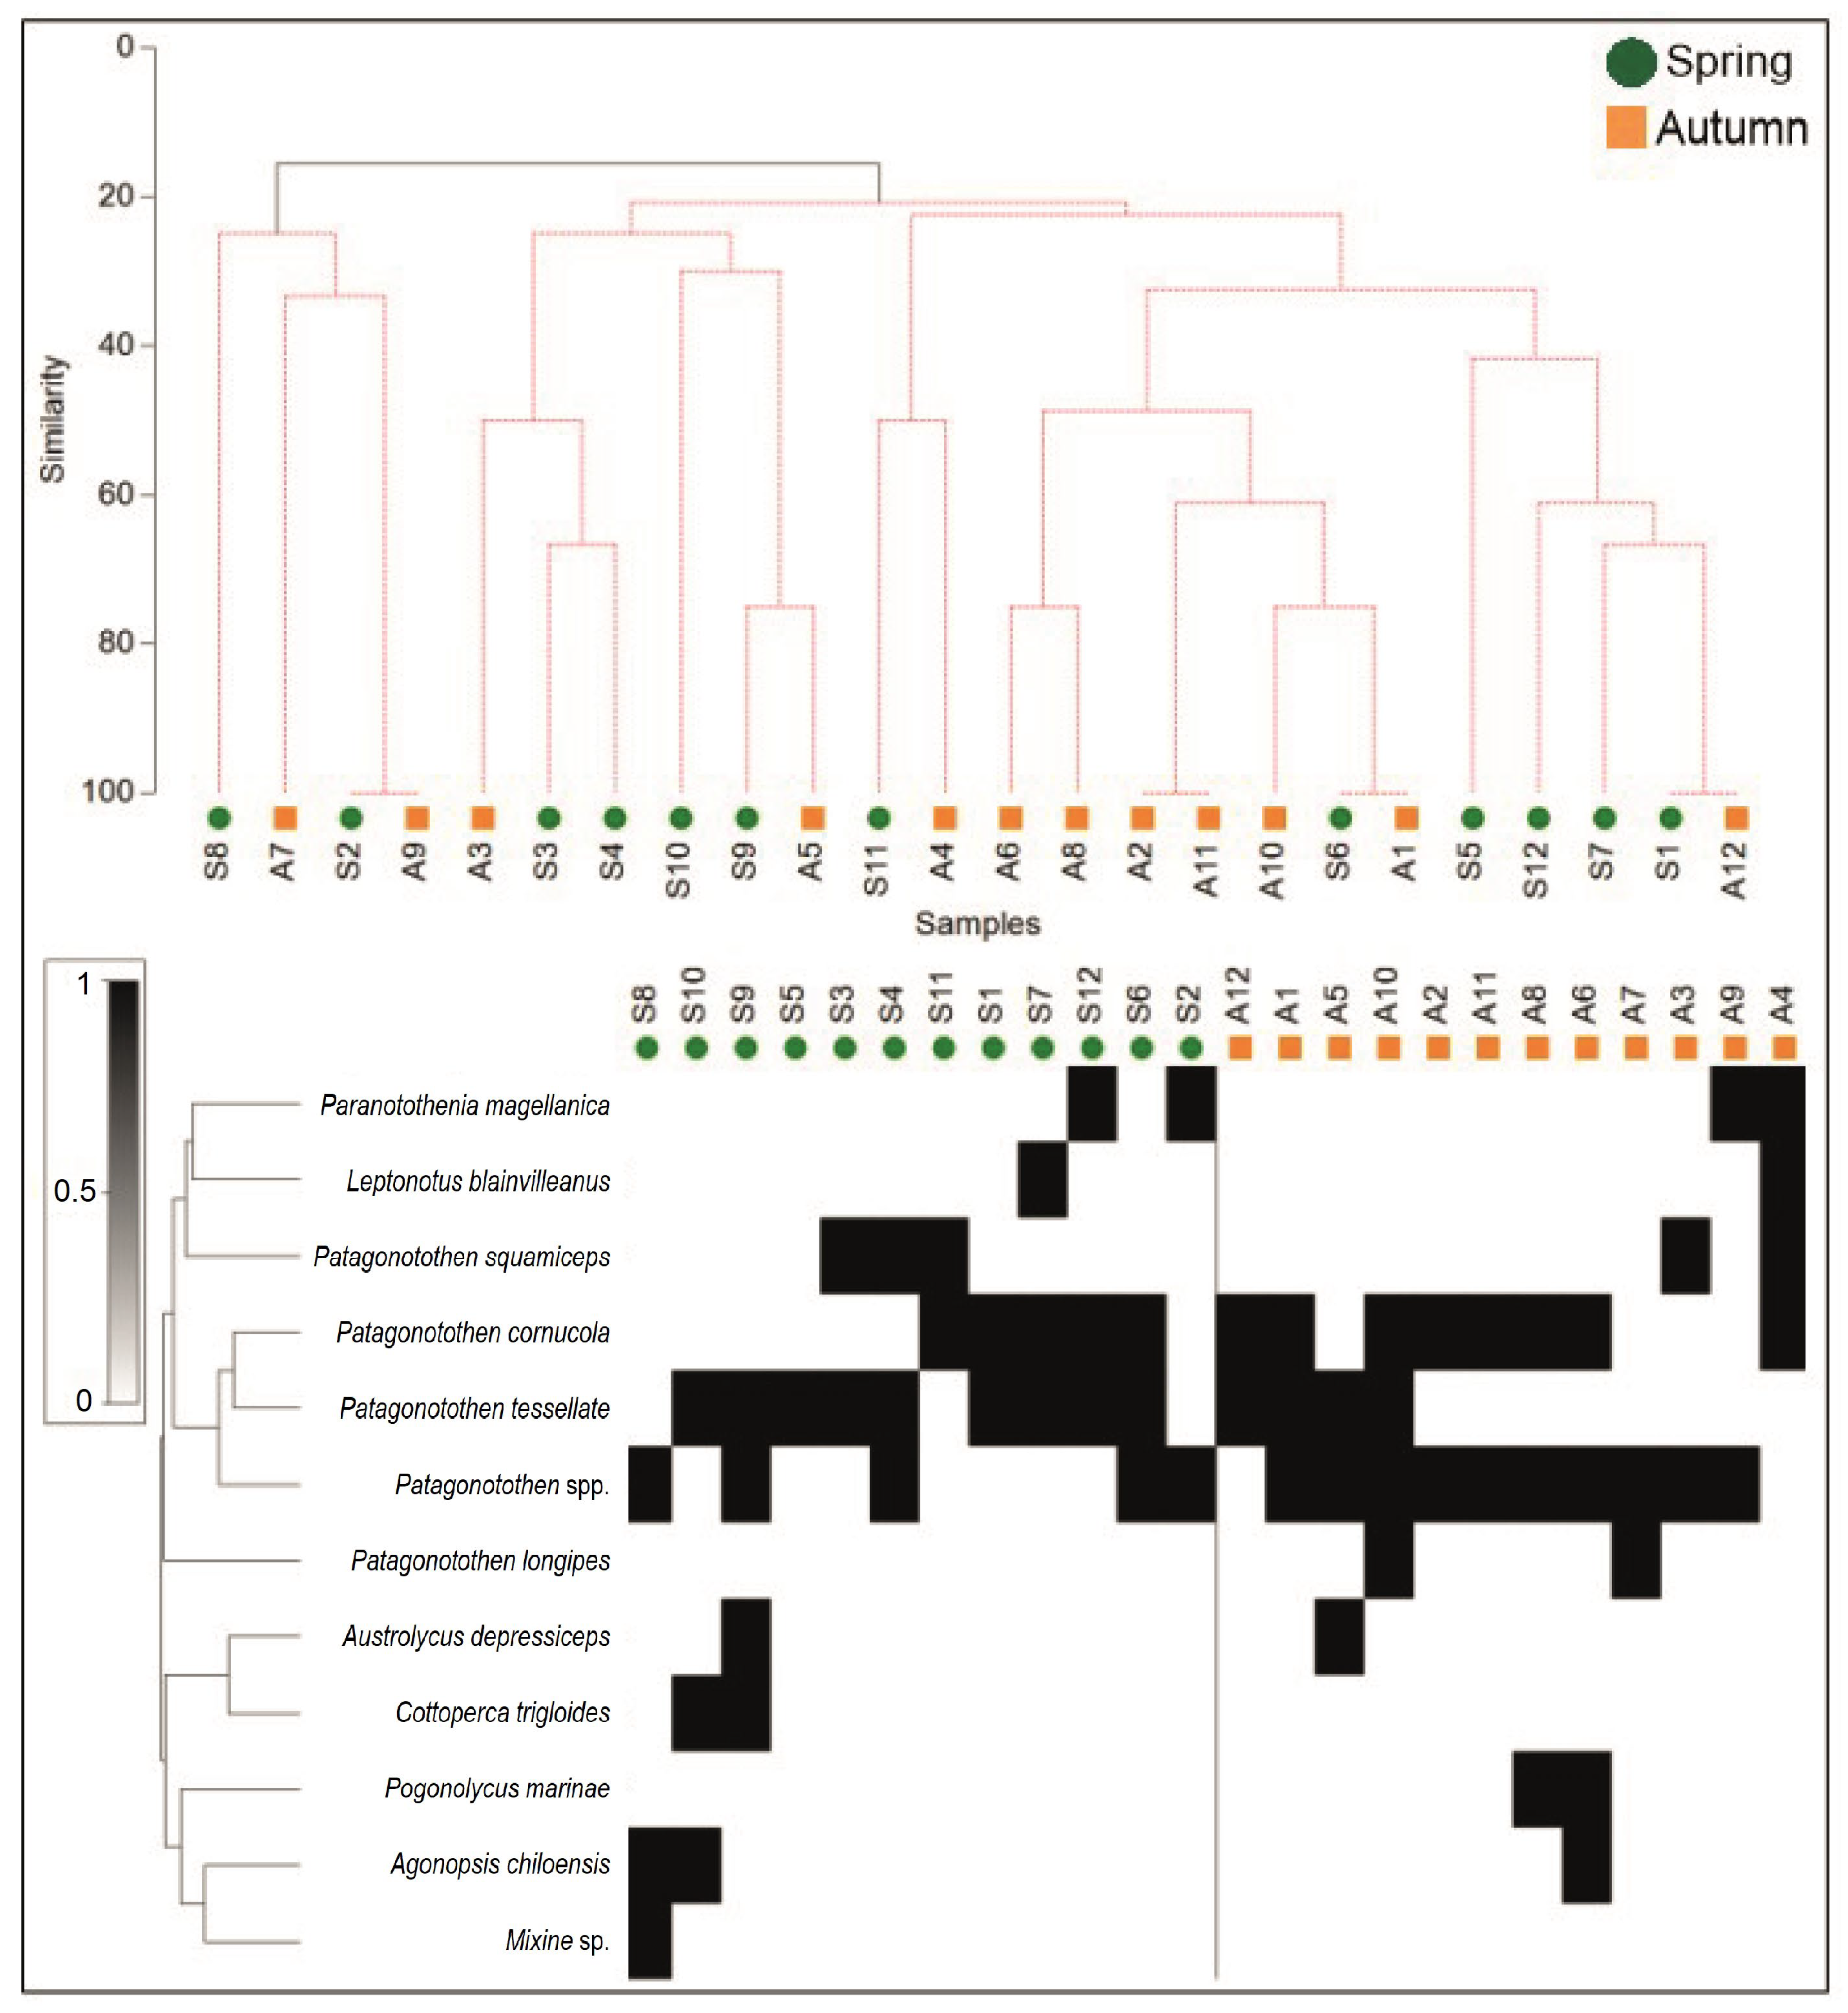
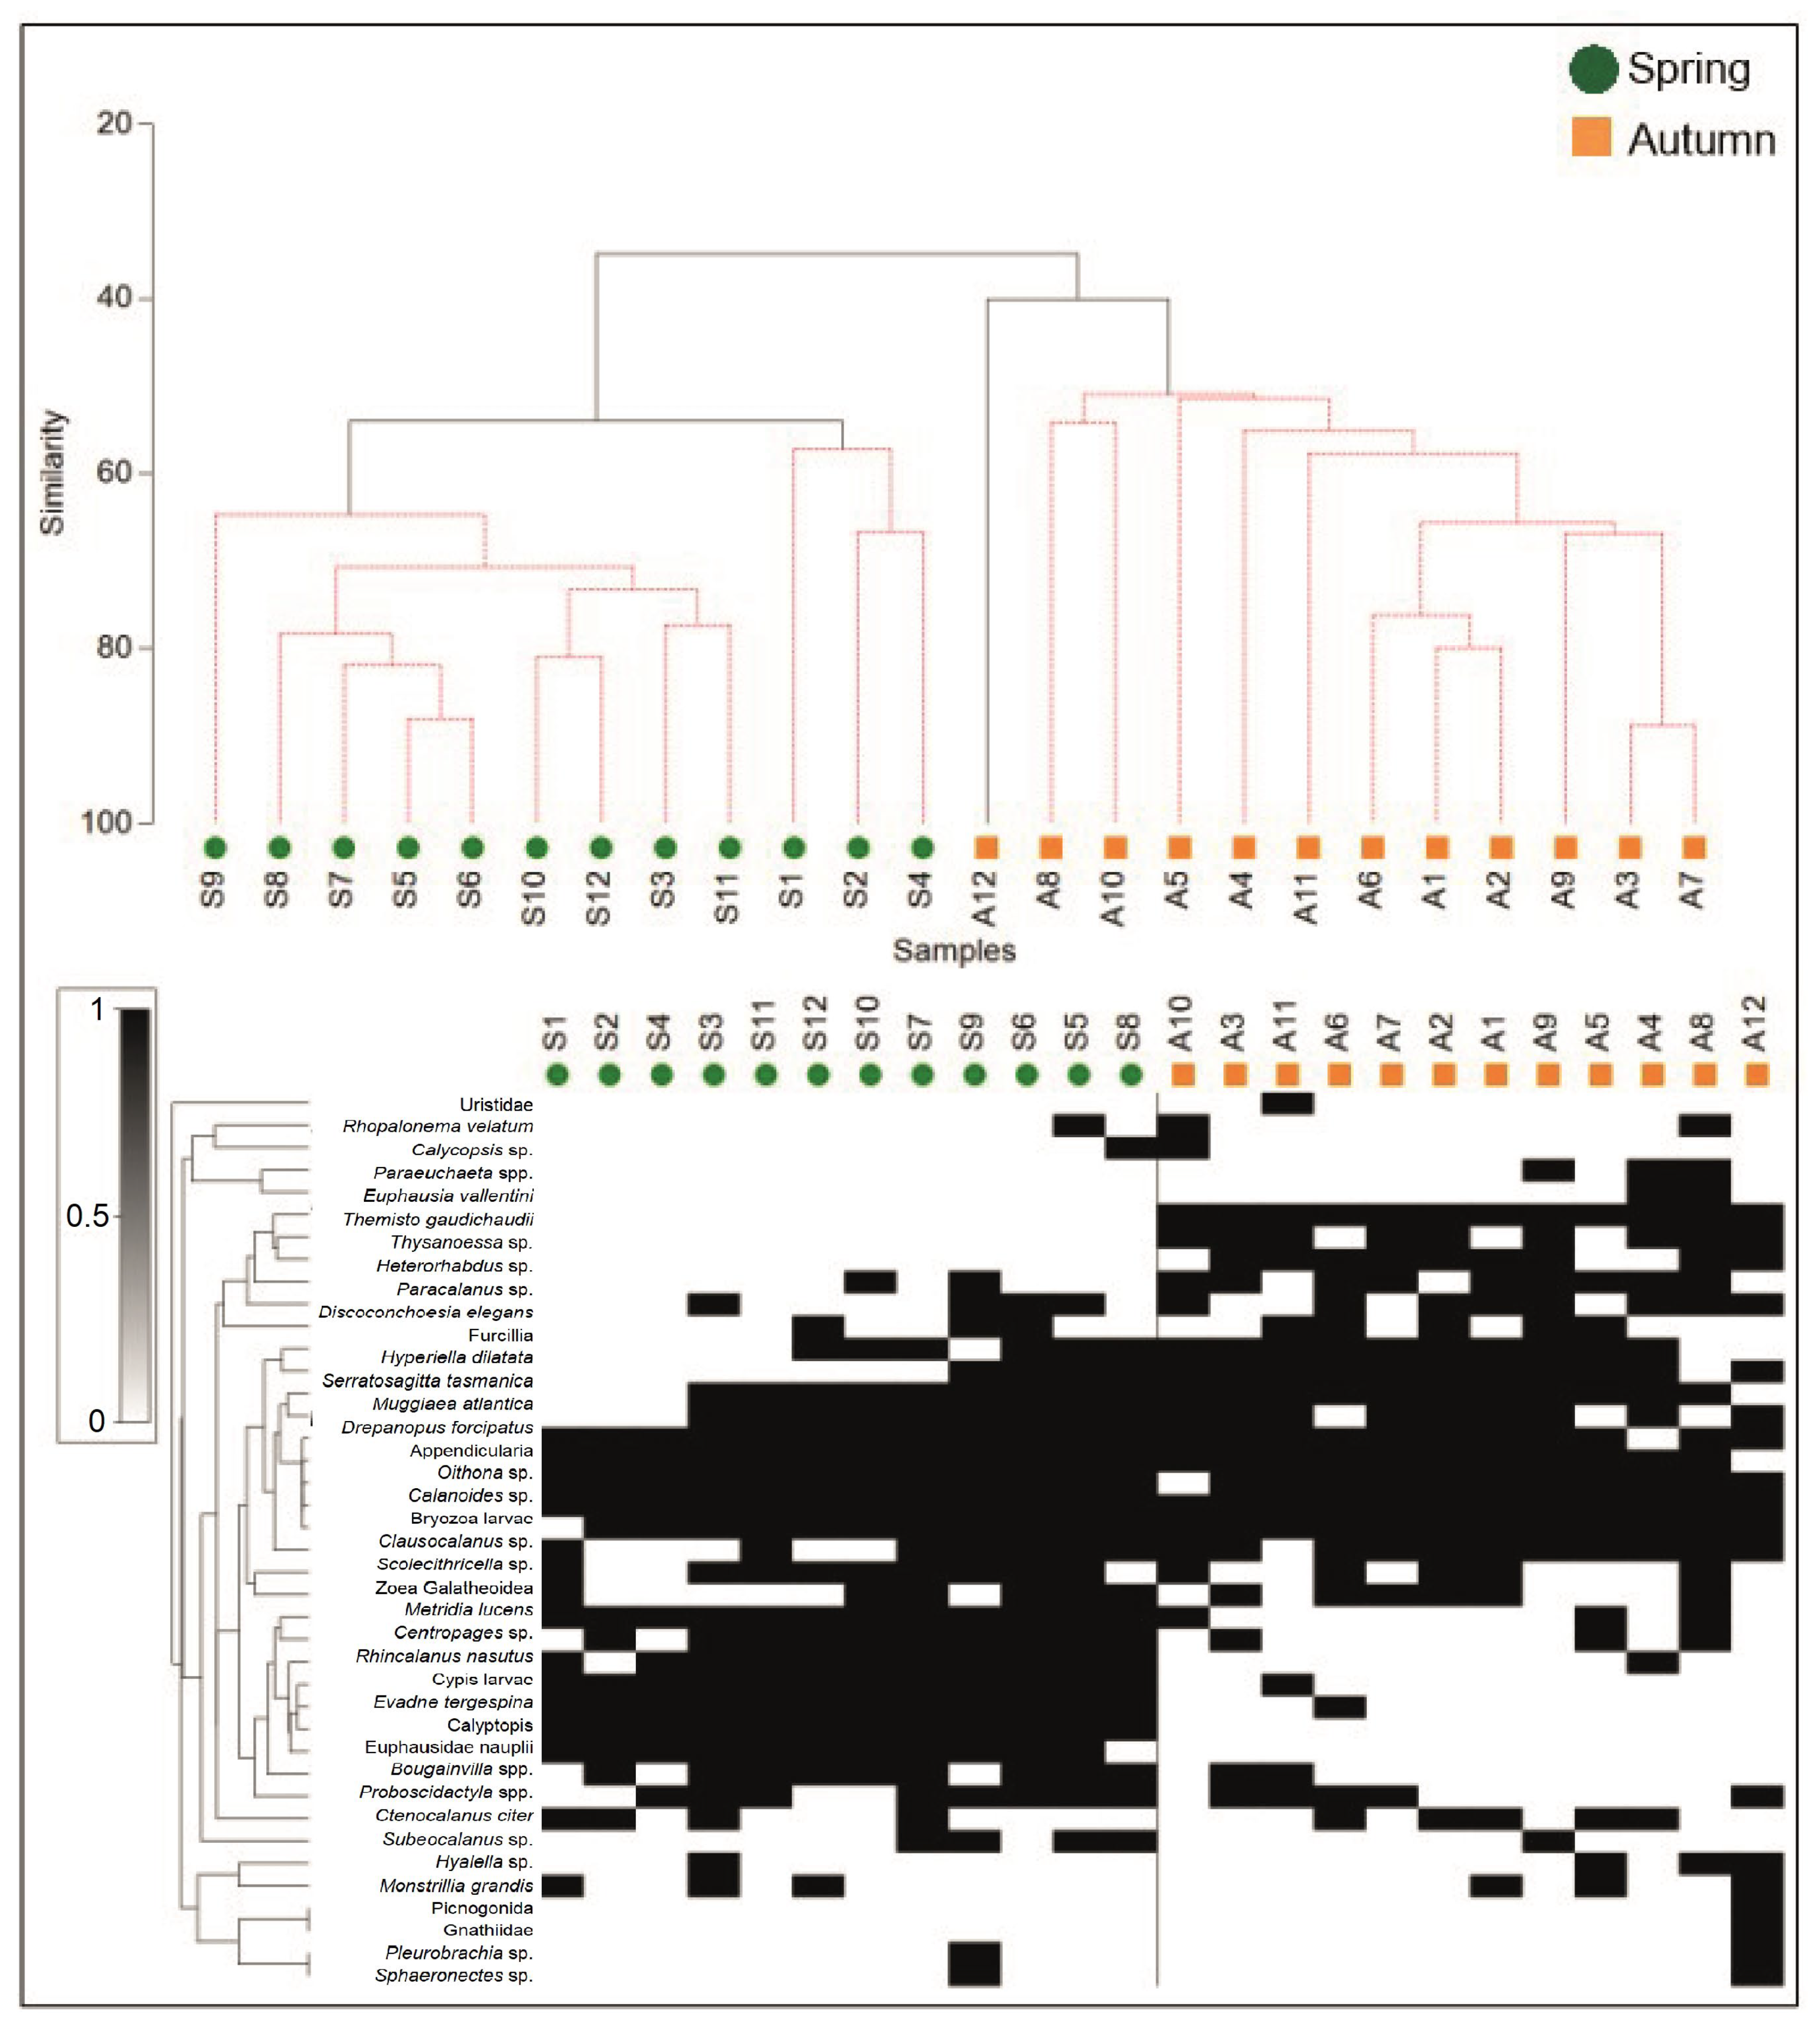
The clustered heatmap revealed distinct zooplankton assemblages associated with each sampling period. Three main groups of taxa were identified based on their occurrence patterns; the first group, located in the upper cluster, included taxa such as Rhopalonema velatum (Gegenbaur, 1857), Calycopsis sp., Paraeuchaeta spp., Euphausia vallentini (Stebbing, 1900), T. gaudichaudii, and Thysanoessa sp., which were predominantly associated with autumn samples. These taxa showed low or absent occurrence in spring and increased presence across multiple autumn stations, contributing to the separation between periods. A second group of taxa, forming a central and dense cluster, was widely distributed across spring samples and included copepods and larval forms such as Oithona sp., Calanoides sp., Clausocalanus sp., and bryozoan larvae. These taxa were consistently present across most spring stations, generating a homogeneous assemblage with high similarity. A third group, located in the lower cluster, was also primarily associated with spring samples and included taxa such as Rhincalanus nasutus (Giesbrecht, 1888), E. tergestina, Calyptopis sp., euphausiid nauplii, Bougainvillia spp., and C. citer. In contrast to the central group, these taxa showed a more variable distribution among stations but remained predominantly present in spring and showed limited occurrence in autumn (Figure A2).

3.3.2. Kelp Forest Fish

Fish assemblage composition was similar between spring and autumn (PERMANOVA, pseudo-F = 2.013, p = 0.057). A similar pattern was observed across sectors (central, western, and eastern; PERMANOVA, pseudo-F = 1.337, p = 0.186), suggesting a relatively homogeneous spatial structure. Pairwise comparisons further supported this pattern, with p-values of 0.289 (central vs. western), 0.182 (central vs. eastern), and 0.249 (western vs. eastern).
The nMDS ordination of fish assemblages showed broad and overlapping groupings between seasons, indicating low temporal differentiation (Figure 3B). This pattern was consistent with the cluster analysis, which showed associations between spring and autumn stations within the same similarity groups, without clear segregation by season. However, greater dispersion of spring stations was observed in the nMDS space compared to autumn stations, which tended to cluster more tightly, suggesting higher heterogeneity in assemblage composition during spring (Figure 3B).
Consistently, the heatmap revealed a heterogeneous distribution of species across seasons, without clear patterns of seasonal dominance, supporting the high overlap in assemblage composition. Nevertheless, some differences in species occurrence frequency were observed. During spring, the assemblage was dominated by P. tessellata and P. cornucola. In contrast, during autumn, a higher presence of species such as Patagonothoten spp., P. longipes, and P. marinae was recorded, reflecting a more heterogeneous assemblage. Some species, including P. magellanica, P. squamiceps, and L. blainvilleanus, were present in both periods with similar frequency (Figure A3).

3.3.3. Benthic Invertebrates

Benthic invertebrate assemblage composition did not show significant differences between spring and autumn (PERMANOVA, pseudo-F = 0.818, p = 0.787). Pairwise comparisons confirmed the absence of differences between both periods (p = 0.794), suggesting high temporal stability in assemblage structure. In contrast, assemblage composition differed significantly among sectors (central, western, and eastern; PERMANOVA, pseudo-F = 1.838, p = 0.002). Pairwise comparisons showed that the central sector was significantly different from both the western (p = 0.002) and eastern sectors (p = 0.013), while no differences were detected between the western and eastern sectors (p = 0.272), indicating a spatially differentiated assemblage structure, particularly in the central sector. The SIMPER analysis indicated that the average dissimilarity between the central and western sectors was 59.83%, explained by a broad set of taxa with low and relatively homogeneous individual contributions (Table A3). The main contributing taxa, including Polychaeta, Margarella violacea (P. P. King, 1832), Anasterias antarctica (Lütken, 1857), and Arbacia dufresnii (Blainville, 1825), jointly accounted for 13.2% of the total dissimilarity. The cumulative contribution of the first ten taxa reached 28.9%, while the first twenty taxa explained approximately 50.8% of the dissimilarity. For the comparison between the central and eastern sectors, the SIMPER analysis indicated that the overall average dissimilarity between the central and eastern sectors was 56.03%, explained by a broad set of taxa with low and relatively homogeneous individual contributions (Table A4). The main contributing taxa included M. violacea (cumulative contribution: 2.56%), P. magellanicus (5.10%), P. comptus (7.61%), Nudibranchia (10.05%), and A. antarctica (12.48%). Additional contributions were provided by Ophiuroidea (14.74%), Asteroidea (16.96%), Antholoba achates (Drayton in Dana, 1846) (19.19%), and Polychaeta (21.26%). The cumulative contribution of the first ten taxa reached 21.26%, while the first twenty taxa explained approximately 40.28% of the total dissimilarity. The first twenty-five taxa accounted for 50.05% of the dissimilarity, indicating that differences between sectors were driven by the combined contribution of multiple taxa rather than a few dominant species.
The nMDS ordination of benthic invertebrate assemblages showed a broad overlap between spring and autumn samples, with no clearly separated groups in either period. However, similar to fish, the spring stations were more dispersed in the ordination space than those from autumn, which tended to cluster into two main groups with similarity levels around 40% (Figure 3C). This pattern was supported by the cluster analysis (Figure A4), as stations from both spring and autumn were intermixed within different similarity groups, without consistent segregation by sampling period or geographic sector. Although some spring stations formed closer groupings (e.g., western stations S6, S7, S8), the overall pattern indicates a high compositional overlap between periods and a weak spatial structure along the longitudinal gradient.
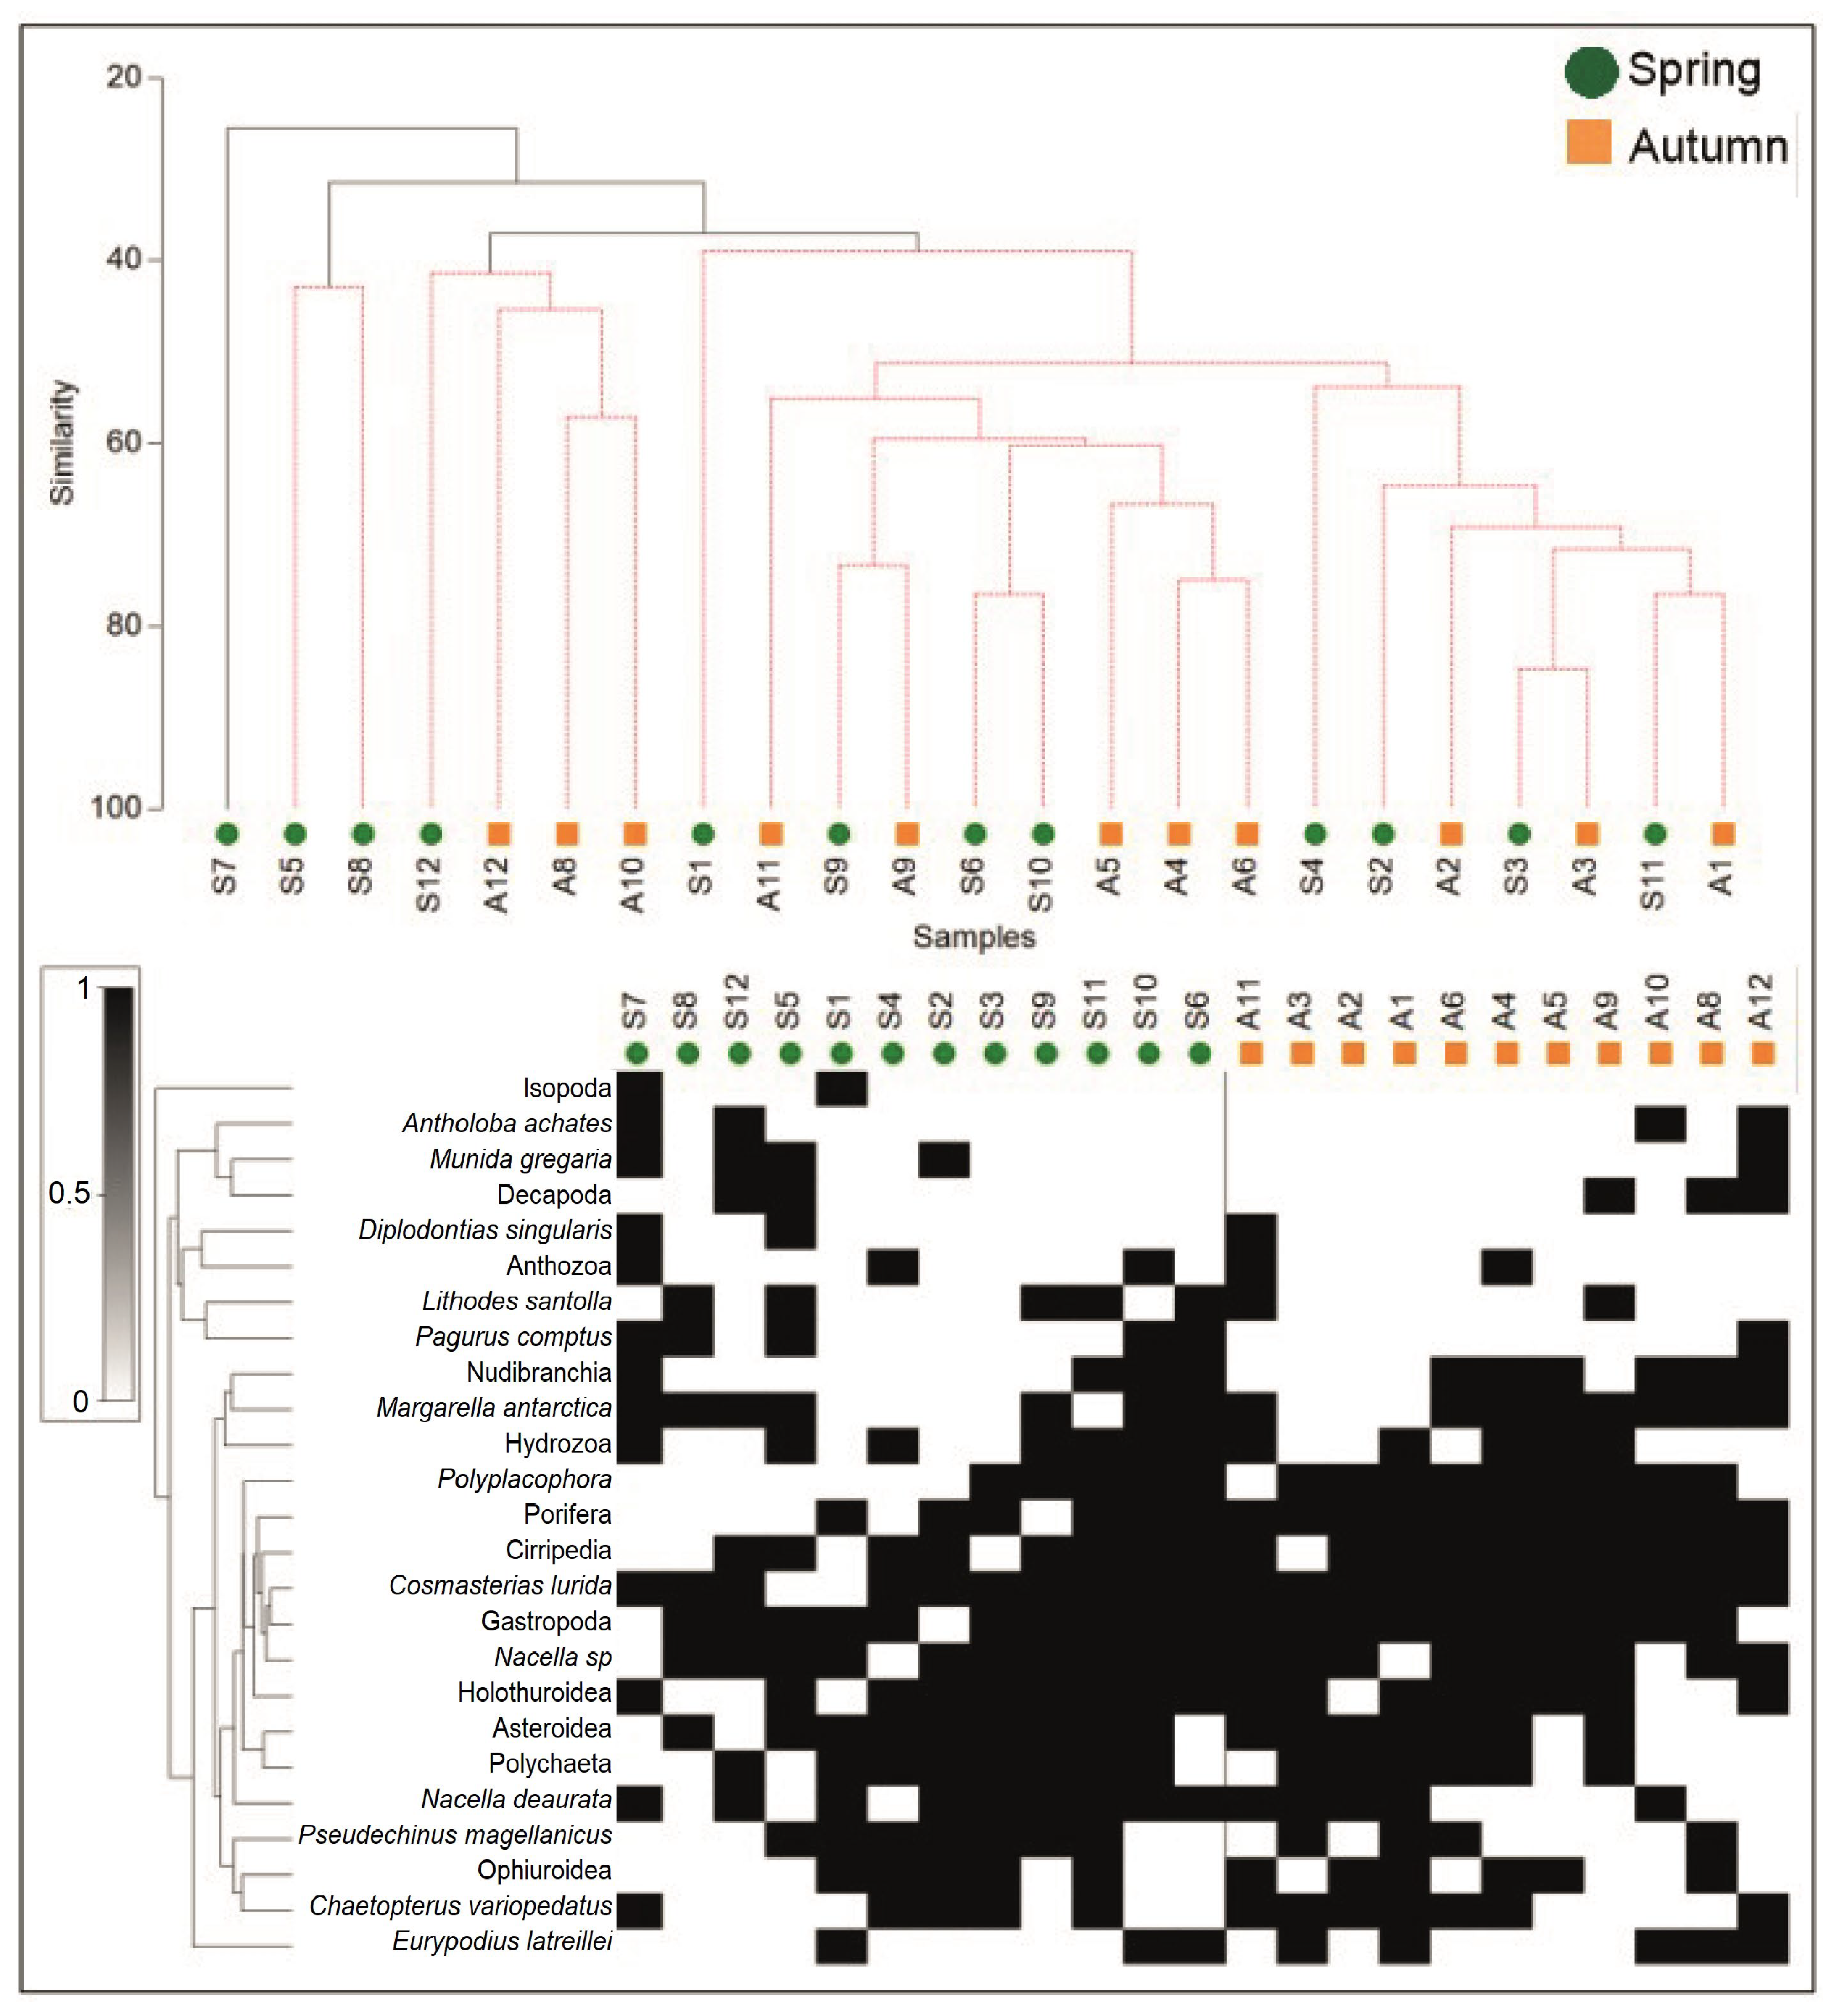
The heatmap showed a heterogeneous distribution of taxa across stations, with no exclusive dominance of groups restricted to a single period (Figure A4). However, differences in the recurrence of some taxa were observed. During spring, several records were associated with taxa such as Hydrozoa, Margarella antarctica (E. Lamy, 1906), N. deaurata, Isopoda, and some echinoderms, although with a more irregular distribution among stations. In contrast, during autumn, a higher recurrence of widely distributed groups such as Porifera, Cirripedia, Gastropoda, Polychaeta, Holothuroidea, and Ophiuroidea were observed, all of which were present across multiple stations. Some taxa, including Gastropoda, Cirripedia, Porifera, and Polychaeta, occurred in both periods and contributed to the observed compositional overlap.

3.3.4. Understory of Macroalgae

No significant differences in assemblage composition were detected between spring and autumn (PERMANOVA, pseudo-F = 0.659, p = 0.789). Similarly, no overall differences were found among sectors (central, western, and eastern; PERMANOVA, pseudo-F = 1.29, p = 0.164). Pairwise comparisons suggested a potential difference between the central and western sectors (p = 0.014), whereas no differences were detected between the central and eastern sectors (p = 0.183) or between the western and eastern sectors (p = 0.811). The SIMPER analysis indicated that the dissimilarity in assemblage composition between the central and western sectors was primarily driven by Codium sp. (8.44%), D. ligulata (6.16%), Callophyllis variegata (Bory) Kützing 1843 (6.07%), Ulva sp. (5.78%), Lophurella hookeriana (J. Agardh) Falkenberg 1901 (5.58%), and S. skottsbergii (5.58%). Additional contributions were provided by Callophyllis atrosanguinea (Hooker f. & Harvey) Hariot 1887 (5.44%), D. confervoides (4.61%), and crustose algae (4.31%), which together accounted for more than 50% of the total dissimilarity (Table A5). The nMDS analysis showed no clear separation between spring and autumn samples, with stations grouping in a mixed manner and indicating a high degree of compositional overlap between both periods, with similarities equal to or greater than 60% (Figure 3D).
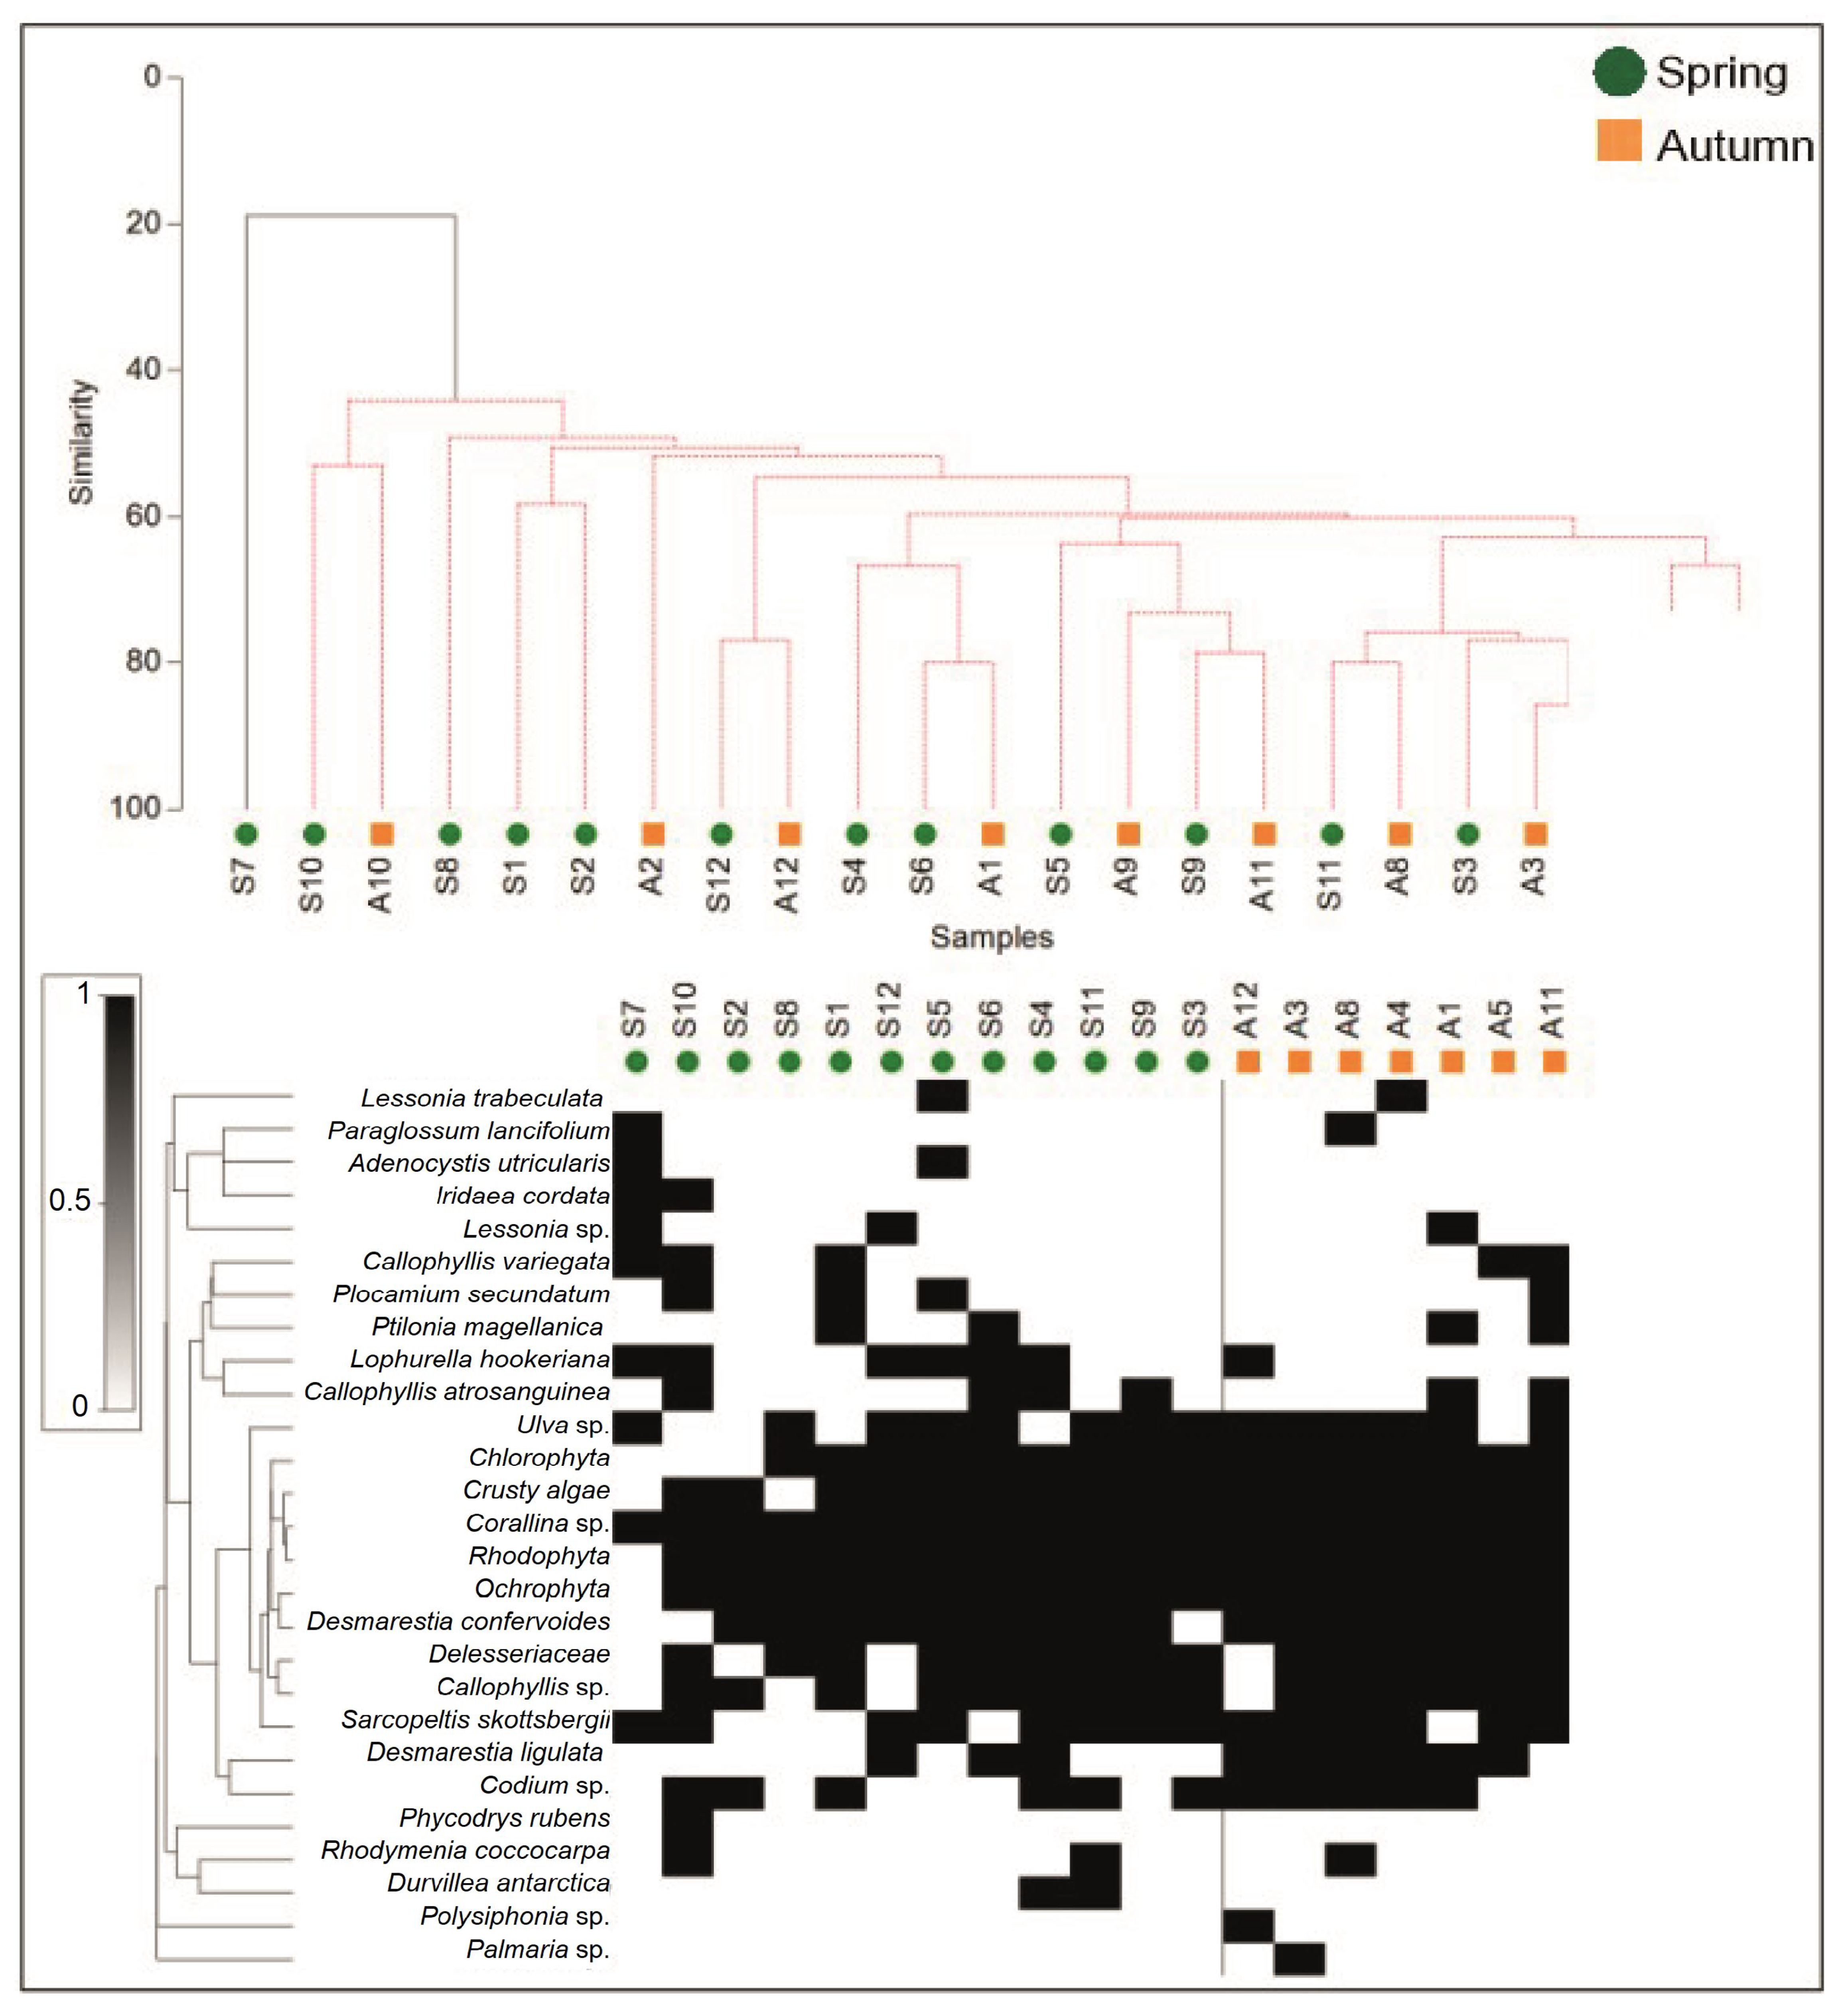
The clusterized heatmap reveals the presence of a central macroalgal assemblage widely distributed across both sampling periods, composed of taxa that dominate community structure, such as Ochrophyta, Rhodophyta, Corallina sp., crustose red algae, D. confervoides, Callophyllis sp., Delesseriaceae, and Chlorophyta. According to the cluster analysis, only stations S7 and S10 from spring formed a distinct group, characterized by low similarity with the remaining stations (<40%; Figure A5), and representing some of the few stations where D. confervoides and D. ligulata were absent. Despite this general pattern, subsets of taxa with seasonal affinity were identified. In spring, species with more restricted distributions were observed, such as I. cordata, Durvillaea antarctica (Chamisso) Hariot 1892, and Adenocystis utricularis (Bory) Skottsberg 1907. In contrast, the autumn assemblage was characterized by a higher frequency and broader occurrence of taxa such as S. skottsbergii, D. ligulata, and L. hookeriana (Figure A5).
Overall, the results indicate that assemblages are structured around a common core of shared taxa, whereas seasonal differences are mainly expressed as variations in the frequency of occurrence of certain species, rather than as a complete turnover in composition.

4. Discussion

4.1. Habitat Characteristics

Our observations did not reveal any significant differences in the abiotic characteristics of the surface water column associated with the kelp forests, likely because the surveys were conducted during transitional seasonal periods. However, small spatial variations in temperature and salinity were detected, caused by the inflow of cold, low-salinity water from continental currents in the Cape Froward area [57], mainly in the eastern part of the Strait of Magellan [58], characteristic of an area dominated by low-salinity, low-density waters, with weak vertical gradients and limited deep-water turnover [59]. These observations are consistent with previous descriptions of the water column, which indicate that this area of the strait has low-salinity waters [60] of an estuarine nature [61], along with relatively homogeneous and low temperatures in spring (7.0–7.5 °C; [62]). Regarding dissolved oxygen concentration in the water column (~6.0 m), the values recorded in spring remained within the ranges reported by other studies; for example, Valdenegro and Silva [7] report concentrations of 6.5–7.0 mL·L−1. Transparency was the variable that showed the greatest spatiotemporal differences during the study, especially in the eastern zone. In this area, average transparency in spring did not exceed 6.0 m, a value that corresponds to the increase in effluents with high sediment concentrations entering the system [58].
Regarding the biotic component of the Cape Froward area, it should be noted that the kelp forests do not exhibit seasonal patterns in abundance and density that differ from those previously described in other studies of the Magellan region [63]. In general, differences in wet biomass (kg·m−2) were observed among the stations studied, and in both seasons, the central sector of the study area exhibited the highest biomass. This pattern of spatiotemporal differentiation was less evident in density, a common characteristic of annuals kelp forests at south of Chile [64]. The spatial differences, primarily related to wet biomass, may have been influenced by the intense oceanographic dynamics in the central sector, which corresponds to the most exposed section of the Strait of Magellan. This scenario had already been described by Plana et al. [65], who documented that the exposed populations of M. pyrifera in Tierra del Fuego showed the highest abundance compared to those located inside Porvenir Bay, arguing that in exposed environments, nutrient concentrations increase, favoring the vegetative development of plants, as noted by Wheeler [66] and Gerard [67].

4.2. Marine Components of the Kelp Forest Ecosystem

4.2.1. Zooplankton

Various reports on southern Patagonia region indicate that much of the variation in zooplankton abundance, composition, and ecological characteristics is driven by seasonal variability [68]. For example, Landaeta et al. [69] observed these variations in the vicinity of the Pedro Channel, the Dyneley Strait, and the Cockburn Channel, recording 65 taxonomic groups in summer (early March 2020) and 50 in winter (June 2020). This pattern has also been reported in kelp forests of the northern Hemisphere, where 34–54 unique taxa have been described in these ecosystems [70,71], far less than those observed in the kelp forests of southern Patagonia. In this sense, the increase in zooplankton abundance during warm periods (southern summer) correlates with an increase in net phytoplankton concentration [60], which becomes available on the food web. In this context, although no marked differences in surface water temperature were observed between spring and autumn in our study area, small differences in salinity were observed across sectors, especially in the eastern sector (S10–S12) and the central sector (S1–S4) around Cape Froward. In both sectors, these lower salinities may partially modulate zooplankton communities and decrease abundance indices during the autumn. This period precedes the southern summer, when the highest freshwater discharges into the system are recorded in the Strait of Magellan, which can reach in some areas in spring (36.5 m3 s−1 in September) [58]. These inflows generate osmotic stress, which can lead to zooplankton mortality because they are unable to evade low-salinity water masses in environments characterized by intense turbulent mixing [72]. In general terms, our results confirmed the high frequency of early life stages of crustaceans and fish in spring, compared to autumn. This pattern had already been described by other authors, who confirm that in much of the Patagonian region, there is a synchronization of spawning periods during the southern spring, coinciding with the increase in phytoplankton blooms in spring, which can reach an increase of ~64% in their components compared to winter periods in this region [73]. This synchronization ensures the survival of the larval stages and early developmental stages of numerous species that utilize kelp forests, including those of commercial interest (e.g., king crab, snow crab, southern scallop; [74,75,76]), as key areas for their life cycles, thanks to the availability of an abundant and nutritious food supply [77]. Although it is widely documented that the spatiotemporal dynamics of zooplankton in this region are governed primarily by abiotic variables (e.g., salinity, temperature, turbidity) that in turn depend on seasonal variations in irradiance [78], the biotic component, such as kelp forests, apparently does not exert a direct influence on these dynamics. However, aspects of the coverage and spatial extent of these ecosystems (Mora-Soto et al. in review) that are not addressed in this study could influence zooplankton dynamics around Cape Froward. This aspect is particularly relevant for populations in the eastern sector (S6–S8), where the definition of “kelp forests” is more evident, as the largest dimensions in the entire study area are recorded there [79].

4.2.2. Kelp Forest Fish

The 12 fish taxa recorded in this spatiotemporal study do not differ significantly from other reports in the region, where between 14 and 18 species associated with kelp forests have been identified [34,80]. In recent years, sampling efforts in Southern Patagonia have focused primarily on continental fjord systems [35]. In contrast, studies conducted in sub-Antarctic systems influenced by the ocean demonstrate that the structural complexity of kelp forests supports a significantly greater richness of fish species—up to twice that recorded in inland channel environments—due to the stability of oceanographic conditions [34,81]. In this regard, studies covering a wide latitudinal range and a variety of kelp forest-dominated environments in southern Patagonia have documented up to 25 fish species [36]. Regarding the structure of the fish community, most studies indicate that more than 40% of the total species richness observed in kelp forests belongs to the family Nototheniidae, with the genus Patagonotothen spp. being the most common [34,35,36,80]. Approximately 67% of the total identified fish taxa exhibit invertivore feeding habits common in high-latitude kelp forest ecosystems [35,80]. These fish, found in rocky reefs—where most kelp forests are located—play an important role as mesograzers predators, thereby benefiting these ecosystems [82]. Although environmental heterogeneity in the Cape Froward area is evident—where protected, semi-protected, and exposed coastal ecosystems converge—this variability is not sufficiently pronounced to generate substantial changes in the population structure of kelp forests (Palacios et al. in review). Consequently, the subsequent effects on fish assemblages are limited, unlike those described in other studies covering a wider latitudinal range, in which the spatial structure of fish communities is determined primarily by the characteristics of the habitats in which these ecosystems occur (Hüne et al. in review). Similarly, the homogeneity in fish species richness observed between spring and autumn in this study may be related to the seasonal transition periods during which sampling took place. In studies that include assessments in summer and winter (extreme seasonal periods), marked changes in the diversity and abundance of fish species associated with kelp forests have been recorded. These patterns are primarily linked to temperature, recognized as the factor with the greatest influence on fish communities [83], as it regulates different stages of their life cycle and exerts indirect effects on the ecosystem by influencing its productivity, structure, and population composition [84]. Likewise, the increased activity of mobile fauna during warmer temperatures typical of summer helps explain the greater diversity and abundance observed during that season [85].

4.2.3. Benthic Invertebrates

In the marine ecosystems of southern Patagonia, numerous studies have highlighted the ecosystemic role of kelp forests [13,14,15,16,35,36,39,86], primarily in relation to bioengineering functions [87] capable of modifying abiotic conditions and supporting a complex diversity of associated organisms, facilitating their biological processes. In our study, approximately 76 invertebrate taxa were recorded in kelp forests at different stations around Cape Froward, with no significant variations observed between spring and autumn. In both seasonal periods, the dominant groups were Mollusca, Echinodermata, and Arthropoda. These observations are consistent with research conducted in giant kelp forests in the central part of the Strait of Magellan, which identifies these ecosystems as refuges for various trophic groups, primarily herbivores, including the green sea urchin A. dufresnii, several species of mollusks of the order Chitonida, and Fissurella sp. [88,89]. Although the temporal composition of the taxa did not show notable variation, the relative frequencies of some groups differed markedly between seasons across the study area. Our study did not address the architecture of kelp forests in detail, focusing instead on their population abundance and density. However, it is well documented that this architecture acts as a filter for key abiotic variables (e.g., light and temperature), allowing for the presence of different groups of invertebrates. In dense canopies, particle retention and water dynamics tend to limit herbivore abundance and favor deposit- and suspension-feeding organisms. This situation is intensified in shallow communities, where the shade from dense canopies extends to the first few meters of the water column [90]. Canopy shading can also have positive effects on some sessile invertebrates by improving spatial competition conditions [91]. Although the sampling methodology used (photo-quadrat) allowed for the census of most invertebrate species present in seaweed forests, it has spatial and structural limitations that prevent accounting for certain relevant taxa, which contribute significantly to the diversity of these ecosystems. For example, the unique architecture of the attachment disc of M. pyrifera provides a specific niche for a wide range of marine organisms; up to 114 invertebrate species have been recorded in its holdfasts [16]. Additionally, our study was conducted during a seasonal transition period between extremes (summer and winter). There is evidence indicating that currents and waves generated by wind or storms, which are more intense during the southern summer, can influence both the structure of giant kelp forests [92] and the biological interactions occurring within them [93]. In fact, since much of the algal biomass is concentrated in the floating canopy, the fronds are exposed to strong drag forces that can dislodge entire plants, in some cases stripping extensive areas of algae [94], thereby altering diversity patterns in these ecosystems. In summary, although it was not possible to establish a direct relationship between benthic invertebrate richness and the presence of kelp forests, it is important to note that our study examined only one spatial dimension of the diversity associated with these ecosystems. Kelp forests are characterized by the creation of different climatic niches across multiple spatial scales [95], which allows them to support a rich and diverse biodiversity throughout southern Patagonia.

4.2.4. Understory of Macroalgae

To date, no studies have described the understory communities associated with kelp forests in this region of southern Patagonia; this study represents the first investigation of this ecosystem component, which has been little explored in relation to its connection with M. pyrifera. Most of the available studies have focused on descriptions of the macroalgal components present in different areas of this vast region [13,96,97,98,99,100,101,102,103], as well as in specific studies highlighting M. pyrifera forests as areas of high phycological diversity [104], where knowledge of this diversity continues to expand [45]. However, beyond the number of taxa in the understory and the status of M. pyrifera as a keystone species [11], our observations indicate that the proportions of macroalgal phyla remain consistent with those reported by other studies in the region. In fact, the community is dominated by red macroalgae, followed by brown algae and, to a lesser extent, green algae, which are found mainly in shallow areas of the marine ecosystems of the Strait of Magellan. Although the 27 macroalgal taxa identified in the understory may be considered a small number compared to other studies that have described more than 70 taxa in different areas of the strait [63,104], it is important to note that this study focused exclusively on the macroalgal groups occurring within the inside margins of the kelp forest, excluding those species inhabiting the shallower and intertidal zones of the rocky coastal ecosystem around Cape Froward. Seasonal variations in understory richness were not pronounced, maintaining spatiotemporal stability in species richness. However, the frequency of occurrence (%) of the main taxonomic groups in the macroalgal understory recorded in spring and autumn showed distinct patterns of variation: some groups increased from spring to autumn, while others decreased over the same period. This behavior could be interpreted as an indicator of system stability, beyond the obvious limitations imposed by seasonal effects and the forest’s own structure on solar radiation. Thus, in well-established forests, the shading caused by dense canopies can significantly attenuate incident light throughout the first few meters of the water column [90], for example, by 36% just 20 cm below the canopy [105], while light at the bottom can be reduced almost completely [106,107]. However, this light limitation reflects the different requirements of macroalgae throughout an annual cycle that, in regions of southern Chile, are highly seasonal [108], indicating seasonal turnover in the composition of the macroalgal community. Within this context, and in light of our results, we validate the hypothesis proposed in this study, as we observed spatiotemporal variations in several components of the communities associated with these kelp forests at Cape Froward and in the vicinity of the Strait of Magellan.

5. Conclusions

This study represents the most comprehensive assessment to date of certain components of marine biodiversity associated with the kelp forests at Cape Froward, Strait of Magellan. This analysis enabled the spatiotemporal structure of the zooplankton, fish, invertebrates, and macroalgae that make up the understory of these kelp forests to be described. Overall, the results show that the coastal ecosystems of Cape Froward support a highly diverse and complex community, with characteristics representative of ecological systems of global and regional significance.
Regarding seasonal changes in these ecosystems, most components showed an increase in taxonomic richness during the spring. Seasonality is the primary factor structuring the zooplankton community, leading to clear shifts in its composition throughout the year. For the fish community, seasonal changes influence the presence and relative abundance of cryptic species, which are typical of ecologically structured natural environments and cold waters where kelp forests serve as key habitats. These seasonal shifts result in temporal variations in species distribution across both communities. Regarding the benthic invertebrate community, a stable, spatially heterogeneous structure was observed across the sampling stations, determined primarily by local habitat conditions rather than by seasonal changes. Likewise, the understory macroalgal community exhibited high diversity in association with M. pyrifera forests, especially during the southern spring.
These results demonstrate that Cape Froward constitutes a unique ecosystem within the southernmost part of Chile and the American continent. Its high taxonomic richness, the presence of dense Macrocystis forests, the diversity of invertebrates and fish, and the specific zooplankton records reinforce the ecological importance of this area. This study provides a solid scientific basis for advancing the protection of kelp forests in southern Chile and, at the same time, raises new questions about the ecological functioning of this ecosystem in Patagonia.

Author Contributions

Conceptualization, M.H., J.P., M.P. and B.R.-S.; methodology, M.H., J.P., M.P., M.F.L., A.C.-V. and T.S.-J.; formal analysis, M.H., J.P., M.P., B.R.-S., M.F.L., A.C.-V., T.S.-J., D.O., J.Á. and I.G.; investigation, M.H., J.P., M.P., A.C.-V., T.S.-J. and D.O.; resources, M.H. and J.P.; writing—original draft preparation, M.P., M.H. and B.R.-S.; writing—review and editing, M.P., M.H., J.P., M.F.L., A.C.-V., T.S.-J., D.O. and J.Á.; supervision and project administration, M.H.; funding acquisition, M.H. All authors have read and agreed to the published version of the manuscript.

Funding

This work was made possible by Rewilding Chile, a Chilean non-profit financially supported by an extensive philanthropic network.

Institutional Review Board Statement

The fieldwork was conducted with permission from the Chilean Fisheries Service under a Technical Memorandum (R. EX. N°E-2021-670 SUBPESCA).

Data Availability Statement

Data included in the manuscript are available online: Available online: https://doi.org/10.15468/83kxca (accessed on 30 July 2026).

Acknowledgments

We thank Jaime Loaiza from the University Austral of Chile for his support in the underwater monitoring surveys, and the captain and crew of the M/V Steel Magnolia for the fieldwork at Cape Froward.

Conflicts of Interest

The authors declare no conflicts of interest.

Abbreviations

LGMLast Glacial Maximum
PFCSPatagonian Fjords and Channels System
ANOVAAnalysis of Variance
SIMPERSimilarity Percentage Analysis
nMDSMetric Multidimensional Scaling
CLUSTERHierarchical Clustering
SStation
Sal.Salinity
Temp.Temperature
Trans.Transparency
n.d.No data
Freq.Frequency
Pisc.Piscivore
Inv.Invertivore
WBWet biomass
S.p.Spring
A.Autumn
C.Central
W.Western
E.Eastern

Appendix A

Table A1. Geographic coordinates and values of wet biomass (W.B., kg m−2) and density (ind. m−2) of M. pyrifera beds recorded at each sampling station in Cape Froward, Strait of Magellan, during spring 2024 and autumn 2025. Values correspond to the median of measurements taken at each station for each sampling period.
SectorStationLat. (° S)Lon. (° W)Spring 2024Autumn 2025
W.B.
(kg m−2)
Density
(Ind. m−2)
W.B.
(kg m−2)
Density
(Ind. m−2)
CentralS1−53.986−71.3332.00.31.50.2
S2−53.999−71.4462.90.22.30.2
S3−53.942−71.5332.60.31.60.1
S4−53.921−71.6381.00.11.60.2
S9−53.892−71.2761.70.32.10.2
WestS5−53.739−71.8864.50.41.80.2
S6−53.705−71.9890.30.20.60.2
S7−53.766−71.7770.60.21.70.2
S8−53.813−71.6310.60.11.30.1
EastS10 −53.842−71.0971.30.22.00.2
S11−53.822−71.0370.80.21.10.1
S12−53.804−70.9971.90.22.30.2
Table A2. SIMPER results showing the main zooplankton taxa contributing to assemblage dissimilarity (>50% cumulative) between spring (S.p.) and autumn (A.), based on transformed abundance data. Values include average dissimilarity, percentage contribution, cumulative contribution, and mean abundance per period.
TaxonAv. DissimContrib. %Cumulative %Mean S.p.Mean A.
Ctenocalanus citer9.013.013.00.31.8
Fish eggs1.52.115.11.00.0
Themisto gaudichaudii1.52.117.20.01.0
Ophiura larvae1.52.119.31.00.0
Cirripedia nauplii1.52.121.41.00.0
Zoea Brachiura NI1.52.123.51.00.0
Nauplio Euphausidae1.52.125.61.00.0
Bougainvilla spp.1.42.027.60.90.0
Calyptopis stages1.31.929.51.00.1
Evadne tergespina1.31.931.41.00.1
Gastropoda larvae1.21.833.20.80.0
Asteroidea larvae1.21.734.90.80.0
Cypris larvae1.21.736.60.90.1
Equinoidea1.21.738.30.80.0
Podon leuckarti1.21.740.00.80.0
Sprattus fueguensis1.11.741.70.80.0
Thysanoessa sp.1.11.643.20.00.8
Centropages sp.1.11.544.81.00.3
Heterorhabdus sp.1.11.546.30.00.8
Pinnotheridae zoea1.01.547.80.80.0
Rhincalanus nasutus1.01.449.20.80.3
Serratosagitta tasmanica1.01.450.70.30.9
Table A3. Results of the SIMPER (Similarity Percentage) analysis identifying the main benthic invertebrate taxa responsible for the dissimilarity in assemblage composition (>50% cumulative) between the central (C.) and western (W.) sectors, based on transformed abundance data. Shown are the average dissimilarity (Av. dissim), percentage contribution (Contrib. %), cumulative contribution (Cumul. %), and mean abundance per sector (Mean C. and Mean W.).
TaxonAv. DissimContrib. (%)Cumul. (%)Mean C.Mean W.
Polychaeta2.33.83.81.00.1
Margarella violacea1.93.17.00.31.0
Anasterias antarctica1.93.110.20.80.1
Arbacia dufresnii1.83.013.20.70.0
Nudibranchia1.72.816.10.10.7
Nacella deaurata1.62.618.80.70.3
Chaetopterus sp.1.52.621.40.70.3
Ophiuroidea1.52.524.00.70.3
Pagurus sp.1.52.526.50.00.6
Polyplacophora1.42.328.90.70.4
Asteroidea1.42.331.31.00.4
Pseudoechinus magellanicus1.42.333.60.70.4
Pagurus comptus1.32.235.90.30.6
Fissurella sp.1.32.238.10.50.4
Hydrozoa1.32.240.40.50.6
Actinaria1.32.242.60.60.6
Didemnum studeri1.22.144.70.40.4
Lithodes santolla1.22.146.80.20.4
Porifera1.22.148.90.80.6
Cirripedia1.11.950.80.70.7
Table A4. Results of the SIMPER (Similarity Percentage) analysis identifying the main benthic invertebrate taxa responsible for the dissimilarity in assemblage composition (>50% cumulative) between the central (C.) and eastern (E.) sectors, based on transformed abundance data. Shown are the average dissimilarity (Av. dissim), percentage contribution (Contrib. %), cumulative contribution (Cumul. %), and mean abundance per sector (Mean C. and Mean E.).
TaxonAv. DissimContrib. %Cumulative %Mean C.Mean E.
Margarella violacea1.42.62.60.30.8
Pseudoechinus magellanicus1.42.55.10.70.2
Pagurus comptus1.42.57.60.30.8
Nudibranchia1.42.410.10.10.7
Anasterias antarctica1.42.412,50.80.3
Ophiuroidea1.32.314.70.70.3
Asteroidea1.22.217.01.00.5
Antholoba achates1.22.219.20.00.5
Polychaeta1.22.121.31.00.5
Didemnum studeri1.22.023.30.40.7
Chaetopterus variopedatus1.12.025.30.70.5
Eurypodius latreillei1.12.027.20.30.5
Fissurella sp.1.11.929.20.50.7
Hydrozoa1.11.931.10.50.5
Psolus sp1.01.933.00.20.5
Pycnogonida1.01.934.80.20.5
Creppipatella sp.1.01.836.70.10.5
Actinaria1.01.838.50.60.7
Polyplacophora1.01.840.30.70.7
Arbacia dufresnii1.01.842.10.70.7
Holothuroidea0.91.743.70.80.7
Ascidiacea0.91.645.40.40.2
Decapoda0.91.647.00.10.3
Munida gregaria0.91.648.60.10.3
Trophon geversianus0.81.550.10.00.3
Table A5. Results of the SIMPER (Similarity Percentage) analysis identifying the main taxa responsible for the dissimilarity in assemblage composition (>50% cumulative) between the central (C.) and western (W.) sectors. For each taxon, average dissimilarity (Av. dissim), percentage contribution to total dissimilarity (Contrib. %), cumulative contribution (Cumulative %), and mean frequency of occurrence in each sector are reported.
TaxaAv. DissimContrib. %Cumulative %Mean C.Mean W.
Codium sp.2.98.48.40.70.1
Desmarestia ligulata2.16.214.60.40.4
Callophyllis variegata2.16.120.70.10.4
Ulva sp.2.05.826.50.60.9
Lophurella hookeriana1.95.632.00.10.4
Sarcopeltis skottsbergii1.95.637.60.70.7
Callophyllis atrosanguinea1.95.443.10.40.1
Desmarestia confervoides1.64.647.70.90.7
Crusty algae1.54.352.01.00.7
Table A6. Spearman’s rank correlation coefficients (rs) and associated p-values describing the relationships between environmental variables and species richness (S) of zooplankton, benthic invertebrates, fishes, and macroalgae understory in kelp forests of Cape Froward, Strait of Magellan. Values in each cell are presented as rs, p. (*) Significant correlations (p < 0.05) are indicated in bold. Normality was assessed using the Shapiro–Wilk test prior to correlation analyses, and because one or both variables did not meet the assumption of normality, Spearman’s rank correlation was used.
NormalityZooplankton (S)
(rs, p-Value)
Kelp Forest Fish (S)
(rs, p-Value)
Benthic Invertebrates (S)
(rs, p-Value)
Macroalgae Understory (S)
(rs, p-Value)
Temperature (°C)No−0.08, 0.731.00, 0.40−0.43, 0.03−0.22, 0.30
Salinity (psu)No0.29, 0.17−0.03, 0.90−0.14, 0.51−0.37, 0.08
Dissolved oxygen (mg L−1)No0.51, 0.01 *−0.30, 0.15−0.02, 0.920.14, 0.52
Water transparency (m)No−0.57, 0.01 *0.27, 0.21−0.04, 0.87−0.04, 0.84
Wet biomass (kg m−2)No−0.16, 0.46−0.54, 0.01 *−0.25, 0.25−0.09, 0.68
Density (ind. m−2)No0.35, 0.09−0.46, 0.02 *−0.11, 0.60−0.02, 0.93
Figure A1. Species accumulation curves of marine communities associated with M. pyrifera recorded at Cape Forward, based on observed species and the expected number of species on stations (Chao2 estimator; error bars = standard error). (A,B) Zooplankton; (C,D) Kelp forest fish, (E,F) benthic invertebrates, and (G,H) understory of macroalgae.
Diversity 18 00472 g0a1
Figure A2. Clustered shadow diagram representing the presence/absence matrix of zooplankton taxa across stations between spring and autumn. White spaces indicate the absence of species in the corresponding transect, while black marks represent the presence of the taxon. The dendrogram on the left illustrates the hierarchical clustering of the identified species.
Diversity 18 00472 g0a2
Figure A3. Clustered shadow diagram representing the presence/absence matrix of fish’s taxa across stations between spring and autumn. White spaces indicate the absence of species in the corresponding transect, while black marks represent the presence of the taxon. The dendrogram on the left illustrates the hierarchical clustering of the identified species.
Diversity 18 00472 g0a3
Figure A4. Clustered shadow diagram representing the presence/absence matrix of benthic invertebrates taxa across stations between spring and autumn. White spaces indicate the absence of species in the corresponding transect, while black marks represent the presence of the taxon. The dendrogram on the left illustrates the hierarchical clustering of the identified species.
Diversity 18 00472 g0a4
Figure A5. Clustered shadow diagram representing the presence/absence matrix of understory of macroalgae assemblage’s taxa across localities between spring and autumn. White spaces indicate the absence of species in the corresponding transect, while black marks represent the presence of the taxon. The dendrogram on the left illustrates the hierarchical clustering of the identified species.
Diversity 18 00472 g0a5

References

  1. Hulton, N.R.J.; Purves, R.S.; McCulloch, R.D.; Sugden, D.E.; Bentley, M.J. The Last Glacial Maximum and deglaciation in southern South America. Quat. Sci. Rev. 2002, 21, 233–241. [Google Scholar] [CrossRef]
  2. Sugden, D.E.; Hulton, N.R.J.; Purves, R.S. Modelling the inception of the Patagonian ice sheet. Quat. Int. 2002, 95–96, 55–64. [Google Scholar] [CrossRef]
  3. Fraser, C.I.; Nikula, R.; Ruzzante, D.E.; Waters, J.M. Poleward bound: Biological impacts of Southern Hemisphere glaciation. Trends. Ecol. Evol. 2012, 27, 462–471. [Google Scholar] [CrossRef] [PubMed]
  4. Montiel, A.; Rozbaczylo, N. Distribución de los poliquetos de fondos blandos endémicos de fiordos y canales Chilenos. An. Inst. Patagon. 2009, 37, 117–125. [Google Scholar] [CrossRef][Green Version]
  5. Fernández, M.; Jaramillo, E.; Marquet, P.A.; Moreno, C.A.; Navarrete, S.; Ojeda, F.P.; Valdovinos, C.R.; Vásquez, J.A. Diversity, dynamics and biogeography of Chilean benthic nearshore ecosystems: An overview and guidelines for conservation. Rev. Chil. Hist. Nat. 2000, 73, 797–830. [Google Scholar] [CrossRef]
  6. Panella, S.; Michelato, A.; Perdicaro, R.; Magazzú, G.; Decembrini, F.; Scarazzato, P. A preliminary contribution to understanding the hydrological characteristics of the Strait of Magellan: Austral spring 1989. Boll. Oceanol. Teor. Appl. 1991, 9, 107–126. [Google Scholar]
  7. Valdenegro, A.; Silva, N. Caracterización física y química de la zona de canales y fiordos australes de Chile entre el estrecho de Magallanes y el cabo de Hornos (CIMAR-3 fiordos). Cienc. Tecnol. Mar. 2003, 26, 19–60. [Google Scholar]
  8. Saggiomo, V.; Goffart, A.; Carrada, G.; Hecq, J. Spatial patterns of phytoplanktonic pigments and primary production in a semi-enclosed periantarctic ecosystem: The Strait of Magellan. J. Mar. Syst. 1994, 5, 119–142. [Google Scholar] [CrossRef]
  9. Soto, E.H.; Báez, P.; Ramírez, M.E.; Letelier, S.; Naretto, J.; Rebolledo, A. Biotopos marinos intermareales entre Canal Trinidad y Canal Smyth, Sur de Chile. Rev. Biol. Mar. Oceanogr. 2012, 47, 177–191. [Google Scholar] [CrossRef]
  10. Cárdenas, C.A.; Newcombe, E.M.; Hajdu, E.; González-Aravena, M.; Geange, S.W.; Bell, J.J. Sponge richness on algae-dominated rocky reefs in the western Antarctic Peninsula and the Magellan Strait. Polar Res. 2016, 35, 30532. [Google Scholar] [CrossRef]
  11. Miller, R.J.; Lafferty, K.D.; Lamy, T.; Kui, L.; Rassweiler, A.; Reed, D.C. Giant kelp, Macrocystis pyrifera, increases faunal diversity through physical engineering. Proc. R. Soc. B 2018, 285, 20172571. [Google Scholar] [CrossRef] [PubMed]
  12. Mora-Soto, A.; Palacios, M.; Macaya, E.C.; Gómez, I.; Huovinen, P.; Pérez-Matus, A.; Young, M.; Golding, N.; Toro, M.; Yaqub, M.; et al. A high-resolution global map of giant kelp (Macrocystis pyrifera) forests and intertidal green algae (Ulvophyceae) with Sentinel-2 imagery. Remote Sens. 2020, 12, 694. [Google Scholar] [CrossRef]
  13. Santelices, B.; Ojeda, F.P. Effect of canopy removal on the understory algal community structure of coastal forests of Macrocystis pyrifera from southern South America. Mar. Ecol. Prog. Ser. 1984, 14, 165–173. [Google Scholar] [CrossRef]
  14. Dayton, P. The structure and regulation of some South American kelp communities. Ecol. Monogr. 1985, 55, 447–468. [Google Scholar] [CrossRef]
  15. Adami, M.L.; Gordillo, S. Structure and dynamics of the biota associated with Macrocystis pyrifera (Phaeophyta) from the Beagle Channel, Tierra del Fuego. Sci. Mar. 1999, 63, 183–191. [Google Scholar] [CrossRef]
  16. Ríos, C.; Wolf, E.A.; Gerdes, D.; Mutschke, E.; Montiel, A. Spatial and temporal variability of the benthic assemblages associated to the holdfasts of the kelp Macrocystis pyrifera in the Straits of Magellan, Chile. Polar Biol. 2007, 31, 89–100. [Google Scholar] [CrossRef]
  17. Darwin, C. The Voyage of the Beagle: Journal of Researches into the Natural History and Geology of the Countries Visited During the Voyage of HMS Beagle Round the World Under the Command of Capt. Fitz Roy, R.N., 2nd ed.; John Murray: London, UK, 1845. [Google Scholar]
  18. Palacios, M.; Osman, D.; Ramírez, J.; Huovinen, P.; Gómez, I. Photobiology of the giant kelp Macrocystis pyrifera in the land-terminating glacier fjord Yendegaia (Tierra del Fuego): A look into the future? Sci. Total Environ. 2021, 751, 141810. [Google Scholar] [CrossRef] [PubMed]
  19. Gerard, V.A. The light environment in a giant kelp forest: Influence of Macrocystis pyrifera on spatial and temporal variability. Mar. Biol. 1984, 84, 189–195. [Google Scholar] [CrossRef]
  20. Graham, M.H. Effects of local deforestation on the diversity and structure of Southern California giant kelp forest food webs. Ecosystems 2004, 7, 341–357. [Google Scholar] [CrossRef]
  21. Gaylord, B.; Rosman, J.H.; Reed, D.C.; Koseff, J.R.; Fram, J.; Maclntyre, S.; Arkema, K.; McDonald, C.; Brzezinski, M.A.; Largier, J.L.; et al. Spatial patterns of flow and their modification within and around a giant kelp forest. Limnol. Oceanogr. 2007, 52, 1838–1852. [Google Scholar] [CrossRef]
  22. Rosman, J.H.; Monismith, S.; Denny, M.; Koseff, J. Currents and turbulence within a kelp forest (Macrocystis pyrifera): Insights from a dynamically scaled laboratory model. Limnol. Oceanogr. 2010, 55, 1145–1158. [Google Scholar] [CrossRef]
  23. O’Connor, K.C.; Anderson, T.W. Consequences of habitat disturbance and recovery to recruitment and the abundance of kelp forest fishes. J. Exp. Mar. Biol. Ecol. 2010, 386, 1–10. [Google Scholar] [CrossRef]
  24. Pérez-Matus, A.; Carrasco, S.A.; Ospina-Alvarez, A. Length-weight relationships for 25 kelp forest-associated fishes of northern and central Chile. Rev. Biol. Mar. Oceanogr. 2014, 49, 141–145. [Google Scholar] [CrossRef]
  25. Layton, C.; Shelamoff, V.; Cameron, M.J.; Tatsumi, M.; Wright, J.T.; Johnson, C.R. Resilience and stability of kelp forests: The importance of patch dynamics and environment-engineer feedbacks. PLoS ONE 2019, 14, e0210220. [Google Scholar] [CrossRef] [PubMed]
  26. Pérez-Matus, A.; Micheli, F.; Konar, B.; Shears, N.; Low, N.H.N.; Okamoto, D.K.; Wernberg, T.; Krumhansl, K.A.; Ling, S.D.; Kingsford, M.; et al. Kelp forests as nursery and foundational habitat for reef fishes. Ecology 2025, 106, e70007. [Google Scholar] [CrossRef] [PubMed]
  27. Gambi, M.C.; Giangrande, A. Polychaetes of the soft bottoms of the Straits of Magellan collected during the Italian oceanographic cruise in February–March 1991. An. Inst. Patagon. 1993, 21, 179–192. [Google Scholar]
  28. Ríos, C.; Mutschke, E.; Montiel, A.; Arntz, W.E. Asociaciones faunísticas macrobentónicas de fondos blandos en el complejo de fiordos glaciales de Chile austral. Sci. Mar. 2005, 69, 225–239. [Google Scholar]
  29. Novoa, L.; Aldea, C.; Andrade, C.; Guarda, B.; Holtheuer, J.; Schories, D. Unveiling hidden molluscan diversity: New species records in Bougainville Bay, Strait of Magellan. Biodivers. Data J. 2025, 13, e157304. [Google Scholar] [CrossRef] [PubMed]
  30. Vanucci, S.; Mangoni, O. Pico- and nanophytoplankton assemblages in a subantarctic ecosystem: The Strait of Magellan. Bot. Mar. 1999, 42, 563–572. [Google Scholar] [CrossRef]
  31. Mutschke, E.; Ríos, C. Distribución espacial y abundancia relativa de equinodermos en el estrecho de Magallanes, Chile. Cienc. Tecnol. Mar. 2006, 29, 5–16. [Google Scholar]
  32. Andrade, C.D.; Sepúlveda, T.; Rivera, C.; Aldea, C.; Marina, T.I. Marine trophic architecture and hidden ecological connections in the Strait of Magellan: Keystone species and ecosystem resilience. Oikos 2025, 2026, e11711. [Google Scholar] [CrossRef]
  33. Palacios, M. Morpho-Functional Processes of Macrocystis pyrifera (Phaeophyceae) and Their Relationship with Environmental Stress Tolerance and Productivity in Populations of the Magellan Region. Ph.D. Thesis, Universidad Austral de Chile, Valdivia, Chile, 2022. [Google Scholar]
  34. Friedlander, A.M.; Ballesteros, E.; Bell, T.W.; Giddens, J.; Henning, B.; Hüne, M.; Muñoz, A.; Salinas-de-Leon, P.; Sala, E. Marine biodiversity at the end of the world: Cape Horn and Diego Ramírez Islands. PLoS ONE 2018, 13, e0189930. [Google Scholar] [CrossRef] [PubMed]
  35. Friedlander, A.M.; Ballesteros, E.; Bell, T.W.; Caselle, J.E.; Campagna, C.; Goodell, W.; Hüne, M.; Muñoz, A.; Salinas-de-León, P.; Sala, E.; et al. Kelp forests at the end of the earth: 45 years later. PLoS ONE 2020, 15, e0229259. [Google Scholar] [CrossRef] [PubMed]
  36. Hüne, M.; Friedlander, A.M.; Ballesteros, E.; Caselle, J.E.; Sala, E. Assemblage structure and spatial diversity patterns of kelp forest associated fishes in Southern Patagonia. PLoS ONE 2021, 16, e0257662. [Google Scholar] [CrossRef] [PubMed]
  37. Cárdenas, C.A.; Montiel, A. The influence of depth and substrate inclination on sessile assemblages in subantarctic rocky reefs (Magellan region). Polar Biol. 2015, 38, 1631–1644. [Google Scholar] [CrossRef]
  38. Sahade, R.; Lagger, C.; Torre, L.; Momo, F.; Monien, P.; Schloss, I.; Barnes, D.K.A.; Servetto, N.; Tarantelli, S.; Tatián, M.; et al. Climate change and glacier retreat drive shifts in an Antarctic benthic ecosystem. Sci. Adv. 2015, 1, e1500050. [Google Scholar] [CrossRef] [PubMed]
  39. Andrade, C.; Ríos, C.; Gerdes, D.; Brey, T. Trophic structure of shallow-water benthic communities in the sub-Antarctic Strait of Magellan. Polar Biol. 2016, 39, 2281–2297. [Google Scholar] [CrossRef]
  40. Huovinen, P.; Ramírez, J.; Palacios, M.; Gómez, I. Satellite-derived mapping of kelp distribution and water optics in the glacier impacted Yendegaia Fjord (Beagle Channel, Southern Chilean Patagonia). Sci. Total Environ. 2020, 703, 135531. [Google Scholar] [CrossRef] [PubMed]
  41. Beaton, E.C.; Küpper, F.C.; van West, P.; Brewin, P.E.; Brickle, P. The influence of depth and season on the benthic communities of a Macrocystis pyrifera forest in the Falkland Islands. Polar Biol. 2020, 43, 573–586. [Google Scholar] [CrossRef]
  42. Villalobos, V.I.; Valdivia, N.; Föfsterra, G.; Ballyram, S.; Espinoza, J.P.; Wadham, J.L.; Burgos-Andrade, K.; Häussermann, V. Depth-dependent diversity patterns of rocky subtidal macrobenthic communities along a temperate fjord in Northern Chilean Patagonia. Front. Mar. Sci. 2021, 8, 635855. [Google Scholar] [CrossRef]
  43. Jones, C.G.; Gutiérrez, J.L.; Byers, J.E.; Crooks, J.A.; Lambrinos, J.G.; Talley, T.S. A framework for understanding physical ecosystem engineering by organisms. Oikos 2010, 119, 1862–1869. [Google Scholar] [CrossRef]
  44. Watt, C.A.; Scrosati, R. Bioengineer effects on understory species richness, diversity, and composition change along an environmental stress gradient: Experimental and mensurative evidence. Estuar. Coast. Shelf Sci. 2013, 123, 10–18. [Google Scholar] [CrossRef]
  45. Palacios, M.; Kaminsky, J.; Macaya, E.C.; Boraso, A.; Rodríguez, M.; Hüne, M. New records of Microzonia velutina (Syringodermatales, Ochrophyta) in Isla Grande de Tierra del Fuego in the sub-Antarctic region. Bot. Mar. 2026, 69, 57–64. [Google Scholar] [CrossRef]
  46. Steel, R.G.; Torrie, I.H. Bioestadística: Principios y Procedimientos; McGraw-Hill Interamericana: Madrid, Spain, 1988; 640p. [Google Scholar]
  47. Santelices, B. Bases biológicas para el manejo de Lessonia nigrescens (Phaeophyta, Laminariales) en Chile central. Monogr. Biol. 1982, 2, 135–150. [Google Scholar] [CrossRef][Green Version]
  48. Vásquez, J.A. Variables morfométricas y relaciones morfológicas de Lessonia trabeculata Villouta and Santelices, 1986, en una población submareal del norte de Chile. Rev. Chil. Hist. Nat. 1991, 64, 271–279. [Google Scholar]
  49. Boltovskoy, D. Atlas del Zooplancton del Atlántico Sudoccidental y Métodos de Trabajo con el Zooplancton Marino; Publicación Especial del INIDEP: Mar del Plata, Argentina, 1981; 936p. [Google Scholar]
  50. Guglielmo, L.; Ianora, A. Atlas of Marine Zooplankton: Straits of Magellan. Amphipods, Euphausiids, Mysids, Ostracods, and Chaetognaths; Springer: Berlin, Germany, 1997. [Google Scholar]
  51. Pais, M.P.; Cabral, H.N. Effect of underwater visual survey methodology on bias and precision of fish counts: A simulation approach. PeerJ 2018, 6, e5378. [Google Scholar] [CrossRef] [PubMed]
  52. Clarke, K.R.; Gorley, R.N. PRIMER v7: User Manual/Tutorial; PRIMER-E: Plymouth, UK, 2015. [Google Scholar]
  53. Hammer, Ø.; Harper, D.A.T.; Ryan, P.D. PAST: Paleontological statistics software package for education and data analysis. Palaeontol. Electron. 2001, 4, 9. [Google Scholar]
  54. Jones, F.C. Taxonomic sufficiency: The influence of taxonomic resolution on freshwater bioassessments using benthic macroinvertebrates. Environ. Rev. 2008, 16, 45–69. [Google Scholar] [CrossRef]
  55. Chao, A. Estimating the population size for capture–recapture data with unequal catchability. Biometrics 1987, 43, 783. [Google Scholar] [CrossRef] [PubMed]
  56. Colwell, R.K. EstimateS: Statistical Estimation of Species Richness and Shared Species from Samples, Version 9.1.0; User’s Guide and Application; University of Connecticut: Storrs, CT, USA, 2013; Available online: http://purl.oclc.org/estimates (accessed on 14 May 2026).
  57. Brun, A.A.; Ramírez, N.; Pizarro, O.; Piola, A.R. The role of the Magellan Strait on the southwest South Atlantic shelf. Estuar. Coast. Shelf Sci. 2020, 237, 106661. [Google Scholar] [CrossRef]
  58. Aravena-Yáñez, V.; Garcés-Vargas, J.; Benavides-Martínez, I.F. Freshwater plume’s impact on the thermohaline structure of the water column in the central zone of the Strait of Magellan. Reg. Stud. Mar. Sci. 2025, 83, 104087. [Google Scholar] [CrossRef]
  59. Rojas-Celis, M.; Castillo, M.I.; Pérez-Santos, I.; Barrios-Guzmán, C.; Garcés-Vargas, J.; Guerrero, A.; Landaeta, M.F.; Piñones, A.; Sepúlveda, M. Turbulent mixing in Patagonian fjords and channels. EGUsphere 2025, preprint. [Google Scholar] [CrossRef]
  60. Hamamé, M.; Antezana, T. Chlorophyll and zooplankton in microbasins along the Strait of Magellan-Beagle Channel passage. Sci. Mar. 1999, 63, 35–42. [Google Scholar] [CrossRef]
  61. Sievers, H.A.; Silva, N. Water masses and circulation in austral Chilean channels and fjords. In Progress in the Oceanographic Knowledge of Chilean Interior Waters, from Puerto Montt to Cape Horn; Silva, N., Palma, S., Eds.; Comité Oceanográfico Nacional-Pontificia Universidad Católica de Valparaíso: Valparaíso, Chile, 2008; pp. 53–58. [Google Scholar]
  62. Haro, D.; Aguayo-Lobo, A.; Acevedo, J. Características oceanográficas y biológicas de las comunidades del plancton y necton del Área Marina Costera Protegida Francisco Coloane: Una revisión. An. Inst. Patagon. 2013, 41, 77–90. [Google Scholar] [CrossRef]
  63. Mansilla, A.; Ávila, M.; Cáceres, J.; Palacios, M.; Navarro, N.; Cañete, I.; Oyarzún, S. Diagnóstico Bases Biológicas Explotación Sustentable Macrocystis pyrifera (Huiro), XII Región, Código BIP N° 30060262-0; Informe de Proyecto; Universidad de Magallanes: Punta Arenas, Chile, 2009; 345p. [Google Scholar]
  64. Henríquez, L.A.; Buschmann, A.H.; Maldonado, M.A.; Graham, M.H.; Hernández-González, M.C.; Pereda, S.V.; Bobadilla, M.I. Grazing on giant kelp microscopic phases and the recruitment success of annual populations of Macrocystis pyrifera (Laminariales, Phaeophyta) in southern Chile. J. Phycol. 2011, 47, 252–258. [Google Scholar] [CrossRef] [PubMed]
  65. Plana, J.; Mansilla, A.; Palacios, M.; Navarro, N.P. Estudio poblacional de Macrocystis pyrifera (L.) C. Agardh (Laminariales: Phaeophyta) en ambientes protegido y expuesto al oleaje en Tierra del Fuego. Gayana 2007, 71, 66–75. [Google Scholar] [CrossRef]
  66. Wheeler, W.N. Nitrogen nutrition of Macrocystis. In Synthetic and Degradative Processes in Marine Macrophytes; Srivastava, L.M., Ed.; Walter de Gruyter: Berlin, Germany, 1982; pp. 121–137. [Google Scholar]
  67. Gerard, V.A. In situ rates of nitrate uptake by giant kelp, Macrocystis pyrifera (L.) C. Agardh: Tissue differences, environmental effects, and predictions of nitrogen-limited growth. J. Exp. Mar. Biol. Ecol. 1982, 62, 211–224. [Google Scholar] [CrossRef]
  68. Cisternas, N.; Garcés-Vargas, J.; Castillo, M.I.; Barrios-Guzmán, C.; Barilari, F.; Landaeta, M.F.; Sepúlveda, M.; Piñones, A. Salinity variability in the mixed layer off Chilean Patagonia: Potential influence of Patagonian ice fields. Prog. Oceanogr. 2026, 242, 103653. [Google Scholar] [CrossRef]
  69. Landaeta, M.F.; Skamiotis, K.; Lara, P.; Olivera, F. Spatio-temporal variations in the mesozooplankton assemblages off Clarence Island, Magellan Strait, Chile. Reg. Stud. Mar. Sci. 2024, 73, 103507. [Google Scholar] [CrossRef]
  70. Shaffer, J.A.; Munsch, S.H.; Cordell, J.R. Kelp Forest Zooplankton, Forage Fishes, and Juvenile Salmonids of the Northeast Pacific Nearshore. Mar. Coast. Fish. 2020, 12, 4–20. [Google Scholar] [CrossRef]
  71. Maldonado-Aguilar, A.; Ladah, L.B.; Fernandez-Aldecoa, G.; Solana, E.; Lorda, J.; Beas-Luna, R.; Filonov, A.; Leichter, J.; Zertuche-González, J.A. Small-scale spatiotemporal thermal regimes drive patterns of zooplankton abundance in a kelp forest. Cont. Shelf Res. 2023, 257, 104957. [Google Scholar] [CrossRef]
  72. Landaeta, M.F.; Bustos, C.A.; Palacios-Fuentes, P.; Rojas, P.; Balbontín, F. Distribución del ictioplancton en la Patagonia austral de Chile: Potenciales efectos del deshielo de Campos de Hielo Sur. Lat. Am. J. Aquat. Res. 2011, 39, 236–249. [Google Scholar] [CrossRef]
  73. Pizarro, G.; Iriarte, J.L.; Montecino, V.; Blanco, J.L.; Guzmán, L. Distribución de la biomasa fitoplanctónica y productividad primaria máxima de fiordos y canales australes (47°–50° S) en octubre 1996. Cienc. Tecnol. Mar. 2000, 23, 25–48. [Google Scholar]
  74. Cárdenas, C.; Cañete, J.; Oyarzún, S.; Mansilla, A. Podding of juvenile king crabs Lithodes santolla (Molina, 1782) (Crustacea) in association with holdfasts of Macrocystis pyrifera (Linnaeus) C. Agardh, 1980. Investig. Mar. 2007, 35, 105–110. [Google Scholar] [CrossRef]
  75. Cañete, I.; Friedlander, A.M.; Sala, E.; Figueroa, T. Podding of Paralomis granulosa (Lithodidae) juveniles inhabiting kelp forests of the Cape Horn Archipelago (Chile). Nauplius 2021, 29, e2021031. [Google Scholar] [CrossRef]
  76. Andrade, C.; Rivera, C.; Daza, E.; Almonacid, E.; Ovando, F.; Morello, F.; Pardo, L.M. Trophic niche dynamics and diet partitioning of king crab Lithodes santolla in Chile’s sub-Antarctic water. Diversity 2022, 14, 56. [Google Scholar] [CrossRef]
  77. Pineda-Metz, S.E.A.; Montiel, A. Seasonal dynamics of meroplankton in a sub-Antarctic fjord (Southern Patagonia, Chile). Polar Biol. 2021, 44, 875–886. [Google Scholar] [CrossRef] [PubMed]
  78. Avaria, S. Fitoplancton de canales y fiordos australes. In Progress in the Oceanographic Knowledge of Chilean Interior Waters, from Puerto Montt to Cape Horn; Silva, N., Palma, S., Eds.; Comité Oceanográfico Nacional-Pontificia Universidad Católica de Valparaíso: Valparaíso, Chile, 2006; pp. 89–92. [Google Scholar]
  79. Palacios, M.; Gómez, I.; Hüne, M. First photosynthetic characterization of the giant kelp Macrocystis pyrifera from the Comau Fjord, Northern Patagonia region. J. Appl. Phycol. 2025, 37, 3181–3195. [Google Scholar] [CrossRef]
  80. Moreno, C.A.; Jara, H.F. Ecological studies on fish fauna associated with Macrocystis pyrifera belts in the south of Fueguian Islands, Chile. Mar. Ecol. Prog. Ser. 1984, 15, 99–107. [Google Scholar] [CrossRef]
  81. Ojeda, F.P.; Labra, F.A.; Muñoz, A.A. Biogeographic patterns of Chilean littoral fishes. Rev. Chil. Hist. Nat. 2000, 73, 625–641. [Google Scholar] [CrossRef]
  82. Davenport, A.C.; Anderson, T.W. Positive indirect effects of reef fishes on kelp performance: The importance of mezograzers. Ecology 2007, 88, 1548–1561. [Google Scholar] [CrossRef] [PubMed]
  83. Marengo, M.; Iborra, L.; Leduc, M.; Lejeune, P.; Boissery, P.; Gobert, S. Assessing spatial and temporal trends in a Mediterranean fish assemblage structure. Diversity 2021, 13, 368. [Google Scholar] [CrossRef]
  84. Perry, A.L. Climate change and distribution shifts in marine fishes. Science 2005, 308, 1912–1915. [Google Scholar] [CrossRef] [PubMed]
  85. Clarke, A.; Johnston, N.M. Scaling of metabolic rate with body mass and temperature in teleost fish. J. Anim. Ecol. 1999, 68, 893–905. [Google Scholar] [CrossRef]
  86. Gómez, I.; Garcés-Vargas, J.; Garrido, I.; Huovinen, P.; Macaya, E.; Mellado, M.A.; Navarro, N.P.; Palacios, M.; Pardo, L.M.; Soto, D.; et al. Bosques Submarinos de la Patagonia; Universidad Austral de Chile: Valdivia, Chile, 2024; 139p, ISBN 978-956-418-537-8. [Google Scholar]
  87. Jones, C.G.; Lawton, J.H.; Shachak, M. Positive and negative effects of organisms as physical ecosystem engineers. Ecology 1997, 78, 1946–1957. [Google Scholar] [CrossRef]
  88. Newcombe, E.M.; Cárdenas, C.A. Rocky reef benthic assemblages in the Magellan Strait and the South Shetland Islands (Antarctica). Rev. Biol. Mar. Oceanogr. 2011, 46, 177–188. [Google Scholar] [CrossRef]
  89. Newcombe, E.M.; Cárdenas, C.A.; Geange, S.W. Green sea urchins structure invertebrate and macroalgal communities in the Magellan Strait, southern Chile. Aquat. Biol. 2012, 15, 135–144. [Google Scholar] [CrossRef]
  90. Stephens, T.A.; Desmond, M.J.; Hepburn, C.D. Biomass across space and tide: Architecture of a kelp bed with implications for the abiotic environment. Hydrobiologia 2019, 827, 391–404. [Google Scholar] [CrossRef]
  91. Arkema, K.; Reed, K.; Schroeter, S. Direct and indirect effects of giant kelp determine benthic community structure and dynamics. Ecology 2009, 90, 3126–3137. [Google Scholar] [CrossRef] [PubMed]
  92. Graham, M.H.; Harrold, C.; Lisin, S.; Light, K.; Watanabe, J.M.; Foster, M.S. Population dynamics of giant kelp Macrocystis pyrifera along a wave exposure gradient. Mar. Ecol. Prog. Ser. 1997, 148, 269–279. [Google Scholar] [CrossRef]
  93. Byrnes, J.E.; Reed, D.C.; Cardinale, B.J.; Cavanaugh, K.C.; Holbrook, S.J.; Schmitt, R.J. Climate driven increases in storm frequency simplify kelp forest food webs. Glob. Change Biol. 2011, 17, 2513–2524. [Google Scholar] [CrossRef]
  94. Reed, D.C.; Rassweiler, A.; Carr, M.H.; Cavanaugh, K.C.; Malone, D.P.; Siegel, D.A. Wave disturbance overwhelms top-down and bottom-up control of primary production in California kelp forests. Ecology 2011, 92, 2108–2116. [Google Scholar] [CrossRef] [PubMed]
  95. Wheeler, W.N. Pigment content and photosynthetic rate of the fronds of Macrocystis pyrifera. Mar. Biol. 1980, 56, 97–102. [Google Scholar] [CrossRef]
  96. Ramírez, M.E. Benthic marine flora from southern South America and Antarctica. An. Inst. Patagon. 2010, 38, 57–71. [Google Scholar] [CrossRef]
  97. Mansilla, A.; Ávila, M.; Ramírez, M.E.; Rodríguez, J.P.; Rosenfeld, S.; Ojeda, J.; Marambio, J. Macroalgas marinas bentónicas del submareal somero de la ecorregión subantártica de Magallanes, Chile. An. Inst. Patagon. 2013, 41, 51–64. [Google Scholar] [CrossRef]
  98. Palacios, M. Macroalgas submareales de los canales interiores del Parque Nacional Bernardo O’Higgins (~49°–51°S), región de Magallanes, Chile. An. Inst. Patagon. 2018, 46, 41–50. [Google Scholar] [CrossRef]
  99. Ojeda, J.; Marambio, J.; Rosenfeld, S.; Contador, T.; Rozzi, R.; Mansilla, A. Seasonal changes of macroalgae assemblages on the rocky shores of the Cape Horn Biosphere Reserve, Sub-Antarctic channels, Chile. Aquat. Bot. 2019, 157, 33–41. [Google Scholar] [CrossRef]
  100. Mansilla, A.; Gérard, K.; Boo, G.H.; Ramírez, M.E.; Ojeda, J.; Rosenfeld, S.; Murcia, S.; Marambio, J.; Gonzalez-Wevar, C.; Calderón, M.; et al. Populations of a new morphotype of corrugate Lessonia Bory in the Beagle Channel, sub-Antarctic Magellanic ecoregion: A possible case of on-going speciation. Cryptogam. Algol. 2020, 41, 11. [Google Scholar] [CrossRef]
  101. Marambio, J.; Rosenfeld, S.; Rodríguez, J.P.; Méndez, F.; Contador, T.; Mackenzie, R.; Goffinet, B.; Rozzi, R.; Mansilla, A. Siete nuevos registros de macroalgas para el archipiélago Diego Ramírez (56°31′ S): El valor del nuevo parque marino como sumidero de carbono y conservación de la biodiversidad subantártica. An. Inst. Patagon. 2020, 48, 99–111. [Google Scholar] [CrossRef]
  102. Jofre, J.; Dubrasquet, H.; Ramírez, M.E.; Navarro, N.P.; Macaya, E.C. Subantarctic Macroalgae Guide: Magallanes and Chilean Antarctica Region; Centro IDEAL: Punta Arenas, Chile, 2021; ISBN 978-956-404-851-2. [Google Scholar]
  103. Rodríguez, J.P.; Gibelli, V.; Bahamonde, F.; Marambio, J.; Calderón, M.; Bustamante, D.; Rozzi, R.; Mansilla, A. Primer catálogo de macroalgas marinas bentónicas del canal Beagle occidental: Relevancia del nuevo Herbario de Criptógamas Subantárticas (HCS) UMAG-CHIC, Chile. An. Inst. Patagon. 2024, 52, 1–41. [Google Scholar] [CrossRef]
  104. Kaminsky, J.; Palacios, M.; Rodríguez, M.; Hüne, M. Sub-Antarctic subtidal and intertidal macroalgae in rocky ecosystems of Inútil Bay, Tierra del Fuego in Southern Patagonia. Biodivers. Data J. 2026, 14, e183377. [Google Scholar] [CrossRef] [PubMed]
  105. Huovinen, P.; Gómez, I. Spectral attenuation of solar radiation in Patagonian fjords and coastal waters and implications for algal photobiology. Cont. Shelf Res. 2011, 31, 254–259. [Google Scholar] [CrossRef]
  106. Pearse, J.S.; Hines, A.H. Expansion of a central California kelp forest following the mass mortality of sea urchins. Mar. Biol. 1979, 51, 83–91. [Google Scholar] [CrossRef]
  107. Reed, D.; Foster, M. The effects of canopy shading on algal recruitment and growth in a giant kelp forest. Ecology 1984, 65, 937–948. [Google Scholar] [CrossRef]
  108. Gómez, I.; Loaiza, J.; Palacios, M.; Osman, D.; Huovinen, P. Functionality of photobiological traits of the giant kelp (Macrocystis pyrifera) as key determinant to thrive in contrasting habitats in a sub-Antarctic region. Sci. Total Environ. 2025, 971, 179055. [Google Scholar] [CrossRef] [PubMed]
Figure 1. Geographic location of the study area at Cape Froward, Brunswick Peninsula in the Strait of Magellan (red rectangle), showing the sampling stations (S). (A) The sampling stations in the figure are represented by geometric shapes of different colors located relative to Cape Froward; red (diamonds) represent stations on the west coast, blue (squares) represent stations on the central coast, and deep violet (circles) represent stations on the east coast. (B) Recording of abiotic variables in the water column, (C) population monitoring of giant kelp forests M. pyrifera, (D) Zooplankton sampling with a bongo net, (E) visual fish census along a sampling transect, (F,G) photo-quadrat surveys of benthic invertebrate diversity and macroalgal understory. Photos: (B,D) Nicolas Muñoz, (G) Mariano Rodríguez, (C,E,F) Eduardo Sorensen (Fundación Rewilding Chile).
Diversity 18 00472 g001
Figure 2. Spatial distribution of taxonomic richness across different biological assemblages during spring 2024 (left panels) and autumn 2025 (right panels) in the Cape Froward area, Strait of Magellan. Panels (A,B) correspond to zooplankton, (C,D) to kelp forest fish, (E,F) to benthic invertebrates, and (G,H) to understory of macroalgae. Circle size represents the richness recorded at each sampling station, according to the categories defined in the legend.
Diversity 18 00472 g002
Figure 3. Non-metric multidimensional scaling (nMDS) ordination based on a Jaccard similarity matrix constructed from presence/absence data for the different biological assemblages in the Cape Froward area, Strait of Magellan. Panels correspond to (A) zooplankton, (B) kelp fish forest, (C) benthic invertebrates, and (D) understory of macroalgae. Points represent sampling stations, differentiated by season (spring and autumn). Ellipses indicate similarity levels among samples (20–50%), and stress values are shown in each panel.
Diversity 18 00472 g003
Table 1. Geographic position station depths (m) within the forests of M. pyrifera, and environmental variables (temperature (°C), salinity (psu), dissolved oxygen (O2, mg L−1) and transparency (m)) recorded at each sampling station in Cape Froward, Strait of Magellan, during spring 2024 and autumn 2025. Values represent the median of replicate measurements per station and sampling period. Abbreviations: Station (S), Sal. (Salinity), Temp. (Temperature), Trans. (Transparency), and n.d. (no data).
SectorStationLat.
(°S)
Lon.
(°W)
Depth
(m)
Spring 2024Autumn 2025
Temp.
(°C)
Sal.
(psu)
O2
(mg/L −1)
Trans.
(m)
Temp.
(°C)
Sal.
(psu)
O2
(mg L −1)
Trans.
(m)
CentralS1−53.986−71.3334.68.428.99.35.57.828.76.715
S2−53.999−71.4465.67.728.67.96.07.728.75.513
S3−53.942−71.5336.87.328.78.15.07.928.26.715
S4−53.921−71.6385.07.328.68.16.07.328.76.714
S9−53.892−71.2765.07.428.78.67.07.628.87.513
WestS5 −53.739−71.8865.37.728.77.65.08.128.76.316
S6−53.705−71.9896.17.528.87.46.08.228.35.818
S7−53.766−71.7774.97.528.87.59.0n.d.n.d.n.d.n.d.
S8−53.813−71.6316.07.528.87.27.58.528.86.315
EastS10 −53.842−71.0976.57.328.47.27.07.728.77.415
S11 −53.822−71.0376.07.228.686.57.628.37.514
S12−53.804−70.9975.57.428.67.64.57.728.77.616
Table 2. Frequency of occurrence (Freq., %) of the main zooplankton taxonomic groups recorded during the spring and autumn sampling periods. Frequency of occurrence was calculated as the percentage of stations where each taxon was present relative to the total number of stations sampled in each period. Only taxa reaching frequencies higher than 80% in at least one of the sampling periods are included.
PhylumFamilyTaxaFreq. (%)
SpringAutumn
CnidariaDiphyidaeMuggiaea atlantica7592
BougainvilliidaeBougainvilla spp.920
ArthropodaEuphausiidaeEuphausidae nauplii1000
EuphausiidaeCalyptopis1008
CalanidaeCalanoides sp.10092
ClausocalanidaeClausocalanus sp.92100
CentropagidaeCentropages sp.10025
MetridinidaeMetridia lucens5050
ScolecitrichidaeScolecithricella sp. 5892
OithonidaeOithona sp. 10092
RhincalanidaeRhincalanus nasutus8325
PodonidaePodon leuckarti830
PodonidaeEvadne tergespina1008
HyperiidaeHyperiella dilatata5083
HyperiidaeThemisto gaudichaudii0100
Brachiura zoea1000
Cirripedia nauplii1000
Cypris larvae928
ChaetognathaSagittidaeSerratosagitta tasmanica3392
ChordataClupeidaeSprattus fueguensis830
Appendicularia10092
Fish egg1000
Bryozoa Ciphonauta larvae100100
Echinodermata Larva Equinoidea830
Larva Asteroidea830
Ophiura larvae1000
Table 3. Frequency of occurrence (Freq., %) of the main taxonomic groups of fishes recorded during the spring and autumn sampling periods. Frequency of occurrence was calculated as the percentage of stations at which each taxon was present relative to the total number of stations sampled in each period. Trophic group classification according to Friedlander et al. [35]. Abbreviations: Pisc. = piscivore, Inv. = invertivore.
FamilyTaxaTrophic GroupFreq. (%)
SpringAutumn
MyxinidaeMyxine sp.Pisc., Inv.80
AgonidaeAgonopsis chiloensisInv.178
BovichtidaeCottoperca trigloidesPisc., Inv.1717
NototheniidaePatagonotothen spp.Inv.5083
Patagonotothen tessellataInv.7533
Patagonotothen cornucolaInv.5058
Patagonotothen squamicepsInv.2517
Patagonotothen longipesInv.017
Paranotothenia magellanicaInv.2517
ZoarcidaeAustrolycus depressicepsPisc., Inv.88
Pogonolycus marinaePisc., Inv.017
SyngnathidaeLeptonotus blainvilleanusInv.88
Table 4. Frequency of occurrence (Freq., %) of the main taxonomic groups of benthic invertebrates recorded during the spring and autumn sampling periods. Frequency of occurrence was calculated as the percentage of stations at which each taxon was present relative to the total number of stations sampled in each period. Only taxa reaching frequencies higher than 50% in at least one of the sampling periods are included.
Phylum Family Taxa Freq. (%)
SpringAutumn
Cnidaria Actinaria5858
Hydrozoa5842
AnnelidaChaetopteridaeChaetopterus variopedatus4258
Polychaeta6783
MolluscaFissurellidaeFissurella sp.5050
Gastropoda8383
CalliostomatidaeMargarella violacea4250
NacellidaeNacella sp.8375
NacellidaeNacella deaurata5842
Nudibranchia7558
Polyplacophora5042
Arthropoda Cirripedia8392
PaguridaePagurus comptus5833
LithodidaeLithodes santolla7567
Echinodermata Asteroidea7558
AsteriidaeAnasterias antarctica5042
AsteriidaeCosmasterias lurida8392
ArbaciidaeArbacia dufresnii4250
TemnopleuridaePseudoechinus magellanicus7542
Holothuroidea7567
Ophiuroidea4275
ChordataDidemnidaeDidemnum studeri4250
Table 5. Frequency of occurrence (Freq., %) of the main taxonomic groups of understory of macroalgae recorded during the spring and autumn sampling periods. Frequency of occurrence was calculated as the percentage of stations at which each taxon was present relative to the total number of stations sampled in each period.
Phylum Family Taxa Freq. (%)
SpringAutumn
Chlorophyta Chlorophyta9082
UlvaceaeUlva sp.7582
CodiaceaeCodium sp.6064
Ochrophyta Ochrophyta9091
Crusty algae75100
DesmarestiaceaeDesmarestia confervoides9182
Desmarestia ligulata3364
Rhodophyta Rhodophyta8282
CorallinaceaeCorallina sp.6791
KallymeniaceaeCallophyllis sp.9273
Callophyllis variegata8345
Callophyllis atrosanguinea5036
GigartinaceaeSarcopeltis skottsbergii3382
DelesseriaceaeLophurella hookeriana5055
GigartinaceaeIridaea cordata500
RhodymeniaceaeRhodymenia coccocarpa5010
PalmariaceaePalmaria sp.509
DelesseriaceaeDelesseriaceae4282
Phycodrys rubens680
PlocamiaceaePlocamium secundatum589
CeramiaceaePtilonia magellanica4290
RhodomelaceaePolysiphonia sp.509
Disclaimer/Publisher’s Note: The statements, opinions and data contained in all publications are solely those of the individual author(s) and contributor(s) and not of MDPI and/or the editor(s). MDPI and/or the editor(s) disclaim responsibility for any injury to people or property resulting from any ideas, methods, instructions or products referred to in the content.