Article

Mitochondrial DNA Variation in Honey Bee (Apis mellifera) Colonies from Urban Districts of Beijing


State Key Laboratory of Resource Insects, Institute of Apicultural Research, Chinese Academy of Agricultural Sciences, Beijing 100193, China
*
Author to whom correspondence should be addressed.
Diversity 2026, 18(8), 471; https://doi.org/10.3390/d18080471
Submission received: 19 May 2026 / Revised: 29 July 2026 / Accepted: 29 July 2026 / Published: 5 August 2026
(This article belongs to the Special Issue Advances in Hymenoptera Diversity and Biology)

Abstract

After the introduction of various Apis mellifera subspecies into China, prolonged breeding and selection have substantially altered the genetic structure and diversity of commercial populations. Currently, A. mellifera has become the most widely managed and numerically dominant honey bee species in China, providing important agricultural pollination services and substantial economic benefits. Nevertheless, the genetic diversity and progenitor of commercially managed A. mellifera populations within different regions in China remain poorly understood. To assess the maternal lineage diversity of A. mellifera populations and to support regional breeding strategies, we examined DNA sequence diversity in the cytochrome C oxidase I (COI) and tRNAleu-COII gene segment of the mitochondrial genome in 178 samples of A. mellifera drones from 12 sites in the urban districts of Beijing. Three haplotypes were found for the COI gene segment, and eight haplotypes were discovered for the tRNAleu-COII gene segment. Mitochondrial sequencing revealed that the frequency of C evolutionary lineage dominates in A. mellifera populations in Beijing. In addition, one unexpected haplotype from the Z lineage was detected. The subspecies Apis mellifera ligustica, representing the C1 haplotype, demonstrates the widest distribution and highest frequency. Our results also showed that significant genetic differentiation exists among commercial populations of A. mellifera in the urban districts of Beijing.

1. Introduction

Pollination of crop and non-crop plants globally benefits from pollinating insects, such as honey bees; thus, it is critical to understand the diversity, abundance, and distribution of honey bee populations [1]. The honey bee species, Apis mellifera Linnaeus, 1758, has been domesticated and managed by beekeepers for a long time to harvest honey, propolis, wax, etc. As a result of human activity, climate change, geographic isolation, and genetic variation, many A. mellifera subspecies have emerged [2,3,4]. Approximately 33 honey bee subspecies have been described and documented thus far, which were originally distributed across their native regions, including Europe, Africa, and Western Asia [5]. Recently, many A. mellifera subspecies have spread from their native regions to other parts of the world due to human activity or trade [5,6]. Numerous studies have indicated varying degrees of introgression and admixture among A. mellifera lineages, subspecies, and even populations [7]. It is commonly known that these described A. mellifera subspecies have been divided into six evolutionary lineages, according to their geographic range, morphometric features, and mitochondrial/nuclear DNAs polymorphisms [8,9,10]: the African lineage (A); the Eastern European lineage (C); the Middle Eastern lineage (O) [4,10,11]; the West European lineage (M); and the recently proposed Eastern African lineage Y and Z [12,13].
Through genomic resequencing, the first native A. mellifera subspecies was identified in China in 2016, as shown in a previous study [14]. In China, A. mellifera was originally recognized as an alien species. Previous studies suggested that A. mellifera colonies in temperate climates would collapse without intensive management of brood mites implemented by beekeepers [14,15]. Currently, A. mellifera is the most highly domesticated honey bee species in China with the largest number of beekeeping populations [16,17]. In the late 1800 s, A. mellifera was first imported into China from Tsarist Russia [17]. Originally, these imported black A. mellifera species spread and developed in the Northeast region and the Xinjiang Autonomous Region of China. It is written in the local annals that these black honey bees include Apis mellifera carnica, the Russian bee, and hybrids of the two. In later years, other A. mellifera subspecies, such as Apis mellifera ligustica and Apis mellifera caucasica, were imported from other countries or regions. Among them, A. m. ligustica is the most widely distributed subspecies. At that time, the genetic ancestries of these imported honey bee subspecies were relatively simple, and they were primarily kept in stationary apiaries. As a result, the introduced subspecies in various regions largely retained their original genetic composition and gradually developed superior local strains. As we all know, the royal jelly high-yield strain, Zhejiang Royal Jelly Bee, is a representative example of regional directive breeding. Local beekeepers in Zhejiang Province implemented multi-generational selective breeding targeting the royal jelly production traits of A. m. ligustica, establishing the high royal jelly producing lineage of honey bee [18]. However, in the 1960s, nationwide migratory beekeeping, uncontrolled mating, indiscriminate introduction of non-native stocks, and haphazard breeding practices led to significant genetic hybridization in A. mellifera populations [17].
Local honey bee populations and subspecies are considered well-adapted to their native environments, and preserving their genetic structure and variation is of great significance for the long-term sustainability of beekeeping activities and associated ecosystem services. Mitochondrial DNA (mtDNA) is maternally inherited and is one of the most practical methods for studying intra- and interspecific comparisons of honey bee [19,20]. It has been widely used to evaluate the evolutionary lineages of A. mellifera subspecies [21,22]. Each evolutionary lineage can be distinguished by the pattern and variation in sequence motifs (e.g., Q/P element) that constitute the intergenic region between COI and COII of mtDNA. Lineage M contains sequence P (54–56 bp) and lineage A contains sequence Po (62–69 bp). Lineage C does not contain the sequence P/Po and contains a single sequence Q (192–193 bp). Franck et al. (2000) assigned the haplotypes detected in Lebanese colonies to lineage O due to the presence of an additional restriction site that yielded a 66/67 bp DNA fragment [10]. Currently, these haplotypes are generally assigned to lineage Z, which is now treated as a distinct subgroup within lineage A [13]. Most studies explored mtDNA diversity for the discrimination of various subspecies and determination of the intergradation process of the indigenous populations [23]. As the Regional Collaborative Breeding Program launches, understanding the genetic diversity of local honey bee populations is a fundamental prerequisite for the effective conservation and utilization of genetic resources, as well as for selective breeding.
During the reproductive season of colonies, many sexually mature drones from surrounding colonies congregate in drone congregation areas (DCAs) and mate with queens [24,25]. Drones assembled in DCAs come from surrounding colonies, and therefore, the state of the whole surrounding colonies is generally well represented in the DCAs [26,27]. Existing evidence revealed that the drones of DCA and their surrounding colonies exhibit similar stable genetic diversity profiles [28]. To date, there is a limited study of the haplotype and genetic diversity of A. mellifera in China, which hinders the understanding of genetic composition and the assessment of genetic resources [29]. In this study, we used drones collected from different DCAs across the urban districts of Beijing to determine the mitochondrial diversity and phylogenetic relationships of A. mellifera populations. This study aims to characterize the mitochondrial haplotype diversity and genetic differentiation of A. mellifera populations in the urban districts of Beijing, thereby providing baseline genetic information to support future regional breeding efforts.

2. Materials and Methods

2.1. Sample Collection and Mapping

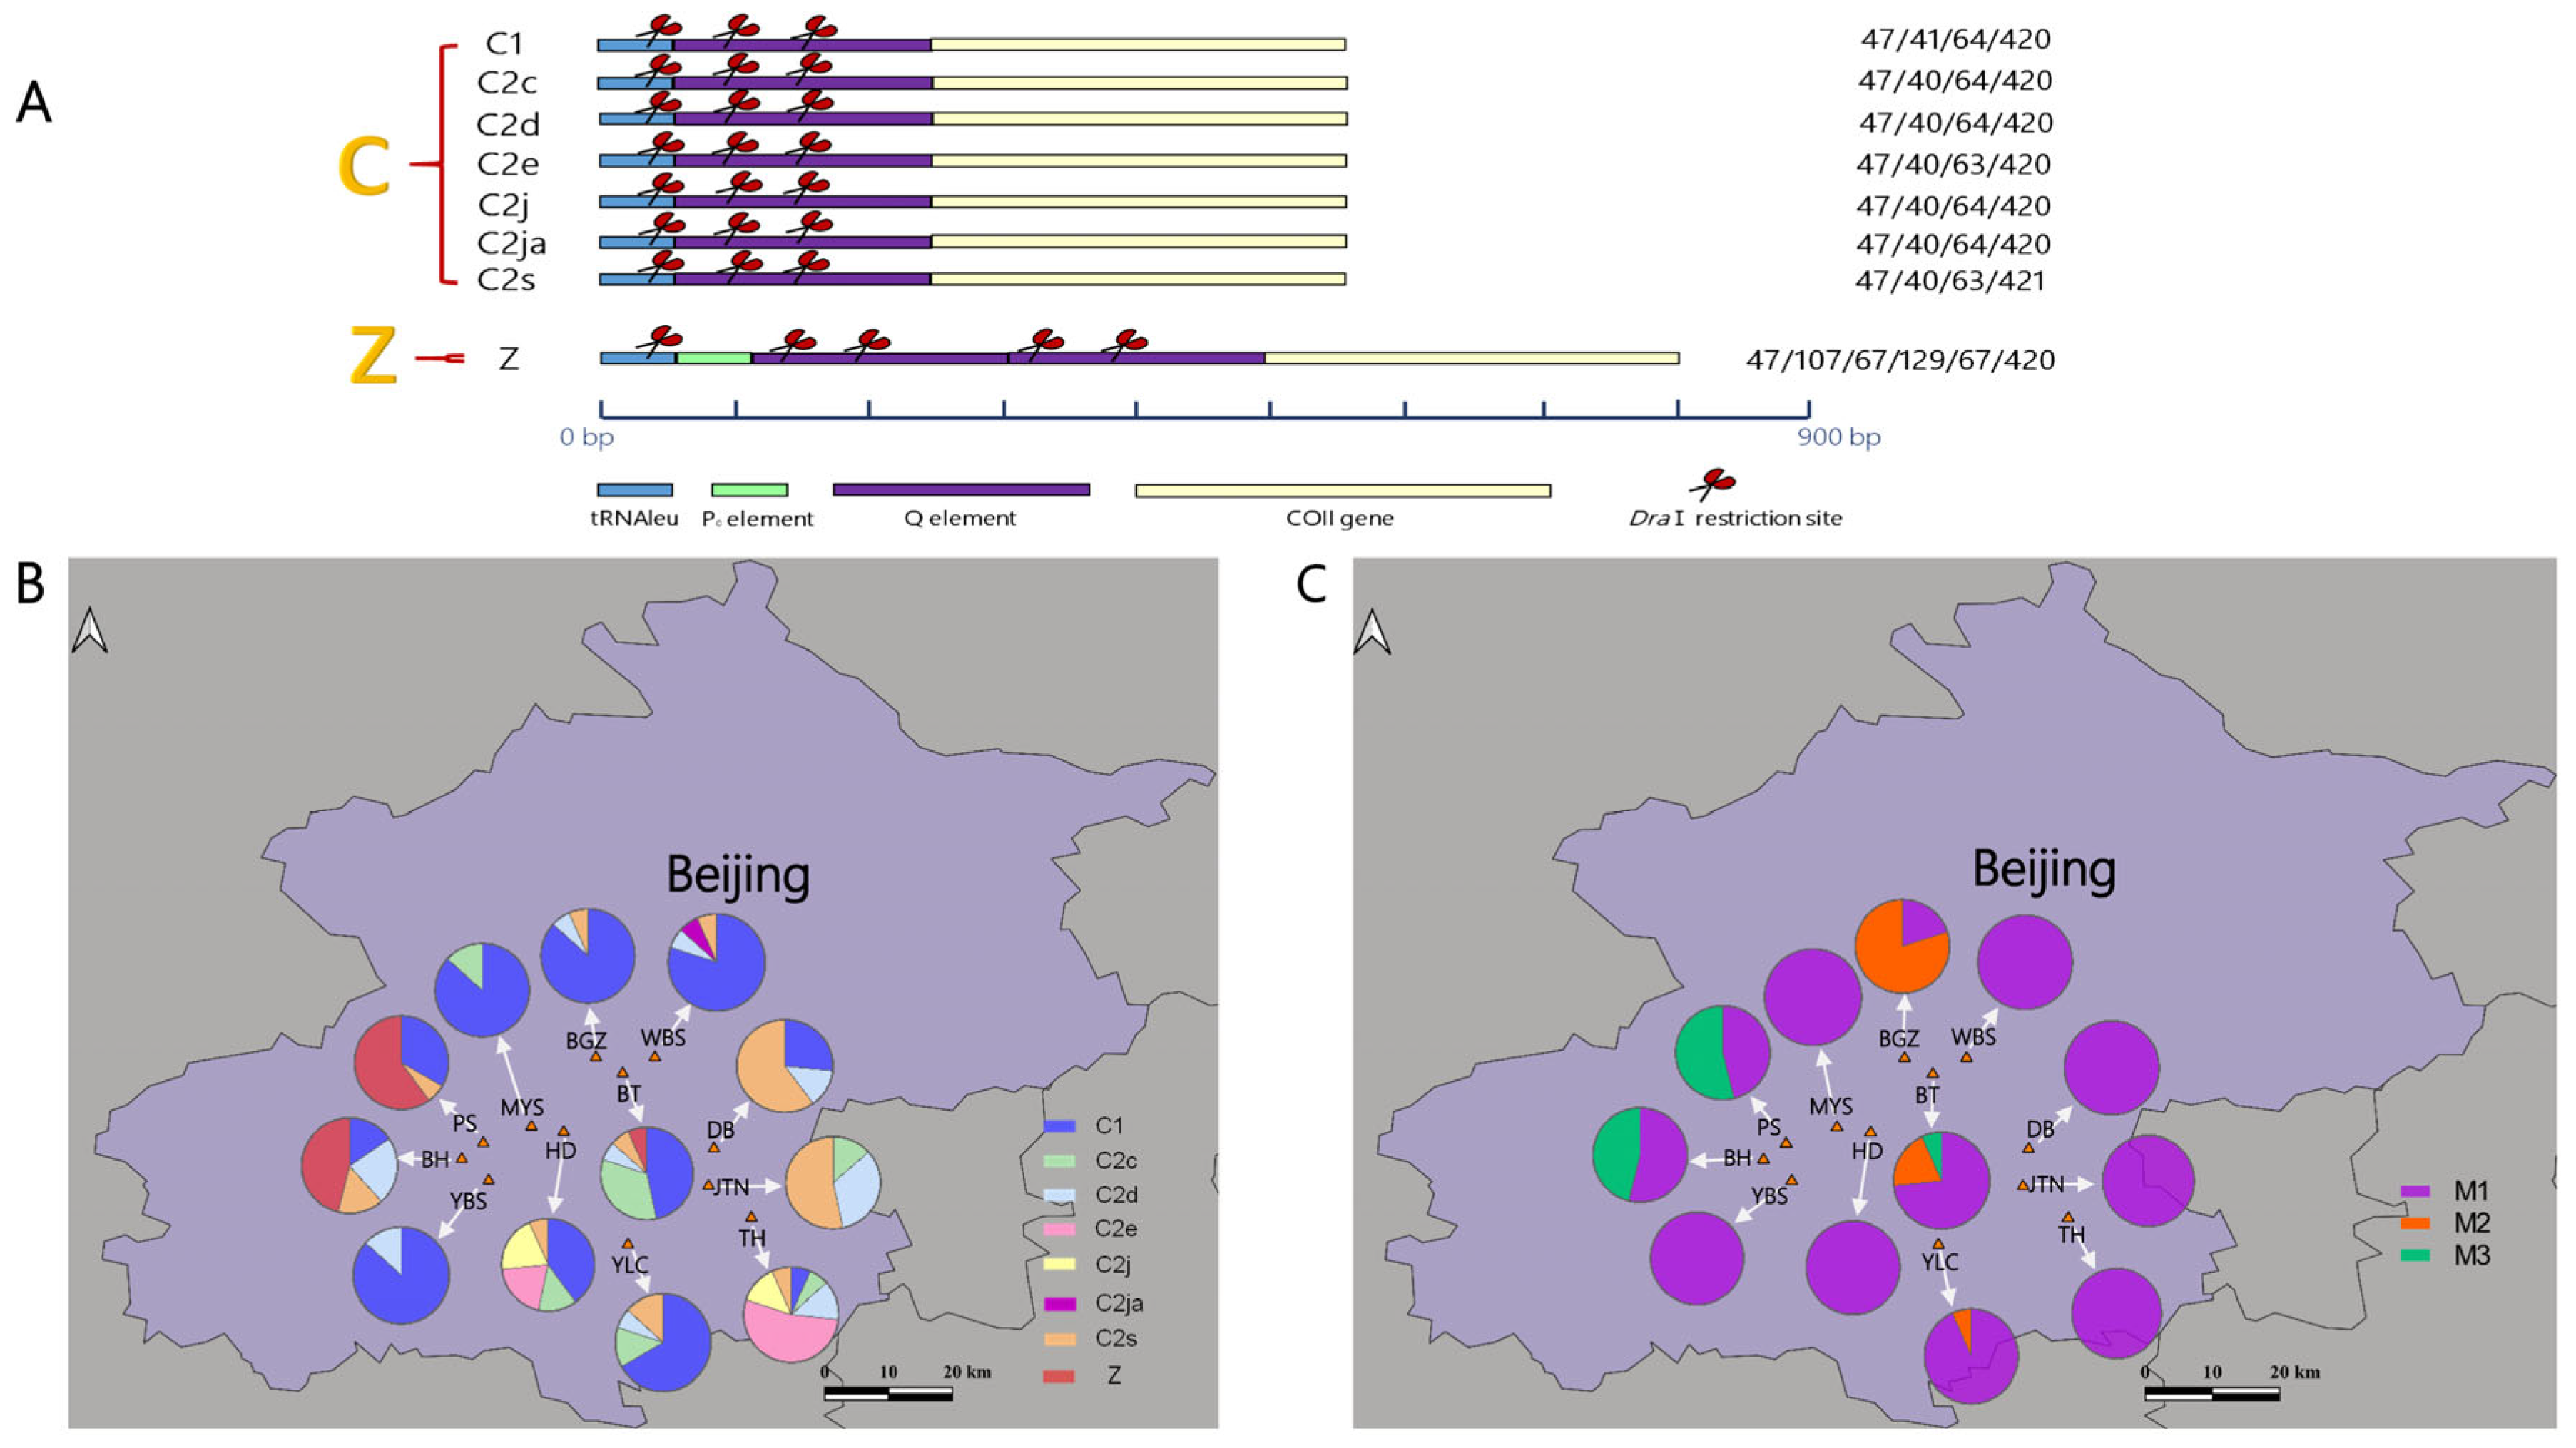
In April and May of 2025, we located DCAs using a Williams drone trap, a helium-filled balloon and pheromone (E-9-oxo-2-decenoic acid, 9-ODA) drone trap [30]. After DCAs were determined, the drones were captured from these DCAs following Utaipanon et al. (2019, 2021) [26,27]. Drone samples were collected, preserved in 50 mL Corning Centrifuge tubes containing absolute alcohol, and stored at −20 °C until further processing could be performed. More than 100 A. mellifera drones were collected from each DCA. In total, we sampled drones from 12 different DCAs that were distributed within the parks in the Beijing area (Figure 1B,C).
All the sites were located on the map of Beijing Municipality using their longitude and latitude coordinates through a geocoding plugin implemented in QGIS 3.40.13 (download from http://www.qgis.org) [31]. The map of Beijing Municipality was available with open access from the DataV.GeoAtlas (https://datav.aliyun.com/portal/school/atlas/area_selector accessed on 16 March 2026).
We randomly selected 15 drones from each sampling location for the next analysis, named as: PS1-15 from Paoshan City Forest Park, BH1-15 from Binghe Park, HD1-15 from Haidian Park, MYS1-15 from Miaoyun Temple Park, BT1-15 from Banta Country Park, BGZ1-15 from Baigezhuang Ecological Wetland, YBS1-15 from Yongding River Waterfront Forest Park, WBS1-15 from Future Science City Waterfront Park, YLC1-15 from Yinluchi Park, DB1-15 from Dongba Country Park, JTN1-15 from Jintian Park, and TH1-15 from Taihu Park.

2.2. DNA Extraction and Amplification

Genomic DNA was extracted from the thorax of drones using the Animal Tissue Genomic DNA Extraction Kit (Huayueyang Biotech Co., Ltd., Beijing, China) according to the instructions. DNA integrity was assessed using 1% agrose gel electrophoresis stained with 1 × GelRed Nucleic Acid Gel Stain (Transgen Biotech Co., Ltd., Beijing, China). Fragments of mitochondrial tRNAleu-COII sequences were amplified using the primer pair designed by [9]. The forward primer (E2) sequence was 5′-GGCAGAATAAGTGCATTG-3′, and the reverse primer (H2) sequence was 5′-CAATATCATTGATGACC-3′. The amplification reaction (50 μL) for each sample was composed of 4 μL DNA template, 0.4 μL E2 (10 μM), 0.4 μL H2 (10 μM), 25 μL 2 × TransTaq®-T PCR SuperMix (+dye) (TranGen Biotech Co., Ltd., Beijing, China), and 20.2 μL sterile water. The primers were synthesized by GENEWIZ (Suzhou, China). The PCR amplification program was as follows: heating at 94 °C for 5 min, followed by 35 cycles of denaturation at 94 °C for 45 s, annealing at 48 °C for 45 s, and extension at 62 °C for 120 s. The reaction was finalized by extension at 65 °C for 20 min.
A fragment of mitochondrial COI sequence was amplified using primers from the previous study [15] with modifications. The forward primer (COI-1908) sequence was 5′-TTAAGATCCCCAGGATCATG-3′. The reverse primer (AD1COI-2932) sequence was 5′-TCGCTGTCGGTGAAGACTGCAAATACTGCACCTATTG-3′. The ADICOI-2932 primer was modified from the COI-2932 primer [15] with a 17 bp-nucleotides extension at the 5′ end, and we designated it as AD1COI-2932. The reaction mix (25 μL) contained: 2.5 μL 10 × HF Buffer; 1 μL MgSO4 (50 mM); 2 μL dNTP mix (2.5 mM); 0.5 μL COI-1908; 0.5 μL AD1COI-2932; 1 μL DNA; 0.15 μL Platinum® Taq DNA Polymerase High Fidelity (Invitrogen, Thermo Fisher Scientific Inc., Waltham, MA, USA.). The PCR amplification profile included an initial denaturation step at 95 °C for 5 min, followed by 35 cycles of denaturation at 94 °C for 30 s, annealing at 50 °C for 30 s, and elongation at 72 °C for 1 min, and a final extension step at 72 °C for 10 min. Products of PCR for each sample were purified using the Universal DNA Purification Kit (TranGen Biotech Co., Ltd., Beijing, China) and then sent to Sangon Biotech Co., Ltd. (Shanghai, China) for sequencing from both ends using the above mentioned primers.

2.3. Mitochondrial DNA Analysis

The assembled and corrected sequences were uploaded to the National Center for Biotechnology Information (NCBI) to roughly determine their species. Two samples showed 100% sequence identity with Apis cerana reference sequences in both the tRNAleu-COII and COI regions. They were further confirmed to be A. cerana drones based on the morphological characteristics and were excluded from subsequent analysis. The sequences of tRNAleu-COII and COI were analyzed using MUSCLE multi-alignment within the MEGA XII software (version 12.1.2), respectively. The in silico Dra I patterns of these tRNAleu-COII sequences were determined to confirm the haplotypes using the SeqBuilder program within the DNASTAR Lasergene 7.0 software, based on the previously published results of the Dra I mtDNA test [12,32]. The sequences of the determined haplotypes in this study were compared with those of previously published haplotypes. They were assigned the same haplotype names when the sequences showed 100% identity.
DnaSP 5.10 was used to calculate genetic variation indices, including polymorphic sites (S), number of haplotypes (N0), haplotype diversity (hd), nucleotide diversity (π), and the average number of nucleotide differences (k) [33]. For these diversity estimates, sites with gaps were excluded. Genetic differentiation among sites was assessed using analysis of molecular variance (AMOVA) in Arlequin 3.5.2.2 [34].

2.4. Network and Phylogenetic Analysis

The haplotype data files were generated in DnaSP 5.10 software with the option “sites with gaps/missing considered” and subsequently imported into Network 10.0 software. The median-joining network of haplotypes was constructed using Network 10.0 (Fluxus Technology, http://www.fluxus-engineering.com/sharenet.htm accessed on 27 December 2025). For phylogenetic analysis, the insertions/deletions and substitutions among aligned sequences were also coded as missing data. All the reference sequences of A. mellifera tRNAleu-COII and COI were retrieved from the GenBank database, including A. m. ligustica (OM203316.1), A. m. carnica (NC_061380.1), M (EF033656.1 and Apis mellifera iberiensis KX463911.1), Apis mellifera mellifera (KY926884.1 and AY114459.1), Apis mellifera syriaca (FJ477997.1 and FJ477996.1), Apis mellifera jemenitica (FJ714161.1), Apis mellifera lamarckii (FJ743632.1), A (EF033649.1 and EF033650.1), and Apis mellifera scutellata (KJ601784.1, and MG552700.1) haplotypes. Phylogenetic relationships between haplotypes obtained from the tRNAleu-COII and COI were respectively established using neighbor-joining method in MEGA XII [35]. The unrooted phylogenetic tree was refined and color-formatted using iTOL (https://itol.embl.de accessed on accessed on 22 July 2026).

3. Results

3.1. Haplotype Diversity and Genetic Variation in Mitochondrial DNA Based on tRNAleu-COII

We randomly selected a total of 180 samples, of which two were A. cerana drones. These A. cerana drones were collected from the same DCA in BH. The remaining 178 A. mellifera drones were analyzed and yielded two size fragments of the tRNAleu-COII region. One type of fragment was 570–572 bp. They were assigned to lineage C due to the absence of sequence P and the presence of a single sequence Q. The other type of fragment was 837 bp. It contains a sequence Po and two Q sequences. With the presence of an additional restriction site, it yielded a 67 bp DNA fragment. Therefore, it was assigned to Z lineage (Figure 1A). The haplotypes of lineage C have been reported and they were registered with the same names as previous studies (C1, C2c, C2d, C2e, C2j, C2ja, and C2s) (Figure 1A). The sequence variations among these C lineage haplotypes were shown in Figure S1. The C1 haplotype, which frequently appears in A. m. ligustica, was identified at all sampling sites except JTN. The C1 haplotype accounted for the highest percentage (48.3%) among all haplotypes (Table S1). Compared with the C1 haplotype, the frequency of the C2 haplotypes ranked second highest (42.7%) and was detected at all sampling sites (Table S1, Figure 1B). Among C2 haplotypes, the C2s haplotype was the most prevalent (15.2%) and was present at 10 sampling sites (Table S1, Figure 1B). We identified only one drone belonging to the C2ja haplotype, which was collected at the WBS site (Table S1, Figure 1B).
For the sequence that was assigned to Z lineage, it had the similar Dra I pattern as A. m. syriaca (HM236206.1). The difference in the sequence between them is an deletion of nucleotide. Haplotype Z was detected in 16 drones of our samples collected from three sites (PS, BH, and BT) (Table S1, Figure 1B).
The tRNAleu-COII sequences revealed that haplotype diversity varied across sites from 0.000 in MYS to 0.744 in BH (Table 1). The highest nucleotide diversity was detected at the BH site (0.00867) and the lowest (0.00000) at the MYS site. All the samples at MYS exhibited the same haplotype (Table 1). The result revealed that samples collected at PS also had relatively high level of genetic diversity (0.00777). Most of the other populations exhibited moderate level of genetic diversity (Table 1).
AMOVA analysis indicated that there existed significant genetic differentiation among the honey bee populations from 12 sampling sites (Fst = 0.393, p < 0.0001). For the tRNAleu-COII region, 39.30% of the genetic variation was distributed among populations, while 60.70% existed within populations (Table 2).

3.2. Haplotype Diversity and Genetic Variation in COI Gene

We also sequenced the COI gene from the above 178 A. mellifera samples, but obtained only 176 sequences. The sequences of PS13 and PS14 had overlapping peaks and were not used for subsequent analysis. The length of COI fragment was 945 bp. A total of three haplotypes were identified (M1–M3), with Haplotype M1 being the most prevalent, accounting for 83.0% among all the haplotypes (Table S2). Haplotype M1 was detected in all populations. Haplotype M2 was present at three sampling sites (BGZ, BT, and YLC) and had the second-highest frequency of 9.1%. The M3 haplotype was also detected at three sampling sites (PS, BT, and BH) and accounted for 7.9% of all samples (Table S2, Figure 1C). The BT site comprised all three detected haplotypes based on the COI gene fragment (Table S2, Figure 1C).
The analysis of polymorphism revealed that the COI sequences had 16 polymorphic sites, and all of them were parsimony informative sites (Figure S2). For the COI gene sequences, the average number of nucleotide differences (k), haplotype diversity (hd), and nucleotide diversity (Pi) of all samples were 2.375, 0.299 ± 0.042, and 0.00251 ± 0.00054, respectively (Table 1). Genetic diversity estimates for each site demonstrated that samples from PS and BH exhibited high levels of diversity, whereas HD, MYS, YBS, WBS, DB, JTN, and TH populations displayed complete genetic homogeneity with all individuals having identical DNA sequences (Table 1 and Figure 1C). Interestingly, the BT population possessed a higher number of haplotypes (No = 3) but lower nucleotide diversity than the PS and BH populations (Table 1).
AMOVA analysis of the COI sequence also showed significant genetic differentiation generated among these populations, with a higher value of Fst (0.421, p < 0.0001). For the COI sequences, a higher genetic variation was detected within populations (57.92%), and a much lower genetic variation (42.08%) was found among populations (Table 2).

3.3. Haplotype Networks Analysis

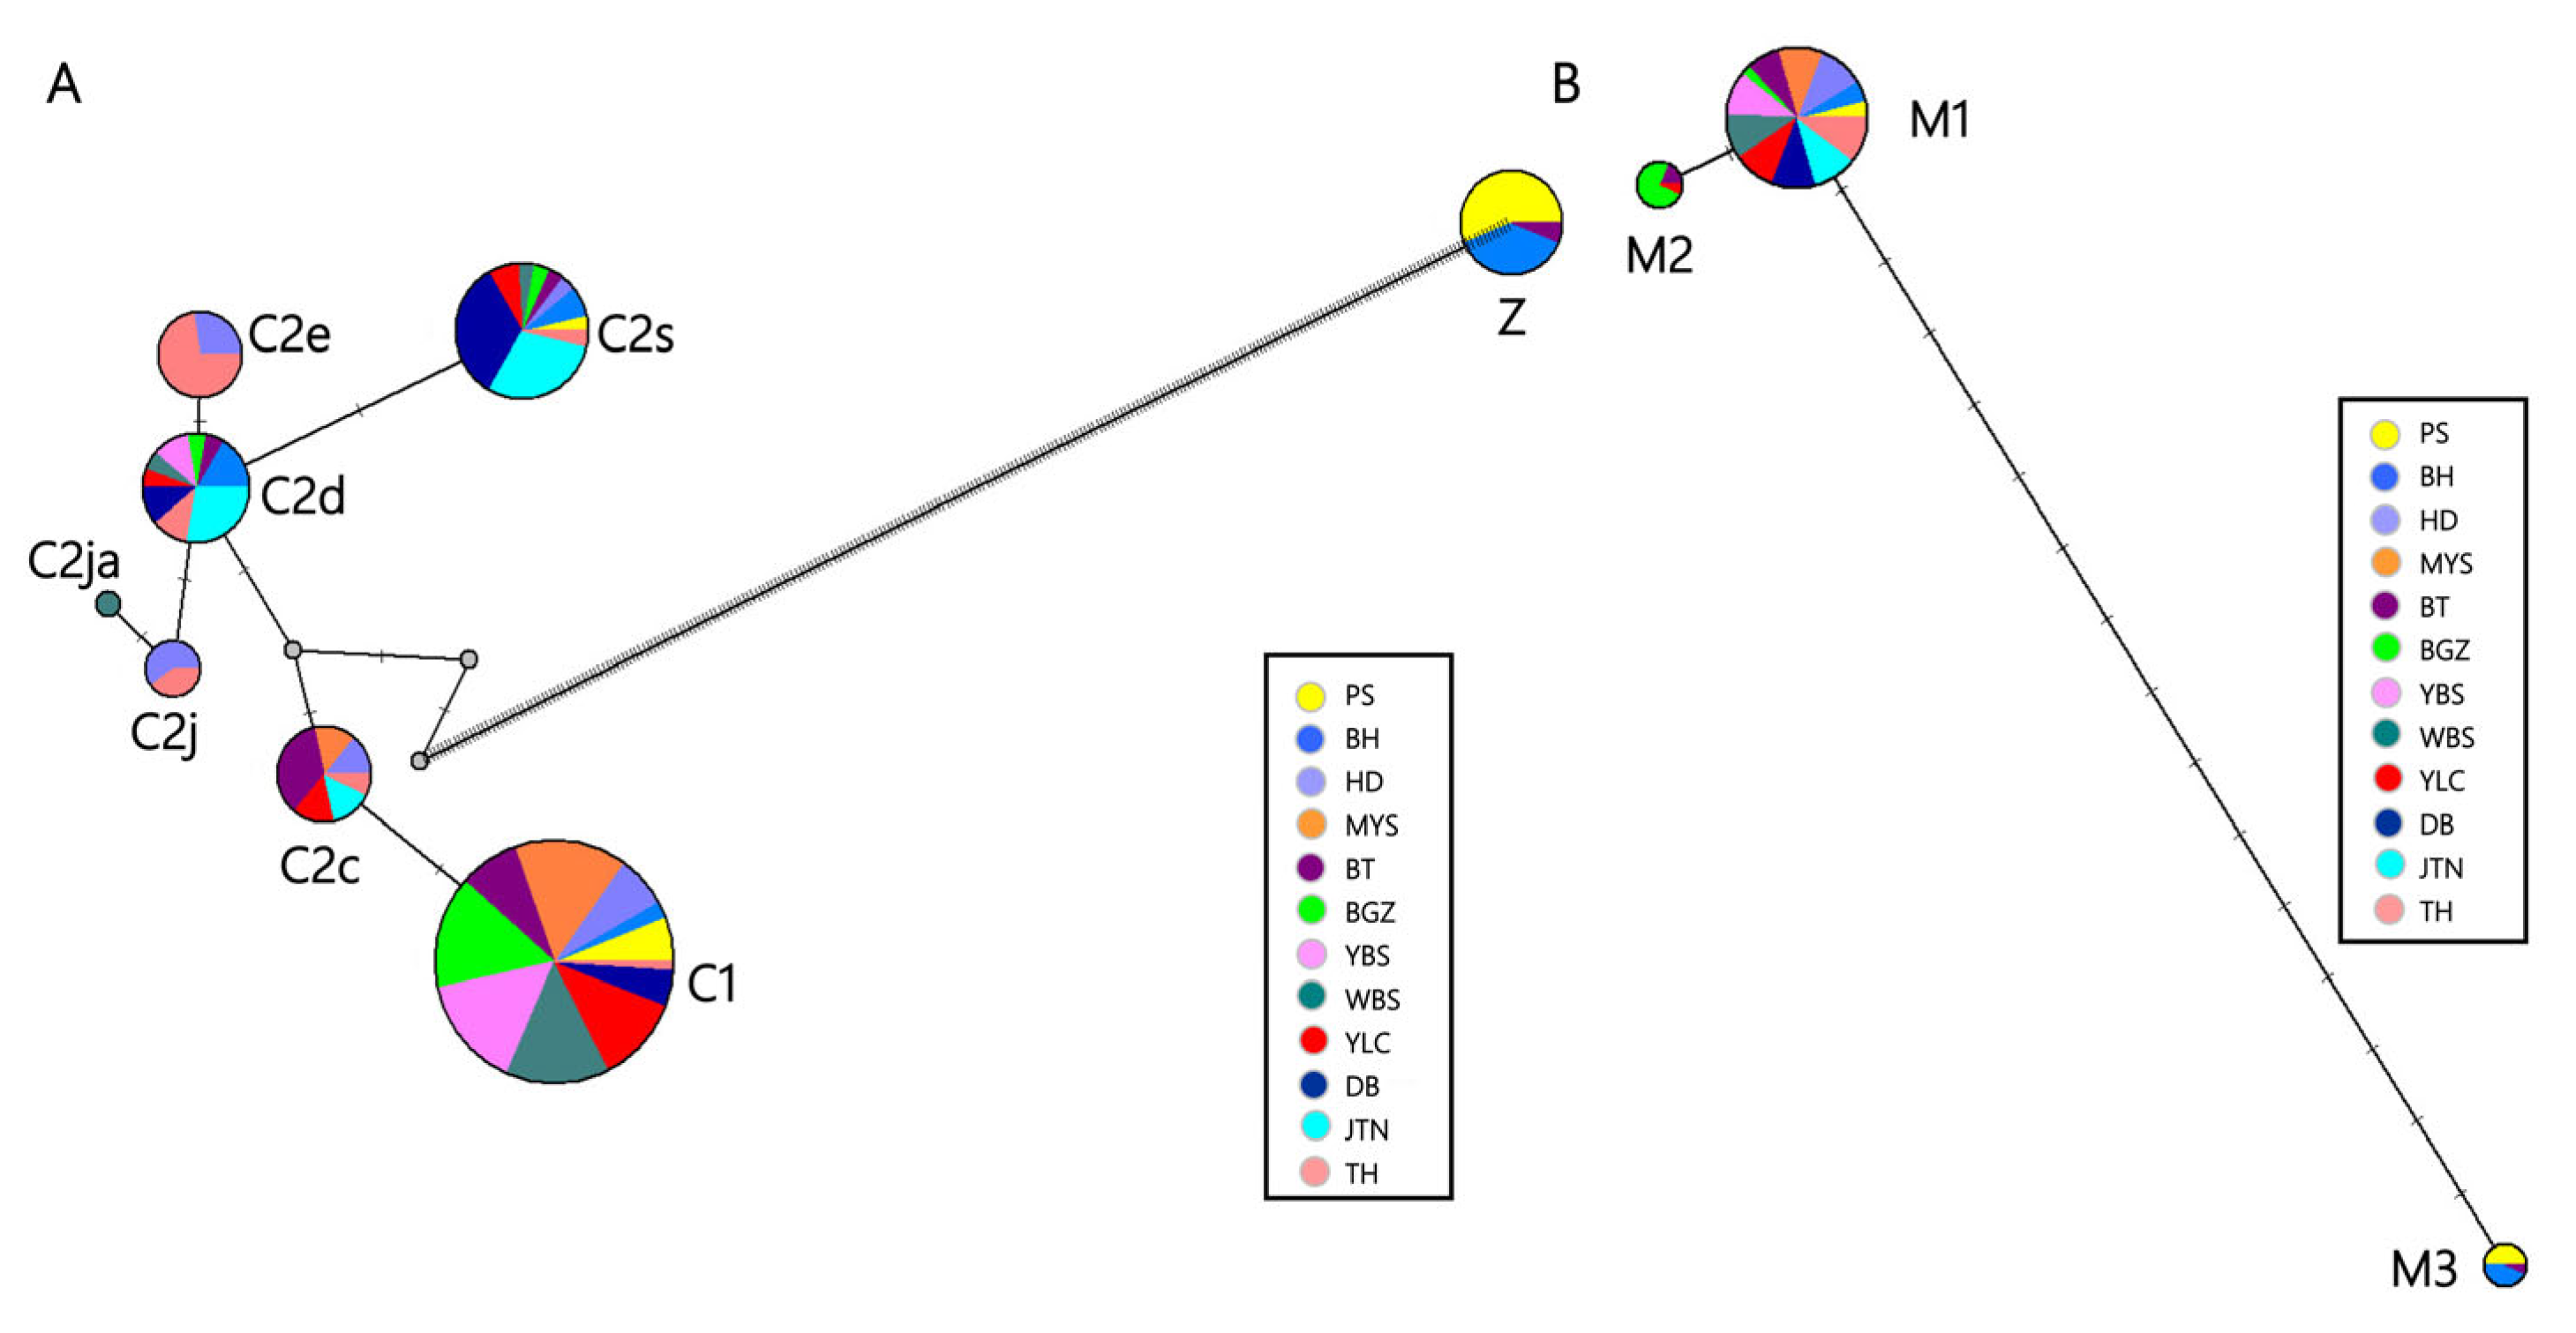
The median-joining haplotype network of 178 tRNAleu-COII sequences revealed that the haplotypes of the C lineage were grouped together, whereas those of the Z lineage were distinctly divergent from them (Figure 2A). Haplotypes C2c and C2d occupy a central position, linking the other haplotypes and hypothetical haplotypes. C2d has the greatest number of links with C2e, C2s, C2j, and C2ja, while C2c is linked to C1 (Figure 2A). Haplotype C2c clustered within the C1 group, showing more genetic proximity with A. m. ligustica than A. m. carnica. Haplotype C1 has the highest frequency, which is consistent with the result in Table S1. The Z haplotype showed considerable divergence from the other haplotypes due to the presence of the P0 element, insertions, substitutions, etc.
A median-joining network that illustrates the frequencies and relationships among the haplotypes of the COI fragment is shown in Figure 2B. The M1 haplotype not only becomes the central part, but also has the greatest frequency. Haplotype M3 is fifteen mutations away from the M1 haplotype (Figure S2). Moreover, it is novel that the M3 haplotype of the COI fragment and the Z haplotype of tRNAleu-COII region were distributed in the same locations and derived from exactly the same samples (Figure 2).

3.4. Phylogenetic Relationship Analysis

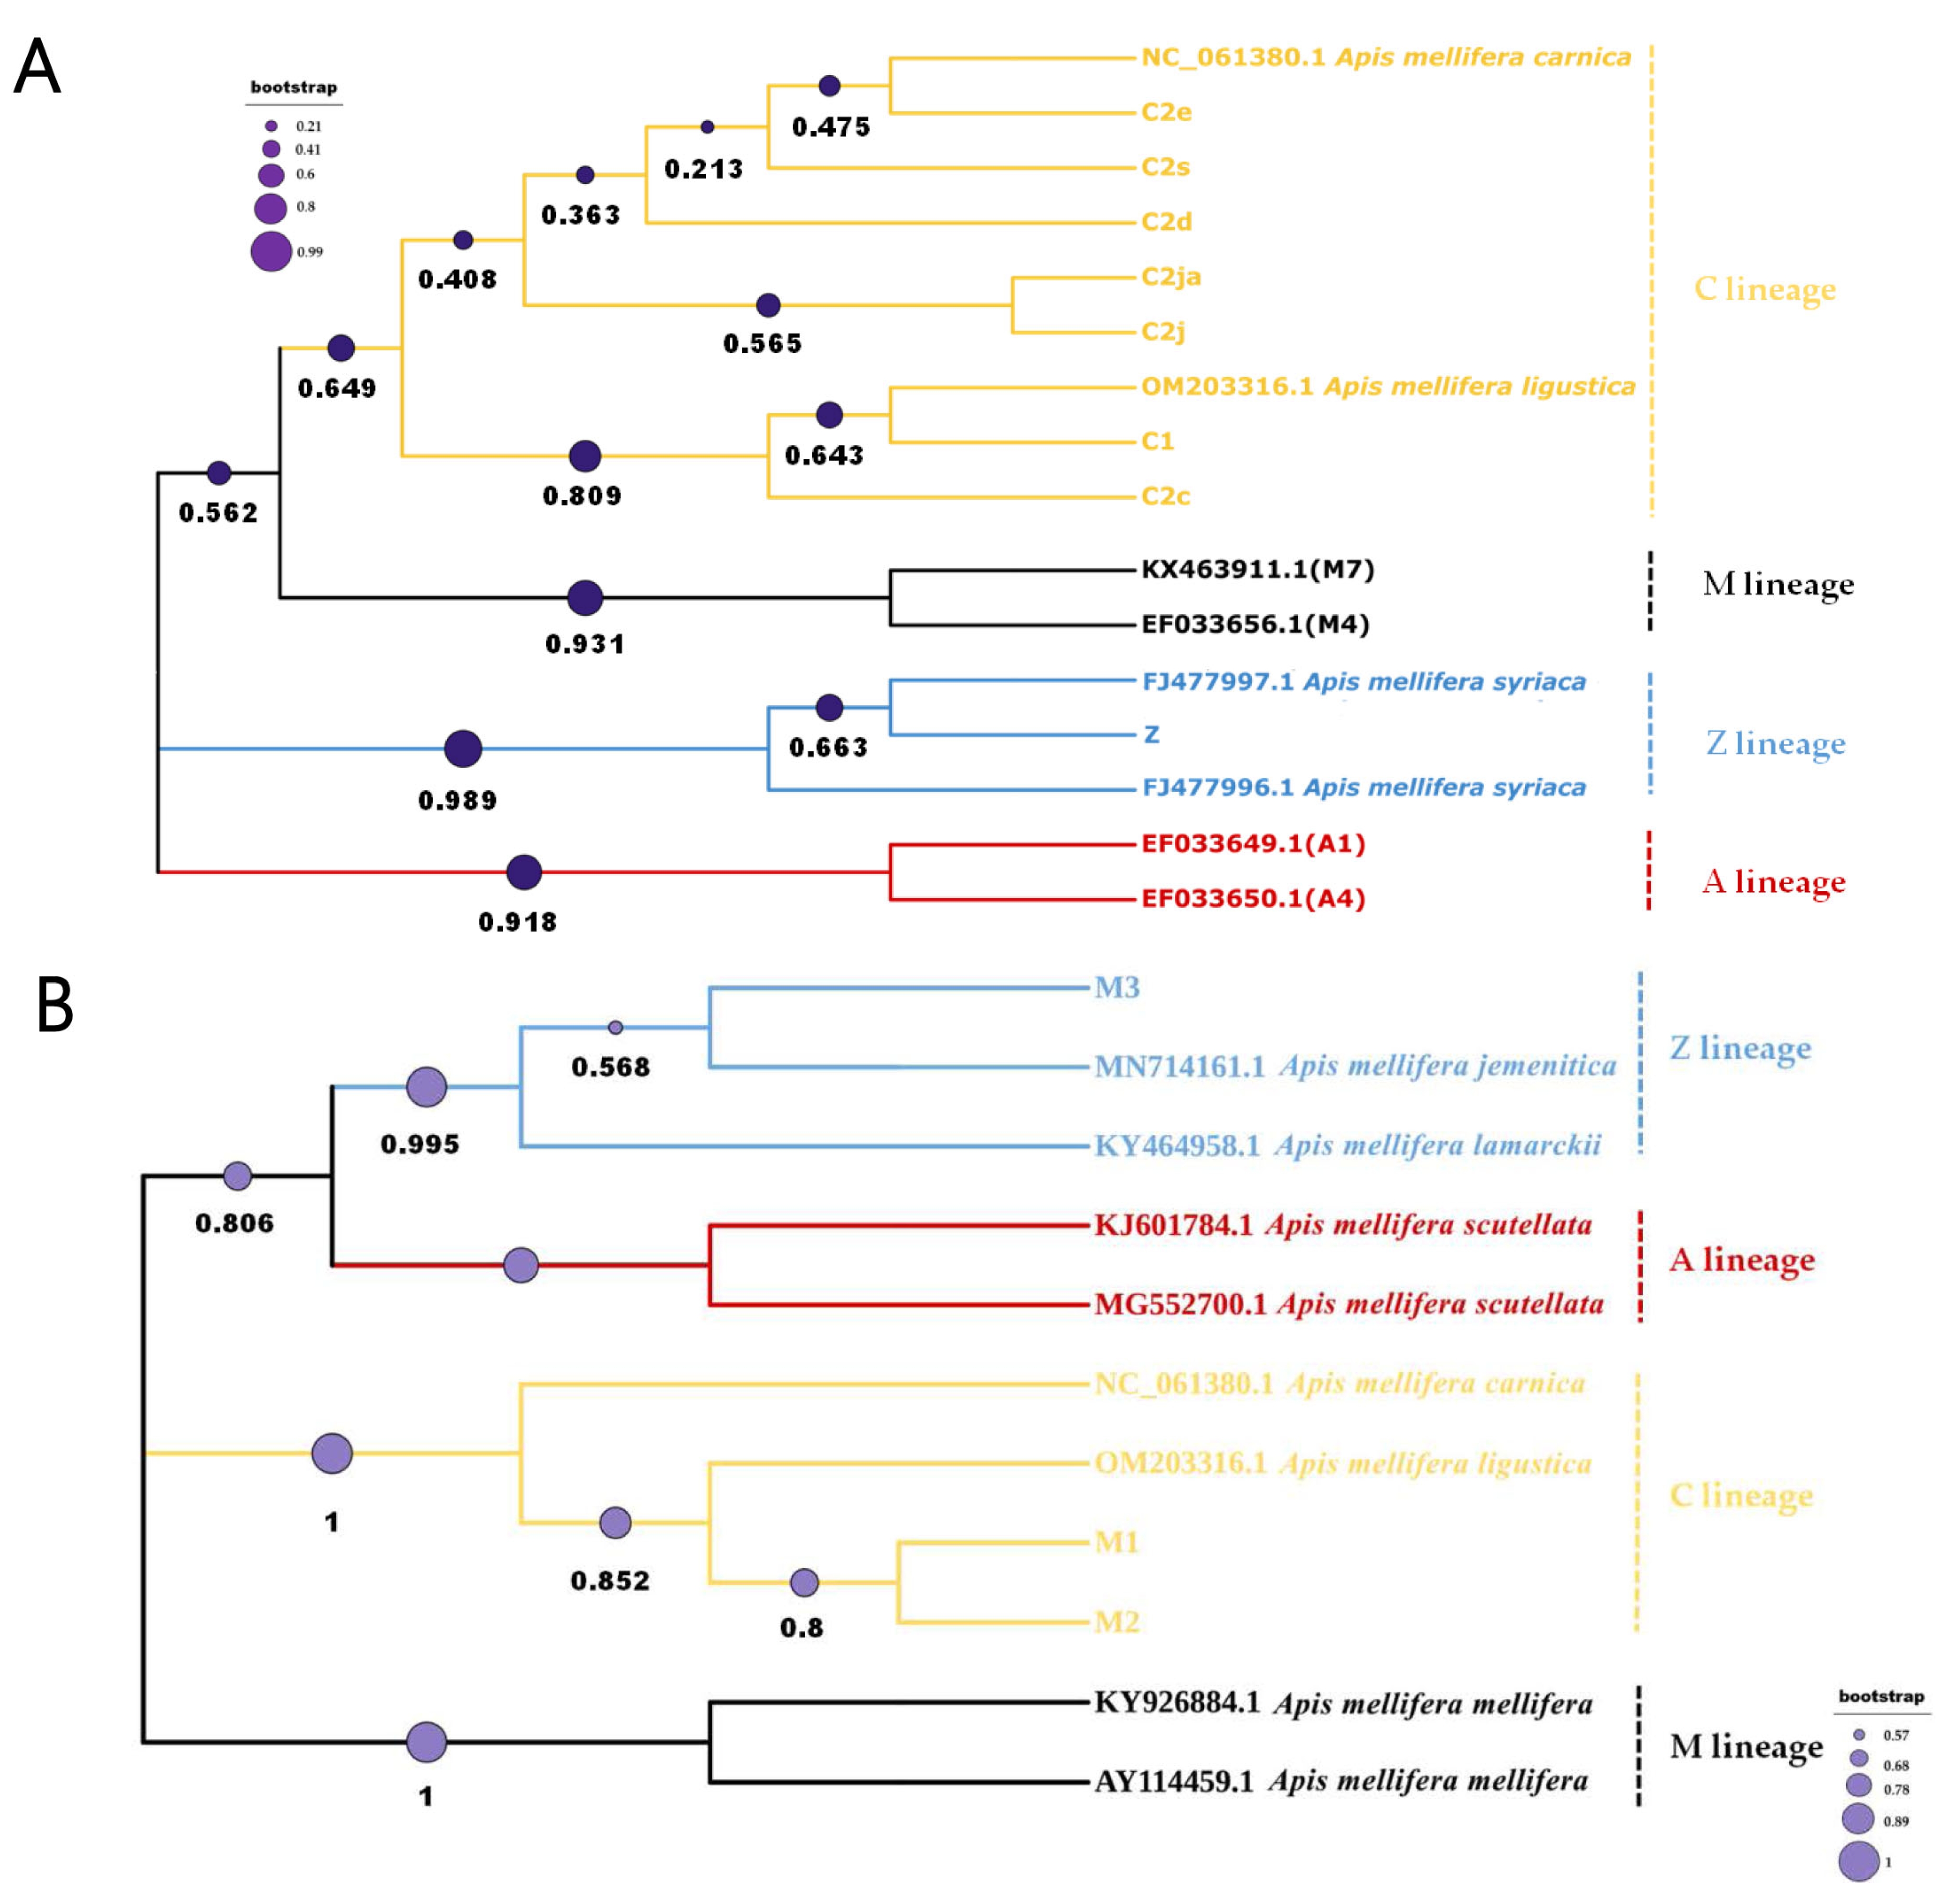
The phylogenetic analysis of the tRNAleu-COII sequences delineated clear lineage differentiation among the identified and reference haplotypes. The phylogenetic tree revealed three major clusters, and the haplotypes identified in this study were clustered within lineages C (N = 7) and Z (N = 1) (Figure 3A). In lineage C, five distinct haplotypes (C2e, C2d, C2s, C2j, and C2ja) clustered closely with the reference sequence of A. m. carnica. Nevertheless, haplotype C2c clustered within the C1 group, showing more genetic proximity with A. m. ligustica than A. m. carnica (Figure 3A). Two A. m. syriaca reference sequences (FJ477996.1 and FJ477997.1), along with our newly designated haplotype Z, formed the Z lineages cluster with high bootstrap values. As a sublineage within the A lineage, our results suggested its expected phylogenetic position. None of our identified haplotypes clustered with A and M lineages, suggesting their absence or low frequency in our sampling populations (Figure 3A).
The phylogenetic analysis based on COI sequences confirmed four distinct lineages with strong bootstrap support. Our samples include the M3 haplotype clustered within the Z lineage and the M1 and M2 haplotypes clustered within the C lineage, but no haplotypes clustering with A or M lineages were detected (Figure 3B). The phylogenetic result of the COI gene is congruent with the result of the tRNAleu-COII sequences (Figure 3).

4. Discussion

To investigate the distribution and haplotype diversity of commercial A. mellifera populations in urban districts of Beijing, here we report the sequences of haplotypes based on tRNAleu-COII and COI gene fragments from 12 sampling sites. Due to the lack of beekeeper registration in China, sampling from managed apiaries is quite difficult [16]. Therefore, we adopted an alternative approach, collecting drones from DCAs within the sampling regions rather than directly from managed apiaries. The drone trapping technique has been proven to be reasonable and feasible [28,36]. According to sequence analysis and morphological characteristics, we confirmed that two male samples from BH site were A. cerana drones. In other regions where A. cerana and A. mellifera occur sympatrically, we have also collected drones of both honeybee species from the same DCAs (unpublished data). This phenomenon indicates that reproductive interference may occur during mating between the two honey bee species.
Our data revealed that these commercial A. mellifera populations of Beijing were divided into two evolutionary lineages (C and Z) with an overwhelming coverage (91.01%) of the C lineage. The remaining samples belonged to the Z lineage (8.99%), while well-known lineages A and M were not detected. After identification of characteristic elements, DraI restriction analysis, BLAST+ 2.17.0 search, and phylogenetic placement, we confirmed the evolutionary lineages and mitochondrial haplotypes in our samples. Among lineage C, a total of seven haplotypes representing C1, C2c, C2d, C2e, C2j, C2ja, and C2s were identified. The C1 haplotype, characterized by A. m. ligustica [37], was most widely distributed in the sampling regions, but no polymorphisms of haplotype C1 were detected in this study (Table S1). The highest frequency and most widely distribution of C2 haplotypes represented the C2s haplotype (Table S1), which was previously detected in Hungary [38]. However, it remains uncertain which subspecies is characterized by the C2s haplotype. As characteristic haplotypes of A. m. carnica, C2d, C2c, and C2e occurred at frequencies of 10.1%, 7.8%, and 6.2%, respectively (Table S1) [37,38]. Some studies defined the haplotype C2j as characteristic of the A. m. carnica subspecies [39], but others had shown that it was also present in A. m. caucasica [37,40]. In our samples, C2j and its variant C2ja only have very low frequencies (2.8% and 0.5%) (Table S1) [23]. Actually, mtDNA-based molecular methods show limited efficiency in subspecies characterization [41,42]. The distribution of C1 and C2 haplotypes in this study is consistent with well-documented records of multiple large-scale historical introductions of A. m. ligustica, A. m. carnica, and A. m. caucasica populations into China [17,18]. Combined with the characteristic elements, DraI restriction and phylogenetic analysis, we assumed that the 837 bp fragment detected in this study belonged to the Z lineage [13,43]. Compared with our Z haplotype, there exists an insertion of nucleotide in the tRNAleu gene of the reference sequence of A. m. syriaca (HM236206.1). The following phylogenetic analyses also validated this result (Figure 3). The majority of populations representing the haplotype Z were distributed across BH and PS sites (Figure 1B). However, there are no historical records of the introduction of honey bee subspecies that possess this particular haplotype. Meanwhile, we analyzed the haplotype diversity of the COI genes and identified three haplotypes (M1-M3). The presence of the M3 haplotype was recently reported in a study published in 2022 [44]. It is noteworthy that the samples categorized as the haplotype M3 correspond precisely to those categorized as the haplotype Z (Tables S1 and S2).
The BH population exhibited a relatively high level of genetic diversity in both tRNAleu-COII and COI genes. In contrast, the MYS population showed no detectable variation in either fragment, indicating the lowest genetic diversity (Table 1). The differences in genetic diversity between the two fragments may be attributed to differences in evolutionary rates, differential selective pressures, and sampling coverage [45]. Our AMOVA analysis suggested that significant genetic differentiation had occurred across 12 sampling sites in the urban districts of Beijing in both mitochondrial genes (Fst > 0.39, p < 0.0001), with approximately 40% of the total genetic variation among populations (Table 2). This pattern probably results from both historical and current importation events, geographical barriers caused by habitat fragmentation, and seasonal migratory beekeeping, in combination with beekeeping management practices such as the exchange of queens [6]. In Beijing, urban habitat fragmentation may restrict gene flow, leading to a loss of genetic diversity in local populations and increasing genetic differentiation. Seasonal migratory beekeeping contributes to the introgression of external genetic material into Beijing. Every year, beekeepers transported the colonies from South China to North China (Beijing’s location), searching for better harvest and crop pollination [16]. Additionally, beekeeping management practices, including queen rearing and queen exchange among beekeepers, further modulate the genetic composition and diversity of these populations by altering local allele frequencies [6].
It has long been believed that A. mellifera is not native to China [18], and various subspecies of A. mellifera have been historically introduced on multiple occasions and subsequently spread across different regions of China [17]. In northern China, the temperature is low and the overwinter period could extend 10 days to a month. While in southern China, it is warm and the brood production of colonies could last all year round. To optimize the value of colonies’ production, different breeding goals may be pursued in different areas by different beekeepers. Accordingly, different A. mellifera subspecies are preferred and various special practices of beekeeping are performed in different apiaries. However, we still lack systematic understanding of the diversity and genetic background of A. mellifera in China. Therefore, it is important to note that environmental variations such as local climatic conditions [4], urban heat island effects [46], and landscape characteristics [47], as well as beekeeping management practices may contribute to the genetic differentiation of A. mellifera populations in China. In the future, environmental variations and human activity factors should be considered when assessing correlations with genetic differentiation among honeybee populations. Meanwhile, it is necessary to monitor temporal haplotype frequencies to make key strategies for the conservation of A. mellifera populations.
Our haplotype network based on the tRNAleu-COII region exhibited a similar relationship pattern to that observed in previous A. mellifera populations of other countries, particularly within the C lineage [38,48,49]. The network diagram revealed two distinctly separated lineages. The C2d haplotype, possessing the most links, suggests its potential ancestral position for other haplotypes that are linked to it. The C2c haplotype clustered with the C1 haplotype because there exists a substitution that is shared in the COII coding regions. A previous study demonstrated that the C2c haplotype shared greater genetic affinity with A. m. ligustica [37]. The haplotype Z is positioned peripherally and is separated by multiple mutations from the predominant C haplotypes, suggesting its distinct origin (Figure 2A). Regarding the haplotype network of the COI gene, the M3 haplotype, identified from the same drone samples as the Z haplotype, reveals clear divergence from the remaining haplotypes. This result aligns with the haplotype network based on tRNAleu-COII (Figure 2). The phylogenetic relationships based on these two gene fragments are congruent with their haplotype network (Figure 2 and Figure 3). Notably, the M3 haplotype for COI, or the Z haplotype for tRNAleu-COII identified in this study, was classified into lineage Z, which was previously determined in 2011 [43]. A previous study has confirmed the presence of haplotype M3 in China with a very low frequency. Consistent with our result, their phylogenetic analysis using mitogenome data also clustered the sample exhibiting haplotype M3 with A. m. syriaca, A. m. lamarckii and A. m. jemenitica [44]. However, our mitochondrial tRNAleu-COII and COI sequence analysis clustered this haplotype within the Z lineage (Figure 3), which aligns with the results presented by Alburaki et al. (2011, 2013) [13,43]. Further investigations are needed to explore the origins and mechanisms of the newly identified haplotypes in China.
In Asia, A. mellifera is susceptible to the various parasitic mites that infest the honeybee species endemic to the region. The survival and development of A. mellifera colonies in Asia are highly dependent on management and A. mellifera rarely establish feral populations [50,51]. In this study, drone samples were collected from DCAs in parks with a very high degree of urbanization. It is reasonable to speculate that the contribution of feral colonies to these mating pools is very small. Without pedigree reconstruction, we do not know how many colonies are represented by these drone samples. Considering that for each DCA, we collected over 100 male bees from thousands of drones present. The probability that the 15 randomly selected drones used for analysis all came from the same colony should be relatively low. It has been suggested that 3.75 km is the appropriate drone flight range for A. mellifera [26]. However, the distances among sample sites in our study are much further than the typical reported drone flight distance. Therefore, our research findings mainly reflect the information of the honeybee colony populations within the drone-flight range of the selected DCAs. In addition, we merely analyzed the genetic diversity of the mitochondrial genome fragments in this study. Future studies increasing the sample size and expanding the analysis methods would offer deeper insights into the genetic structure of A. mellifera populations in Beijing.

5. Conclusions

It is widely known that the genetic diversity of organisms gradually decreases during the domestication process, especially those that are genetically separated from their wild counterparts [52]. A reduction in genetic diversity may lead to the dissemination of undesirable traits, parasites, and diseases [15]. The introduction and spread of non-native honey bee subspecies should be more closely monitored, as this could pose a serious threat to sustainable apiculture [53,54]. In this study, two mitochondrial DNA markers were used to identify haplotypes of drones collected from DCAs in urban areas of Beijing. Our results revealed a mitochondrial haplotype pattern characterized by the predominance of different C haplotypes and the presence of a novel Z haplotype. These findings support the historical introduction events of A. m. ligustica, A. m. carnica, and A. m. caucasica subspecies into China. This study presents the updated knowledge of mitochondrial DNA haplotype distribution in urban areas of Beijing, indicating significant genetic differentiation among A. mellifera populations in this area. These findings offer valuable genetic information and contribute to the conservation and management of regional genetic resources.

Supplementary Materials

The following supporting information can be downloaded at: https://www.mdpi.com/article/10.3390/d18080471/s1, Figure S1: Sequences alignment of different C haplotypes identified in this study. The number of nucleotide are shown above the sequences. The variations between haplotypes are represented by black arrows. Figure S2: Sequences alignment of M1-M3 haplotypes identified in this study. The number of nucleotide are shown above the sequences. The variations between M1 and M2 haplotypes are represented by magenta arrows, and the variations between M1 and M3 haplotypes are represented by dark green arrows. Table S1: Number (n) of drone samples and frequencies (shown in parentheses) of the identified tRNAleu-COII haplotypes. Table S2: Number (n) of drone samples and frequencies (shown in parentheses) of the identified COI haplotypes.

Author Contributions

Conceptualization, J.T. and G.D.; methodology, J.T. and M.W.; validation, G.D., J.T. and M.W.; formal analysis, J.T.; writing—original draft preparation, J.T.; writing—review and editing, J.T. and G.D.; visualization, J.T.; supervision, J.H. and G.D.; funding acquisition, J.H. and G.D. All authors have read and agreed to the published version of the manuscript.

Funding

The work was funded by the National Natural Science Foundation of China (Grant No.32202740), and the Agricultural Science and Technology Innovation Program (CAAS-ASTIP-2026-IAR).

Institutional Review Board Statement

Not applicable.

Data Availability Statement

The newly described haplotype sequences presented in this study have been deposited in GenBank with accession numbers PZ638847-PZ638849, PZ674178-PZ674185.

Acknowledgments

We would like to thank Ruonan Liang, Xinyu Cai, Yuhui Chen, and Youying Yan for their assistance in sample collections. We are also grateful to Chao Chen for his valuable suggestions that improved this manuscript.

Conflicts of Interest

The authors declare no conflicts of interest.

Abbreviations

The following abbreviations are used in this manuscript:
DCADrone Congregation Area
NCBINational Center for Biotechnology Information

References

  1. Khalifa, S.A.M.; Elshafiey, E.H.; Shetaia, A.A.; Abd El-Wahed, A.A.; Algethami, A.F.; Musharraf, S.G.; AlAjmi, M.F.; Zhao, C.; Masry, S.H.D.; Abdel-Daim, M.M.; et al. Overview of Bee Pollination and Its Economic Value for Crop Production. Insects 2021, 12, 688. [Google Scholar] [CrossRef] [PubMed]
  2. Ruttner, F.; Tassencourt, L.; Louveaux, J. Biometrical statistical analysis of the geographic variability of Apis mellifera L. Apidologie 1978, 9, 363–381. [Google Scholar] [CrossRef]
  3. Hall, H.G.; Smith, D.R. Distinguishing African and European honeybee matrilines using amplified mitochondrial DNA. Proc. Natl. Acad. Sci. USA 1991, 88, 4548–4552. [Google Scholar] [CrossRef] [PubMed]
  4. Whitfield, C.W.; Behura, S.K.; Berlocher, S.H.; Clark, A.G.; Johnston, J.S.; Sheppard, W.S.; Smith, D.R.; Suarez, A.V.; Weaver, D.; Tsutsui, N.D. Thrice Out of Africa: Ancient and Recent Expansions of the Honey Bee, Apis mellifera. Science 2006, 314, 642–645. [Google Scholar] [CrossRef] [PubMed]
  5. Ilyasov, R.A.; Lee, M.L.; Takahashi, J.I.; Kwon, H.W.; Nikolenko, A.G. A revision of subspecies structure of western honey bee Apis mellifera. Saudi J. Biol. Sci. 2020, 27, 3615–3621. [Google Scholar] [CrossRef] [PubMed]
  6. Agra, M.N.; Conte, C.A.; Corva, P.M.; Cladera, J.L.; Lanzavecchia, S.B.; Palacio, M.A. Molecular characterization of Apis mellifera colonies from Argentina: Genotypic admixture associated with ecoclimatic regions and apicultural activities. Entomol. Exp. Appl. 2018, 166, 724–738. [Google Scholar] [CrossRef]
  7. De la Rúa, P.; Jaffé, R.; Dall’Olio, R.; Muñoz, I.; Serrano, J. Biodiversity, conservation and current threats to European honeybees. Apidologie 2009, 40, 263–284. [Google Scholar] [CrossRef]
  8. Wallberg, A.; Han, F.; Wellhagen, G.; Dahle, B.; Kawata, M.; Haddad, N.; Simões, Z.L.P.; Allsopp, M.H.; Kandemir, I.; De la Rúa, P.; et al. A worldwide survey of genome sequence variation provides insight into the evolutionary history of the honeybee Apis mellifera. Nat. Genet. 2014, 46, 1081–1088. [Google Scholar] [CrossRef] [PubMed]
  9. Garnery, L.; Cornuet, J.M.; Solignac, M. Evolutionary history of the honey bee Apis mellifera inferred from mitochondrial DNA analysis. Mol. Ecol. 1992, 1, 145–154. [Google Scholar] [CrossRef] [PubMed]
  10. Franck, P.; Garnery, L.; Solignac, M.; Cornuet, J.M. Molecular confirmation of a fourth lineage in honeybees from the Near East. Apidologie 2000, 31, 167–180. [Google Scholar] [CrossRef]
  11. Palmer, M.R.; Smith, D.R.; Kaftanoglu, O. Turkish honeybees: Genetic variation and evidence for a fourth lineage of Apis mellifera mtDNA. J. Hered. 2000, 91, 42–46. [Google Scholar] [CrossRef] [PubMed]
  12. Franck, P.; Garnery, L.; Loiseau, A.; Oldroyd, B.P.; Hepburn, H.R.; Solignac, M.; Cornuet, J.M. Genetic diversity of the honeybee in Africa: Microsatellite and mitochondrial data. Heredity 2001, 86, 420–430. [Google Scholar] [CrossRef] [PubMed]
  13. Alburaki, M.; Bertrand, B.; Legout, H.; Moulin, S.; Alburaki, A.; Sheppard, W.S.; Garnery, L. A fifth major genetic group among honeybees revealed in Syria. BMC Genet. 2013, 14, 117. [Google Scholar] [CrossRef] [PubMed]
  14. Chen, C.; Liu, Z.G.; Pan, Q.; Chen, X.; Wang, H.H.; Guo, H.K.; Liu, S.D.; Lu, H.F.; Tian, S.L.; Li, R.Q.; et al. Genomic Analyses Reveal Demographic History and Temperate Adaptation of the Newly Discovered Honey Bee Subspecies Apis mellifera sinisxinyuan n. ssp. Mol. Biol. Evol. 2016, 33, 1337–1348. [Google Scholar] [CrossRef] [PubMed]
  15. Rattanawannee, A.; Duangphakdee, O.; Chanchao, C.; Teerapakpinyo, C.; Warrit, N.; Wongsiri, S.; Oldroyd, B.P. Genetic Characterization of Exotic Commercial Honey Bee (Hymenoptera: Apidae) Populations in Thailand Reveals High Genetic Diversity and Low Population Substructure. J. Econ. Entomol. 2020, 113, 34–42. [Google Scholar] [CrossRef] [PubMed]
  16. Tang, J.; Ji, C.C.; Shi, W.; Su, S.K.; Xue, Y.B.; Xu, J.S.; Chen, X.; Zhao, Y.Z.; Chen, C. Survey Results of Honey Bee Colony Losses in Winter in China (2009–2021). Insects 2023, 14, 554. [Google Scholar] [CrossRef] [PubMed]
  17. The National Animal Genetic Resources Committee. Animal Genetic Resources in China Bees; China Agriculture Press: Beijing, China, 2011; pp. 8–9.
  18. Cao, L.-F.; Zheng, H.-Q.; Pirk, C.W.W.; Hu, F.-L.; Xu, Z.-W. High Royal Jelly-Producing Honeybees (Apis mellifera ligustica) (Hymenoptera: Apidae) in China. J. Econ. Entomol. 2016, 109, 510–514. [Google Scholar] [CrossRef] [PubMed]
  19. Moritz, R.F.A.; Hawkins, C.F.; Crozier, R.H.; Mackinley, A.G. A mitochondrial DNA polymorphism in honeybees (Apis mellifera L.). Experientia 1986, 42, 322–324. [Google Scholar] [CrossRef]
  20. Arias, M.C.; Sheppard, W.S. Molecular Phylogenetics of Honey Bee Subspecies (Apis mellifera L.) Inferred from Mitochondrial DNA Sequence. Mol. Phylogenetics Evol. 1996, 5, 557–566. [Google Scholar] [CrossRef] [PubMed]
  21. Magnus, R.M.; Tripodi, A.D.; Szalanski, A.L. Mitochondrial DNA Diversity of Honey Bees (Apis mellifera) from Unmanaged Colonies and Swarms in the United States. Biochem. Genet. 2014, 52, 245–257. [Google Scholar] [CrossRef] [PubMed]
  22. Kandemir, I.; Kence, M.; Sheppard, W.S.; Kence, A. Mitochondrial DNA variation in honey bee (Apis mellifera L.) populations from Turkey. J. Apic. Res. 2006, 45, 33–38. [Google Scholar] [CrossRef]
  23. Oleksa, A.; Kusza, S.; Tofilski, A. Mitochondrial DNA Suggests the Introduction of Honeybees of African Ancestry to East-Central Europe. Insects 2021, 12, 410. [Google Scholar] [CrossRef] [PubMed]
  24. Zmarlicki, C.; Morse, R.A. Drone Congregation Areas. J. Apic. Res. 1963, 2, 64–66. [Google Scholar] [CrossRef]
  25. Ruttner, F. The Life and Flight Activity of Drones. Bee World 1966, 47, 93–100. [Google Scholar] [CrossRef]
  26. Utaipanon, P.; Holmes, M.J.; Chapman, N.C.; Oldroyd, B.P. Estimating the density of honey bee (Apis mellifera) colonies using trapped drones: Area sampled and drone mating flight distance. Apidologie 2019, 50, 578–592. [Google Scholar] [CrossRef]
  27. Utaipanon, P.; Schaerf, T.M.; Chapman, N.C.; Holmes, M.J.; Oldroyd, B.P. Using trapped drones to assess the density of honey bee colonies: A simulation and empirical study to evaluate the accuracy of the method. Ecol. Entomol. 2021, 46, 128–137. [Google Scholar] [CrossRef]
  28. Bertrand, B.; Alburaki, M.; Legout, H.; Moulin, S.; Mougel, F.; Garnery, L. MtDNA COI-COII marker and drone congregation area: An efficient method to establish and monitor honeybee (Apis mellifera L.) conservation centres. Mol. Ecol. Resour. 2015, 15, 673–683. [Google Scholar] [CrossRef] [PubMed]
  29. Rizwan, M.; Li, Z.; Nie, H.; Qasim, M.; Raza, M.F.; Hassanyar, A.K.; Tayyab, M.; Su, S. High Mitochondrial Diversity of Under Apis mellifera COI Gene From China and Pakistan. Appl. Ecol. Environ. Res. 2018, 16, 2933–2945. [Google Scholar] [CrossRef]
  30. Williams, J.L. Wind-directed Pheromone Trap for Drone Honey Bees (Hymenoptera: Apidae). J. Econ. Entomol. 1987, 80, 532–536. [Google Scholar] [CrossRef]
  31. Utzeri, V.J.; Ribani, A.; Taurisano, V.; Banque, C.H.I.; Fontanesi, L. Distribution of the Main Apis mellifera Mitochondrial DNA Lineages in Italy Assessed Using an Environmental DNA Approach. Insects 2021, 12, 620. [Google Scholar] [CrossRef] [PubMed]
  32. Rortais, A.; Arnold, G.; Alburaki, M.; Legout, H.; Garnery, L. Review of the DraI COI-COII test for the conservation of the black honeybee (Apis mellifera mellifera). Conserv. Genet. Resour. 2011, 3, 383–391. [Google Scholar] [CrossRef]
  33. Librado, P.; Rozas, J. DnaSP v5: A software for comprehensive analysis of DNA polymorphism data. Bioinformatics 2009, 25, 1451–1452. [Google Scholar] [CrossRef] [PubMed]
  34. Excoffier, L.; Lischer, H.E.L. Arlequin suite ver 3.5: A new series of programs to perform population genetics analyses under Linux and Windows. Mol. Ecol. Resour. 2010, 10, 564–567. [Google Scholar] [CrossRef] [PubMed]
  35. Kumar, S.; Stecher, G.; Suleski, M.; Sanderford, M.; Sharma, S.; Tamura, K. MEGA12: Molecular Evolutionary Genetic Analysis Version 12 for Adaptive and Green Computing. Mol. Biol. Evol. 2024, 41, msae263. [Google Scholar] [CrossRef] [PubMed]
  36. Koeniger, N.; Koeniger, G.; Pechhacker, H. The nearer the better? Drones (Apis mellifera) prefer nearer drone congregation areas. Insectes Sociaux 2005, 52, 31–35. [Google Scholar] [CrossRef]
  37. Alburaki, M.; Madella, S.; Lopez, J.; Bouga, M.; Chen, Y.P.; vanEngelsdorp, D. Honey bee populations of the USA display restrictions in their mtDNA haplotype diversity. Front. Genet. 2023, 13, 1092121. [Google Scholar] [CrossRef] [PubMed]
  38. Tanaskovic, M.; Eric, P.; Patenkovic, A.; Eric, K.; Mihajlovic, M.; Tanasic, V.; Stanisavljevic, L.; Davidovic, S. MtDNA Analysis Indicates Human-Induced Temporal Changes of Serbian Honey Bees Diversity. Insects 2021, 12, 767. [Google Scholar] [CrossRef] [PubMed]
  39. Porrini, L.P.; Quintana, S.; Brasesco, C.; Maggi, M.D.; Porrini, M.P.; Garrido, M.P.; Fernández Iriarte, P.J.; Eguaras, M.J. Current genetic diversity of managed and commercially produced Apis mellifera colonies in Argentina inferred by wing geometric morphometrics and COI-COII mtDNA locus. Apidologie 2022, 53, 61. [Google Scholar] [CrossRef]
  40. Kaskinova, M.D.; Gaifullina, L.R.; Saltykova, E.S. Haplotypes of the tRNAleu-COII mtDNA Region in Russian Apis mellifera Populations. Animals 2023, 13, 2394. [Google Scholar] [CrossRef] [PubMed]
  41. Meixner, M.D.; Pinto, M.A.; Bouga, M.; Kryger, P.; Ivanova, E.; Fuchs, S. Standard methods for characterising subspecies and ecotypes of Apis mellifera. J. Apic. Res. 2013, 52, 1–28. [Google Scholar] [CrossRef]
  42. Oleksa, A.; Tofilski, A. Wing geometric morphometrics and microsatellite analysis provide similar discrimination of honey bee subspecies. Apidologie 2015, 46, 49–60. [Google Scholar] [CrossRef]
  43. Alburaki, M.; Moulin, S.; Legout, H.; Albrauki, A.; Garnery, L. Mitochondrial structure of Eastern honeybee populations from Syria, Lebanon and Iraq. Apidologie 2011, 42, 628–641. [Google Scholar] [CrossRef]
  44. Ma, C.; Hu, R.Y.; Costa, C.; Li, J.K. Genetic Drift and Purifying Selection Shaped Mitochondrial Genome Variation in the High Royal Jelly-Producing Honeybee Strain (Apis mellifera ligustica). Front. Genet. 2022, 13, 835967. [Google Scholar] [CrossRef] [PubMed]
  45. Hoelzer, G.A. Inferring Phylogenies From mtDNA Variation: Mitochondrial-Gene Trees Versus Nuclear-Gene Trees Revisited. Evolution 1997, 51, 622–626. [Google Scholar] [CrossRef] [PubMed]
  46. Hamblin, A.L.; Youngsteadt, E.; López-Uribe, M.M.; Frank, S.D. Physiological thermal limits predict differential responses of bees to urban heat-island effects. Biol. Lett. 2017, 13, 20170125. [Google Scholar] [CrossRef] [PubMed]
  47. Jha, S.; Kremen, C. Urban land use limits regional bumble bee gene flow. Mol. Ecol. 2013, 22, 2483–2495. [Google Scholar] [CrossRef] [PubMed]
  48. Coroian, C.O.; Muñoz, I.; Schlüns, E.A.; Paniti-Teleky, O.R.; Erler, S.; Furdui, E.M.; Marghitas, L.A.; Dezmirean, D.S.; Schlüns, H.; De La Rúa, P.; et al. Climate rather than geography separates two European honeybee subspecies. Mol. Ecol. 2014, 23, 2353–2361. [Google Scholar] [CrossRef] [PubMed]
  49. Muñoz, I.; De la Rúa, P. Wide genetic diversity in Old World honey bees threaten by introgression. Apidologie 2021, 52, 200–217. [Google Scholar] [CrossRef]
  50. Oldroyd, B.P.; Nanork, P. Conservation of Asian honey bees. Apidologie 2009, 40, 296–312. [Google Scholar] [CrossRef]
  51. Oldroyd, B.P.; Wongsiri, S. Asian Honey Bees: Biology, Conservation, and Human Interactions; Harvard University Press: Cambridge, MA, USA, 2006. [Google Scholar]
  52. Bruford, M.W.; Bradley, D.G.; Luikart, G. DNA markers reveal the complexity of livestock domestication. Nat. Rev. Genet. 2003, 4, 900–910. [Google Scholar] [CrossRef] [PubMed]
  53. Tanaskovic, M.; Eric, P.; Patenkovic, A.; Eric, K.; Mihajlovic, M.; Tanasic, V.; Kusza, S.; Oleksa, A.; Stanisavljevic, L.; Davidovic, S. Further Evidence of Population Admixture in the Serbian Honey Bee Population. Insects 2022, 13, 180. [Google Scholar] [CrossRef] [PubMed]
  54. Nedic, N.; Francis, R.M.; Stanisavljevic, L.; Pihler, I.; Kezic, N.; Bendixen, C.; Kryger, P. Detecting population admixture in honey bees of Serbia. J. Apic. Res. 2014, 53, 303–313. [Google Scholar] [CrossRef]
Figure 1. Schematic diagram of mitochondrial tRNAleu-COII region in Apis mellifera and haplotype distribution in urban districts of Beijing. (A). Schematic diagram of tRNAleu-COII region of the 8 haplotypes identified in this study with results of the in silico Dra I restriction digestion. Red scissors represent restriction sites and the restriction fragment sizes are shown in bp on the upper right panel. (B). Frequency and distribution of the haplotypes identified in the tRNAleu-COII region. (C). Frequency and distribution of the haplotypes identified in COI sequence.
Diversity 18 00471 g001
Figure 2. Haplotype network of mitochondrial DNA identified in Apis mellifera drones in this study. The circle size is proportional to the number of individuals with that haplotype. Small black line on link connecting the haplotypes indicates one mutational difference. The small gray circle represents hypothetical haplotypes. (A). Median-joining network of the haplotypes based on the tRNAleu-COII sequences. (B). Median-joining network of the haplotype based on the COI sequences.
Diversity 18 00471 g002
Figure 3. Phylogenetic relationships of the tRNAleu-COII and COI haplotypes by the neighbor-joining method. Bootstrap values are shown at nodes and the reference haplotypes from NCBI are identified with the accession number or subspecies. (A). Phylogenetic tree of the tRNAleu-COII haplotypes. (B). Phylogenetic tree of the COI haplotypes.
Diversity 18 00471 g003
Table 1. Genetic diversity of tRNAleu-COII and COI sequence of the Apis mellifera populations in urban district of Beijing.
Location
Code
NtRNAleu-COIINCOI
N0SkhdPiN0SkhdPi
PS153104.3430.5620.00777132158.0770.5380.00855
BH134104.8460.7440.00867132158.0770.5380.00855
HD15441.5430.6760.00276151000.0000.00000
MYS15100.0000.0000.00000151000.0000.00000
BT154101.6570.3710.00296153162.3430.4480.00248
BGZ15330.6290.2570.0011215210.3430.3430.00036
YBS15220.4950.2480.00089151000.0000.00000
WBS15451.0860.3710.00194151000.0000.00000
YLC15330.9330.3620.0016715210.1330.1330.00014
DB15331.3520.5900.00242151000.0000.00000
JTN15331.0290.6290.00184151000.0000.00000
TH15441.2300.5520.00157151000.0000.00000
Total1786112.4370.6290.004371763162.3750.2990.00251
Table 2. Genetic differentiation of the samples.
GenesAmong PopulationsWithin PopulationsFst
Sum of SquaresVariance ComponentsPercentage of
Variation
Sum of SquaresVariance ComponentsPercentage
of Variation
tRNAleu-COII88.9970.4940539.30126.6770.7631160.700.39299
(p < 0.0001)
COI91.1840.5168242.08116.6560.7113257.920.42081
(p < 0.0001)
Fst, Fixation Index, p, statistical significance.
Disclaimer/Publisher’s Note: The statements, opinions and data contained in all publications are solely those of the individual author(s) and contributor(s) and not of MDPI and/or the editor(s). MDPI and/or the editor(s) disclaim responsibility for any injury to people or property resulting from any ideas, methods, instructions or products referred to in the content.