Article

From Epibiosis to Parasitism? Host Associations and Overgrowth Dynamics of Alcyonium coralloides on Mediterranean Gorgonians


by
Martina Canessa
1,*,
Marzia Bo
1,2,3,
Francesco Enrichetti
1,2,3,
Margherita Toma
1,4,
Egidio Trainito
5 and
Giorgio Bavestrello
1,2,3
1
Department of Earth, Environmental and Life Science (DISTAV), University of Genova, Corso Europa, 26, 16132 Genova, Italy
2
National Biodiversity Future Center (NBFC), Piazza Marina, 61, 90133 Palermo, Italy
3
Consorzio Nazionale Interuniversitario per le Scienze del Mare (CoNISMA), Piazzale Flaminio, 9, 00196 Roma, Italy
4
Institute for Environmental Protection and Research (ISPRA), Via Vitaliano Brancati, 48, 00144 Roma, Italy
5
Genoa Marine Centre-Stazione Zoologica Anton Dohrn Istituto Nazionale di Biologia, Ecologia e Biotecnologie Marine, Villa del Principe, Piazza del Principe, 4, 16126 Genoa, Italy
*
Author to whom correspondence should be addressed.
Diversity 2026, 18(8), 473; https://doi.org/10.3390/d18080473
Submission received: 15 July 2026 / Revised: 1 August 2026 / Accepted: 3 August 2026 / Published: 5 August 2026
(This article belongs to the Special Issue Epibiotic Interactions in Marine Organisms)

Abstract

Alcyonium coralloides has traditionally been classified as an opportunistic epibiont of exposed gorgonian skeletons. However, the ecological nature of its interaction remains poorly understood. Using Marine Strategy Framework Directive (MSFD) monitoring data (2015–2025) across 310 ROV transects (30–100 m depth) along the Ligurian coast (NW Mediterranean Sea) and long-term photographic series of infested colonies from the Tavolara–Punta Coda Cavallo MPA (Sardinia, NW Mediterranean Sea), we investigated its distribution and host associations in the NW Mediterranean. A. coralloides occurred in ~50% of the surveyed gorgonian forests, significantly increasing with host density. Infestation rates were markedly higher on Eunicella cavolini (10.1 ± 4.2%) than on Paramuricea clavata, E. verrucosa, and Leptogorgia sarmentosa (1.5–1.9%). While host necrosis facilitates initial settlement, time-series data revealed rapid overgrowth rates (30–55 cm yr−1) along host branches. Direct contact zones between the coenenchimes of the epibiont and that of the host exhibited portions of denuded host skeletons, hypertrophic tissue borders, and reduced host polyp expansion adjacent to the advancing parasitic margin. These results indicate that the ecological interaction extends beyond simple opportunistic epibiosis. We propose that A. coralloides represents an intermediate stage along a continuum between epibiosis and active spatial competition, shaping community dynamics within Mediterranean animal forests.

1. Introduction

Alcyonium coralloides (Pallas, 1766) is a colonial octocoral of the family Alcyoniidae (order Malacalcyonacea) and one of the most distinctive soft corals associated with Mediterranean coralligenous assemblages [1,2]. The species is widely distributed throughout the Mediterranean Sea and extends into the northeastern Atlantic Ocean, from the Iberian Peninsula to the British Isles, although Atlantic populations are more fragmented and ecologically differentiated than their Mediterranean counterparts [3,4]. Originally described as Gorgonia coralloides by Pallas [5] and later assigned to the genus Parerythropodium Kükenthal, 1916, subsequent morphological and molecular studies confirmed its placement within the genus Alcyonium Linnaeus, 1758 [6,7]. The taxonomic history of the species was described in detail by Groot and Weimberg [4].
The ecology of A. coralloides is closely associated with hard-bottom habitats and circalittoral communities characterized by low light levels, moderate to strong hydrodynamisms, and the dominance of suspension-feeding organisms [8]. Throughout the Mediterranean Sea, the species typically develops as an acrophilic epibiont on several gorgonian species, including Paramuricea clavata (Risso, 1826), Eunicella cavolini Koch, 1887, E. singularis Esper, 1791, E. verrucosa (Pallas, 1766) and Leptogorgia sarmentosa (Esper, 1791) [3,9,10]. Colonies frequently overgrow exposed gorgonian axes following tissue necrosis, although progressive replacement of living host tissues has also been documented, suggesting complex interactions that may range from opportunistic epibiosis to competition for space and resources [1,11]. By exploiting elevated biogenic substrates, A. coralloides benefits from enhanced water flow and increased access to suspended food particles, potentially improving feeding efficiency in oligotrophic Mediterranean environments [12].
The intimate association between A. coralloides and gorgonians has been recognized since the earliest natural history accounts. Pallas [5], citing observations by Boccone (1671), reported the species growing on the “wood” of marine shrubs, likely referring to the horny axes of gorgonians. Although these early authors misinterpreted the organism as a developmental stage of red coral, their observations represent the first description of the ecology of the species.
The species exhibits remarkable morphological plasticity across its distribution range. Mediterranean colonies are generally encrusting and display bright white, red, pink, orange, or yellow pigmentation, whereas Atlantic populations often develop lobate or digitiform forms directly attached to rocky substrates [4,13,14].
Reproductive traits also show geographic variability. Mediterranean populations are gonochoric and display a seasonal reproductive cycle, whereas Atlantic colonies appear to rely predominantly on brooding and possibly parthenogenetic reproduction, resulting in reduced dispersal potential and more fragmented distributions [4,13,15]. These differences may contribute to the contrasting biogeographic patterns observed across the species range.
The close dependence of this species on gorgonian forests links its fate to the conservation status of these habitat-forming organisms, which are increasingly threatened by fishing activities, sedimentation, marine heatwaves, and climate-driven Mass Mortality Events (MMEs) affecting Mediterranean octocoral communities [16,17].
Despite its conspicuous appearance and widespread occurrence, information on the large-scale distribution of A. coralloides remains surprisingly scarce, and the factors controlling its spatial variability are still poorly understood. In particular, it remains unclear whether regional distribution patterns in the Mediterranean basin are primarily driven by environmental gradients or by the availability and composition of gorgonian host assemblages.
In this study, we analysed data collected within the framework of the Marine Strategy Framework Directive (MSFD; 2008/56/EC) monitoring program to investigate the distribution of A. coralloides along the entire Ligurian coast (north-western Mediterranean Sea). Using this extensive dataset obtained from Remotely Operated Vehicle (ROV) surveys, we aimed to: (i) describe the spatial distribution of the species on a regional scale; (ii) assess its putative preference for different gorgonian hosts; (iii) determine whether host-specific associations may represent one of the main factors driving its regional distribution; and (iv) provide a first estimate of the rate of colony expansion and host colonization by comparing images of affected gorgonian colonies acquired at different time intervals from two Sardinian sites. In fact, to our knowledge, quantitative information on the colonization dynamics of A. coralloides is currently lacking.

2. Materials and Methods

2.1. Study Area

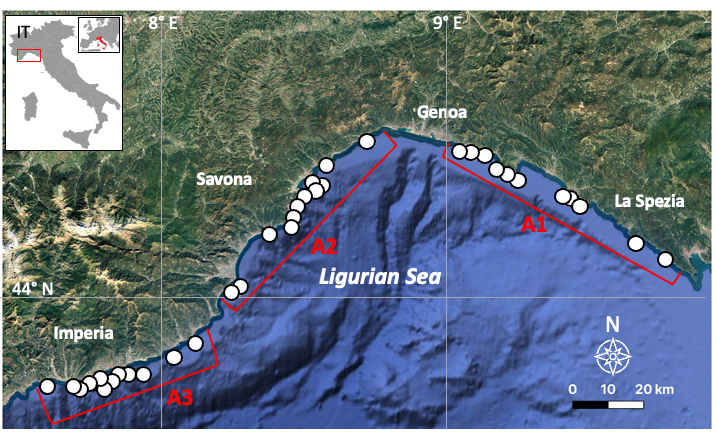
Located in the NW Mediterranean, the Ligurian coast covers over 350 km between La Spezia and Ventimiglia (Figure 1). The coast forms a large southern-facing arc, exposing different sectors to prevailing winds: southwest in the eastern province of La Spezia and eastern Genoa, south along the central Genoa–Savona stretch, and southeast around Imperia in the west. Similarly, the continental shelf tapers from east to west, moving from a wide, low-gradient zone to a narrow shelf heavily incised by submarine canyons [18]. Water circulation along the shore moves predominantly westward, driven by the main cyclonic flow of the Ligurian basin. Frequent upwelling and mesoscale anticyclonic eddies characterize this dynamic system, enhancing nutrient enrichment within the euphotic layer [19].

2.2. ROV Video Analysis and Distribution Assessment

Field surveys were carried out within the European Marine Strategy Framework Directive monitoring program (MSFD, 2008/56/EC) conducted between 2015 and 2025 (Supplementary Material). The sampling design targeted mesophotic megabenthic assemblages distributed along the entire Ligurian coastal arc (NW Mediterranean) on coralligenous and rocky reefs. This study followed a well-established methodology previously applied in the same geographic sub-region to assess key macrozoobenthic species [20,21,22,23,24]. The study region was divided into three broad macro-areas (A1, A2, and A3), corresponding to its eastern, central, and western sectors, respectively. Within each macro-area, four areas were assessed through repeated ROV video transects—totaling 310 surveys conducted between 2015 and 2025 across a depth range of 20 to 100 m (Supplementary Materials). In line with the Marine Strategy Framework Directive protocol for monitoring coralligenous habitats (Module 7; [25]), each transect measured roughly 200 m in length, covering approximately 100 m2 of the seabed. Comprehensive technical details regarding ROV instrumentation, transect design, and video processing methods are described by Enrichetti et al. [20]. Because replicate surveys were executed in different years, each individual transect was treated as an independent statistical sampling unit.
In each transect, all the gorgonian colonies completely framed by the camera were counted, and their density was calculated, referring only to the percentage of hard bottom seafloor present in the transect, thus excluding soft bottom areas unsuitable for the settling. The percentage of colonies affected by (i) epibiontic organisms (such as sponges, anthozoans, bryozoans, annelids), (ii) necrosis (branches deprived of coenenchyme and showing the barren proteinaceous skeleton) and (iii) entanglement in fishing gear was used to estimate the health status of the populations considering 100 specimens. In transects with less than 100 gorgonians per species, all the colonies were considered (Table 1).
All colonies of A. coralloides observed in the video transects and the specific identity of every infested host colony were annotated. The abundance data were expressed as the number of specimens per 100 m2. The infestation rate of A. coralloides (percent of infested colonies of each host species) was calculated retaining only transects where at least 100 colonies per each gorgonian species were present (n = 126). To evaluate host selectivity while controlling for relative host availability, Vanderploeg and Scavia’s Relativized Electivity Index ( E ) was calculated for each gorgonian species [26]. First, the species-specific selectivity coefficient ( W i ) was computed as
W i = r i / p i j = 1 m r j / p j
where r i is the proportion of infested colonies belonging to species i , p i is the proportion of species i available in the environment, and m is the total number of host species ( m = 4 ).
Subsequently, the Relativized Electivity Index ( E i ) was derived as
E i = W i 1 / m W i + 1 / m
The index ranges from 1 (complete avoidance/low susceptibility) to + 1 (maximum preference), with 0 indicating random/opportunistic infestation directly proportional to host availability.

2.3. Statistical Analyses

Variations in Alcyonium coralloides abundance, gorgonian forest structures and their health status (i.e., percentages of epibiosis, necrosis, and entanglement) were investigated using a multivariate distance-based statistical approach. To stabilize variance and balance the contribution of rare versus highly abundant variables, the primary biological matrix was square-root transformed. A resemblance matrix was subsequently calculated using the Bray–Curtis similarity coefficient.
Principal Coordinates Analysis (PCO) was performed considering all the transects where A. coralloides was found and vector of each species variables (abundances, epibiosis, necrosis, and entanglement) based on Pearson correlation coefficients were plotted to visually identify the underlying descriptive gradients.
To identify which specific variables drove the multivariate differences observed, a Distance-based Linear Model (DistLM) was applied; the model was initially evaluated using Marginal Tests to assess the explanatory power of each variable individually. Subsequently, a Step-wise selection procedure was performed, utilizing the Akaike Information Criterion (AIC) to identify the optimal, most parsimonious combination of variables explaining the greatest proportion of cumulative variance. The results of the optimal model were visualized graphically using a distance-based Redundancy Analysis (dbRDA) ordination plot. All statistical analyses were conducted using PRIMER-e version 7.0 with the PERMANOVA+ add-on, with the significance threshold set at alpha = 0.05) [27,28].

2.4. Overgrowth and Growth Patterns

The morphology and the temporal dynamics of Alcyonium coralloides overgrowth were investigated using an underwater photographic archive of one of us (ET), targeting gorgonian colonies (Eunicella cavolini and E. verrucosa) affected by the epibiosis of the alcyonacean coming from two dive sites at the Tavolara—Punta Coda Cavallo Marine Protected Area (TPCCMPA) in Northeastern Sardinia (Tyrrhenian Sea) characterized by a coralligenous assemblages between 35 and 55 m depth. Photographs were taken using the same perspective and a ruler as a size reference. A Sony A6000 camera (manufacturer, city, country) (24 megapixels, two Inon S2000 strobes, colour temperature 5000 K) with Sony 16–50 lens (focal length 19 mm), Nauticam WW1 wet wide lens (130° rectilinear field angle), and a Sea & Sea MDXA6000 underwater case with a flat porthole was used.
The dynamics of A. coralloides growth were estimated over time by calculating the positive variation in the epibionted fan surface in photos of the same specimen with available metric references and suitable perspectives taken at different time intervals. Considering that the fan shape of the gorgonian hosts is roughly planar, the fan surface was calculated on the projected area of the branches following the contour of the colony as precisely as possible. Image analysis was performed using the graphic software ImageJ (1.53t Version) [29]. Close-ups were used to document contact zones between A. coralloides and living host tissues.

3. Results

3.1. Host Specificity and Distribution

In the Ligurian Sea, Alcyonium coralloides was widely distributed wherever gorgonian forests occurred. Of the 310 transects surveyed, 250 (69 in the eastern sector, 100 in the central sector and 81 in the western sector) contained at least one species among Eunicella cavolini, E. singularis, E. verrucosa, L. sarmentosa and P. clavata. A. coralloides was recorded in half of these transects (126), corresponding to 43 transects in the eastern sector, 71 in the central sector and 12 in the western sector (Table 1).
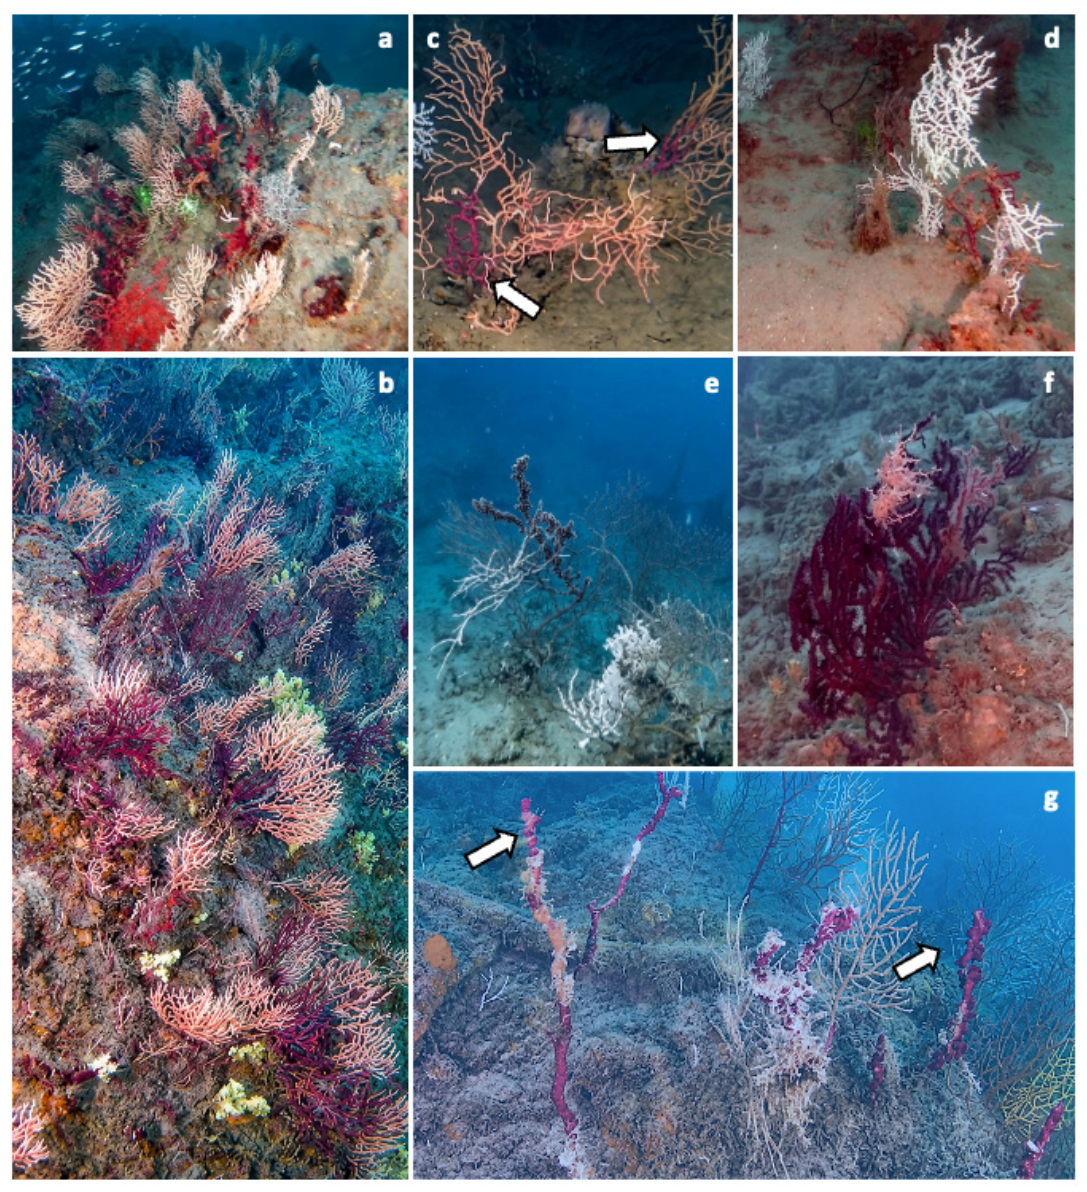
Colonization was often extensive, particularly in forests dominated by E. cavolini, where the epibiont developed on both apparently healthy and partially necrotic colonies (Figure 2a,b). Colonies of A. coralloides originated either from the basal portion of the host or from central and apical branches (Figure 2c). A similar pattern was observed on E. verrucosa (Figure 2d,e). In P. clavata, the epibiont was also recorded on healthy colonies (Figure 2f) but occurred more frequently on severely affected or dead ones (Figure 2g).
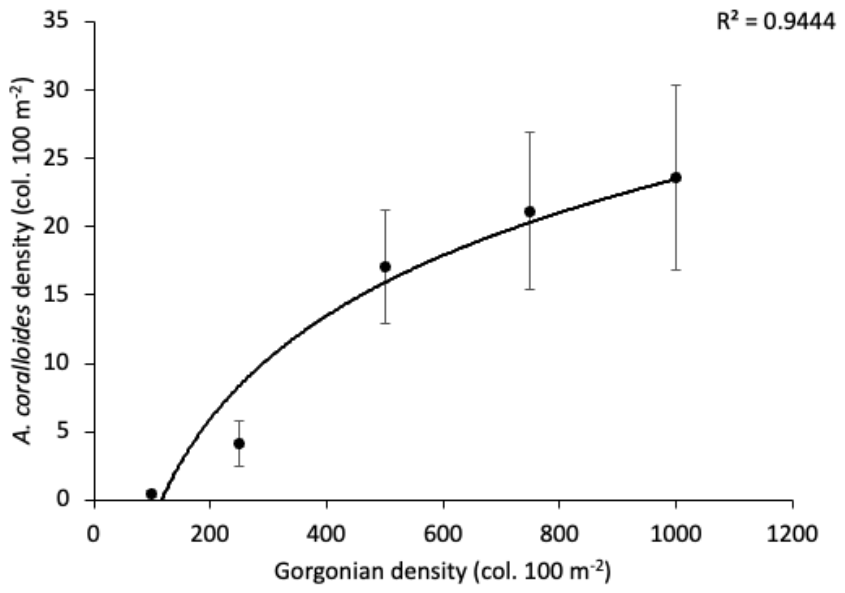
Virtually, no colonies were recorded in gorgonian forests composed of either a single or multiple host species when host density was below 100 colonies per 100 m2. The frequency of occurrence increased with host density, although the rate progressively slowed in forests with higher densities (Figure 3).
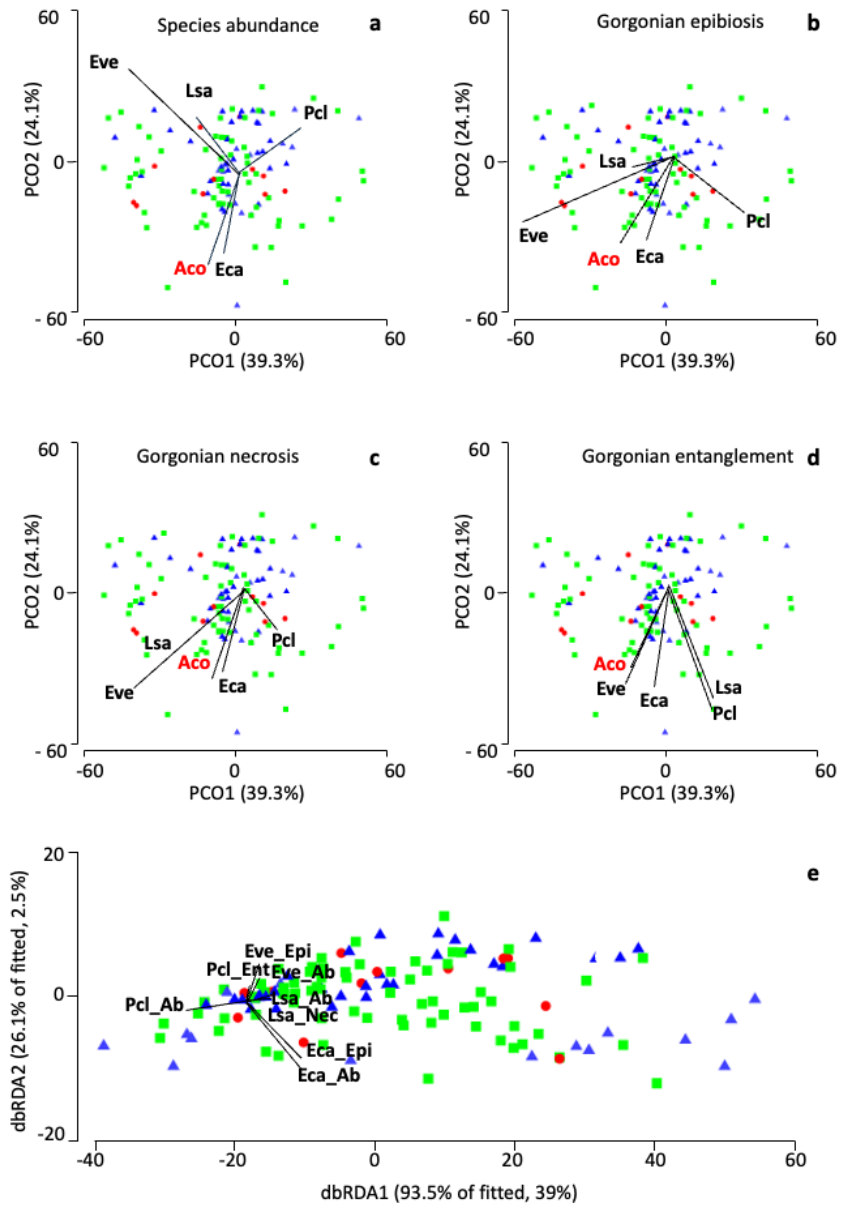
According to the Principal Coordinates Analysis (PCO) performed on the biological matrix across all investigated ecological components (species abundance, percentage of gorgonian epibiosis, necrosis and entanglement), the first two axes explained 63.4% of the total variation (PCO1: 39.3%; PCO2: 24.1%). Regarding species abundance, A. coralloides and E. cavolini showed a congruent trajectory (Figure 4a). When considering percent epibiosis of each gorgonian species, E. cavolini and A. coralloides again mirrored the previous trend (Figure 4b). Regarding percent of necrosis, A. coralloides abundance agreed with E. cavolini and E. verrucosa (Figure 4c). Finally, the ordination of gorgonian entanglement showed that higher entanglement rates in E. verrucosa were associated with the highest presence of the parasite (Figure 4d).
The distance-based Redundancy Analysis (dbRDA) (Figure 4e) and the DistLM marginal tests indicated that several health-related descriptors and biotic variables significantly explained the multivariate variance of the system. E. cavolini abundance emerged as the most critical driver, accounting for 18.9% of the total variation (Pseudo-F = 29.78, p = 0.0001), followed by its relative percentage of epibiosis (10.6% of the variance, Pseudo-F = 15.07, p = 0.0002). Significant minor contributions were also observed for tissue damage indicators, particularly E. cavolini necrosis (7.9%, p = 0.0006) and L. sarmentosa necrosis (5.5%, p = 0.0027), while E. verrucosa epibiosis accounted for 4.6% of the total variation (p = 0.0083) (Table 2).
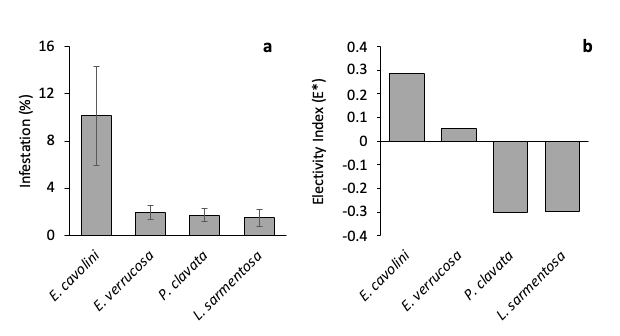
At regional level, host-specific infestation patterns were analyzed in forests comprising at least 100 gorgonians of a single species per 100 m2. While the infestation on E. verrucosa, P. clavata and L. sarmentosa did not show any significant difference (1.5–1.9%) higher levels were recorded in E. cavolini (10.1 ± 4.2%) (Kruskal–Wallis χ2 (3) = 12.78, p = 0.0051) (Figure 5a). Vanderploeg and Scavia’s Relativized Electivity Index (E*) revealed marked non-random host selection by A. coralloides across the four gorgonian species. E. cavolini was preferentially targeted by the epibiont (E* = +0.29), representing 33.4% of total infested colonies (ri = 0.334) despite constituting only 18.5% of the overall gorgonian assemblage (pi = 0.185). Conversely, E. verrucosa exhibited near-neutral electivity (E* = +0.05), indicating opportunistic infestation directly proportional to its natural availability (pi = 0.395, ri = 0.440). In contrast, strong negative selection (avoidance/lower susceptibility) was observed for P. clavata (E* = −0.30) and L. sarmentosa (E* = −0.30). Notably, despite P. clavata being a co-dominant host species (pi = 0.386), it accounted for a disproportionately lower share of infested colonies (ri = 0.207) (Figure 5b).
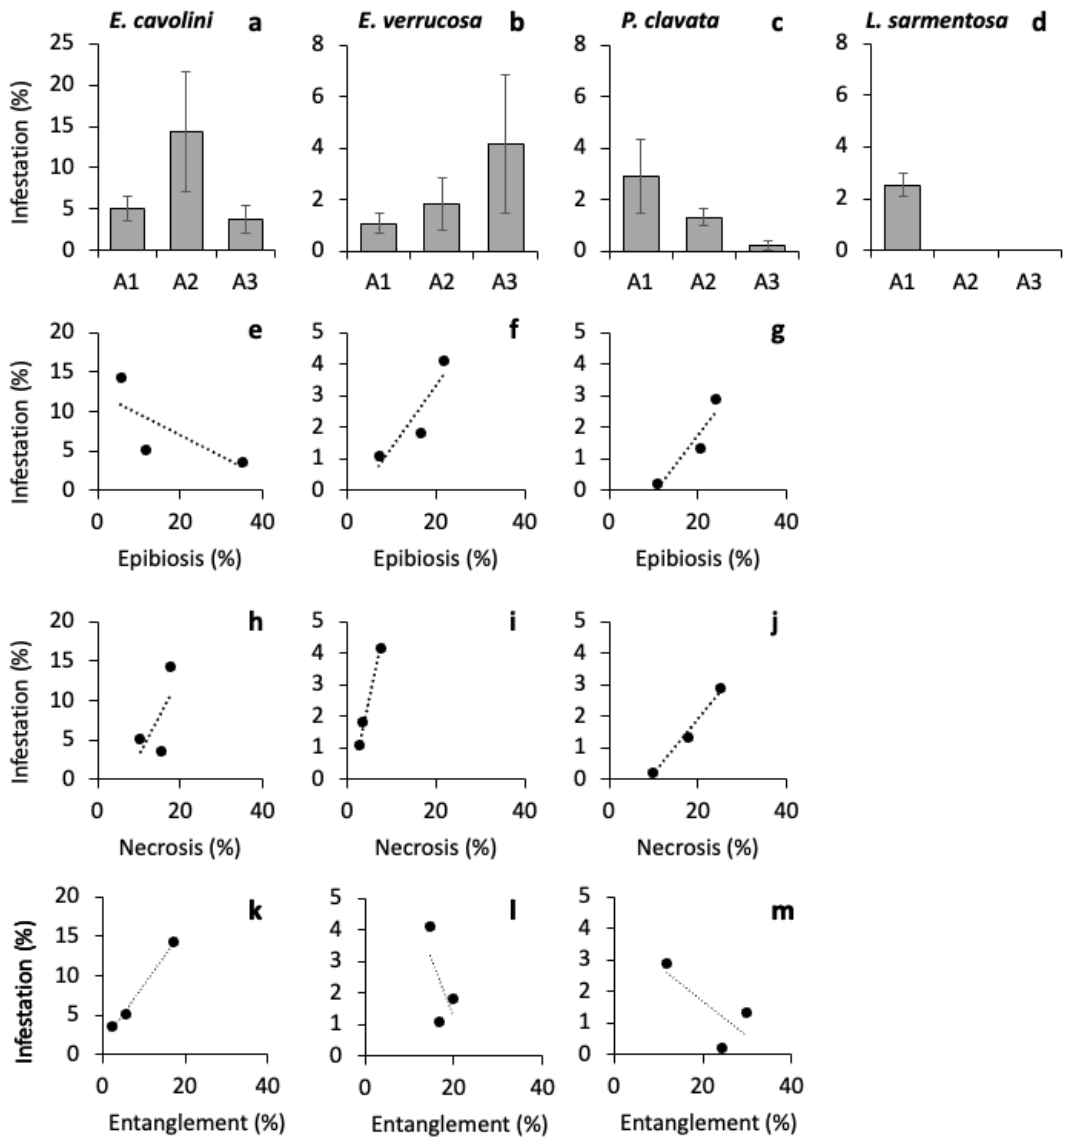
The geographic distribution of A. coralloides along the Ligurian coast varied according to host species. Infestation of E. cavolini was relatively low in the eastern and western sectors (approximately 4–5%) and reached its highest value in the central sector (approximately 15%) (Figure 6a). In contrast, infestation of E. verrucosa increased progressively from east (approximately 1%) to west (approximately 4%) (Figure 6b). In P. clavata, it showed an opposite pattern, with the highest infestation levels in the eastern sector (3%) and progressively lower values westwards (0.2%) (Figure 6c). In L. sarmentosa, it was recorded only in the eastern sector, reaching approximately 2.5% (Figure 6d). On E. singularis, the epibiont was recorded only sporadically. In addition, A. coralloides was occasionally observed growing on anthropogenic substrates, particularly abandoned fishing lines.
For the three most widespread host species (E. cavolini, E verrucosa and P. clavata), we have evaluated the putative relationship of the infestation with the level of integrity of the host. In particular, we have considered the percentage of colonies showing epibiosis (excluding that due to A. coralloides), the percentage of colonies affected by necrosis (branches deprived of coenenchyme and showing the barren proteinaceous skeleton) and the percentage of colonies entangled in lost fishing lines. The infestation levels showed a different relationship with the level of epibiosis of the forests according to gorgonian species. In E. cavolini, the relationship was negative while for E. verrucosa and P. clavata was positive (Figure 6e–g). In all the three hosts the infestation was positively related to the percentage of colonies showing necrotic tissues. This relationship was particularly strong in P. clavata and E. verrucosa (Figure 6h–j). Finally, in E. cavolini, a clear relationship was observed between infestation and entanglement with lost fishing lines in contrast with what observed for the other two species (Figure 6k–m).

3.2. Colonization Dynamics and Host Responses

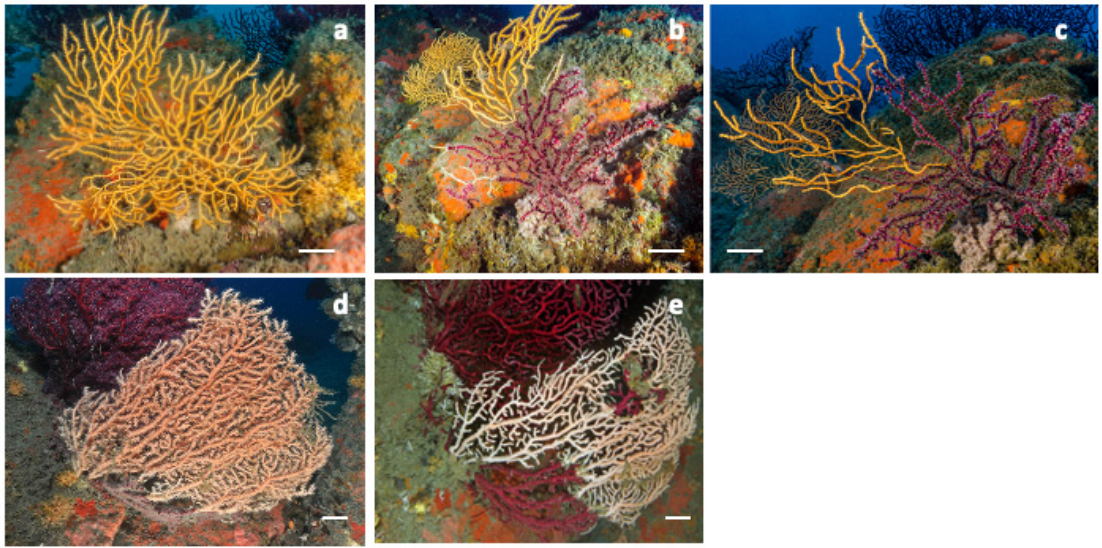
In a time series of underwater images collected by one of the authors (ET), a colony of Eunicella cavolini photographed in 2018 and revisited in 2022 and 2023 showed extensive colonization by Alcyonium coralloides during the interval between surveys (Figure 7a–c). No epibiosis was visible during the first observation (2018), whereas the second survey (2022) revealed colonization of both the basal and central portions of the colony. Over this period, the gorgonian colony exhibited a 37.5% reduction in total surface area, decreasing from 700 cm2 in 2018 to 443 cm2 in 2023. Out of this remaining fan surface, 56% (248 cm2) was found colonized by A. coralloides in 2022. The epibiont covered approximately 276 cm of branch development, corresponding to a minimum colonization rate of about 55 cm yr−1. During 2023, the epibionted portion increased to 324 cm (+17%, corresponding to 48 cm of branch development).
A similar pattern was observed in a colony of E. verrucosa photographed in 2012 and 2014 (Figure 7c–e). A branch partially colonized in 2012 showed a marked increase in the extent of epibiosis two years later, from approximately 13 cm2 (3.5% of the total fan surface) to 41 cm2 (about 12%) of branch length, corresponding to a linear development increasing from 22 cm to 46 cm (12 cm yr−1). In addition, a new infestation focus developed in the central portion of the colony covering about 12 cm2 of branches (1.8% of the total fan surface), equal to 13 cm.
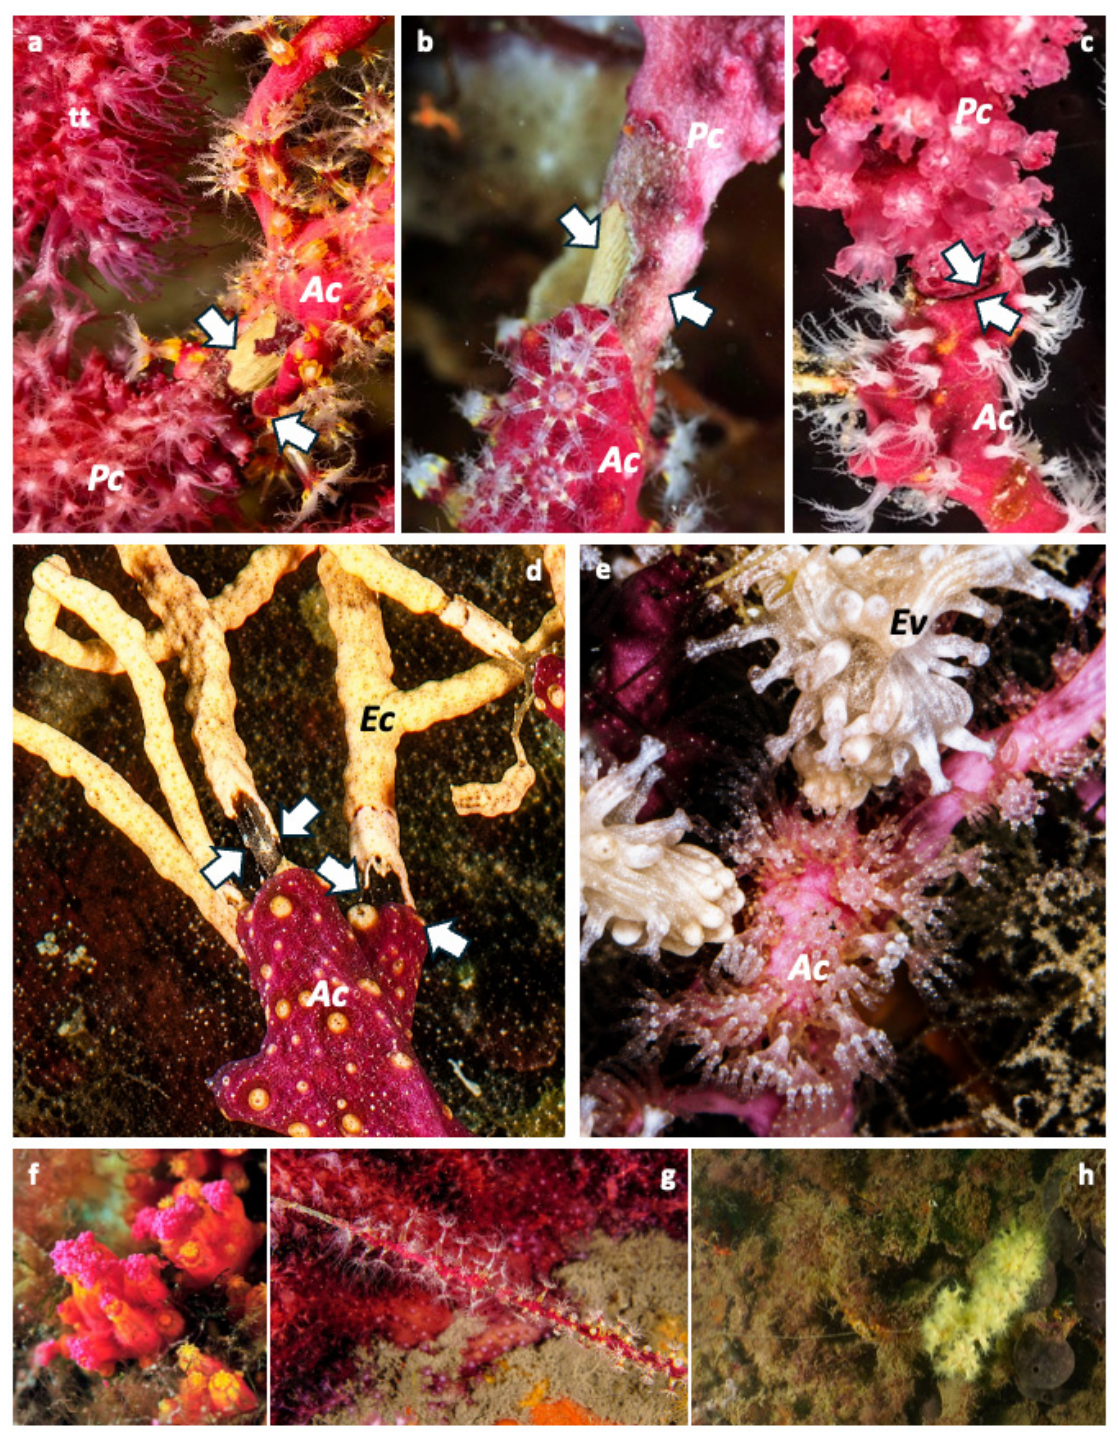
Close-ups of the in situ photographs documented direct contact between A. coralloides and living host tissues. In colonies of Paramuricea clavata, partially or completely denuded portions of the gorgonian axis were frequently visible between the advancing margin of the epibiont and the living host coenenchyme (Figure 8a,b). In one case, the host colony exhibited localized development of polyps with elongated thread-like tentacles adjacent to the contact zone (Figure 8a). Another colony showed direct contact between the two coenenchymes, both forming conspicuous hypertrophic borders at the interface (Figure 8c). In this area, P. clavata polyps were partially contracted, whereas those of A. coralloides displayed thread-like tentacles as well.
Similar patterns were observed in E. cavolini, where portions of exposed gorgonian skeleton occurred adjacent to the epibiont (Figure 7d). In E. verrucosa, colonies affected by epibiosis displayed contracted polyps, whereas those of the epibiont remained fully expanded (Figure 8e).

4. Discussion

The present study provides the first regional-scale assessment of the abundance, distribution and host associations of Alcyonium coralloides in Ligurian mesophotic gorgonian forests. Although the species is widely recognized as one of the most characteristic octocorals of Mediterranean coralligenous assemblages [1,8], its ecological relationship with gorgonian hosts has remained largely descriptive and based on local observations [3,9]. By combining extensive ROV surveys with long-term photographic observations, our results revealed consistent patterns of host use and suggested that the interaction between A. coralloides and Mediterranean gorgonians may be more dynamic than previously assumed.
The distribution of A. coralloides along the Ligurian coast appears to be strongly dependent on the occurrence and density of gorgonian forests. Infestation levels markedly increased with host density and became common only in assemblages exceedingly approximately 100 colonies per 100 m2. This pattern suggests that the abundance of suitable biological substrates is one of the principal factors controlling the distribution of the species. Similar relationships between epibiotic suspension feeders and habitat-forming hosts have been reported in a variety of benthic ecosystems, where elevated biogenic structures provide access to enhanced water flow and increased food availability [30,31].
The observed relationship probably reflects several interacting ecological processes. At low host densities, the scarcity of suitable settlement substrata, together with reduced larval retention within sparse gorgonian forests, is likely to limit recruitment. Since A. coralloides planulae remain close to the female colony [32], increasing host density is expected to enhance both the probability of larval encounter with suitable substrata and local larval retention, resulting in the rapid increase in infestation frequency observed at intermediate forest densities [33,34]. At the highest host densities, however, the relationship became progressively weaker, suggesting that host availability gradually ceases to be the main limiting factor. Once suitable substrata become sufficiently abundant, further increases in gorgonian density provide only marginal additional opportunities for settlement, and local recruitment may instead become regulated by other processes, such as larval supply, post-settlement mortality, or competition for space on host colonies [35,36].
Although A. coralloides was observed on all major Ligurian gorgonian species, host occupation was clearly non-random. The markedly higher infestation levels recorded on Eunicella cavolini compared with Paramuricea clavata, E. verrucosa and Leptogorgia sarmentosa indicate a strong host preference. Such specificity is particularly interesting because previous studies generally described the species as a facultative epibiont capable of colonizing a broad spectrum of gorgonian hosts [3,37]. The regional consistency of the pattern observed here suggests that host identity plays a more important ecological role than previously recognized. A frequent association of A. coralloides and E. cavolini in the Ligurian Sea was already suggested by Enrichetti et al. [20].
The relationship between infestation and gorgonian condition provides additional insight into the ecology of the interaction. Although all the trends of the parameters of stress considered were not completely consistent among the studied species, infestation levels increased with the degree of stress affecting the gorgonians. In particular, the occurrence of necrotic tissues showed strong relationship with infestation in P. clavata and E. verrucosa. The lower correlation between necrosis and infestation observed for E. cavolini in our opinion could be interpreted as the possibility for the parasitic epibiont to settle also on healthy or only slightly stressed colonies without a large portion of necrotic tissue.
A certain degree of physiological stress—partially linked to the host’s own biological cycle—is likely a prerequisite for successful epibiont settlement. Previous studies suggested that the spring reproductive timing of A. coralloides represents an adaptation to optimize the colonization of its host. In fact, A. coralloides larvae are ready to settle in early summer when the hosts are probably more vulnerable because of their own reproductive cycle coming to an end [15,38]. In the Tavolara MPA, the emission of sexual products by A. coralloides has been documented around mid-May, followed by recruitment roughly two weeks later, occurring concurrently with the spawning event of P. clavata [38].
Necrotic branches of gorgonians provide stable, elevated substrata free from living tissue and therefore constitute ideal settlement sites for sessile suspension feeders. Mediterranean gorgonian forests are increasingly affected by marine heatwaves, disease outbreaks, sedimentation and fishing-related impacts [16,17,39,40]. By generating exposed skeletal surfaces, these disturbances may create suitable settlement areas for opportunistic epibionts. In this context, the abundance of A. coralloides could potentially increase in stressed forests, not as a primary cause of decline but as a secondary response to habitat degradation.
At the Cap de Creus Marine Protected Area rocky bottoms dominated by E. cavolini which reaches densities of up to 51 col. m−2 co-occur with A. coralloides. The latter was identified as the most prevalent epibiont species, showing a striking predominance in Maça d’Oros (70.3%), an area characterized by both the highest density of anthropogenic debris and twice the rate of dead colonies. The main fraction of this marine litter was composed by fishing lines (80.7% of the debris) [41]. It is known that the friction of lost fishing lines on the gorgonian branches produce the local abrasion of the coenenchyme inducing the settlement of epibiontic organisms, particularly A. coralloides [38,39].
Time-series observations indicate that once established, colonies of A. coralloides may expand rapidly, covering substantial portions of the host colony. Moreover, the contact zones between the two octocorals frequently exhibited narrow bands of denuded skeleton, while host polyps adjacent to the interface often appeared retracted or only partially expanded. In particular, in P. clavata, we observed for the first time in natural environment the presence of thread-like tentacles testifying a strong level of competition for space between the host and the epibiont, as already associated with aggressive/defensive response not only in octocorals (and specifically in P. clavata) but also in scleractinians and antipatharians [37,42,43,44].
This body of evidence is difficult to reconcile with a purely opportunistic occupation of already dead substrates and instead suggests the existence of direct ecological interactions between A. coralloides and its gorgonian hosts. Competition for space is one of the principal processes structuring sessile benthic communities [36,45,46]. Colonial cnidarians are particularly effective spatial competitors because they progressively occupy available surfaces through vegetative growth and may directly interfere with neighbouring colonies by physical contact, overgrowth, or allelochemical interactions involving nematocysts [47,48,49].
However, the ecological role of the gorgonian host may extend beyond simply providing a settlement surface. In plant ecology, climbing plants have been described as “structural parasites” because they exploit the architecture of trees to reach more favourable environmental conditions without directly depending on them for nutrition [50]. A comparable ecological strategy may apply to A. coralloides. By colonising living gorgonian colonies, the soft coral gains access to an elevated position within the water column, where water flow and suspended food availability are likely to be greater, while sediment accumulation and possibly benthic predation are reduced. The host thus functions not only as a substratum but also as a three-dimensional biological structure that enhances the ecological performance of the epibiont.
Although no experimental evidence is currently available for A. coralloides, the patterns documented in this study suggest that the interaction with gorgonians may represent an intermediate step in a continuum ranging from opportunistic epibiosis to active spatial competition/parasitism.
A useful comparison may be provided by the zoantharian Savalia savaglia, Bertoloni 1819, another Mediterranean anthozoan that uses gorgonians as biological substrates and progressively overgrows host branches through skeletal deposition [51]. Although the biological mechanisms involved are partially different, both species exploit elevated living substrates and appear capable of expanding over time at the expense of host surface availability. Preliminary observations from the present study suggest that A. coralloides may spread more rapidly than S. savaglia, (30–45 cm y−1 vs. 9–11 cm y−1) [51,52] although quantitative estimates remain limited and require further validation.
The comparison of the ecology of A. coralloides with S. savaglia becomes more congruent when considering that both species, parasitic epibionts of gorgonians, are able in peculiar settings, to form colonies without their host [4,51]. In rare cases both species were recorded able to grow also on non-living substrate as lost nylon lines (Figure 8g,h).

5. Conclusions

Overall, our results suggest that A. coralloides should not be regarded merely as a passive parasitic epibiont of dead gorgonian branches. Its distribution is strongly linked to the occurrence of dense gorgonian forests, host use appears selective, and photographic evidence indicates the possibility of direct interactions with living host tissues. These findings reveal a previously underappreciated aspect dimension of the ecological relationships occurring within Mediterranean animal forests and highlight the need for experimental studies aimed at disentangling the relative importance of substrate availability, host susceptibility and competitive interactions in shaping the dynamics of this remarkable octocoral.

Supplementary Materials

The following supporting information can be downloaded at https://www.mdpi.com/article/10.3390/d18080473/s1.

Author Contributions

Conceptualization, G.B. and M.C.; methodology, M.C., F.E. and M.T.; validation, G.B. and M.B.; formal analysis, M.C., F.E. and M.T.; investigation, E.T.; resources, E.T.; data curation, M.C.; writing—original draft preparation, G.B. and M.C.; writing—review and editing, G.B., M.B., M.C., F.E., E.T. and M.T.; visualization, G.B., M.C. and E.T.; supervision, G.B. and M.B.; project administration, G.B.; funding acquisition, G.B. and M.B. All authors have read and agreed to the published version of the manuscript.

Funding

ROV surveys were financed by ARPAL (grants 2015–2021 within the Marine Strategy Framework Monitoring Program) and Ministero delle Politiche Agricole, Alimentari e Forestali (Project 2012, “Use of ROV in the management of deep Corallium rubrum populations”; L.R. 7 Agosto 2007, no. 7). The National Biodiversity Future Centre also supported this research. Project funded under the National Recovery and Resilience Plan (NRRP), Mission 4 Component 2 Investment 1.4—Call for tender No. 3138 of 16 December 2021, rectified by Decree n.3175 of 18 December 2021 of the Italian Ministry of University and Research, funded by the European Union—NextGenerationEU. This research was supported by the National Biodiversity Future Center (NBFC) project, code CN_00000033, Concession Decree No. 1034 of 17 June 2022, adopted by the Italian Ministry of University and Research, CUP D31B21008270007.

Institutional Review Board Statement

Not applicable.

Data Availability Statement

The data supporting the outcomes of this study are included in the article and are available upon request.

Acknowledgments

The authors would like to thank Alessandro Dagnino and Valentina Queirolo (Agenzia Regionale per la Protezione dell’Ambiente Ligure–ARPAL), Istituto Superiore per la Ricerca e la Protezione Ambientale (ISPRA), and all crew members involved in the campaigns for their assistance with fieldwork and data collection.

Conflicts of Interest

The authors declare no conflicts of interest. The funders had no role in the design of the study; in the collection, analyses, or interpretation of data; in the writing of the manuscript; or in the decision to publish the results.

References

  1. Weinberg, S. Revision of the common Octocorallia of the Mediterranean circalittoral II. Alcyonacea. Beaufortia 1977, 25, 131–166. [Google Scholar]
  2. McFadden, C.S.; Van Ofwegen, L.P.; Quattrini, A.M. Revisionary systematics of Octocorallia (Cnidaria: Anthozoa) guided by phylogenomics. Bull. Soc. Syst. Biol. 2022, 1, 8735. [Google Scholar] [CrossRef]
  3. Gili, J.M.; Ros, J. Study and cartography of the benthic communities of Medes Islands (NE Spain). Mar. Ecol. 1985, 6, 219–238. [Google Scholar] [CrossRef]
  4. Groot, S.; Weinberg, S. Biogeography, taxonomical status and ecology of Alcyonium (Parerythropodium) coralloides (Pallas, 1766). Mar. Ecol. 1982, 3, 293–312. [Google Scholar] [CrossRef]
  5. Pallas, P.S. Elenchus Zoophytorum Sistens Generum Adumbrationes Generaliores et Specierum Cognitarum Succinctas Descriptiones, Cum Selectis Auctorum Synonymis; Petrum van Cleef: The Hague, The Netherlands, 1766. [Google Scholar]
  6. Mcfadden, C.S.; Van Ofwegen, L.P. Revisionary systematics of the endemic soft coral fauna (Octocorallia: Alcyonacea: Alcyoniina) of the Agulhas Bioregion, South Africa. Zootaxa 2017, 4363, 451–488. [Google Scholar] [CrossRef] [PubMed]
  7. McFadden, C.S.; Donahue, R.; Hadland, B.K.; Weston, R. A molecular phylogenetic analysis of reproductive trait evolution in the soft coral genus Alcyonium. Evol. 2001, 55, 54–67. [Google Scholar] [CrossRef] [PubMed]
  8. Gibson, R.; Atkinson, R.; Gordon, J.; Ballesteros, E. Mediterranean coralligenous assemblages: A synthesis of present knowledge. Oceanogr. Mar. Biol. Annu. Rev. 2006, 44, 123–195. [Google Scholar] [CrossRef]
  9. Laubier, L. Le coralligène des Albères. Monographie biocoenotique. Annls. Inst. Océanogr. 1966, 43, 140–316. [Google Scholar]
  10. Carpine, C.; Grasshof, M. Les Gorgonaires de la Méditerranée; Bulletin de l’Institut Océanographique; Institut Océanographique: Monaco, 1975; Volume 71, pp. 1–140. [Google Scholar]
  11. Sartoretto, S.; Francour, P. Bathymetric distribution and growth rates of Eunicella verrucosa (Cnidaria: Gorgoniidae) populations along the Marseilles coast (France). Sci. Mar. 2012, 76, 349–355. [Google Scholar] [CrossRef]
  12. Coma, R.; Ribes, M.; Gili, J.M.; Zabala, M. An energetic approach to the study of life-history traits of two modular colonial benthic invertebrates. Mar. Ecol. Prog. Ser. 1998, 162, 89–103. [Google Scholar] [CrossRef]
  13. Hartnoll, R.G. The annual cycle of Alcyonium digitatum. Estuar. Coast. Mar. Sci. 1975, 3, 71–78. [Google Scholar] [CrossRef]
  14. McFadden, C.S. Genetic and taxonomic relationships among Northeastern Atlantic and Mediterranean populations of the soft coral Alcyonium coralloides. Mar. Biol. 1999, 133, 171–184. [Google Scholar] [CrossRef]
  15. Quintanilla, E.; Gili, J.M.; López-González, P.J.; Tsounis, G.; Madurell, T.; Fiorillo, I.; Rossi, S. Sexual reproductive cycle of the epibiotic soft coral Alcyonium coralloides (Octocorallia, Alcyonacea). Aquat. Biol. 2013, 18, 113–124. [Google Scholar] [CrossRef]
  16. Cerrano, C.; Bavestrello, G.; Bianchi, C.N.; Cattaneo-vietti, R.; Bava, S.; Morganti, C.; Morri, C.; Picco, P.; Sara, G.; Schiaparelli, S.; et al. A catastrophic mass-mortality episode of gorgonians and other organisms in the Ligurian Sea (North-western Mediterranean), summer 1999. Ecol. Lett. 2000, 3, 284–293. [Google Scholar] [CrossRef]
  17. Garrabou, J.; Coma, R.; Bensoussan, N.; Bally, M.; Chevaldonné, P.; Cigliano, M.; Diaz, D.; Harmelin, J.G.; Gambi, M.C.; Kersting, D.K.; et al. Mass mortality in Northwestern Mediterranean rocky benthic communities: Effects of the 2003 heat wave. Glob. Change Biol. 2009, 15, 1090–1103. [Google Scholar] [CrossRef]
  18. Würtz, M. Submarine canyons and their role in the Mediterranean ecosystem. Mediterr. Submar. Canyons 2012, 11. [Google Scholar]
  19. Casella, E.; Molcard, A.; Provenzale, A. Mesoscale vortices in the Ligurian Sea and their effect on coastal upwelling processes. J. Mar. Syst. 2011, 88, 12–19. [Google Scholar] [CrossRef]
  20. Enrichetti, F.; Dominguez-Carrió, C.; Toma, M.; Bavestrello, G.; Betti, F.; Canese, S.; Bo, M. Megabenthic communities of the Ligurian deep continental shelf and shelf break (NW Mediterranean Sea). PLoS ONE 2019, 14, e0223949. [Google Scholar] [CrossRef] [PubMed]
  21. Canessa, M.; Betti, F.; Bo, M.; Enrichetti, F.; Toma, M.; Bavestrello, G. Possible Population Growth of Astrospartus mediterraneus (Risso, 1826) (Ophiuroidea, Gorgonocephalidae) in the Mediterranean Sea. Diversity 2023, 15, 122. [Google Scholar] [CrossRef]
  22. Canessa, M.; Bertolotto, R.; Betti, F.; Bo, M.; Dagnino, A.; Enrichetti, F.; Toma, M.; Bavestrello, G. Variation in the health status of the mediterranean gorgonian forests: The synergistic effect of marine heat waves and fishing activity. Biology 2024, 13, 642. [Google Scholar] [CrossRef] [PubMed]
  23. Canessa, M.; Bo, M.; Enrichetti, F.; Toma, M.; Bavestrello, G. Distribution of the echiurid worm Bonellia viridis Rolando, 1822 along the Ligurian Coast, North-Western Mediterranean Sea. Estuar. Coast. Shelf Sci. 2026, 335, 109850. [Google Scholar] [CrossRef]
  24. Canessa, M.; Bo, M.; Enrichetti, F.; Toma, M.; Bavestrello, G. Multi-scale environmental influence on the spatial and bathymetric distribution of the solitary ascidian Halocynthia papillosa (Linneaus, 1767) in the Ligurian Sea (NW Mediterranean). Eur. Zool. J. 2026. under review. [Google Scholar] [CrossRef] [PubMed]
  25. MATTM-ISPRA. Programmi di Monitoraggio per la Strategia Marina; Art. 11, D.lgs. 190/2010; Schede Metodologiche Modulo 7—Habitat Coralligeno; Ministero dell’Ambiente e Della Tutela del Territorio e del Mare, Istituto Superiore per la Protezione dell’Ambiente: Rome, Italy, 2016. [Google Scholar]
  26. Vanderploeg, H.A.; Scavia, D. Two electivity indices for feeding with special reference to zooplankton grazing. J. Fish. Res. Board Can. 1979, 36, 362–365. [Google Scholar] [CrossRef]
  27. Clarke, K.R.; Gorley, R.N. Getting Started with PRIMER v7; Plymouth marine laboratory; PRIMER-e: Plymouth, UK, 2015; Volume 20, p. 300. [Google Scholar]
  28. Anderson, M.J. Permutational multivariate analysis of variance (PERMANOVA). In Wiley StatsRef: Statistics Reference Online; Wiley: Hoboken, NJ, USA, 2014; pp. 1–15. [Google Scholar]
  29. Rasband, W.S. ImageJ: Image processing and analysis in Java; Astrophysics source code library, 2012; p. ascl-1206. [Google Scholar]
  30. Wahl, M. Marine epibiosis. I. Fouling and antifouling: Some basic aspects. Mar. Ecol. Prog. Ser. 1989, 58, 175–189. [Google Scholar] [CrossRef]
  31. Wahl, M. Epibiosis. In Marine Hard Bottom Communities; Wahl, M., Ed.; Ecological Studies; Springer: Berlin/Heidelberg, Germany, 2009; Volume 206. [Google Scholar] [CrossRef]
  32. Zelli, E.; Quéré, G.; Lago, N.; Di Franco, G.; Costantini, F.; Rossi, S.; Bramanti, L. Settlement dynamics and recruitment responses of Mediterranean gorgonians larvae to different crustose coralline algae species. J. Exp. Mar. Biol. Ecol. 2020, 530–531, 151427. [Google Scholar] [CrossRef]
  33. Rossi, S.; Bramanti, L.; Gori, A.; Orejas, C. An overview of the animal forests of the world. In Marine Animal Forests; Springer: Berlin/Heidelberg, Germany, 2017; pp. 1–26. [Google Scholar] [CrossRef]
  34. Cerrano, C.; Bastari, A.; Calcinai, B.; Di Camillo, C.; Pica, D.; Puce, S.; Valisano, L.; Torsani, F. Temperate mesophotic ecosystems: Gaps and perspectives of an emerging conservation challenge for the Mediterranean Sea. Eur. Zool. J. 2019, 86, 370–388. [Google Scholar] [CrossRef]
  35. Keough, M.J. Effects of patch size on the abundance of sessile marine invertebrates. Ecology 1984, 65, 423–437. [Google Scholar] [CrossRef]
  36. Sebens, K.P. Spatial relationships among encrusting marine organisms in the New England subtidal zone. Ecol. Monogr. 1986, 56, 73–96. [Google Scholar] [CrossRef]
  37. López González, P.J.; Bramanti, L.; Escribano Álvarez, P.; Benedetti, M.C.; Martínez Baraldés, I.; Megina Martínez, C. Thread-like tentacles in the Mediterranean corals Paramuricea clavata and Corallium rubrum. Mediterr. Mar. Sci. 2018, 19, 394–397. [Google Scholar] [CrossRef]
  38. Canessa, M.; Amedeo, I.; Bavestrello, G.; Panzalis, P.; Trainito, E. The diversity, structure, and development of the epibiont community of Paramuricea clavata (Risso, 1826) (Cnidaria, Anthozoa). Water 2023, 15, 2664. [Google Scholar] [CrossRef]
  39. Bavestrello, G.; Cerrano, C.; Zanzi, D.; Cattaneo-Vietti, R. Damage by fishing activities to the Gorgonian coral Paramuricea clavata in the Ligurian Sea. Aquat. Conserv. Mar. Freshw. Ecosyst. 1997, 7, 253–262. [Google Scholar] [CrossRef]
  40. Ponti, M.; Perlini, R.A.; Ventra, V.; Grech, D.; Abbiati, M.; Cerrano, C. Ecological shifts in Mediterranean coralligenous assemblages related to gorgonian forest loss. PLoS ONE 2014, 9, e102782. [Google Scholar] [CrossRef] [PubMed]
  41. Higueruelo, A.; Santín, A.; Salazar, J.; Ambroso, S.; Soler-Membrives, A.; Grinyó, J. Coexistence of megabenthic assemblages and artisanal fishers: The case of cap de Creus Marine Protected Area (North-Western Mediterranean Sea). Mar. Environ. Res. 2023, 192, 106211. [Google Scholar] [CrossRef] [PubMed]
  42. Williams, R.B. Catch-tentacles in sea anemones: Occurrence in Haliplanella luciae (Verrill) and a review of current knowledge. J. Nat. Hist. 1975, 9, 241–248. [Google Scholar] [CrossRef]
  43. Sebens, K.P.; Miles, J.S. Sweeper tentacles in a gorgonian octocoral: Morphological modifications for interference competition. Biol. Bull. 1988, 175, 378–387. [Google Scholar] [CrossRef]
  44. Bo, M.; Bavestrello, G.; Castellano, L.; Perez, N.; Veneziano, F.M.; Betti, F. On the substrate adhesion of the black coral Antipathella subpinnata (Ellis & Solander, 1786) and other habitat-forming anthozoans. Zool. Anz.—J. Comp. Zool. 2026, 324, 20–30. [Google Scholar] [CrossRef]
  45. Jackson, J.B. Competition on marine hard substrata: The adaptive significance of solitary and colonial strategies. Am. Nat. 1977, 111, 743–767. [Google Scholar] [CrossRef]
  46. Karlson, R.H. Size-dependent growth in two zoanthid species: A contrast in clonal strategies. Ecology 1988, 69, 1219–1232. [Google Scholar] [CrossRef]
  47. Lang, J.C.; Chornesky, E.A. Competition between scleractinian reef corals—A review of mechanisms and effects. Ecosyst. World 1990, 25, 209–252. [Google Scholar]
  48. Chadwick, N.E.; Morrow, K.M. Competition among sessile organisms on Coral Reefs. In Coral Reefs: An Ecosystem in Transition; Dubinsky, Z., Stambler, N., Eds.; Springer: Dordrecht, The Netherlands, 2011. [Google Scholar] [CrossRef]
  49. Morrow, K.M.; Paul, V.J.; Liles, M.R.; Chadwick, N.E. Allelochemicals produced by Caribbean macroalgae and cyanobacteria have species-specific effects on reef coral microorganisms. Coral Reefs 2011, 30, 309–320. [Google Scholar] [CrossRef]
  50. Stevens, G.C. Lianas as structural parasites: The Bursera simaruba example. Ecology 1987, 68, 77–81. [Google Scholar] [CrossRef]
  51. Canessa, M.; Bo, M.; Boggia, R.; Calcagnile, L.; D’Elia, M.; Orlandi, V.; Quarta, G.; Trainito, E.; Turrini, F.; Bavestrello, G. Growth and skeletal structure of the parasitic zoantharian Savalia savaglia (Bertoloni, 1819). Sci. Rep. 2025, 15, 34439. [Google Scholar] [CrossRef] [PubMed]
  52. Zibrowius, H. Comportement agressif du Zoanthaire Geradia savaglia contre le Gorgonaire Paramuricea clavata (Cnidaria: Anthozoa). Comm. Int. Pour L’exploration Sci. Mer. Méditerranée 1985, 29, 351–353. [Google Scholar]
Figure 1. The Ligurian coast showing the location of the ROV transects where Alcyonium coralloides abundance (white dots) was assessed across areas within each of the three considered macro-areas (A1, Eastern Liguria; A2, Central Liguria; A3, Western Liguria). Further details are fully reported in Supplementary Materials.
Diversity 18 00473 g001
Figure 2. The parasitic epibiosis of Alcyonium coralloides on gorgonians in the Ligurian Sea. (a,b) In the wide forests of Eunicella cavolini recorded in the central sector, the purple parasitic octocoral epibiont (purple) was frequently observed on healthy colonies mainly in the basal portion but also on apical branches (arrows) (c). (d) On E. verrucosa, A. coralloides was present both on healthy and necrotic colonies (e). (g) On Paramuricea clavata, the octocoral epibiont was sporadically recorded on intact colonies (f) but more frequently on colonies damaged by diseases (arrows).
Diversity 18 00473 g002
Figure 3. Relationship between the density of the gorgonian forests (mono- or plurispecific) and the density of Alcyonium coralloides. The epibiosis is a function of the density of the forest with a logarithmic increase until 500 colonies per 100 m2 and reaching an asymptote for populations with more than 1000 specimens per 100 m2.
Diversity 18 00473 g003
Figure 4. Multivariate ordination plots displaying the structural and health-related patterns of the Ligurian gorgonian forests across all sampling stations. (ad) Principal COmponents (PCO) analysis, showing (a) species abundance, (b) percentage of gorgonian epibiosis, (c) necrosis, and (d) entanglement. Vector overlays represent Pearson correlation coefficients with the ordination axes. In panels (bd), the vector labelled Aco represents the abundance of Alcyonium coralloides, which was overlaid as a vector (via Pearson correlation) and was not included in the computation of the PCO. (e) Distance-based Redundancy Analysis (dbRDA) ordination plot showing the optimal DistLM model based on AIC selection criterion. Vector overlays in the dbRDA plot illustrate the conditional effects of the significant health-related and biotic predictors structuring the multivariate data. Blue, areas within macroarea A1; green, A2; red, A3. Abbreviations for variables: Aco = Alcyonium corall oides, Eca: Eunicella cavolini, Eve: E. verrucosa, Lsa: Leptogorgia sarmentosa, Pcl: Paramuricea clavata.
Diversity 18 00473 g004
Figure 5. Epibiont infestation across host species. (a) Percentage of colonies (±SE) infested by Alcyonium coralloides for each host species. (b) Host selectivity evaluated using Vanderploeg and Scavia’s Relativized Electivity Index (E*) for epibiont settlement, showing positive selection for Eunicella cavolini and E. verrucosa, and negative selection/avoidance for Paramuricea clavata and Leptogorgia sarmentosa.
Diversity 18 00473 g005
Figure 6. (ad) Trends of percentage of infestation of Alcyonium coralloides on the four considered gorgonian species in the three sectors of the Ligurian Sea. Relationship between the percentage of epibionted (eg), necrotic (hj), and entangled colonies (km) and the infested ones respectively in Eunicella cavolini, E. verrucosa and Paramuricea clavata.
Diversity 18 00473 g006
Figure 7. (ac) The same colony of Eunicella cavolini photographed over a span of time of six years (2018–2023). In the second image (2022), the central portion of the colony is covered by purple Alcyonium coralloides. Contemporaneously, several branches on the right part of the colony were progressively lost. (d,e) The same colony of E. verrucosa photographed after two years. In the first image (2012), a branch in the lower portion was covered by A. coralloides (d), while in 2014, the epibionts widely increased the infestation while a new area in the central portion of the fan was infested (e).
Diversity 18 00473 g007
Figure 8. Close-ups of the contact portions of Alcyonium coralloides and the coenenchyme of different species of gorgonians. (a,b) In an infested colony of Paramuricea clavata, there is a portion of nude skeleton between the coenenchyme of the two octocorals (arrows). The living polyps of P. clavata show the typical thread-like tentacles (tt) (a). (c) The hypertrophic coenenchyme in the contact zone (arrows). (d) In the infestation of E. cavolini a portion of nude skeleton was evident between the two octocorals (arrows). (e) The contact point between E. verrucosa and A. coralloides. (f) A. coralloides spawning event recorded in the middle of May at the Tavolara MPA. (g) The similar behaviour of A. corallodes and (h) Savalia savaglia in covering lost fishing lines.
Diversity 18 00473 g008
Table 1. List of the explored ROV transects in the 2015–2025 period, with abundance (col. 100 m−2) and number of Alcyonium coralloides and the most conspicuous gorgonians (Eunicella cavolini, E. verrucosa, Leptogorgia sarmentosa and Paramuricea clavata), together with the relative percentage of specimens affected by Epibiosis (Epi%), Necrosis (Nec%) and Entanglement (Ent%).
MacroareaYearID TransectA. coralloidesE. cavoliniE. verrucosaL sarmentosaP. clavata
AbundanceNAbundanceNEpi%Nec%Ent%AbundanceNEpi%Nec%Ent%AbundanceNEpi%Nec%Ent%AbundanceNEpi%Nec%Ent%
A12020PMMN_S1_T10.5656 0.929223.417.08.74.5745733.027.04.40.2727003.7
2016PMMN_S2_T10.4930 2.331428.512.020.40.57358.654.320.00.90551.810.960.0
2020 0.2914 1.085322.67.539.60.271323.1053.80.201060.050.080.0
2022 0.022 1.071072.02.07.50.31319.06.516.10.0220.050.00
2016PMMN_S2_T20.397 2.89525.803.81.5628046.410.73.566412.514.115.6
2020 0.1915 4.303405.02.02.40.433412.54.200.846615.99.14.5
2022 0.011 3.923090.601.60.57452.211.100.83669.19.13.0
2025 0.14 2.792793.003.00.57571.806.21.8818812.06.03.7
2016PMMN_S2_T30.042 1.48727.48.84.1 3.701810.603.3
2020 0.011 0.22175.95.90.0 0.51397.72.617.9
2016PMMN_S3_T10.111 3.11347.117.95.8 0.677000
2016PMMN_S3_T20.297 0.581421.421.421.40.1330.066.733.32.546113.124.66.6
2015SLMO_S1_T10.094 1.687921.510.120.20.15771.414.357.10.09450.050.00.0
2020 0.24200.0110002.3719733.06.016.20.04310050.01.02.5521276.045.022.2
2022 0.021 2.381438.02.01.00.0320000.804814.610.42.1
2025 0.012 2.5425410.03.0100.0110000.232313.08.70
2020SLMO_S2_T20.042 1.25653.303.1 1.819437.522.59.6
2020SLMO_S3_T10.277 5.231369.0060.90.113001004.0510540.031.077.6
2025 0.042 1.43755.31.300.1050000.824332.625.60.0
2015SLMO_S3_T20.083 0.903225.78.63.1 1.033742.520.016.3
2020 0.126 2.081067.01.030.2 0.613129.03.267.7
2015SLMO_S3_T30.010 0.52152.90.06.80.04133.30.089.31.795017.510.817.9
2022 0.108 0.383013.313.300.08616.716.733.33.6028456.056.01.1
2015SLMO_S3_T40.011 0.93569.16.19.00.06325.0001.9911918.412.15.0
2020 0.011 1.5210237.07.629.40.13937.525.044.41.429589.471.846.3
2022 0.044 1.791771.02.04.00.088050.00.00.959439.457.43.2
2025 0.022 1.831743.0010.00.088025.0156.30.969142.933.02.4
2016AMPP_S1_T10.64579.408365.46.118.30.211910.515.821.50.01100102.20.272436.016.08.2
2020 0.81448.6546717.016.04.10.221225.025.000.09520.020.01.00.965246.744.45.8
2022 0.38345.1042118.018.049.00.201822.25.600.0110.010000.171540.020.040.0
2025 1.3511616.62142925.03.03.11.01878.03.413.20.0220000.69596.83.45.7
2016AMPP_S1_T20.1321.88303.316.710.00.06100100
2016AMPP_S1_T30.6348.857977.35.17.72.922635.72.311.80.0880013.32.902615.26.92.3
2020 0.0116.8268218.017.09.52.3123111.03.013.00.04475.075.025.01.1511558.855.39.6
2022 0.18167.907037.02.012.02.502233.00.01.0 0.565010.04.30
2025 0.40289.479476.09.01.47.007003.03.02.10.0660002.9628419.049.03.5
2016AMPP_S3_T10.021 0.021000
2016AMPP_S3_T20.011 0.022000 8.3883810.418.43.2
2020 0.0110.7676000 8.3383336.020.01.6
2025 0.0110.033033.30 2.0920925.016.08.1
2019AMPP_S3_T30.148 0.603421.99.48.8 4.3624833.023.011.7
2025 0.021 2.981372.000 0.612842.921.412.8
A22015NOAR_S1_T10.031 7.221804.828.622.2 0.031000
2021 0.022 1.5914617.06.05.00.044000
2025 0.021 3.3721527.01.019.00.03250.000
2021NOAR_S1_T20.011 0.033000 3.5831579.038.031.0
2025 0.011 0.065000 5.8049357.013.019.7
2018NOAR_S2_T10.0420.351822.25.688.94.6224029.65.052.5 3.9820728.516.450.7
2022 0.0542.422107.08.011.03.322893.0036.0 1.2911316.413.43.0
2025 0.0133.783440.000.98.2575122.01.00.5 3.002739.024.05.5
2019NOAR_S2_T20.0230.07425.0000.733560.02.948.6 3.0014478.553.522.2
2019NOAR_S2_T30.116 1.9410520.01.032.4 1.508166.716.076.5
2022 0.011 0.89771.600 0.03333.366.70
2015NOAR_S3_T10.62414.8832713.05.122.00.128000 0.0750040.6
2019 0.50279.4451011.65.732.2 0.09580.040.060.0
2022 0.62554.0335917.010.025.0 0.03350.000
2025 0.5242 9.317549.02.063.0 0.022000
2015NOAR_S3_T20.0212.892140.57.06.10.0211001000 0.201515.446.20
2019 0.23203.6522611.59.717.30.06475.075.075.0 0.06400100
2022 0.0754.5230823.03.014.00.139000 0.161136.4018.2
2015NOAR_S3_T31.66862.4815366.272.836.50.05333.333.332.8 0.201241.791.70.0
2019 0.81291.334891.791.766.70.1765.90.098.0 2.769942.415.623.1
2019NOAR_S4_T10.0220.33333.00.078.8
2022 0.031 0.3811000 1.504418.620.90
2025 0.042 0.352924.131.02.0 6.2052112.014.021.3
2015NOAR_S4_T20.0870.42415.135.917.00.0870.057.10 1.8618011.114.635.5
2019 0.44350.241984.284.284.20.151225.025.033.3 2.271797.83.997.2
2022 0.1670.12540.020.01.00.02110001.0 2.099028.220.512.8
2025 0.47160.06250.0000.18650.016.70 1.625520.018.29.1
2015NOAR_S4_T30.0110.9684013.727.50.011000 0.011000
2023 0.0820.381020.0010.20.38100.000 0.04110000
2019NOAR_S4_T40.0520.11922.201001.2010123.82.094.10.02250.0003.2327142.117.787.8
2022 0.0220.0110001.191007.401.1 1.6413836.023.014.0
2019NOAR_S4_T50.20201.131130.90.195.60.01100100 3.8238220.714.179.8
2022 0.0110.635318.215.900.011001.00.0110004.2035330.018.058.0
2019NOAR_S4_T62.44532.3819036.837.427.90.393223.500 0.443554.354.374.3
2022 0.106 0.432655.950.04.0
2025 0.75470.21130000.483033.3010.0 1.5910026.021.015.0
2019NOAR_S4_T70.0990.13128.3050.03.0929715.80.345.2 0.716810.310.336.8
2019NOAR_S4_T80.0660.0770042.93.0930015.80.344.7 6.6064010.84.560.0
2019NOAR_S4_T91.27521.616628.828.830.30.271127.39.118.2 1.837532.017.320.0
2022 0.1970.0830000.2710000 0.953519.403.2
2025 0.19130.1390000.68476.400 1.127715.624.72.6
2016SVCL_S1_T10.149 1.026627.321.29.10.17119.100
2020 0.148 1.236966.729.621.70.16925.0011.10.0321001000
2022 0.2214 2.3915339.07.03.30.08510040.00
2025 0.054 2.2218414.009.00.141216.7000.043000
2022SVCL_S1_T20.113 2.156058.31.710.00.0720.050.00
2016SVCL_S1_T30.3415 4.6620513.710.26.30.231010.0010.00.02101000
2020 0.208 5.7022830.015.01.80.104000
2022 1.1433 7.4821736.022.03.20.0310100100
2025 0.199 15.2194389.027.03.00.064000
2016SVCL_S2_T10.63546.225358.48.014.80.054025.00 1.099419.162.842.6
2020 0.62496.5451734.033.012.60.141122.222.29.1 0.1081001000
2022 1.321084.934043.55.014.40.121010.000 0 0.342860.792.925.0
2025 2.6714412.9369849.012.01.10.191010.000 0.17944.455.60
2016SVCL_S2_T20.0873.493015.318.413.30.08742.942.928.9 4.353744.29.435.3
2020 0.0640.352510010000.0111001000
2016SVCL_S2_T30.23150.704720.020.06.40.523521.610.820.0
2016SVCL_S3_T10.2312 4.402247.67.13.60.0210001.06545.95.911.1
2020 0.2510 6.5526211.03.05.0 0.502085.005.0
2022 0.043 4.874094.91.71.2 0 0.10850.062.512.5
2025 0.022 2.722209.0018.0 0.211711.823.50
2016SVCL_S3_T20.021 1.47886.93.410.20.0320004.932963.47.226.0
2020 0.104 2.9011919.410.419.3 3.8515851.048.021.5
2025 0.013 2.4823110.02.09.00.011000
2025SVCL_S3_T30.0210.063100001.156118.01.65.40.021100001.819618.813.56.5
2017BONO_S1_T20.3930.774621.74.34.73.482092.90.03.70.0210002.041234.91.610.0
2023 0.0950.2112050.03.02.081172.06.010.70.0530003.4919615.028.011.3
2018BONO_S1_T30.1860.1460003.571571.9012.50.0210005.062223.64.915.9
2021 0.065 3.472951.001.0 5.3345312.010.05.7
2018BONO_S1_T40.0351.721124.51.810.50.31205.0099.5 0.322104.89.5
2021BONO_S3_T10.2313 1.8110319.0012.6 0.331926.310.50
A32019SSDM_S1_T20.031 1.921158.7011.30.021001001.9811955.515.168.9
2015SSDM_S3_T10.1142.2720046.519.800.252259.136.49.20.011100000.363218.83.16.3
2019 0.56226.2040931.310.54.60.09616.7000.0320000.12837.525.00
2019SSDM_S3_T30.0430.04333.3000.15100010.0
2018SRSST_S1_T30.0320.032001000.55430053.80.0110002.9022618.716.420.6
2021CMBO_S1_T10.0210.0640005.3235143.02.02.60.473119.6812.266.58.425567.02.03.4
2024 0.0310.054025.005.444197.02.00.50.10800010.0577410.011.07.9
2016CMBO_S1_T20.0520.0730036.80.218011.10.00.0520011.54.261628.910.121.6
2016CMBO_S2_T10.0720.33120017.11.5354030.411.2 0.20733.366.714.3
2016CMBO_S2_T30.107 2.9920027.031.032.50.76512.011.831.4
2019 0.248 3.3324034.210.435.01.6511919.310.933.6
2024 0.3934 2.4121237.008.00.44391.0017.9
Table 2. Distance-based Linear Model (DistLM) results evaluating the influence of health-related and biotic predictors (gorgonian abundance (Ab), percentage of Epibiosis (Epi%), Necrosis (Nec%) and Entanglement (Ent%)) on the multivariate structure of the Ligurian gorgonian forests in relation with Alcyonium coralloides abundance. Both Marginal Tests (evaluating the individual explanatory power of each variable isolated) and Sequential Tests (forward step-wise selection optimizing the Akaike Information Criterion, AIC) are displayed based on a square-root transformed resemblance matrix (Bray–Curtis similarity). Significant p values are reported in bold. Eca: Eunicella cavolini; Eve: E. verrucosa; Lsa: Leptogorgia sarmentosa; Pcl: Paramuricea clavata.
Total SS(Trace): <0.0001
Marginal Tests:
Variable:SS(Trace)Pseudo-FpProp.
Eca_Ab22.58729.7750.00010.18992
Eca_Epi%12.61515.069000020.10607
Eca_Nec%9405.410.9070.00060.079086
Eca_Ent%3998.544.1850.02530.033622
Eve_Ab1239.313.3740.25650.010421
Eve_Epi%5454.761.0510.00830.045867
Eve_Nec%3088.533.8610.04640.02597
Eve_Ent%2868.731.3910.05870.024121
Lsa_Ab5230.458.4240.00660.04398
Lsa_Epi%1278.513.8020.23480.010751
Lsa_Nec%6612.674.7730.00270.055603
Lsa_Ent%1145.112.3470.26630.0096285
Pcl_Ab2647.828.9190.07860.022264
Pcl_Epi%985.6910.6140.31210.0082883
Pcl_Nec%1298.414.0180.23640.010917
Pcl_Ent%1575.51.7050.1820.013248
Disclaimer/Publisher’s Note: The statements, opinions and data contained in all publications are solely those of the individual author(s) and contributor(s) and not of MDPI and/or the editor(s). MDPI and/or the editor(s) disclaim responsibility for any injury to people or property resulting from any ideas, methods, instructions or products referred to in the content.