Article

Effects of Plant Invasion Along Environmental Gradients on Native Plant Communities in the Ertix River Basin Wetlands

1
School of Ecology and Nature Conservation, Beijing Forestry University, Beijing 100083, China
2
School of Life and Environmental Sciences, Shaoxing University, Shaoxing 312000, China
3
Beijing Keystone Academy, Beijing 101318, China
4
The Key Laboratory of Ecological Protection in the Yellow River Basin of National Forestry and Grassland Administration, Beijing Forestry University, Beijing 100083, China
5
Forest Dynamics, Swiss Federal Institute for Forest, Snow and Landscape Research WSL, 8903 Birmensdorf, Switzerland
6
Key Laboratory of Geographical Processes and Ecological Security in Changbai Mountains, Ministry of Education, School of Geographical Sciences, Northeast Normal University, Changchun 130022, China
7
School of Life Science, Hebei University, Baoding 071000, China
*
Authors to whom correspondence should be addressed.
Diversity 2026, 18(7), 411; https://doi.org/10.3390/d18070411
Submission received: 10 May 2026 / Revised: 27 June 2026 / Accepted: 30 June 2026 / Published: 6 July 2026
(This article belongs to the Section Plant Diversity)

Abstract

Biological invasions and environmental gradients are major drivers of biodiversity change in wetland ecosystems, but their associations on native plant diversity in Central Asian riverine wetlands remain poorly understood. We surveyed 158 wetland plant communities across 54 transects in the Ertix River Basin to examine how environmental gradients (elevation, mean annual temperature [MAT], and mean annual precipitation [MAP]) and non-native plant establishment jointly related to native plant importance values and alpha diversity indices. Non-native plants were classified according to invasion stage—non-naturalized, naturalized, and invasive—to elucidate how the associations between alien plants and native communities shift dynamically along the invasion continuum. Elevation emerged as the dominant predictor, explaining 82% (individual R2 = 0.15) of the variance in native species richness and 63.37% (individual R2 = 0.1) of the variance in the Shannon–Wiener diversity index, while MAT and MAP were not retained as significant predictors in the optimal models. Native plant importance values, richness, and diversity all increased with elevation. Unexpectedly, naturalized plant richness and abundance were positively associated with native diversity metrics, contrasting with the negative associations of all non-native categories (non-naturalized, naturalized, and invasive) on native importance values, partly reflecting the compositional nature of this metric. Our results reveal positive co-occurrence patterns between early-stage naturalized species and native species, but native dominance may eventually decline as invasion intensity increases. These findings highlight the importance of considering invasion stage when predicting wetland biodiversity responses to biological invasions under environmental heterogeneity.

1. Introduction

Biological invasions represent one of the most pervasive threats to wetland ecosystems globally [1,2,3], leading to substantial habitat degradation and biodiversity loss [4,5,6]. The establishment and spread of invasive plants have profoundly altered native plant community structure in wetlands, with cascading effects on ecosystem functioning and service [3,6,7]. While numerous studies have documented invasion-driven wetland biodiversity loss in heavily managed or degraded wetlands [8,9,10], the patterns underlying invasive plant impact in relatively pristine natural wetlands remain poorly understood. This knowledge gap is particularly pronounced in the riverine wetlands of northwestern China, where unique environmental conditions—including pronounced elevational gradients, distinctive hydrological regimes, and climatic variability—may fundamentally alter invasion–biodiversity relationships [11,12,13].
Understanding the drivers through which invasive plants impact native communities is essential for predicting biodiversity responses and developing effective conservation strategies in invaded wetland ecosystems [14,15,16]. Plant taxa in a given area whose presence there is due to intentional or accidental introduction as a result of human activity are defined as non-native plants (alien plants). Richardson et al. further defined naturalized and invasive plants based on invasion stages [17]. In wetlands, the successful establishment of invasive plants has often been attributed to their superior competitive ability, resource-use efficiency, and broad environmental adaptability [18,19,20]. Once established, invasive plants can further modify both the biotic and abiotic conditions of invaded ecosystems [21,22,23], which may ultimately reshape native community composition [24,25].
However, invasion impacts on native communities are not solely determined by the traits of non-native plants but are strongly modulated by local environmental conditions that govern species performance and competitive interactions [26,27]. Environmental factors that vary systematically along elevational gradients—such as microclimatic variability, disturbance intensity, land use, and nutrient availability—are key determinants of both native community structure and invasion susceptibility, with temperature and precipitation being the most frequently discussed [28,29,30]. These climatic factors directly regulate plant physiological processes, growth rates, and competitive interactions, thereby shaping species interactions and community assembly [31,32]. Importantly, native and non-native plants often exhibit divergent environmental tolerances and resource acquisition strategies [33,34], suggesting that the relative performance of non-native plants and their impacts on native diversity may vary predictably along environmental gradients [35,36]. Despite the theoretical importance of environmental context in determining invasion impacts, empirical evidence for how temperature and precipitation gradients mediate the effects of non-native plants on native plant diversity in riverine wetlands remains limited.
Alpha diversity quantifies species diversity within a single community and has been widely used to assess plant community structure and ecosystem health [37,38]. Among the various alpha diversity metrics, species richness, Pielou evenness, and the Shannon–Wiener diversity index are three of the most commonly used indices, each capturing a distinct facet of community structure [39,40]. Species richness reflects the number of coexisting species and indicates a community’s capacity to support biodiversity [41]. Pielou evenness measures the equitability of abundance distributions, with higher values indicating more balanced communities less dominated by a few species [42,43]. The Shannon–Wiener index integrates richness and evenness into a single composite measure of community complexity [44,45]. Together, these three indices provide complementary perspectives on community structure and were applied in this study to evaluate native plant communities in the Ertix River Basin wetlands. Additionally, we used importance value (IV) to characterize the dominance and ecological status of native plants, reflecting their predominance within the community [46,47,48]. All metrics were jointly analyzed to examine the relationships between environmental change, plant invasions, and native plant communities.
The Ertix River Basin wetlands in northwestern China occupy pronounced elevational gradients and support rich biodiversity, exhibiting unique environmental characteristics at the intersection of aquatic and terrestrial ecosystems [11,12,13]. With increasing human pressures and growing exposure to non-native plant species under accelerating global environmental change, biosecurity threats in this region are gradually receiving more attention [49,50]. Regional floral surveys and biosecurity monitoring indicate that non-native plants are establishing in this system [51], yet quantitative, community-level analyses of their ecological impacts remain scarce. Specifically, the magnitude, direction, and patterns of these invasion impacts are poorly characterized. This knowledge gap hinders predictions of future invasion trajectories and the development of science-based conservation strategies for these threatened wetland ecosystems. Therefore, we conducted a field survey to examine the impact of non-native plants on native plant communities in wetland ecosystems of the Ertix River Basin. Specifically, we asked: (1) Do non-native plant species affect native plant communities in the wetlands of the Ertix River Basin? (2) What are the magnitude and direction of non-native plant impacts on native plant diversity? (3) Do environmental factors (i.e., elevation, mean annual temperature, and mean annual precipitation) modulate non-native plant species’ impact along elevational gradients in these regions? We tested the following hypotheses: (1) Non-native plants negatively affect native plant communities, with stronger effects on importance values than on diversity metrics. (2) Temperature, precipitation, and elevation exert significant modulating effects on native plant communities, particularly on diversity metrics. (3) The impact strength of non-native plants varies across invasion stages, with invasive plants exerting stronger negative effects than naturalized or non-naturalized species.

2. Materials and Methods

2.1. Study Area

The Ertix River Basin wetlands are located in the northern region of the Xinjiang Uygur Autonomous Region, China. The basin is bordered by the Altai Mountains to the north, the Sayram Mountains to the southwest, and the Gurbantunggut Desert to the south (Figure 1). The expansive alluvial plain formed by the Ertix River and the Ulungur River lies at the center of this region [52]. The Ertix River is the second-largest river in Xinjiang and constitutes an international river within the Arctic Ocean watershed [52,53]. The basin spans 85°30′–90°30′ E and 46°55′–49°10′ N, with elevations ranging from ca. 300 m to 4000 m above sea level. The entire river system extends over an area of 1.65 × 10⁶ km2 with a total length of 4248 km, of which 633 km flows through China’s territory, encompassing a drainage area of 52,500 km2 [49,54]. Located in the northwest arid region of China, the basin experiences a temperate continental arid to semi-arid climate, with a mean annual temperature of 3.3 °C and mean annual precipitation of 93.9 mm [49].

2.2. Field Survey

We conducted a comprehensive field survey in the Ertix River Basin wetland ecosystems between 23 June and 28 July 2022 (Figure 1), coinciding with the peak growing season of plants in Xinjiang, to maximize species detectability. Sampling was conducted using a combination of transect and quadrat methods. Survey plots were selected based on the geographical distribution of the Ertix River and the natural plant community patterns, with the principle of maximizing the representativeness of wetland vegetation. Plots were distributed along the river (upper, middle, and lower reaches) and across the full elevational gradient of the study area to achieve systematic coverage of the environmental variation in the Ertix River Basin wetlands. We selected 54 representative wetland plant communities that are free from major anthropogenic disturbance as sampling plots along the river. All sampling plots were spaced at least 1 km apart to minimize spatial dependence. In each plot, a transect was established along the moisture gradient (distance to the river) in areas with representative plant community structure and species composition. To ensure comprehensive representation of the plant community, transects were set at a minimum length of 10 m, and extended as necessary to capture the full extent of the wetland vegetation and local plant distribution patterns. Along each transect, three 1 m × 1 m quadrats were randomly placed to capture distinct segments of the moisture gradient [55,56,57]. After excluding quadrats dominated by a single species, a total of 158 quadrats were retained for analysis. Within each quadrat, we recorded geographic coordinates and documented all herbaceous plant species, including species identity, abundance, and percentage cover. The operational definition of individual plants was based on Hill et al. [58]. For each species, average plant height was calculated by summing the heights of all individuals and dividing by the total number of individuals within each quadrat.

2.3. Species Name Standardization

All recorded plant species were taxonomically standardized and classified according to invasion status through a multi-step verification process. Species were initially identified in the field using the Flora of China (FOC; http://www.iplant.cn/) and subsequently verified by botanical experts to ensure accurate identification. Species names were then standardized following the Plants of the World Online (POWO; https://powo.science.kew.org/) taxonomy using the R package “rWCVP” v1.0.3 [59]. This harmonization procedure corrected orthographic inconsistencies, resolved synonyms, and removed uncertain records, resulting in a refined dataset of 188 species with accepted names.
Each standardized species was assigned to one of four invasion categories: native, non-naturalized, naturalized, and invasive. Non-native plants are defined as plant taxa in a given area whose presence is due to intentional or accidental introduction as a result of human activity. Naturalized species were defined as non-native plant species that have established self-sustaining populations. Non-naturalized species referred to non-native plants that have not yet naturalized. Invasive plants are a subset of naturalized species that spread rapidly and cause ecological or economic impacts. The above definitions follow the frameworks of Richardson et al. [17], Blackburn et al. [60], and Pyšek et al. [16]. Native species and non-naturalized species were identified with reference to the checklist of Chinese angiosperms compiled by Lu et al. [61] and the checklist of alien plants in China complied by Lin et al. [62] and cross-verified through POWO. The classification of naturalized and invasive species was validated using the Naturalized Plants of China (NPC; https://www.iplant.cn/npc/, accessed on 29 June 2026) and the Invasive Alien Species in China (IASC; https://www.plantplus.cn/ias/, accessed on 29 June 2026) databases. This process identified 162 native, 8 naturalized, 8 non-naturalized, and 10 invasive species in the surveyed wetlands.

2.4. Environmental Factors

To characterize the environmental conditions at sampling sites, we compiled topographic and climatic variables. Because of the large elevational span across sampling sites, field altimetry would have necessitated frequent recalibration to maintain acceptable accuracy. We therefore adopted satellite-derived elevation data to ensure consistency and accuracy. Elevation data were obtained from the National DEM dataset (at a 1 km resolution) available through the Resource and Environmental Science Data Platform (https://www.resdc.cn/). Elevation values for each sampling location were extracted using the “raster” function from the R package “raster” v3.6-32, based on the quadrat coordinates [63].
For climatic variables, we first obtained monthly temperature and precipitation data at a 1 km spatial resolution [64] from the National Earth System Science Data Center (https://www.geodata.cn). We used the “ncvar_get” function from the R package “ncdf4” v1.24 to extract climate variables corresponding to each sampling plot [65]. For each year between 2012 and 2022, we calculated the mean annual temperature (MAT) and mean annual precipitation (MAP) to represent local climatic conditions. MAT was derived by averaging monthly temperature values, while MAP was obtained by summing monthly precipitation data. In total, eleven consecutive annual records (2012–2022) were compiled for both temperature and precipitation. The average of these annual values provided long-term estimates of MAT and MAP for each sampling plot, to reflect recent climatic conditions across the Ertix River Basin wetlands.

2.5. Species Diversity Metrics

We calculated the relative height, relative abundance, and relative cover of native plants in each quadrat. These values represent the proportion of the sum of average height, abundance, and cover of native plants relative to all species within the same quadrat, respectively. The importance value (IV) of native plants was then determined as the arithmetic mean of its relative height, relative abundance, and relative cover [48,66]. Based on field survey data, three diversity indices were calculated, including the species richness, the Shannon–Wiener diversity, and Pielou evenness [48,67]. All diversity analyses were conducted using the “diversity” function from the R package “vegan” v2.7-5 [68]. The formulas used for each metric are as follows:
Importance   value ,   IV   =   rh   +   ra   +   rc 3
Richness ,   S = total   number   of   species
Shannon Wiener   diversity   index ,   H = P i ln ( P i )
Pielou   e venness   index ,   E = H / H max
where IV represents importance value, rh is relative height, ra is relative abundance, and rc is relative cover. S denotes the total number of species in the plant community. Pi is the proportion of individuals of species i to the total number of individuals in the plant community, calculated as Pi = Ni/N. Ni represents the number of individuals of species i.
For non-native plants, we calculated the richness (i.e., total species number) and abundance (i.e., total individual number) of non-naturalized, naturalized, and invasive species in each quadrat.

2.6. Data Analysis

Prior to analysis, elevation, MAP, richness and abundance of non-native plants were log-transformed as log(x + 1), while MAT, since its minimum value was −1.14, was transformed as log(x + 2). All transformed variables were then standardized to a mean of zero and standard deviation of one. Among the four response variables (Shannon–Wiener diversity, species richness, importance value, and Pielou evenness of native plants), only species richness was log-transformed to improve normality.
We employed linear mixed-effects models (LMMs) to examine the effects of environmental factors (elevation, MAT, and MAP) and non-native plant metrics (richness and abundance of non-naturalized, naturalized, and invasive species) on four native community metrics (importance value, richness, Shannon–Wiener diversity, and evenness). Transect was included as a random factor to account for spatial non-independence among quadrats within the same transect. Optimal models were obtained through backward stepwise regression with predictors retained at p < 0.05. Benjamini–Hochberg correction was applied across the final models to control the false discovery rate. All linear mixed-effects models were rigorously evaluated through diagnostic procedures to verify the validity of model assumptions. Predictors with variance inflation factors (VIF) ≥ 5 were removed to avoid multicollinearity [69,70]. Spatial autocorrelation in model was assessed using Moran’s I test. All models were fitted using the “lmer” function from the R package “lme4” v1.1-38 [71]. The conditional and marginal R2 of each fixed factor was estimated using the “glmm.hp” function from the R package “glmm.hp” v0.1-3 [72].
All analyses were performed using R v4.4.0 [73].

3. Results

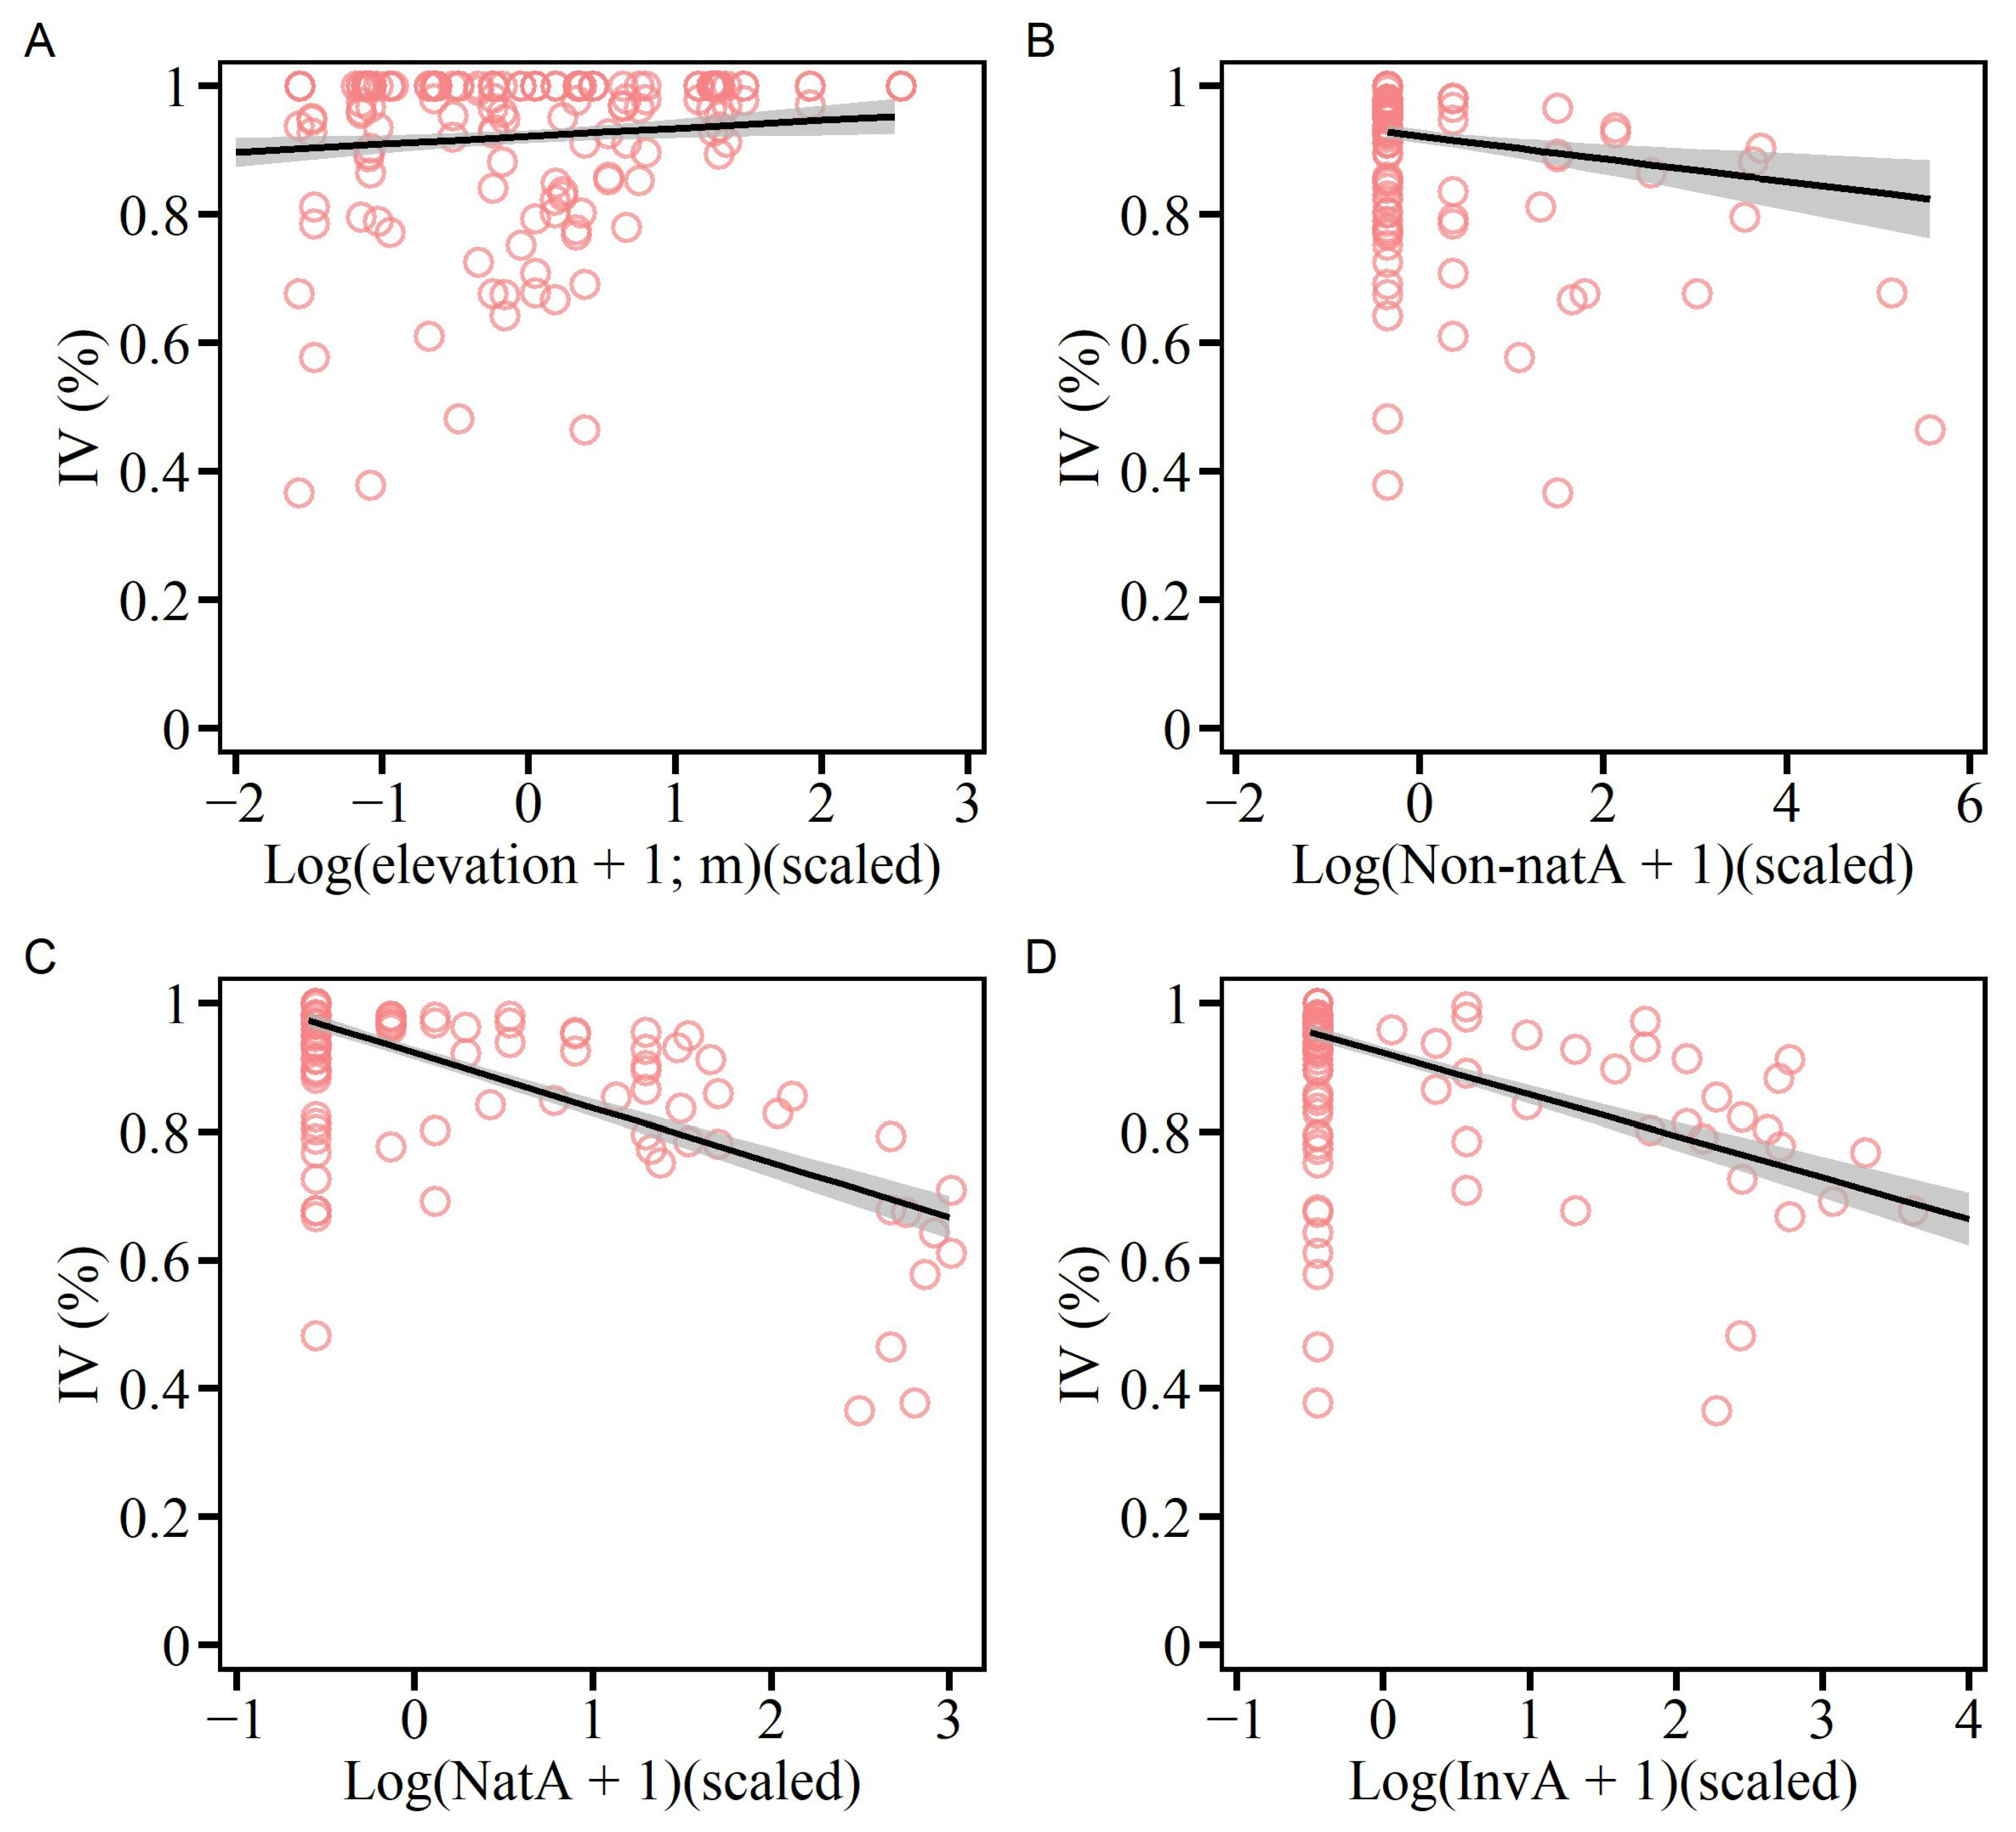
Of the nine explanatory variables (elevation, mean annual temperature [MAT], mean annual precipitation [MAP], richness and abundance of non-naturalized, naturalized, and invasive species) examined, the importance value of native plant communities was significantly associated with elevation and the abundance of all three non-native plant categories (Table 1). Importance value of native plants increased with elevation but decreased with increasing abundance of non-naturalized, naturalized, and invasive plants (Figure 2). The abundance of naturalized plants accounted for the largest proportion of the marginal R2, accounting for 56.18% of the explained variance (individual R2 = 0.43), followed by the abundance of invasive plants (29.23%, individual R2 = 0.22) and non-naturalized plants (12.18%, individual R2 = 0.09), and elevation (2.41%, individual R2 = 0.02) (Table 1).
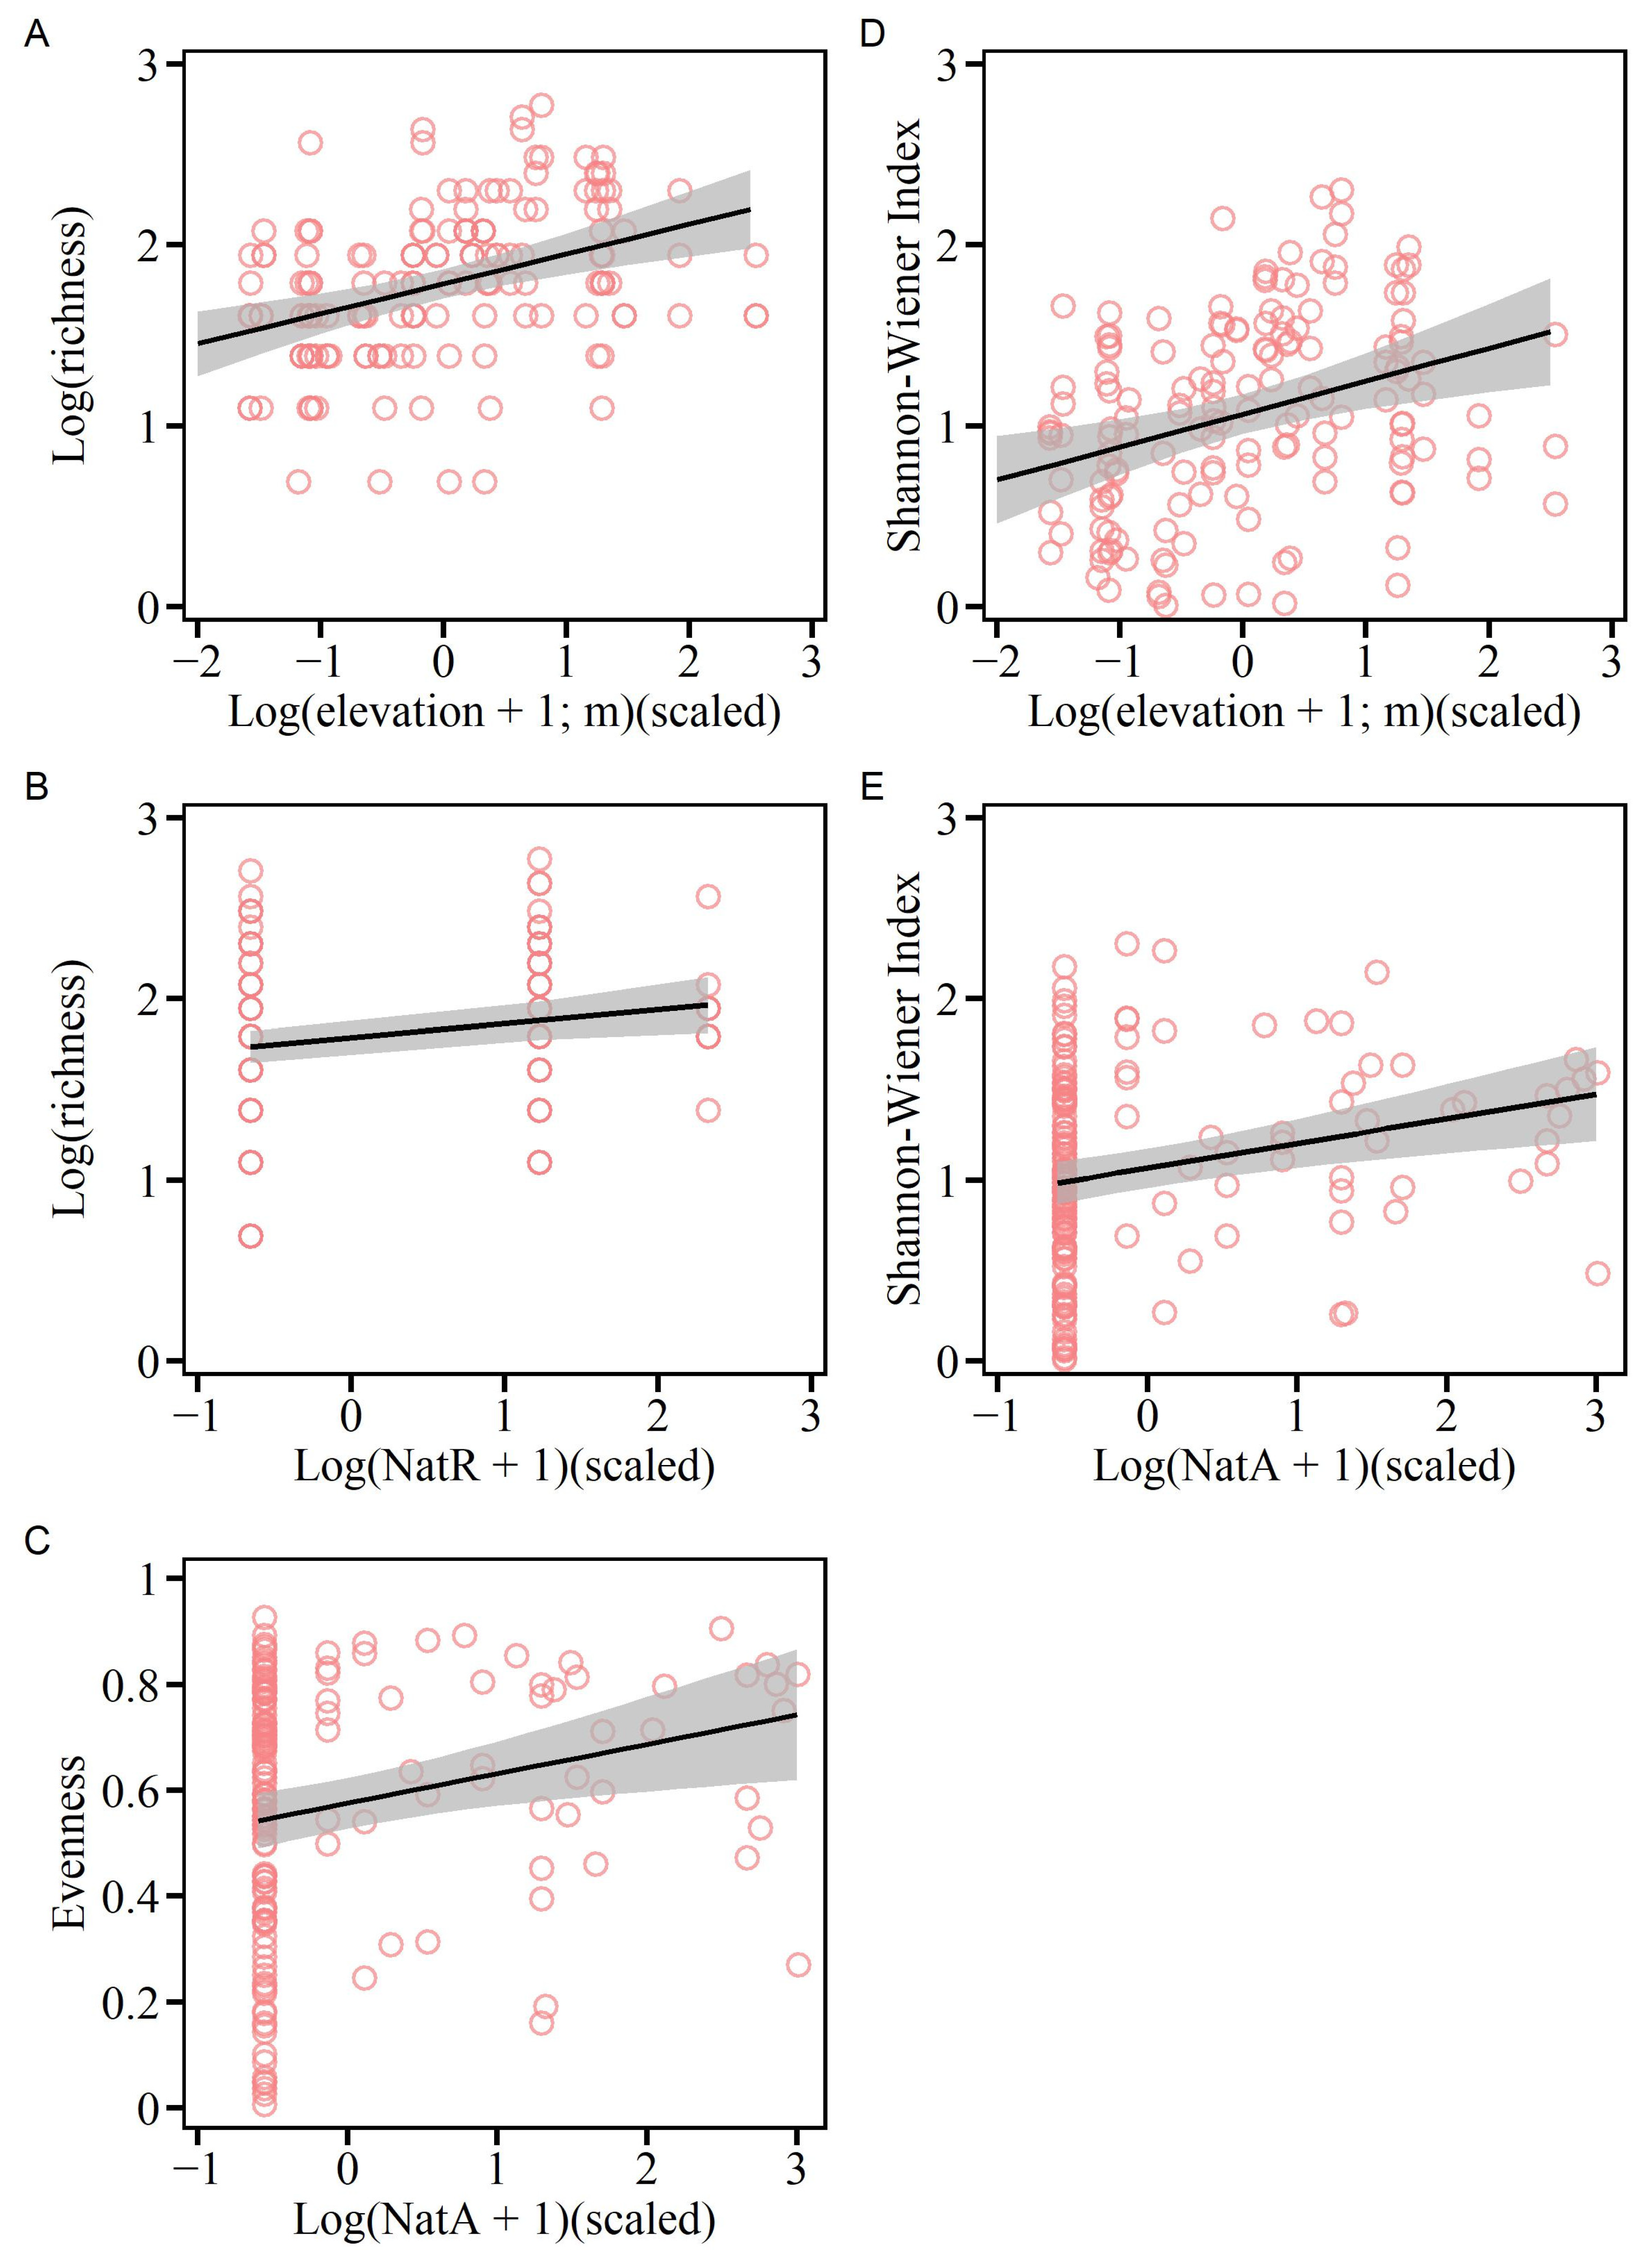
Richness of native plants was significantly associated with elevation and richness of naturalized plants (Table 2(A)). Richness of native plants increased with elevation and richness of naturalized plants (Figure 3A,B). Elevation had the strongest effect, accounting for 82.33% of the explained variance (individual R2 = 0.15), followed by richness of naturalized plants (17.67%, individual R2 = 0.03) (Table 2(A)).
Evenness of native plants was only significantly associated with abundance of naturalized plants (Table 2(B)). Evenness of native plants increased with abundance of naturalized plants (Figure 3C). Shannon index of native plants was significantly associated with elevation and abundance of naturalized plants (Table 2(C)). Shannon index of native plants increased with elevation and abundance of naturalized plants (Figure 3D,E). Elevation explained a larger proportion of variance than naturalized plant abundance, accounting for 63.37% of the explained variance (individual R2 = 0.1) (Table 2(C)).
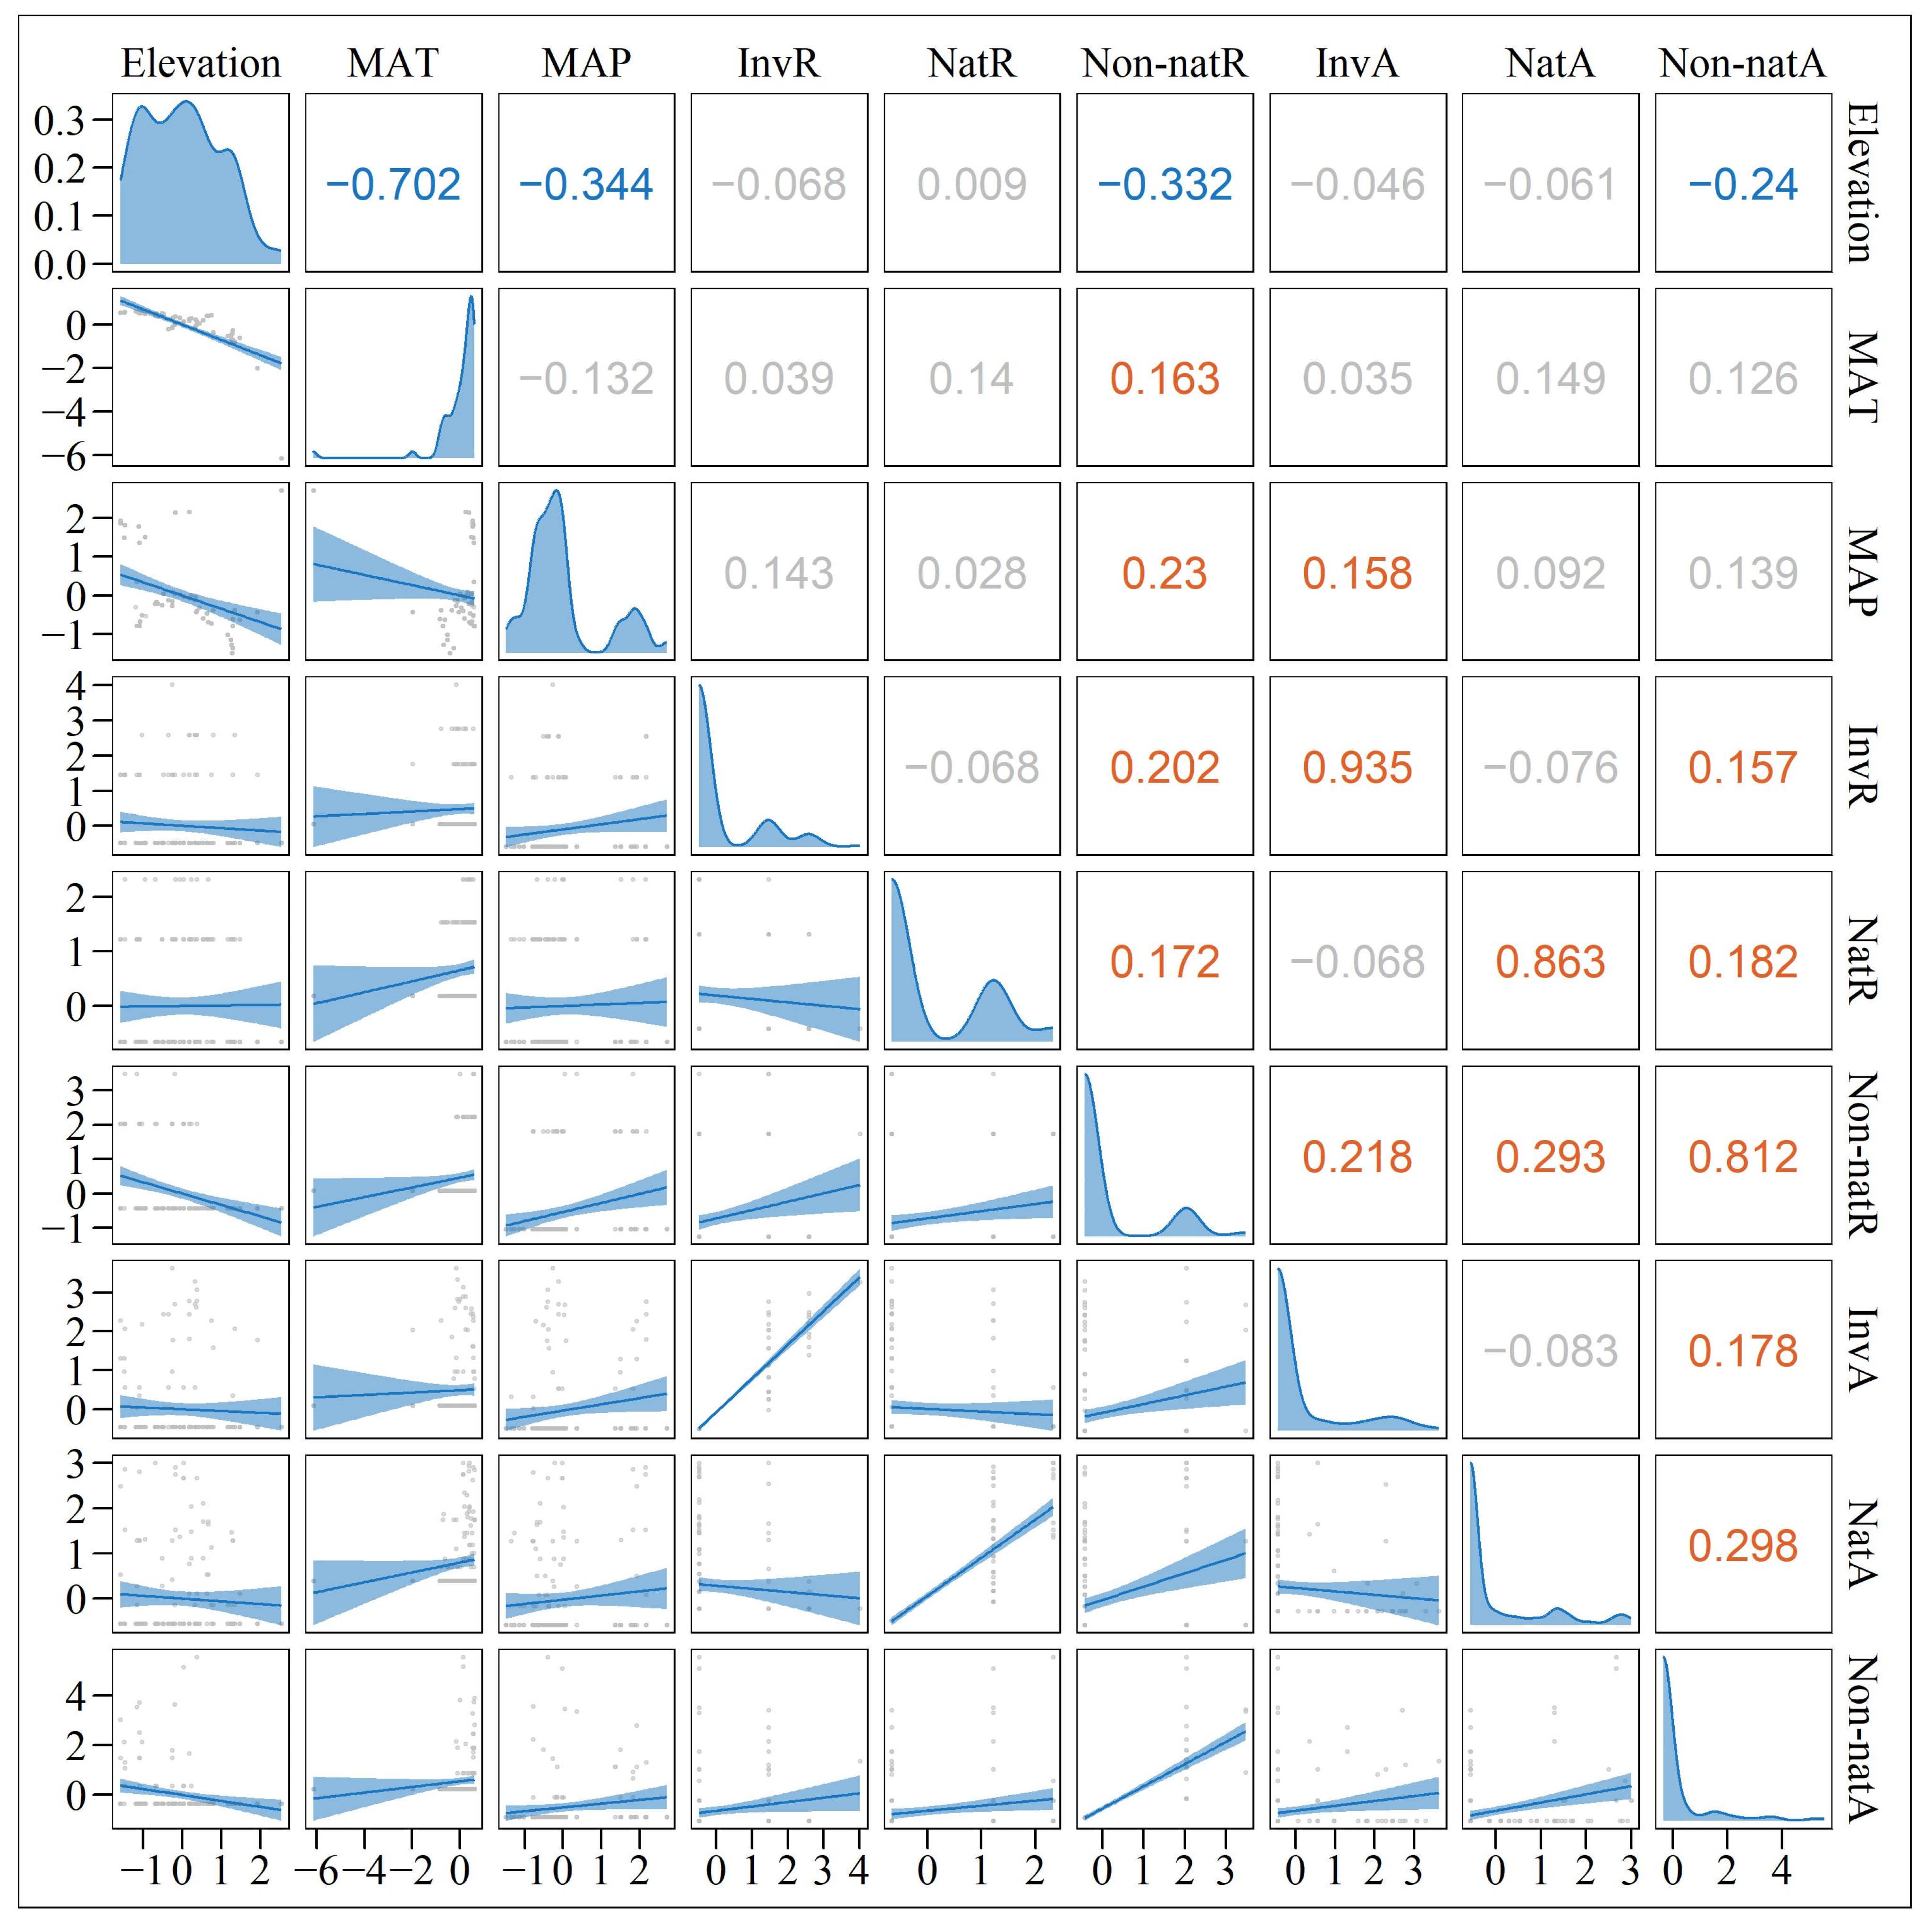
Pairwise Pearson correlations among the nine explanatory variables are shown in Figure 4. Elevation was negatively correlated with MAT and MAP. MAT and MAP were positively correlated with each other. Non-native plant richness and abundance variables generally showed weak to moderate positive correlations within categories (e.g., invasive richness with invasive abundance) and weak negative correlations with elevation. The strongest pairwise correlations were observed between invasive richness and invasive abundance, and between naturalized richness and naturalized abundance. All pairwise correlations among the nine predictor variables had absolute Pearson r values below 0.8.

4. Discussion

Although non-native plant impacts on native communities have been extensively documented across diverse ecosystems [9,19,20], their effects in understudied regions such as the Ertix River Basin wetlands of northwestern China remain poorly understood.
Our study attempted to address this knowledge gap by examining the relationships between non-native plants at different invasion stages (non-naturalized, naturalized, and invasive), environmental factors along elevational gradients, and native plant community structure and diversity.

4.1. Factors Influencing Importance Values of Native Communities

Non-native plants were negatively associated with importance values of native plants, with effects varying by invasion stage. The results indicate that naturalized plants exhibited the strongest negative association, exceeding invasive species and non-naturalized species. This hierarchy suggests that naturalized plants were more strongly associated with variation in native communities than either wide spreading invasive species or transiently occurring non-naturalized species. The negative impacts of naturalized plants on native plant communities have been documented in previous studies [74,75].
The dominance of naturalized species’ associations may be related to their abundance advantage. Naturalized plants were more abundant than invasive and non-naturalized species (e.g., each plot had an average density of 20 individuals), which may be associated with more intensive biotic interactions. Furthermore, certain naturalized species (e.g., Trifolium fragiferum, Lactuca sativa, and Medicago minima) showed competitive advantages, including superior resource acquisition and allelopathic potential with native species [76,77]. We speculate that this is consistent with their establishment and persistence without continuous propagule pressure. These results reveal that invasion impacts vary across the introduction–naturalization–invasion continuum [78]. Our findings suggest that prioritizing early detection and rapid response to prevent naturalization may be more effective than controlling established invasive populations.
Although elevation explained 2.41% of variation, its positive associations suggest high-elevation environments may provide partial refuge for native communities. We speculate that this likely reflects environmental filtering, where harsh conditions constrain non-native establishment while favoring stress-adapted natives [79]. However, the modest effect may indicate that biotic interactions remain the primary factor associated with native community composition.
We note that native importance values are partly compositional. Relative height, abundance, and cover are each calculated as a fraction of the total community including non-native plants. Consequently, an increase in non-native abundance necessarily reduces the native fraction by mathematical identity. The negative associations with non-native plants are therefore not purely ecological, and the higher marginal R2 of the IV model (0.76) is consistent with this constraint. We therefore interpret the importance value results as reflecting the combined influence of mathematical constraint and ecological processes, consistent with the known properties of this widely used community metric.

4.2. Factors Influencing Diversity Metrics of Native Communities

Among the three non-native plant categories examined, only naturalized plants were retained as significant predictors in the optimal models for native community metrics, whereas non-naturalized and invasive plants were not. This pattern suggests that naturalized plants, characterized by high population density and stable interspecific associations, may have stronger and more persistent associations with native communities [74]. In contrast, non-naturalized species typically form small, localized populations that have not yet become self-sustaining, which may account for their weak statistical signal in our analyses [14]. Their limited propagule pressure and restricted distribution likely constrain any detectable relationship with native diversity at the community scale. For invasive plants, the absence of significant associations may similarly be attributable to their relatively low abundance and short residence time in the surveyed wetlands, both of which could limit their covariation with native diversity metrics. Consistent with this interpretation, zero-inflation analysis (Table S3) confirmed that non-naturalized and invasive species had very high proportions of zero records across quadrats (79.7–83.5%), indicating that their sparse occurrence may limit the statistical power to detect associations with native diversity metrics.
Unexpectedly, naturalized plants were positively correlated with native diversity metrics, contrasting with their negative associations’ importance values. Specifically, the richness of naturalized plants was positively correlated with native plant richness, and the abundance of naturalized plants was positively correlated with native plant evenness and the Shannon index, suggesting context-dependent non-native effects. This mirrors previous findings where moderate non-native introductions were associated with native coexistence [80,81,82]. We speculate that this pattern may reflect niche partitioning or complementary resource use, whereby the introduction of naturalized plants is associated with greater species co-occurrence within the same community by reducing competitive overlap [26]. In addition, naturalized plants may also ameliorate environmental conditions benefiting certain natives. For example, the presence of non-native grasses enhanced the performance of the native plant Cryptantha muricata in southern California [83]. This positive association does not necessarily arise solely from interspecific interactions. An alternative explanation is offered by the “biotic acceptance hypothesis” [27,81,84]. This hypothesis posits that environmentally favorable sites may support higher richness of both native and naturalized species simultaneously, leading to positive native–non-native richness relationships without invoking direct biotic interactions. We speculate that this positive association may be transient, i.e., as naturalized populations expand toward invasiveness, competitive exclusion may dominate by reducing native importance values as documented here. However, a statistical consideration must also be acknowledged: Berkson’s bias can arise whenever sampling is not fully randomized with respect to community attributes, and our study design may not fully preclude this possibility [85,86]. The observed positive associations between naturalized plants and native diversity metrics may therefore be inflated by this selection, independent of any underlying ecological mechanism. We recommend that future studies employ randomized or stratified-random designs covering the full range of site conditions to avoid this bias.
Elevation emerged as the dominant driver of native plant diversity [87,88]. Elevation explained 63.37% and 82.33% of variance in Shannon–Wiener index and native richness, respectively. The positive elevation–diversity relationship likely reflects evolutionary adaptations and environmental filtering. Native plants at higher elevations have evolved specialized adaptations (e.g., modified leaf morphology, enhanced root systems, and compact growth forms) through prolonged exposure to environmental stressors [89,90]. Harsh high-elevation environments may filter out lowland-adapted non-native species that lack a history of cold adaptation, a pattern consistent with the negative correlation between elevation and non-native richness and abundance shown in Figure 4. Consequently, the reduced pressure from non-natives may create competitive refugia for stress-tolerant native species [28,91]. This pattern also parallels Mediterranean islands, where alien plant richness concentrated at lower elevations while high-elevation regions support diverse native communities with fewer invasives [79]. Therefore, we speculate that elevation promotes native diversity both directly (through native stress tolerance) and indirectly (through associations with fewer non-native competitors).
Notably, MAT and MAP were excluded from the final models during stepwise selection, despite their recognized importance for plant performance [92,93,94]. MAT and MAP are closely correlated with elevation in this system (Figure 4), and we speculate that temperature and precipitation may influence native diversity, but their effects are subsumed by the composite elevational gradient, which integrates temperature, precipitation, UV radiation, wind exposure, frost frequency, and growing-season length [79,95,96]. In mountainous regions, these factors co-vary along elevational gradients, creating complex selective environments where native–non-native dynamics are likely shaped by synergistic effects of multiple stressors [95]. For example, high elevations impose not only low temperatures but also shortened growing seasons, intense UV exposure, and wind stress. These factors are collectively associated with lower non-native occurrence and greater occurrence of natives with integrated stress-tolerance traits [28,91]. Additionally, precipitation’s minimal effect may reflect reduced water limitation in wetland-dominated landscapes where soil moisture is buffered [97]. These findings indicate that in the Ertix River Basin, elevation-based composite gradients better predict native community variation than temperature and precipitation alone, and caution against interpreting effects of temperature or precipitation when embedded within broader environmental contexts.
Across our alpha diversity models, the marginal R2 (variance explained by fixed effects) was generally lower than the conditional R2 (variance explained by both fixed and random effects). This pattern indicates that a portion of the explained variance is associated with unmeasured factors rather than with the predictors included in our models. Potential candidates include soil physicochemical properties, hydrological conditions, grazing intensity, land-use history, and anthropogenic disturbances, all of which are well-documented correlates of wetland plant community composition [98,99,100]. These findings suggest that the factors associated with plant distribution patterns in these wetlands go beyond the climatic and invasion-related predictors examined in this study [101]. We therefore recommend that future research incorporate a broader suite of environmental variables to more comprehensively assess the correlates of native community structure.

5. Conclusions

Our study reveals stage-dependent effects of non-native plant invasions on native wetland communities in northwestern China. Naturalized plants showed stronger negative associations with native importance values compared to invasive species and non-naturalized species, likely reflecting their greater abundance and competitive advantages, though this association is partly compositional in nature. Paradoxically, naturalized plants were positively associated with native diversity metrics, potentially representing transient facilitation that may shift toward competitive exclusion as invasion intensifies. Elevation emerged as the primary predictor through synergistic effects of multiple stressors that exclude non-adapted invasives at higher elevations. These findings suggest that invasive species do not always dominate variation in native plant communities, highlighting the importance of considering invasion stage, environmental context, and multiple community metrics. Our findings suggest several preliminary management implications. High-elevation wetlands may currently experience lower non-native plant pressure, consistent with their potential role as conservation priorities, though this requires confirmation through long-term monitoring. At lower elevations, early detection and rapid response to prevent naturalization may be more effective than controlling established invasive populations, though this recommendation rests on correlative patterns observed in a single-season survey. Future research should track invasion transitions through long-term monitoring and functional trait approaches to develop predictive models for proactive wetland conservation. One caveat is that the environmental characterization in this study is limited, as several variables known to influence plant communities—such as hydrological conditions, soil properties, and land-use factors—were not included. This omission likely constrains the explanatory power of our models, as reflected in the consistent pattern of marginal R2 being lower than conditional R2 across our analyses. Additionally, because our site selection favored wetlands free from major anthropogenic disturbance, the patterns reported here may underestimate non-native plant impacts relative to more degraded systems. We therefore recommend that future studies incorporate a broader suite of environmental variables, particularly hydrological and edaphic measurements, to more comprehensively assess the factors influencing native community structure in these wetland ecosystems.

Supplementary Materials

The following supporting information can be downloaded at: https://www.mdpi.com/article/10.3390/d18070411/s1, Table S1: Complete list of plant species recorded in the Ertix River Basin wetland survey, with invasion status classification. Native and non-naturalized species were identified following Lu et al. [61] and Lin et al. [62]. Naturalized and invasive species were validated using the Naturalized Plants of China (NPC; https://www.iplant.cn/npc/, accessed on 29 June 2026) and Invasive Alien Species in China (IASC; https://www.plantplus.cn/ias/, accessed on 29 June 2026) databases. Classification follows the frameworks of Richardson et al. [17], Blackburn et al. [60], and Pyšek et al. [16]; Table S2: Individual-based rarefaction results. For each rarefaction threshold, the number of usable quadrats (those with total native individuals ≥ the threshold), mean rarefied species richness, and Pearson correlation coefficient between elevation and rarefied richness are reported. The raw (un-rarefied) data are shown for comparison; Table S3: Proportion of zero records for non-native predictor variables across 158 quadrats; Table S4: Benjamini-Hochberg correction across the four models. All nine terms remain significant after BH correction (α = 0.05). Core results are unchanged; Figure S1: Model diagnostics for importance value (IV). The KS uniformity test and combined adjusted quantile test were significant for the IV model. This deviation is attributable to inherent properties of the importance value metric (values are bounded between 0 and 1, and share a compositional dependency with non-native abundance) rather than to model misspecification. Linear mixed-effects models are generally robust to moderate departures from residual normality at the sample size used here (n = 158); Figure S2: Model diagnostics for native richness. The combined adjusted quantile test was significant, but the Kolmogorov-Smirnov, dispersion, and outlier tests were all non-significant. The combined test aggregates deviation signals across all quantiles and is more sensitive than the individual tests; when all three individual tests pass, a significant combined test typically reflects minor deviations that are unlikely to meaningfully affect parameter estimates or inference; Figure S3: Model diagnostics for Pielou evenness. Only one fixed-effect predictor retained, VIF not applicable; Figure S4: Model diagnostics for Shannon-Wiener diversity. The combined adjusted quantile test was significant, but the Kolmogorov-Smirnov, dispersion, and outlier tests were all non-significant. The combined test aggregates deviation signals across all quantiles and is more sensitive than the individual tests, when all three individual tests pass, a significant combined test typically reflects minor deviations that are unlikely to meaningfully affect parameter estimates or inference; Figure S5: Individual-based rarefaction analysis testing whether the positive elevation–native species richness relationship is affected by differences in plant density across quadrats. For each quadrat, native plants were randomly resampled to a fixed number of individuals (N = 50, N = 100, N = 200; 1000 iterations per quadrat) to remove the effect of varying total abundance on richness estimates. Red lines show linear regressions with 95% confidence bands. The stability of the Pearson correlation coefficients (r) across all three rarefaction thresholds indicates that the elevation–richness relationship is not an artifact of differences in plant density, and that uniformly sized 1 m2 quadrats capture species richness with comparable efficiency across the elevational gradient.

Author Contributions

Conceptualization, J.-Q.G. and B.-C.D.; methodology, X.-M.C., Y.-F.Z., H.-C.C., and B.-C.D.; formal analysis, X.-M.C., M.-Y.L., Y.-F.Z., H.-C.C., and B.-C.D.; investigation, X.-M.C., J.-Q.G., and B.-C.D.; data curation, X.-M.C., Y.-F.Z., M.-Y.L., H.-C.C., and B.-C.D.; writing—original draft preparation, X.-M.C.; writing—review and editing, X.-M.C., Y.-F.Z., M.O.A., H.-C.C., M.-Y.L., J.-Q.G., B.-C.D., M.-H.L., and F.-H.Y.; supervision, J.-Q.G., B.-C.D., and M.-H.L. All authors have read and agreed to the published version of the manuscript.

Funding

This research was supported by National Key R&D Program of China (2023YFE0124900), the Third Xinjiang Scientific Expedition Program (2021xjkk0601) and the National Natural Science Foundation of China (31500331).

Data Availability Statement

The complete analysis pipeline and datasets are publicly available in a GitHub repository: https://github.com/harborseal123/Impacts-of-climate-change-and-invasion-on-Ertix-River-Basin-wetland-flora (accessed on 29 June 2026).

Acknowledgments

We thank Hua-Bin Liu for providing survey photos and Xing-Li Li, Hua-Bin Liu, Zi-Tong Tang and Ran Dong for survey assistance.

Conflicts of Interest

The authors declare no conflicts of interest.

Abbreviations

The following abbreviations are used in this manuscript:
MATMean annual temperature
MAPMean annual precipitation
IVImportance value
NatAAbundance of naturalized plants
NatRRichness of naturalized plants
Non-natAAbundance of non-naturalized plants
Non-natRRichness of non-naturalized plants
InvAAbundance of invasive plants
InvRRichness of invasive plants

References

  1. DeBerry, D.A.; Hunter, D.M. Impacts of Invasive Plants on Native Vegetation Communities in Wetland and Stream Mitigation. Biology 2024, 13, 275. [Google Scholar] [CrossRef] [PubMed]
  2. Hovick, S.M.; Adams, C.R.; Anderson, N.O.; Kettenring, K.M. Progress on Mechanisms and Impacts of Wetland Plant Invasions: A Twenty-Year Retrospective Analysis and Priorities for the next Twenty. Crit. Rev. Plant Sci. 2023, 42, 239–282. [Google Scholar] [CrossRef]
  3. Pyšek, P.; Hulme, P.E.; Simberloff, D.; Bacher, S.; Blackburn, T.M.; Carlton, J.T.; Dawson, W.; Essl, F.; Foxcroft, L.C.; Genovesi, P.; et al. Scientists’ Warning on Invasive Alien Species. Biol. Rev. 2020, 95, 1511–1534. [Google Scholar] [CrossRef] [PubMed]
  4. Catford, J.A.; Bode, M.; Tilman, D. Introduced Species That Overcome Life History Tradeoffs Can Cause Native Extinctions. Nat. Commun. 2018, 9, 2131. [Google Scholar] [CrossRef] [PubMed]
  5. Vilà, M.; Hulme, P.E. (Eds.) Impact of Biological Invasions on Ecosystem Services; Springer International Publishing: Cham, Switzerland, 2017. [Google Scholar]
  6. Ren, J.L.; Chen, J.S.; Xu, C.L.; van de Koppel, J.; Thomsen, M.S.; Qiu, S.Y.; Cheng, F.Y.; Song, W.J.; Liu, Q.X.; Xu, C.; et al. An Invasive Species Erodes the Performance of Coastal Wetland Protected Areas. Sci. Adv. 2021, 7, eabi8943. [Google Scholar] [CrossRef] [PubMed]
  7. Yang, R.M. Interacting Effects of Plant Invasion, Climate, and Soils on Soil Organic Carbon Storage in Coastal Wetlands. J. Geophys. Res. Biogeosci. 2019, 124, 2554–2564. [Google Scholar] [CrossRef]
  8. Chen, L.Z. Invasive Plants in Coastal Wetlands: Patterns and Mechanisms. In Wetlands: Ecosystem Services, Restoration and Wise Use; An, S.Q., Verhoeven, J.T.A., Eds.; Springer International Publishing: Cham, Switzerland, 2019; pp. 97–128. [Google Scholar]
  9. Fang, X.H.; Chen, X.M.; Liu, R.L.; Zhang, S.H.; Gao, J.Q.; Dong, B.C.; Yu, F.H. Effects of Alligator Weed Invasion on Wetlands in Protected Areas: A Case Study of Lishui Jiulong National Wetland Park. Sci. Total Environ. 2024, 953, 176230. [Google Scholar] [CrossRef] [PubMed]
  10. Yang, Y.B.; Bian, Z.H.; Ren, W.J.; Wu, J.H.; Liu, J.Q.; Shrestha, N. Spatial Patterns and Hotspots of Plant Invasion in China. Glob. Ecol. Conserv. 2023, 43, e02424. [Google Scholar] [CrossRef]
  11. Luo, K.Y.; Samat, A.; Abuduwaili, J.; Li, W.B. Evaluation of Remote Sensing Products for Wetland Mapping in the Irtysh River Basin. Geosciences 2024, 14, 14. [Google Scholar] [CrossRef]
  12. Xue, Z.F.; Liu, T.; Wang, L.S.; Song, J.H.; Chen, H.Y.; Xu, L.; Yuan, Y. Community Structure and Characteristics of Plain Valley Forests in Main Tributaries of Ertix River Basin, China. Chin. J. Plant Ecol. 2024, 48, 390. [Google Scholar] [CrossRef]
  13. Zhang, X.M.; Zhang, D.M.; Zhang, W. Effects of Human Activities on Carbon Storage in the Irtysh River Basin. Arid Zone Res. 2023, 40, 1333–1345. [Google Scholar] [CrossRef]
  14. Gioria, M.; Hulme, P.E.; Richardson, D.M.; Pyšek, P. Why Are Invasive Plants Successful? Annu. Rev. Plant Biol. 2023, 74, 635–670. [Google Scholar] [CrossRef] [PubMed]
  15. Novoa, A.; Richardson, D.M.; Pyšek, P.; Meyerson, L.A.; Bacher, S.; Canavan, S.; Catford, J.A.; Čuda, J.; Essl, F.; Foxcroft, L.C.; et al. Invasion Syndromes: A Systematic Approach for Predicting Biological Invasions and Facilitating Effective Management. Biol. Invasions 2020, 22, 1801–1820. [Google Scholar] [CrossRef]
  16. Pyšek, P.; Bacher, S.; Kühn, I.; Novoa, A.; Catford, J.A.; Hulme, P.E.; Pergl, J.; Richardson, D.M.; Wilson, J.R.U.; Blackburn, T.M. MAcroecological Framework for Invasive Aliens (MAFIA): Disentangling Large-Scale Context Dependence in Biological Invasions. NeoBiota 2020, 62, 407. [Google Scholar] [CrossRef]
  17. Richardson, D.M.; Pyšek, P.; Rejmánek, M.; Barbour, M.G.; Panetta, F.D.; West, C.J. Naturalization and Invasion of Alien Plants: Concepts and Definitions. Divers. Distrib. 2000, 6, 93–107. [Google Scholar] [CrossRef]
  18. Funk, J.L.; Vitousek, P.M. Resource-Use Efficiency and Plant Invasion in Low-Resource Systems. Nature 2007, 446, 1079–1081. [Google Scholar] [CrossRef] [PubMed]
  19. Li, J.; He, J.Z.; Liu, M.; Yan, Z.Q.; Xu, X.L.; Kuzyakov, Y. Invasive Plant Competitivity Is Mediated by Nitrogen Use Strategies and Rhizosphere Microbiome. Soil Biol. Biochem. 2024, 192, 109361. [Google Scholar] [CrossRef]
  20. Zhang, Y.L.; Zhang, Y.Y.; Zhang, L.H.; Yang, H.J.; Ma, T.X.; Huang, C.Y.; Hu, L.Y.; Zhang, M.X.; Sang, W.G. Enhanced Competitive Advantage of Invasive Plants by Growth-Defence Trade-off: Evidence from Phytohormone Metabolism and Transcriptomic Analysis. J. Appl. Ecol. 2025, 62, 1980–1992. [Google Scholar] [CrossRef]
  21. Adomako, M.O.; Ning, L.; Tang, M.; Du, D.L.; van Kleunen, M.; Yu, F.H. Diversity- and Density-Mediated Allelopathic Effects of Resident Plant Communities on Invasion by an Exotic Plant. Plant Soil 2019, 440, 581–592. [Google Scholar] [CrossRef]
  22. Hess, M.C.M.; Mesléard, F.; Buisson, E. Priority Effects: Emerging Principles for Invasive Plant Species Management. Ecol. Eng. 2019, 127, 48–57. [Google Scholar] [CrossRef]
  23. Zhang, Z.J.; van Kleunen, M. Common Alien Plants Are More Competitive than Rare Natives but Not than Common Natives. Ecol. Lett. 2019, 22, 1378–1386. [Google Scholar] [CrossRef] [PubMed]
  24. Wang, X.Y.; Wang, X.; Wang, W.; Wang, J.; Yu, F.H. Effects of Invasive Plant Diversity on Soil Microbial Communities. Diversity 2022, 14, 992. [Google Scholar] [CrossRef]
  25. Xu, H.W.; Liu, Q.; Wang, S.Y.; Yang, G.S.; Xue, S. A Global Meta-Analysis of the Impacts of Exotic Plant Species Invasion on Plant Diversity and Soil Properties. Sci. Total Environ. 2022, 810, 152286. [Google Scholar] [CrossRef] [PubMed]
  26. Cavieres, L.A. Facilitation and the Invasibility of Plant Communities. J. Ecol. 2021, 109, 2019–2028. [Google Scholar] [CrossRef]
  27. Fridley, J.D.; Brown, R.L.; Bruno, J.F. Null Models of Exotic Invasion and Scale-Dependent Patterns of Native and Exotic Species Richness. Ecology 2004, 85, 3215–3222. [Google Scholar] [CrossRef]
  28. Alexander, J.M.; Kueffer, C.; Daehler, C.C.; Edwards, P.J.; Pauchard, A.; Seipel, T.; Null, N.; Arévalo, J.; Cavieres, L.; Dietz, H.; et al. Assembly of Nonnative Floras along Elevational Gradients Explained by Directional Ecological Filtering. Proc. Natl. Acad. Sci. USA 2011, 108, 656–661. [Google Scholar] [CrossRef] [PubMed]
  29. Zu, K.L.; Wang, Z.H.; Chen, F.S.; Lenoir, J.; Fang, X.M.; Wang, F.C.; Bu, W.S.; Li, J.J.; Luo, Y.; Wang, Y.Y.; et al. Climate-Driven Variability in Flowering Phenology Changes across Subtropical Mountains: Traits, Elevation Shifts, and Biogeographic Patterns. Glob. Change Biol. 2025, 31, e70516. [Google Scholar] [CrossRef] [PubMed]
  30. Di Febbraro, M.; Bosso, L.; Fasola, M.; Santicchia, F.; Aloise, G.; Lioy, S.; Tricarico, E.; Ruggieri, L.; Bovero, S.; Mori, E.; et al. Different Facets of the Same Niche: Integrating Citizen Science and Scientific Survey Data to Predict Biological Invasion Risk under Multiple Global Change Drivers. Glob. Change Biol. 2023, 29, 5509–5523. [Google Scholar] [CrossRef] [PubMed]
  31. Cleland, E.E.; Wolkovich, E.M. Effects of Phenology on Plant Community Assembly and Structure. Annu. Rev. Ecol. Evol. Syst. 2024, 55, 471–492. [Google Scholar] [CrossRef]
  32. Lorer, E.; De Frenne, P.; Verheyen, K.; Landuyt, D. Intra-Annual Growth Dynamics of Forest Understorey Herbaceous Plant Species in Response to Global Change. J. Ecol. 2025, 113, 3717–3734. [Google Scholar] [CrossRef]
  33. Chen, B.M.; Gao, Y.; Liao, H.X.; Peng, S.L. Differential Responses of Invasive and Native Plants to Warming with Simulated Changes in Diurnal Temperature Ranges. AoB Plants 2017, 9, plx028. [Google Scholar] [CrossRef] [PubMed]
  34. Wang, Y.J.; Müller-Schärer, H.; van Kleunen, M.; Cai, A.M.; Zhang, P.; Yan, R.; Dong, B.C.; Yu, F.H. Invasive Alien Plants Benefit More from Clonal Integration in Heterogeneous Environments than Natives. New Phytol. 2017, 216, 1072–1078. [Google Scholar] [CrossRef] [PubMed]
  35. Chiuffo, M.C.; Moyano, J.; Policelli, N.; Torres, A.; Vitali, A.; Nuñez, M.A.; Rodriguez-Cabal, M.A. Importance of Invasion Mechanisms Varies with Abiotic Context and Plant Invader Growth Form. J. Ecol. 2022, 110, 1957–1969. [Google Scholar] [CrossRef]
  36. Geppert, C.; Boscutti, F.; La Bella, G.; De Marchi, V.; Corcos, D.; Filippi, A.; Marini, L. Contrasting Response of Native and Non-Native Plants to Disturbance and Herbivory in Mountain Environments. J. Biogeogr. 2021, 48, 1594–1605. [Google Scholar] [CrossRef]
  37. Whittaker, R.H. Evolution and measurement of species diversity. Taxon 1972, 21, 213–251. [Google Scholar] [CrossRef]
  38. Magurran, A.E. Measuring Biological Diversity; John Wiley & Sons: Hoboken, NJ, USA, 2003. [Google Scholar]
  39. Gotelli, N.J.; Colwell, R.K. Quantifying Biodiversity: Procedures and Pitfalls in the Measurement and Comparison of Species Richness. Ecol. Lett. 2001, 4, 379–391. [Google Scholar] [CrossRef]
  40. Hillebrand, H.; Bennett, D.M.; Cadotte, M.W. Consequences of Dominance: A Review of Evenness Effects on Local and Regional Ecosystem Processes. Ecology 2008, 89, 1510–1520. [Google Scholar] [CrossRef] [PubMed]
  41. Levin, S.A.; Carpenter, S.R.; Godfray, H.C.J.; Kinzig, A.P.; Loreau, M.; Losos, J.B.; Walker, B.; Wilcove, D.S. (Eds.) The Princeton Guide to Ecology; Princeton University Press: Princeton, NJ, USA, 2009. [Google Scholar]
  42. Pielou, E.C. The Measurement of Diversity in Different Types of Biological Collections. J. Theor. Biol. 1966, 13, 131–144. [Google Scholar] [CrossRef]
  43. Smith, B.; Wilson, J.B. A Consumer’s Guide to Evenness Indices. Oikos 1996, 76, 70–82. [Google Scholar] [CrossRef]
  44. Jost, L. Entropy and Diversity. Oikos 2006, 113, 363–375. [Google Scholar] [CrossRef]
  45. Spellerberg, I.F.; Fedor, P.J. A Tribute to Claude Shannon (1916–2001) and a Plea for More Rigorous Use of Species Richness, Species Diversity and the ‘Shannon–Wiener’ Index. Glob. Ecol. Biogeogr. 2003, 12, 177–179. [Google Scholar] [CrossRef]
  46. Small, A.; Martin, T.G.; Kitching, R.L.; Wong, K.M. Contribution of Tree Species to the Biodiversity of a 1ha Old World Rainforest in Brunei, Borneo. Biodivers. Conserv. 2004, 13, 2067–2088. [Google Scholar] [CrossRef]
  47. Meli, P.; Martínez-Ramos, M.; Rey-Benayas, J.M.; Carabias, J. Combining Ecological, Social and Technical Criteria to Select Species for Forest Restoration. Appl. Veg. Sci. 2014, 17, 744–753. [Google Scholar] [CrossRef]
  48. Wang, G.R.; Sun, Y.; Zhou, M.; Guan, N.Q.; Wang, Y.W.; Jiang, R.H.; Liu, Z.Y.; Wu, M.J.; Xia, F.C. Effect of Thinning Intensity on Understory Herbaceous Diversity and Biomass in Mixed Coniferous and Broad-Leaved Forests of Changbai Mountain. For. Ecosyst. 2021, 8, 53. [Google Scholar] [CrossRef]
  49. Liu, Y.X.; Samat, A.; Wenbo, L.I.; Abuduwaili, J. Spatiotemporal Characteristics and Driving Factors of the Fractional Vegetation Coverage in the Ertix River Basin. Reg. Sustain. 2025, 6, 100227. [Google Scholar] [CrossRef]
  50. Sydykov, Y.; Sailaubay, Y.; Maslov, K.; Zhanbossinova, A.; Detochkina, V. Irtysh: Environmental Risks and Threats. BIO Web Conf. 2025, 179, 14005. [Google Scholar] [CrossRef]
  51. Xia, Y.; Cao, Q.M.; Zeng, Y.; Yang, M.L. Invasion risk assessment of alien plants in Irtysh River Basin. J. Ecol. Rural Environ. 2025, 41, 1566–1575. [Google Scholar] [CrossRef]
  52. Li, X.J.; Jia, P.Y.; Niu, C.Y.; Xing, Y.C.; Li, H.L.; Liu, H.B.; Tang, W.Q.; Zhao, Y.H. Species Diversity of Freshwater Fish and Assessment on Watershed Health in the Irtysh River and Ulungur River Basins in Xinjiang, China. Biodivers. Sci. 2020, 28, 422. [Google Scholar] [CrossRef]
  53. Li, Y.M.; Xue, Z.F.; Liu, T.; Song, J.H.; Yuan, Y.; Xu, L.; Zhang, Z.D. Genetic Diversity of Dominant Species Betula pendula in River Valley Forests in the Irtysh River Basin and Sustainable Conservation Measures for the Future. Sustainability 2024, 16, 3217. [Google Scholar] [CrossRef]
  54. Wang, D.; Zhang, S.H.; Wang, G.L.; Gu, J.J.; Wang, H.; Chen, X.T. Ecohydrological Variation and Multi-Objective Ecological Water Demand of the Irtysh River Basin. Water 2022, 14, 2876. [Google Scholar] [CrossRef]
  55. Guo, K.; Liu, C.C.; Pan, Q.M. Methods of Observing Typical Plant Communities in the Steppe and Desert Biodiversity Observation Network, Sino BON. Biodivers. Sci. 2016, 24, 1220. [Google Scholar] [CrossRef]
  56. Song, C.Y.; Liu, C.C.; Guo, K. Plan and Construction Progress of the Steppe and Desert Plants Diversity Observation Network. Biodivers. Sci. 2023, 31, 23383. [Google Scholar] [CrossRef]
  57. Chytrý, M.; Otýpková, Z. Plot Sizes Used for Phytosociological Sampling of European Vegetation. J. Veg. Sci. 2003, 14, 563–570. [Google Scholar] [CrossRef]
  58. Hill, D.A. Handbook of Biodiversity Methods: Survey, Evaluation and Monitoring; Cambridge University Press: Cambridge, UK, 2005. [Google Scholar]
  59. Brown, M.J.M.; Walker, B.E.; Black, N.; Govaerts, R.H.A.; Ondo, I.; Turner, R.; Nic Lughadha, E. RWCVP: A Companion R Package for the World Checklist of Vascular Plants. New Phytol. 2023, 240, 1355–1365. [Google Scholar] [CrossRef] [PubMed]
  60. Blackburn, T.M.; Pyšek, P.; Bacher, S.; Carlton, J.T.; Duncan, R.P.; Jarošík, V.; Wilson, J.R.U.; Richardson, D.M. A Proposed Unified Framework for Biological Invasions. Trends Ecol. Evol. 2011, 26, 333–339. [Google Scholar] [CrossRef] [PubMed]
  61. Lu, L.M.; Mao, L.F.; Yang, T.; Ye, J.F.; Liu, B.; Li, H.L.; Sun, M.; Miller, J.T.; Mathews, S.; Hu, H.H.; et al. Evolutionary History of the Angiosperm Flora of China. Nature 2018, 554, 234–238. [Google Scholar] [CrossRef] [PubMed]
  62. Lin, Q.W.; Xiao, C.; Ma, J.H. A Dataset on Catalogue of Alien Plants in China. Biodivers. Sci. 2022, 30, 22127. [Google Scholar] [CrossRef]
  63. Hijmans, R.J. raster: Geographic Data Analysis and Modeling; R package version 3.6-32. Available online: https://CRAN.R-project.org/package=raster (accessed on 29 June 2026).
  64. Peng, S.Z.; Ding, Y.X.; Liu, W.Z.; Li, Z. 1 Km Monthly Temperature and Precipitation Dataset for China from 1901 to 2017. Earth Syst. Sci. Data 2019, 11, 1931–1946. [Google Scholar] [CrossRef]
  65. Pierce, D. ncdf4: Interface to Unidata netCDF (Version 4 or Earlier) Format Data Files; R package version 1.24. Available online: https://cran.r-project.org/web/packages/ncdf4/index.html (accessed on 29 June 2026).
  66. Dong, S.Q.; Hou, D.J.; Qu, X.Y.; Guo, K. A Plot-Based Dataset of Plant Communities on the Qaidam Basin, China. Chin. J. Plant Ecol. 2024, 48, 534. [Google Scholar] [CrossRef]
  67. Al-Kofahi, S.D.; Al-Kafawin, A.M.; Al-Gharaibeh, M.M. Investigating Domestic Gardens Landscape Plant Diversity, Implications for Valuable Plant Species Conservation. Environ. Dev. Sustain. 2024, 26, 21259–21279. [Google Scholar] [CrossRef]
  68. Oksanen, J.; Blanchet, F.G.; Friendly, M.; Kindt, R.; Legendre, P.; McGlinn, D.; Minchin, P.R.; O’Hara, R.B.; Simpson, G.L.; Solymos, P.; et al. vegan: Community Ecology Package; R package version 2.7-5. Available online: https://cran.r-project.org/web/packages/vegan/index.html (accessed on 29 June 2026).
  69. Panero, I.; Santangelo, A.; Strumia, S.; Aronne, G.; Buonanno, M.; Fabrini, G.; Cambria, V.E.; Fanelli, G.; Montagna, D.L.; Attorre, F.; et al. Iconic, Rare, Endemic and Threatened: Macroecological Insights to Support Conservation and Management of Primula palinuri. Biodivers. Conserv. 2026, 35, 115. [Google Scholar] [CrossRef]
  70. Hailegiorgis, T.; Lemessa, D.; Melese, D.; Abebe, M.; Nemomissa, S. Modeling the Spatiotemporal Habitat Suitability Distributions of Cultural Keystone Bidens macroptera (Adey Abeba) under Climate Change Scenarios in Ethiopia. Ecol. Evol. 2025, 15, e72115. [Google Scholar] [CrossRef] [PubMed]
  71. Bates, D.; Mächler, M.; Bolker, B.; Walker, S. Fitting Linear Mixed-Effects Models Using Lme4. J. Stat. Softw. 2015, 67, 1–48. [Google Scholar] [CrossRef]
  72. Lai, J.S.; Zou, Y.; Zhang, S.; Zhang, X.G.; Mao, L.F. Glmm.hp: An R Package for Computing Individual Effect of Predictors in Generalized Linear Mixed Models. J. Plant Ecol. 2022, 15, 1302–1307. [Google Scholar] [CrossRef]
  73. R Core Team. R: A Language and Environment for Statistical Computing; R Foundation for Statistical Computing: Vienna, Austria, 2024; Available online: https://www.R-project.org/ (accessed on 29 June 2026).
  74. Garbowski, M.; Laughlin, D.C.; Blumenthal, D.M.; Sofaer, H.R.; Barnett, D.T.; Beaury, E.M.; Buonaiuto, D.M.; Corbin, J.D.; Dukes, J.S.; Early, R.; et al. Naturalized Species Drive Functional Trait Shifts in Plant Communities. Proc. Natl. Acad. Sci. USA 2024, 121, e2403120121. [Google Scholar] [CrossRef] [PubMed]
  75. Sukopp, H.; Sukopp, U. Ecological Long-Term Effects of Cultigens Becoming Feral and of Naturalization of Non-Native Species. Experientia 1993, 49, 210–218. [Google Scholar] [CrossRef]
  76. Kato-Noguchi, H.; Kato, M. Allelopathy and Allelochemicals of Solidago canadensis L. and S. altissima L. Their Naturalization. Plants 2022, 11, 3235. [Google Scholar] [CrossRef] [PubMed]
  77. Kinlock, N.L.; Dehnen-Schmutz, K.; Essl, F.; Pergl, J.; Pyšek, P.; Kreft, H.; Weigelt, P.; Yang, Q.; van Kleunen, M. Introduction History Mediates Naturalization and Invasiveness of Cultivated Plants. Glob. Ecol. Biogeogr. 2022, 31, 1104–1119. [Google Scholar] [CrossRef]
  78. Richardson, D.M.; Pyšek, P. Naturalization of Introduced Plants: Ecological Drivers of Biogeographical Patterns. New Phytol. 2012, 196, 383–396. [Google Scholar] [CrossRef] [PubMed]
  79. Di Musciano, M.; Calvia, G.; Ruggero, A.; Farris, E.; Ricci, L.; Frattaroli, A.R.; Bagella, S. Elevational Patterns of Plant Species Richness and Phylogenetic Diversity in a Mediterranean Island. Perspect. Plant Ecol. Evol. Syst. 2024, 65, 125815. [Google Scholar] [CrossRef]
  80. Peng, S.J.; Kinlock, N.L.; Gurevitch, J.; Peng, S.L. Correlation of Native and Exotic Species Richness: A Global Meta-Analysis Finds No Invasion Paradox across Scales. Ecology 2019, 100, e02552. [Google Scholar] [CrossRef] [PubMed]
  81. Sax, D.F. Native and Naturalized Plant Diversity Are Positively Correlated in Scrub Communities of California and Chile. Divers. Distrib. 2002, 8, 193–210. [Google Scholar] [CrossRef]
  82. Wei, G.W.; van Kleunen, M. Soil Heterogeneity Tends to Promote the Growth of Naturalized Aliens When Competing with Native Plant Communities. J. Ecol. 2022, 110, 1161–1173. [Google Scholar] [CrossRef]
  83. Pec, G.J.; Carlton, G.C. Positive Effects of Non-Native Grasses on the Growth of a Native Annual in a Southern California Ecosystem. PLoS ONE 2014, 9, e112437. [Google Scholar] [CrossRef] [PubMed]
  84. Stohlgren, T.J.; Binkley, D.; Chong, G.W.; Kalkhan, M.A.; Schell, L.D.; Bull, K.A.; Otsuki, Y.; Newman, G.; Bashkin, M.; Son, Y. Exotic Plant Species Invade Hot Spots of Native Plant Diversity. Ecol. Monogr. 1999, 69, 25–46. [Google Scholar] [CrossRef]
  85. Hernán, M.A.; Hernández-Díaz, S.; Robins, J.M. A Structural Approach to Selection Bias. Epidemiology 2004, 15, 615–625. [Google Scholar] [CrossRef] [PubMed]
  86. Berkson, J. Limitations of the Application of Fourfold Table Analysis to Hospital Data. Biom. Bull. 1946, 2, 47–53. [Google Scholar] [CrossRef]
  87. Xiong, W.Y.; Cheng, T.; Liu, S.J.; Liu, X.; Ding, H.C.; Yin, M.D.; Sun, W.G.; Zhang, Y.Z. Diversity Patterns, Abiotic and Biotic Drivers, and Future Dynamics of Native Invasive Plants on the Qinghai-Tibet Plateau. Front. Plant Sci. 2025, 16, 171536. [Google Scholar] [CrossRef] [PubMed]
  88. Di Pasquale, G.; Saracino, A.; Bosso, L.; Russo, D.; Moroni, A.; Bonanomi, G.; Allevato, E. Coastal Pine-Oak Glacial Refugia in the Mediterranean Basin: A Biogeographic Approach Based on Charcoal Analysis and Spatial Modelling. Forests 2020, 11, 673. [Google Scholar] [CrossRef]
  89. Halbritter, A.H.; Fior, S.; Keller, I.; Billeter, R.; Edwards, P.J.; Holderegger, R.; Karrenberg, S.; Pluess, A.R.; Widmer, A.; Alexander, J.M. Trait Differentiation and Adaptation of Plants along Elevation Gradients. J. Evol. Biol. 2018, 31, 784–800. [Google Scholar] [CrossRef] [PubMed]
  90. Wang, L.N.; Gesang, Q.Z.; Luo, J.F.; Wu, X.L.; Rebi, A.; You, Y.G.; Zhou, J.X. Drivers of Plant Diversification along an Altitudinal Gradient in the Alpine Desert Grassland, Northern Tibetan Plateau. Glob. Ecol. Conserv. 2024, 53, e02987. [Google Scholar] [CrossRef]
  91. Siniscalco, C.; Barni, E.; Bacaro, G. Non-Native Species Distribution along the Elevation Gradient in the Western Italian Alps. Plant Biosyst. 2011, 145, 150–158. [Google Scholar] [CrossRef]
  92. Chaudhry, S.; Sidhu, G.P.S. Climate Change Regulated Abiotic Stress Mechanisms in Plants: A Comprehensive Review. Plant Cell Rep. 2022, 41, 1–31. [Google Scholar] [CrossRef] [PubMed]
  93. Feeley, K.J.; Bravo-Avila, C.; Fadrique, B.; Perez, T.M.; Zuleta, D. Climate-Driven Changes in the Composition of New World Plant Communities. Nat. Clim. Change 2020, 10, 965–970. [Google Scholar] [CrossRef]
  94. Morecroft, M.D.; Paterson, J.S. Effects of Temperature and Precipitation Changes on Plant Communities. In Plant Growth and Climate Change; John Wiley & Sons, Ltd.: Hoboken, NJ, USA, 2006; pp. 146–164. [Google Scholar]
  95. He, X.R.; Arif, M.; Zheng, J.; Ni, X.L.; Yuan, Z.X.; Zhu, Q.; Wang, J.F.; Ding, D.D.; Li, C.X. Plant Diversity Patterns along an Elevation Gradient: The Relative Impact of Environmental and Spatial Variation on Plant Diversity and Assembly in Arid and Semi-Arid Regions. Front. Environ. Sci. 2023, 11, 1021157. [Google Scholar] [CrossRef]
  96. Wu, F.F.; Liu, N.; He, C.M.; Yuan, Z.Q.; Hao, Z.Q.; Yin, Q.L. Elevational Gradient Pattern of Woody Plant Community Structure and Diversity in the Qinling Mountains. Biodivers. Sci. 2024, 32, 24239. [Google Scholar] [CrossRef]
  97. Kong, Z.; Wang, T.J.; Han, Q.; Dai, Y.B.; Zuo, Y.T.; Wang, L.C.; Lang, Y.C. Impacts of Environmental Factors on Ecosystem Water Use Efficiency: An Insight from Gross Primary Production and Evapotranspiration Dynamics. Agric. For. Meteorol. 2025, 362, 110382. [Google Scholar] [CrossRef]
  98. Lou, Y.J.; Pan, Y.W.; Gao, C.Y.; Jiang, M.; Lu, X.G.; Xu, Y.J. Response of Plant Height, Species Richness and Aboveground Biomass to Flooding Gradient along Vegetation Zones in Floodplain Wetlands, Northeast China. PLoS ONE 2016, 11, e0153972. [Google Scholar] [CrossRef] [PubMed]
  99. Toogood, S.E.; Joyce, C.B. Effects of Raised Water Levels on Wet Grassland Plant Communities. Appl. Veg. Sci. 2009, 12, 283–294. [Google Scholar] [CrossRef]
  100. Moor, H.; Rydin, H.; Hylander, K.; Nilsson, M.B.; Lindborg, R.; Norberg, J. Towards a Trait-Based Ecology of Wetland Vegetation. J. Ecol. 2017, 105, 1623–1635. [Google Scholar] [CrossRef]
  101. Sieben, E.J.J.; Collins, N.B.; Mtshali, H.; Venter, C.E. The Vegetation of Inland Wetlands with Salt-Tolerant Vegetation in South Africa: Description, Classification and Explanatory Environmental Factors. S. Afr. J. Bot. 2016, 104, 199–207. [Google Scholar] [CrossRef]
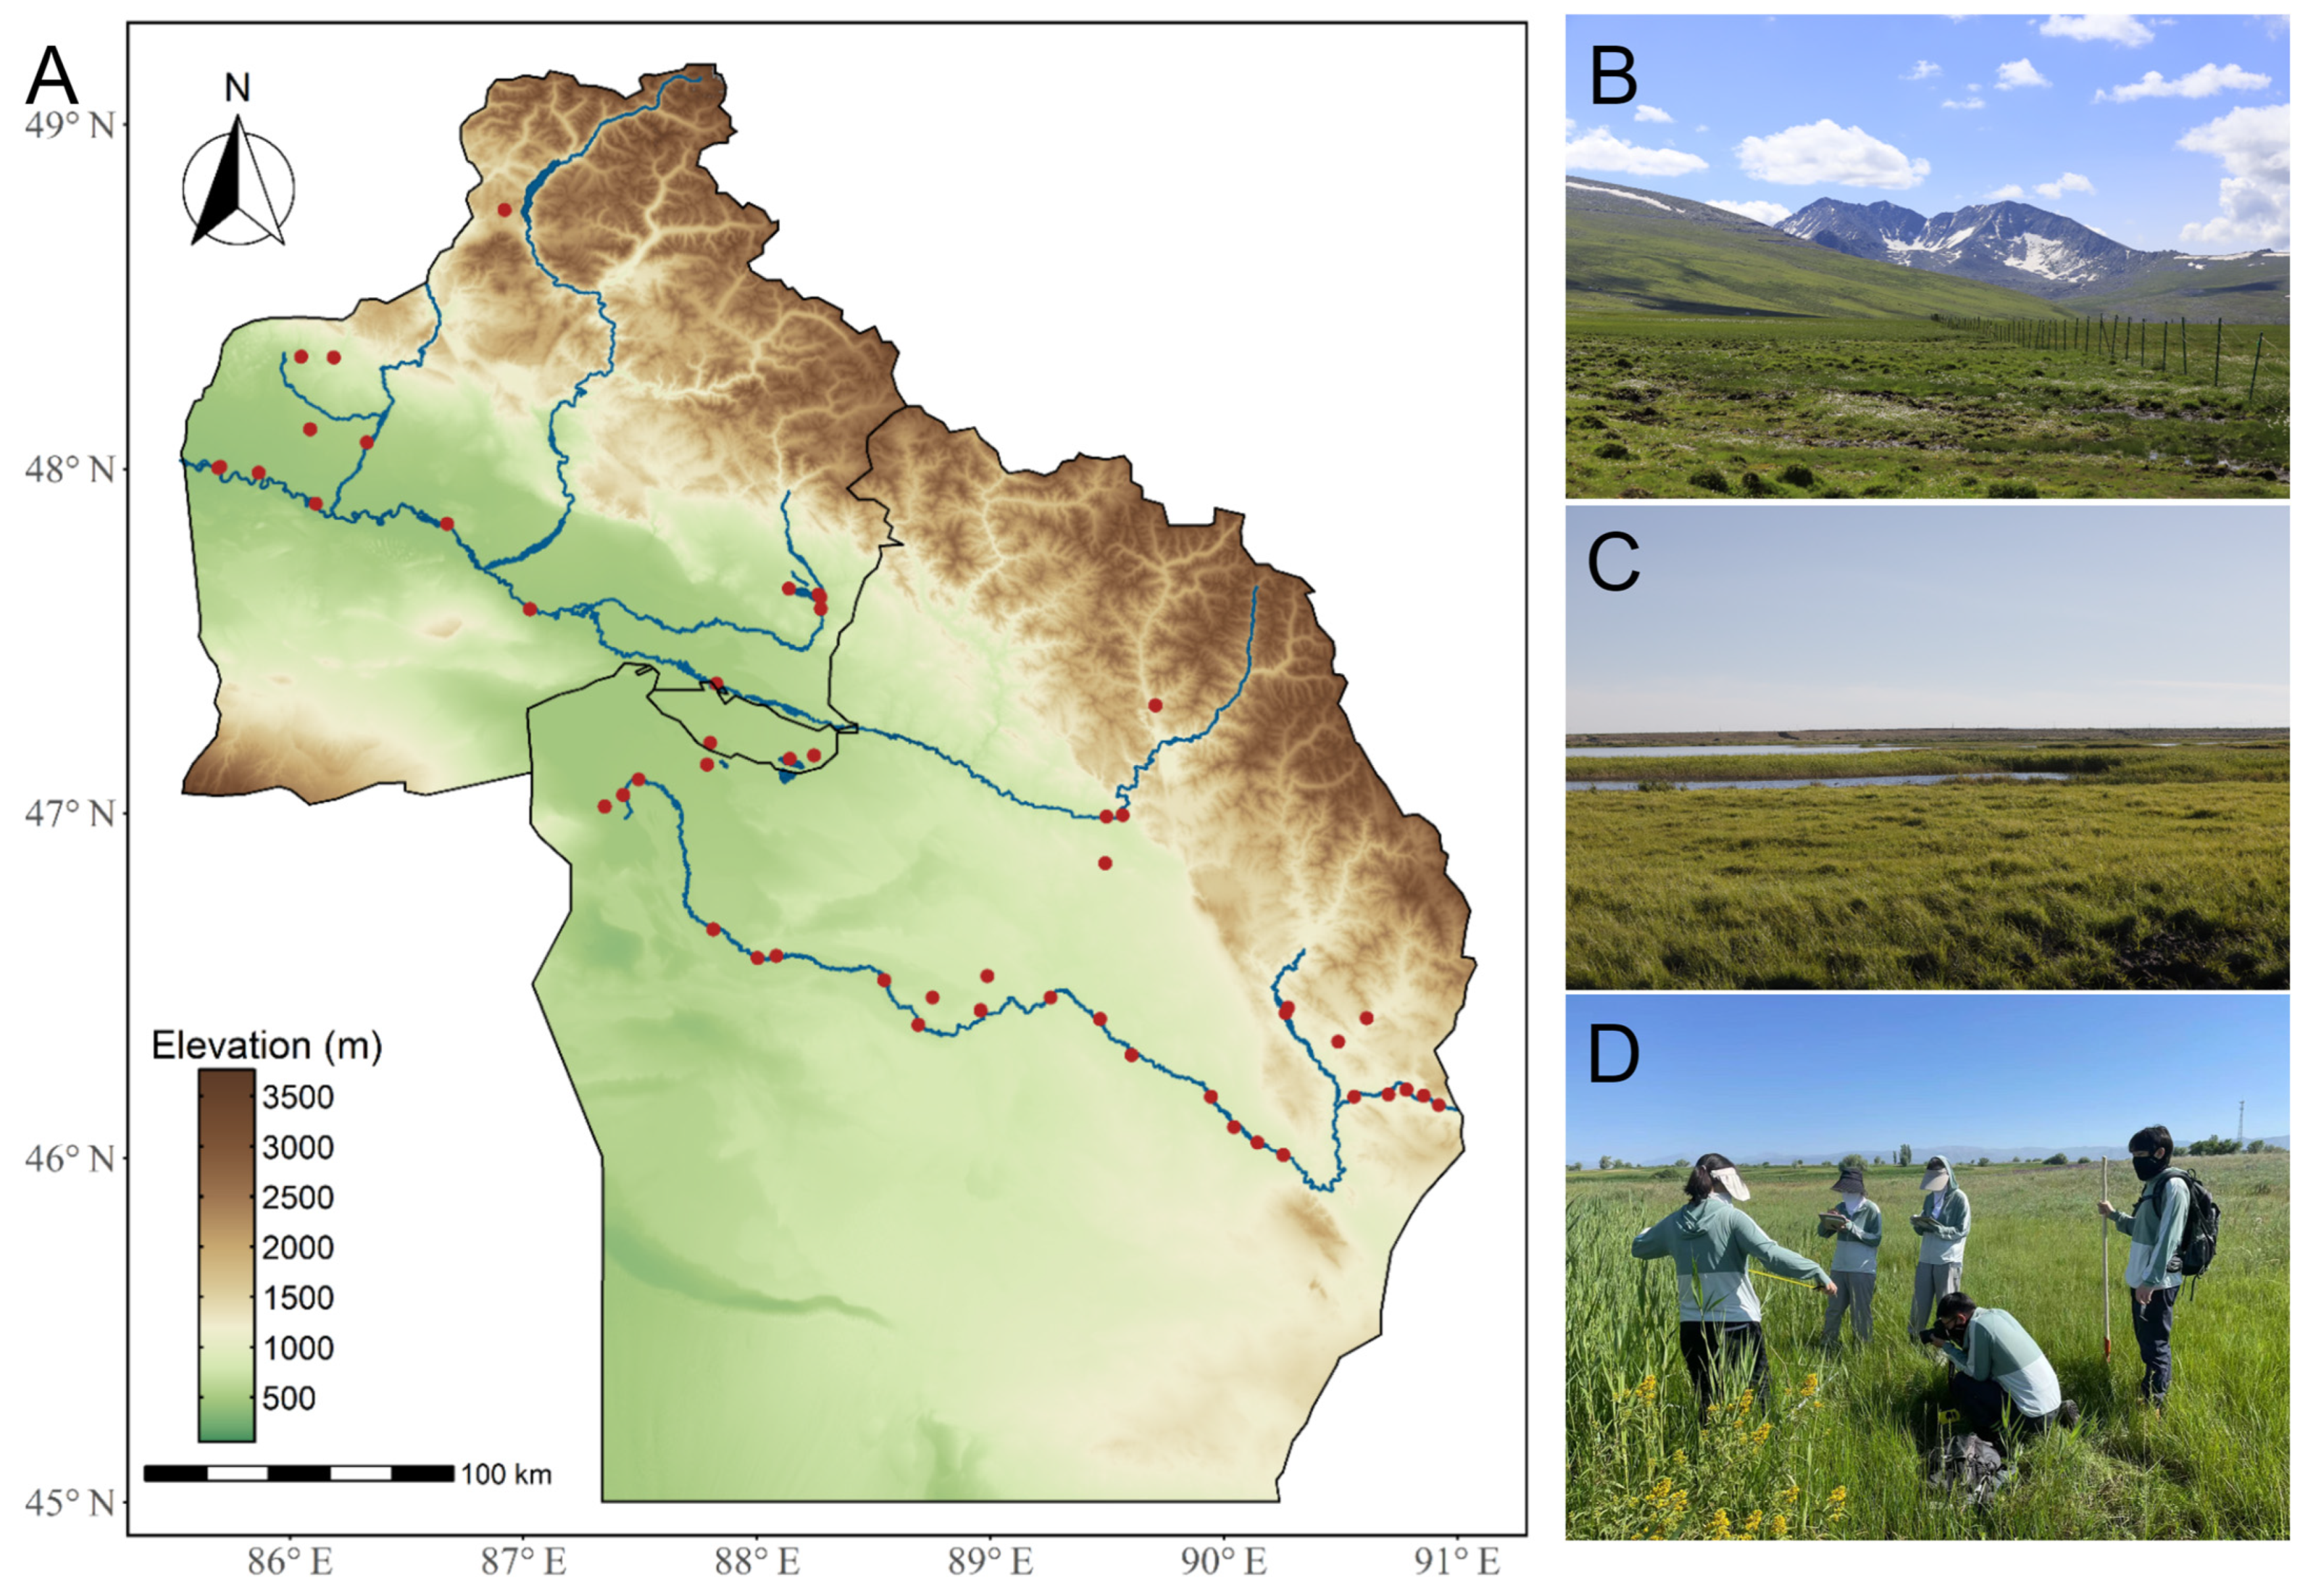
Figure 1. Study area and sampling plots. The figure includes (A) map showing the study area location within China (inset) and the Ertix River Basin with elevation gradient and sampling plot distributions marked in red dots; (B) high-elevation sampling site (ca. 2447 m) with alpine meadow vegetation; (C) low-elevation sampling site (ca. 475 m) with relatively flat wetland vegetation; (D) field sampling methodology showing researchers conducting vegetation surveys using quadrat sampling methods.
Diversity 18 00411 g001
Figure 2. Effects of local environmental factors and non-native plant metrics on importance values (IV) of native plants in wetland communities. Results from linear mixed-effects models (LMMs) showing the significant predictors, including (A) elevation, (B) non-naturalized plant abundance, (C) naturalized plant abundance, and (D) invasive plant abundance. Fitted regression lines (solid black) with 95% confidence intervals (shaded areas) are derived from minimum adequate models.
Diversity 18 00411 g002
Figure 3. Effects of environmental factors and non-native plant metrics on alpha diversity of native plants in wetland communities. Results from linear mixed-effects models showing significant predictors, including (A) elevation effects on richness, (B) naturalized plant richness effects on richness, (C) naturalized plant abundance effects on evenness, (D) elevation effects on Shannon–Wiener index, and (E) naturalized plant abundance effects on Shannon–Wiener index. Fitted regression lines (solid black) with 95% confidence intervals (shaded areas) are derived from minimum adequate models.
Diversity 18 00411 g003
Figure 4. Pairwise correlations among environmental variables and non-native plant metrics. The diagonal panels show kernel density distributions of environmental predictors (elevation; mean annual temperature, MAT; mean annual precipitation, MAP) and diversity indices for invasive (Inv), naturalized (Nat), and non-naturalized (Non-nat) species in terms of richness (R) and abundance (A). The lower panels display bivariate scatterplots with fitted linear regression lines (blue) and 95% confidence intervals, and the upper panels present Pearson correlation coefficients. Colored coefficients denote statistically significant correlations (orange for positive and blue for negative; p < 0.05), while non-significant correlations are shown in grey.
Diversity 18 00411 g004
Table 1. Results of linear mixed-effects models (LMMs) analyses examining effects of environmental variables (elevation, mean annual temperature, and mean annual precipitation) and non-native plant metrics (richness and abundance of non-naturalized, naturalized, and invasive species) on importance values of native plant communities in wetland. Transect was included as a random effect. All continuous variables were natural-log transformed and standardized. Optimal models were constructed through stepwise selection. Individual R2 values (Ind. R2) and their percentage contributions to total variance explained (Ind. perc.) are reported for each predictor.
TermEstimateSEt-Valuep-Value95% CIInd. R2Ind. Perc.
Intercept0.920.01182.87<0.001[0.91, 0.93]//
Elevation0.010.012.390.021[0.00, 0.02]0.022.41
Non-natA−0.020.01−3.230.002[−0.08, −0.05]0.0912.18
NatA−0.090.01−16.08<0.001[−0.10, −0.08]0.4356.18
InvA−0.060.01−12.60<0.001[−0.03, −0.01]0.2229.23
R2m = 0.76, R2c = 0.77
Non-natA represents the abundance of non-naturalized plants within each plant community, NatA represents the abundance of naturalized plants, and InvA represents the abundance of invasive plants.
Table 2. Results of linear mixed-effects model analyses examining effects of environmental variables (elevation, mean annual temperature, and mean annual precipitation) and non-native plant metrics (richness and abundance of non-naturalized, naturalized, and invasive species) on alpha diversity indices (species richness, Pielou evenness, and Shannon–Wiener index) of native plants in wetland communities. Transect was included as a random effect. All continuous variables were natural-log transformed and standardized. Optimal models were constructed through stepwise selection. Individual R2 (Ind. R2) and percentage contributions (Ind. perc.) to marginal R2 are reported for each predictor. Ind. R2 and Ind. perc. are not reported for Pielou evenness because only one predictor was retained in the optimal model.
TermEstimateSEt-Valuep-Value95% CIInd. R2Ind. Perc.
(A) Richness
Intercept1.790.0444.22<0.001[1.71, 1.87]//
Elevation0.170.044.08<0.001[0.09, 0.25]0.1582.33
NatR0.080.032.710.008[0.02, 0.13]0.0317.67
R2m = 0.18, R2c = 0.51
(B) Pielou evenness
Intercept0.580.0223.92<0.001[0.53, 0.62]//
NatA0.060.022.920.004[0.02, 0.09]//
R2m = 0.05, R2c = 0.38
(C) Shannon–Wiener Index
Intercept1.070.0519.41<0.001[0.96, 1.17]//
Elevation0.180.063.300.002[0.07, 0.29]0.1063.37
NatA0.140.043.44<0.001[0.06, 0.22]0.0636.63
R2m = 0.16, R2c = 0.54
NatR represents the species’ richness of naturalized plants with each plant community, NatA represents the abundance of naturalized plants.
Disclaimer/Publisher’s Note: The statements, opinions and data contained in all publications are solely those of the individual author(s) and contributor(s) and not of MDPI and/or the editor(s). MDPI and/or the editor(s) disclaim responsibility for any injury to people or property resulting from any ideas, methods, instructions or products referred to in the content.