Article

Exploration of the Microbiota Associated with Body Regions Within the Host Sea Cucumber, Holothuria forskali (Echinodermata: Holothuroidea)


1
Laboratoire de Biotechnologie et Chimie Marines, University of Brest, LBCM-EMR 6076, F-29334 Quimper, France
2
IFREMER-IRSI-Service de Bioinformatique (SeBiMER), 1625 Route de Sainte-Anne, F-29280 Plouzané, France
3
Laboratoire d’Ecologie Alpine, University of Grenoble-Alpes, LECA-UMR 5553, F-38000 Grenoble, France
*
Author to whom correspondence should be addressed.
Diversity 2026, 18(7), 399; https://doi.org/10.3390/d18070399
Submission received: 25 December 2025 / Revised: 2 June 2026 / Accepted: 10 June 2026 / Published: 1 July 2026
(This article belongs to the Special Issue Diversity, Physiology and Ecology of Marine Microorganisms)

Abstract

The black sea cucumber, Holothuria forskali, is an emerging target species for aquaculture; however, knowledge of its biology remains limited. Investigating its associated microbiota is a crucial step toward developing a controlled and sustainable aquaculture. In this study, the microbiota of three different body compartments of the host H. forskali—namely, the dorsal epidermis, the posterior intestinal content, and the coelomic fluid—were analysed using targeted metagenomics (V3-V4 rRNA 16S Metabarcoding). We compared host-associated communities with bacterial environmental communities across three periods in 2020 at two sites in south Brittany, totalling 309 analyses (36 environmental samples and 273 sea cucumber samples). The objective was to explore the diversity of the sea cucumber microbiota from the external to the internal regions of the animal. Thus, a total of 8695 OTUs were identified and classified into 52 bacterial phyla, 119 classes, and 45,596 orders. The results highlighted (1) anatomical compartmentalisation—with significantly different bacterial assemblages in terms of diversity, composition, and abundance across the three body regions—(2) host versus environment differences, and (3) temporal variations, as microbial community structures shifted significantly in winter compared to summer and autumn. This analysis identified specific taxa and families associated with each compartment with a potential role in host health. Results also showed relationships between the sea cucumber microbiota and their ambient environment. In fact, the presence of common bacterial taxa observed in the sediment and in the gastrointestinal microbiota supported the feeding behaviour of H. forskali. The sea cucumber microbiome thus appears to be compartmentalised “anatomically”, exhibiting a relatively low abundance of bacteria in the coelomic cavity, distinct from that of the microbial communities of seawater and sediments. This study highlighted the importance of the microbiota for the host and confirmed the existence of a core microbiota within H. forskali.

1. Introduction

Sea cucumbers (Holothuroidea, Echinodermata) are traditionally sought-after species in the Asian market as a luxury food [1,2,3], which explains the overexploitation of natural stocks and the development of large sea cucumber farms [4,5]. Sea cucumbers have an ecosystemic role as they are opportunistic feeders that capture organic matter. Some of them are psamivorous, detritivorous, or suspensivorous, and they are involved in sediment bioturbation or the capture of planktonic organic biofilm [6,7]. To a lesser extent, they have also been studied for their antibacterial and anti-cancer compounds [8]. The development of infectious diseases in shellfish farming in Europe and the recent interest in European sea cucumbers have led researchers to focus on domestication trials of new species such as Holothuria tubulosa, H. arguinensis, H. polii, and H. forskali [9,10,11,12,13].
Aquaculture research has expanded into new fields of investigation, including the hologenome theory [14,15]. In this context, particular attention has been given to the importance of the microbiota of reared species due to its role in homeostasis and even in host health [16,17,18]. This has been made possible by the development of high-throughput DNA gene-sequencing technologies [19,20,21]. All this targeted research is part of an objective to improve zootechnical performance in aquaculture structures [17]. Thus, studying and understanding the relationships between reared species and their microbiota have become essential [22]. Many studies have demonstrated the existence of anatomical microbiota or tissue-specific microbiota associated with a host [23,24,25,26]. In sea cucumbers, research has primarily focused on the commercially significant species Apostichopus japonicus. Particular attention has been paid to its intestinal and coelomic microbiota [27,28,29,30,31,32], as well as its susceptibility to diseases [33] and zootechnical performance [34]. Fewer studies have been conducted on microbiota of temperate water and European holothurians. H. forskali, a new candidate species for aquaculture targeted by the Asian market, is a detritivorous sea cucumber from temperate waters that can be found from the NE Atlantic to the Mediterranean Sea [11,12,35,36]. Knowledge regarding its associated microbiota remains anecdotal [37,38]. Its coelomic microbiota has shown the presence of antibacterial strains of bacteria, as well as highly diverse, specific, and variable bacterial communities dominated by Proteobacteria and Flavobacteriales [37,38,39,40].
In this study, the microbiota of H. forskali across different body compartments of the animal and the bacterial community of two environmental components (seawater and sediment) were compared to each other in two locations and in three sampling periods over one year. Thus, three body regions within the host—the sea cucumber—were studied: coelomic fluid, gastrointestinal content, and the epidermis. Their respective bacterial compositions were compared with those of environmental communities. To characterise these bacterial compositions, the microbiota or the environmental communities were analysed with the 16S Metabarcoding approach using Illumina MiSeq sequencing technology. Therefore, the aim of this study was first to describe the composition of the microbiota associated with body regions within the host sea cucumber in terms of richness, abundance, and diversity, and second to analyse their spatiotemporal variations and their specificities. It is important to note that this study presents results that are more descriptive than explanatory with regards to the presence of any particular bacterial taxa. However, this study is of interest because there is little information available on the microbiota of H. forskali, a species that may gain importance in the coming years in terms of fishing or farming. We used several indicators to characterise the potential relationships and unique characteristics of each microbiota and environmental bacterial community. Thus, these “microbiota” were defined as follows: (i) the associated baseline microbiota determined by prevalence scores, (ii) the specific microbiota consisting of unique (non-shared) taxa, and (iii) taxa exhibiting distinct differential abundance patterns among the studied microbiota.

2. Materials and Methods

2.1. Sample Collection

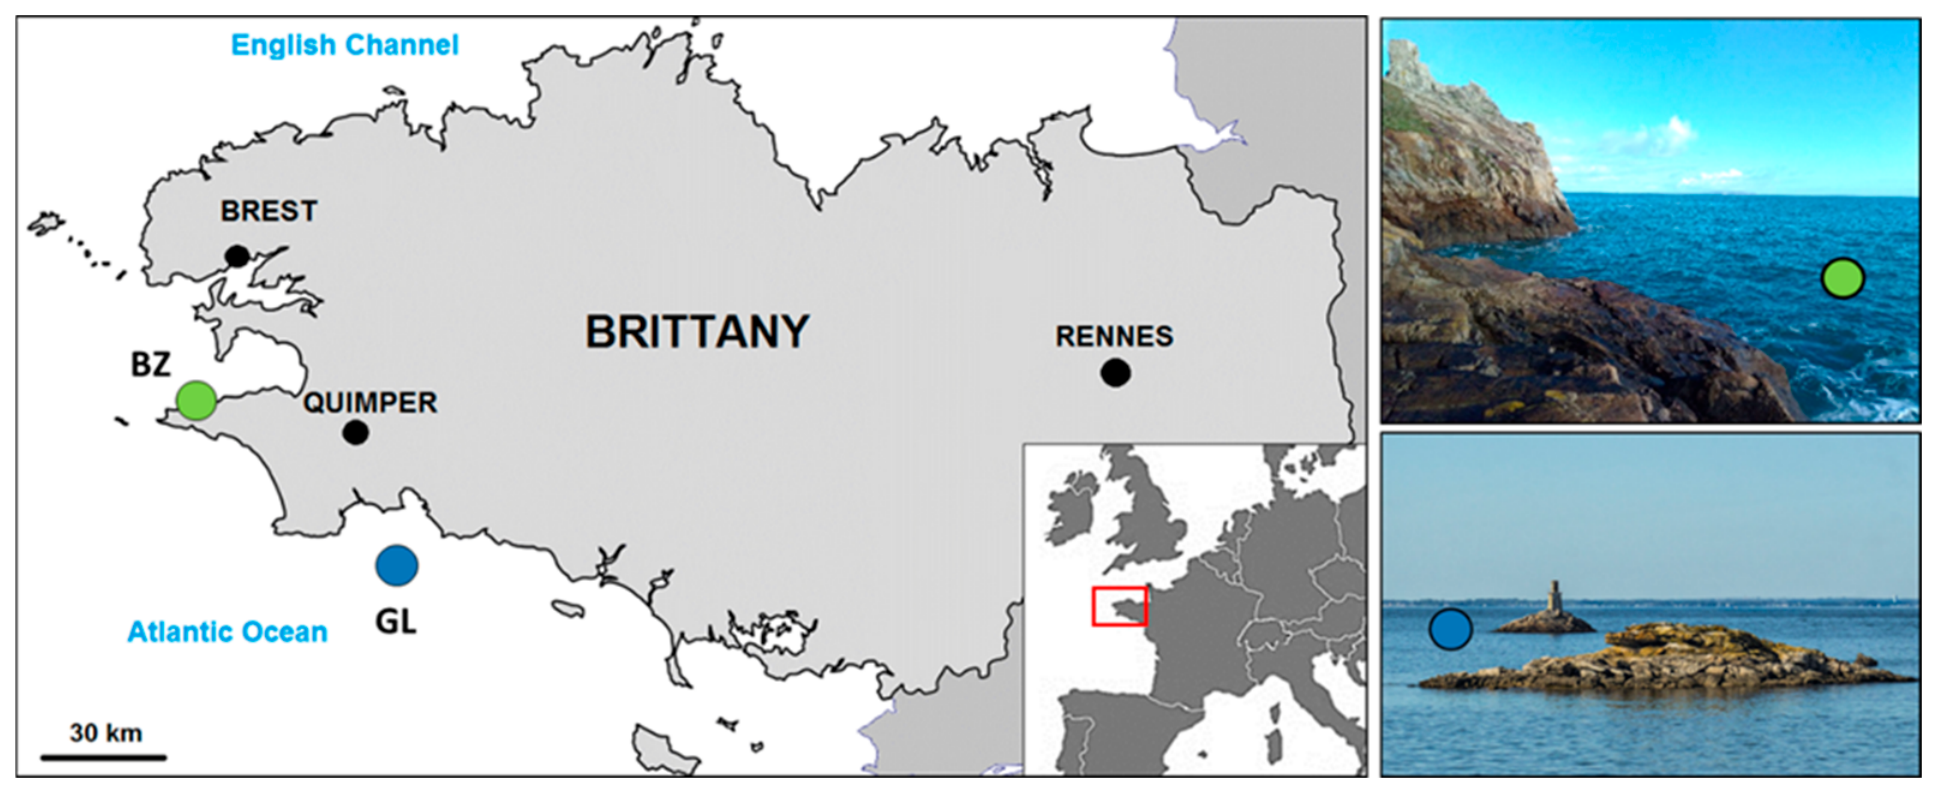
In this study, 6 sampling collections of sea cucumber, H. forskali, were carried out at different times in 2020 at two sites on the west coast of Brittany, France (Figure 1, Table 1). The Glénan Archipelago consists of 9 main islands and several rocky islets located off the coast of Concarneau, approximately 10 miles from the nearest coast. The diving area in the north of the archipelago (WGS84: 47°43′57.76″ N and 04°00′50.99″ W—named GL) was reached by nautical facilities. The Port of Brézellec (WGS84: 48°4′15.48″ N and 04°39′44.98″ W—named BZ), located at the western tip of Brittany, in the Bay of Douarnenez, consists of rocky cliffs and the diving area is directly accessible from the coast. The choice of locations is explained by the possibility of collecting animals all year round. The two sampling areas were characterised by rocky beds colonised by kelp. For each sampling collection, 15 specimens of H. forskali were collected by scuba diving at depths of 5 to 15 m. While no specific authorisation was needed for their capture—given their non-protected status—the use of scuba diving equipment necessitated a formal fishing permit (Décision 1048/2019-Préfet de la Région Bretagne). Animals were mainly found on vertical rocky substrates in both locations. The specimens were set in 50 L tanks filled with local seawater and directly transferred to the laboratory. Ambient seawater (n = 3) and sediment deposited on the rocks (n = 3) were collected with sterile 50 mL syringes and then put in sterile centrifuge tubes.
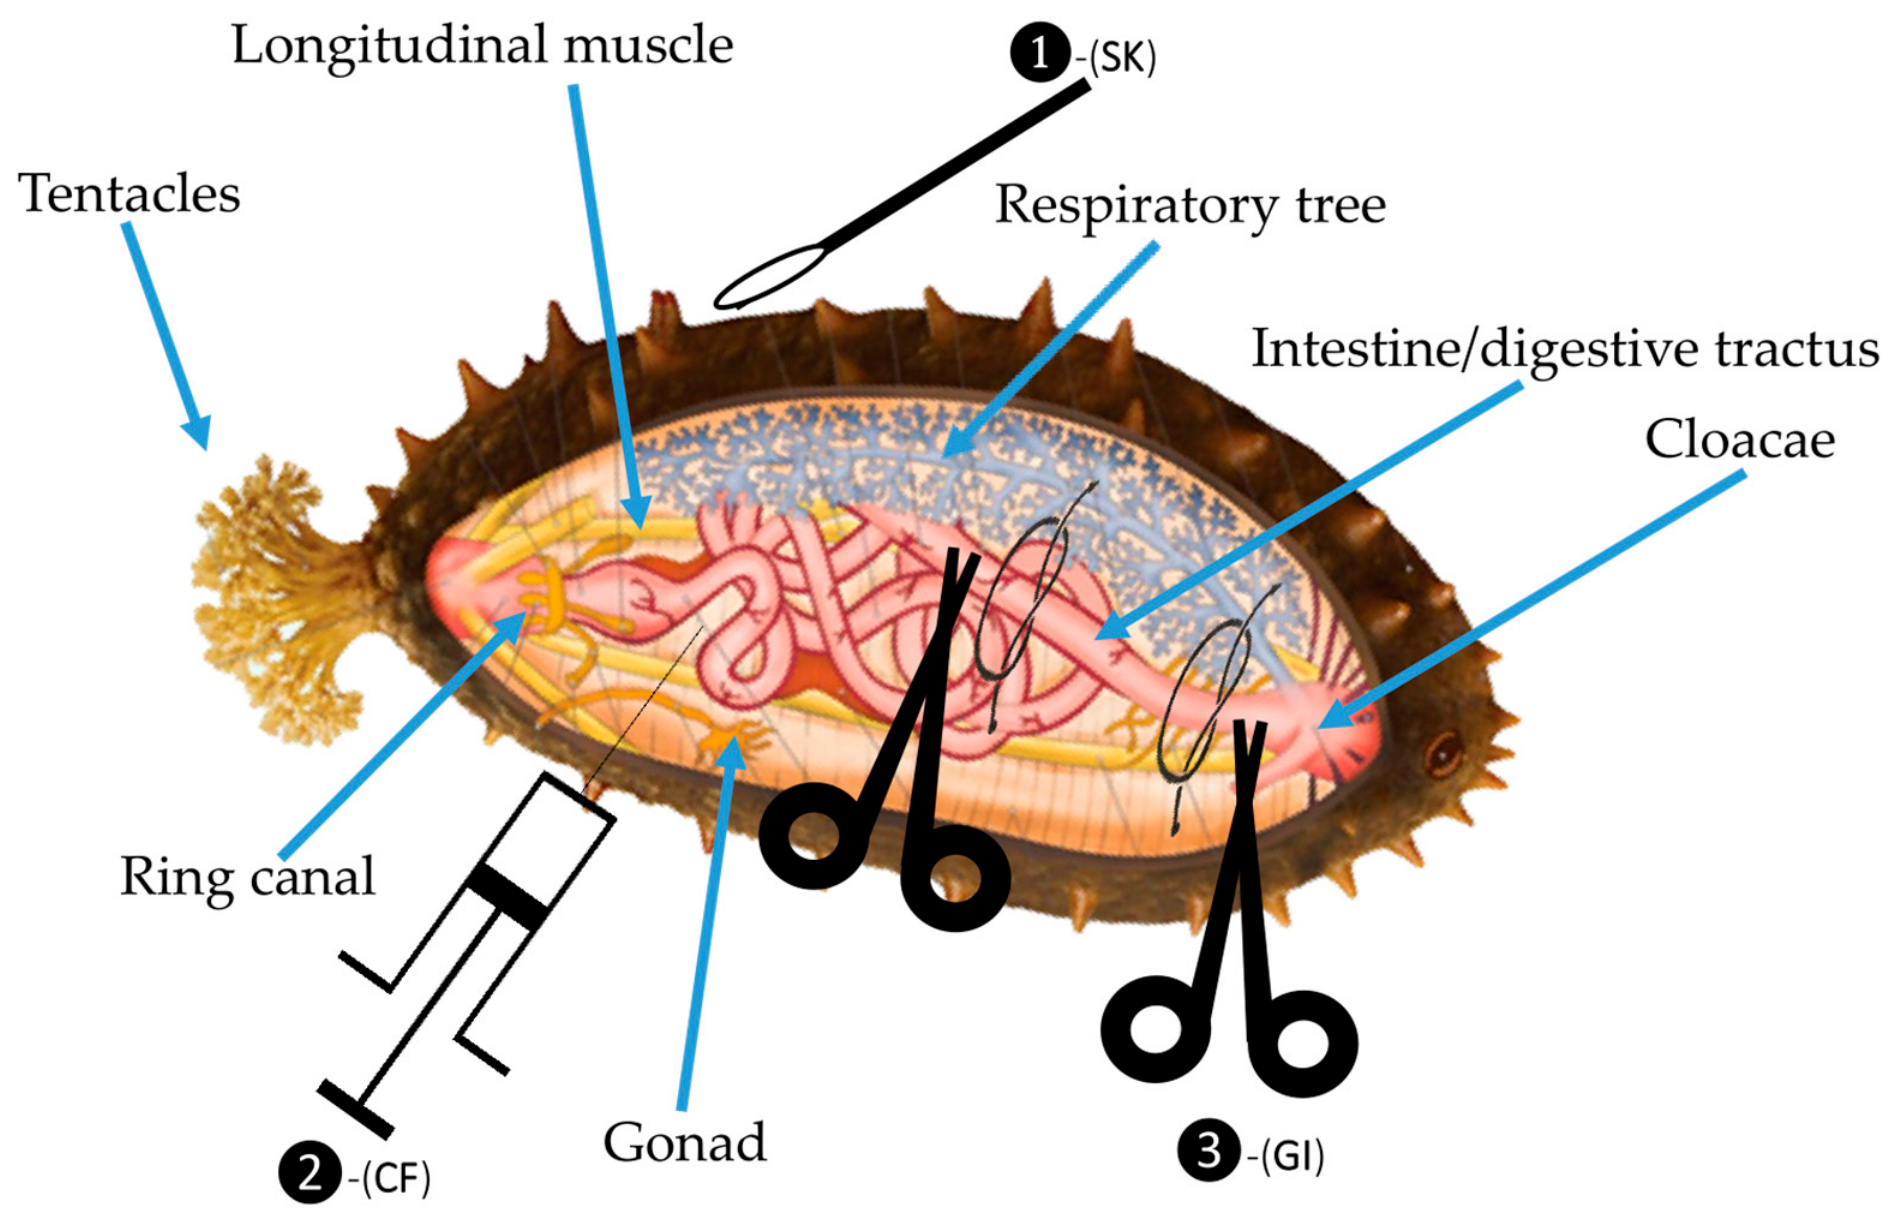
Concerning the choice of the biological part of the animal, we did not focus on a tissue sample but rather adopted a “from outer microbiota to inner microbiota” approach. At the laboratory, animals (n = 15 per collection date) were weighed and quickly dissected to collect the three biological fractions: the epidermal microbiota (“SK” for “skin”), the coelomic microbiota (“CF” for “coelomic fluid”), and the gastrointestinal microbiota (“GI” for “gastrointestinal”) (Figure 2). The dissection was conducted under aseptic conditions as much as possible under a Bunsen burner, and manipulations were performed with gloves. Initially, 10 cm2 of dorsal epidermis surface was swabbed. After cutting the tip of the swab and placing it in a centrifuge tube initially containing 1.5 mL of sterile artificial seawater, the tubes were vigorously vortexed, and then the tips of the swab were gently removed. Then, the animal’s body surface was washed and disinfected with 70% ethanol, and the coelomic fluid was collected with a 25 G needle and a 2.5 mL sterile syringe by insertion through the body wall on the ventral side. Around 1.5 mL of coelomic fluid was thus collected and kept in a microtube. Finally, the specimens were dissected by ventral incision and the posterior gastrointestinal content was ligatured and removed from the animal using a pair of scissors. The walls of the digestive content fragment were compressed to extract its contents, which were then collected in a sterile 15 mL centrifuge tube. After decanting the solid content (mainly sand and broken shell debris), 1.5 mL of the upper liquid phase were transferred into a microtube. All the samples were stored on ice before processing and were then centrifuged at 15,000× g for 10 min at 4 °C. Supernatants were removed, and the pellets were then stored at −20 °C before further metabarcoding analysis.

2.2. Analysis of Coelomic Microbiota with Metabarcoding 16S

2.2.1. Genomic DNA Extraction and Sequencing

Genomic DNA was extracted with the Qiagen DNA Stool mini Kit (Qiagen, Hilden, Germany) according to the manufacturer’s instructions with minor modifications (an initial step at 95 °C to improve lysis of Gram-positive bacteria). Samples of DNA were then amplified at the AnaEE Platform (Grenoble, France) in 4 replicates, and negative controls were added for the randomised PCR. The barcoded primers used for amplification were Bact02F (5′-GCCAGCMGCCGCGGTAA-3′) and Bact02R (5′-GGACTACCMGGGTATCTAA-3′), targeting the V4 Region of the 16S rDNA gene, according to the Metafast protocol [41]. Sequencing was then performed using Illumina MiSeq technology (2 × 250 bp) by Fasteris (Geneva, Switzerland).

2.2.2. Pre-Processing on Sequencing Data

After quality control and trimming, sequences were assigned to samples with ngsfilter from the Obitools [42] and then processed using Frogs 3.1.0 [43,44], available on the Galaxy server Genouest: R1 and R2 sequences were merged in pairs, chimeras were removed with V Search [45,46], and sequences were clustered with Swarm (with a distance for aggregation of 3) [44]. Finally, singletons and low abundance sequences (minimum abundance threshold < 5 × 10⁻⁶) were filtered and removed from the data, and remaining sequences were taxonomically assigned as OTUs (Operational Taxonomic Units) with Blast [47] and the SILVA 138 (pintail 100) database. OTUs identified as contaminants were removed from the data.

2.2.3. Statistical Analysis

The data (count table, OTU table, and sample data) were loaded into R https://summerofcode.withgoogle.com/archive/2020/organizations/4761521042751488 (accessed on 9 June 2026) [48] as a phyloseq object to analyse and compare the bacterial communities of the three studied microbiota of H. forskali (coelomic fluid, posterior gastrointestinal content, and epidermis) and the two environmental components (seawater and sediment), using the package Phyloseq [49]. Alpha diversity indices were first calculated (Chao1 richness, inverse Simpson, and Shannon diversity indices) and the means were compared according to the variable “biological compartment” using the non-parametric Kruskal–Wallis test (threshold 0.05) and pairwise Wilcoxon tests. Rarefaction curves were drawn with the rarecurve function of the Vegan package [50]. For the beta-diversity analysis of the bacterial communities, the OTU table was transformed using the decostand function and the count transformation of Hellinger [50,51,52], the distance matrix was computed with the vegdist function based on the Bray–Curtis distance, and plotted with the metaMDS function [53] and the ggplot2 package [54]. A permutational multivariate analysis of variance (Permanova] was performed using the Adonis package [55]. The composition of the microbiota associated with the three body compartments of the sea cucumber and bacterial communities from environmental components were then compared at two taxonomical ranks, phylum and family, with R and Excel. The microbiota associated with body regions within the host, H. forskali, was explored with the microbiome package [56] using a prevalence threshold of 0.5. The specific microbiota of each studied body region within the host was also determined with unshared OTUs from the holobiont H. forskali. Finally, a linear discriminant analysis (LDA) on effect size (LEfSe) was performed with the LEFSe package [57] (adjusted p-value cutoff: 0.05; log LDA score:2), available on Microbiome Analyst (https://www.microbiomeanalyst.ca) (accessed on 9 June 2026) [58,59].

3. Results

3.1. Data Description and Preprocessing on Sequencing Data

After six sampling collections at the two sites, 309 samples were analysed: 91 samples of coelomic microbiota, 91 samples of epidermal microbiota, 91 samples of gastrointestinal contents, 18 samples of sediment, and 18 samples of seawater. After sequencing, 68,662,807 sequences with an average length of 311 bp were merged. The mean library size was 222,210 ± 97,379 sequences per sample. After clustering, cleaning, and filtering, 31,561,754 sequences, corresponding to 8610 OTUs, were retained for microbiota analysis. These 8610 OTUs were taxonomically assigned using the SILVA 138 database (https://www.arb-silva.de/) (accessed on 9 June 2026) and were mainly classified into 52 bacterial phyla, 119 classes, and 45,596 orders.

3.2. Alpha-Diversity

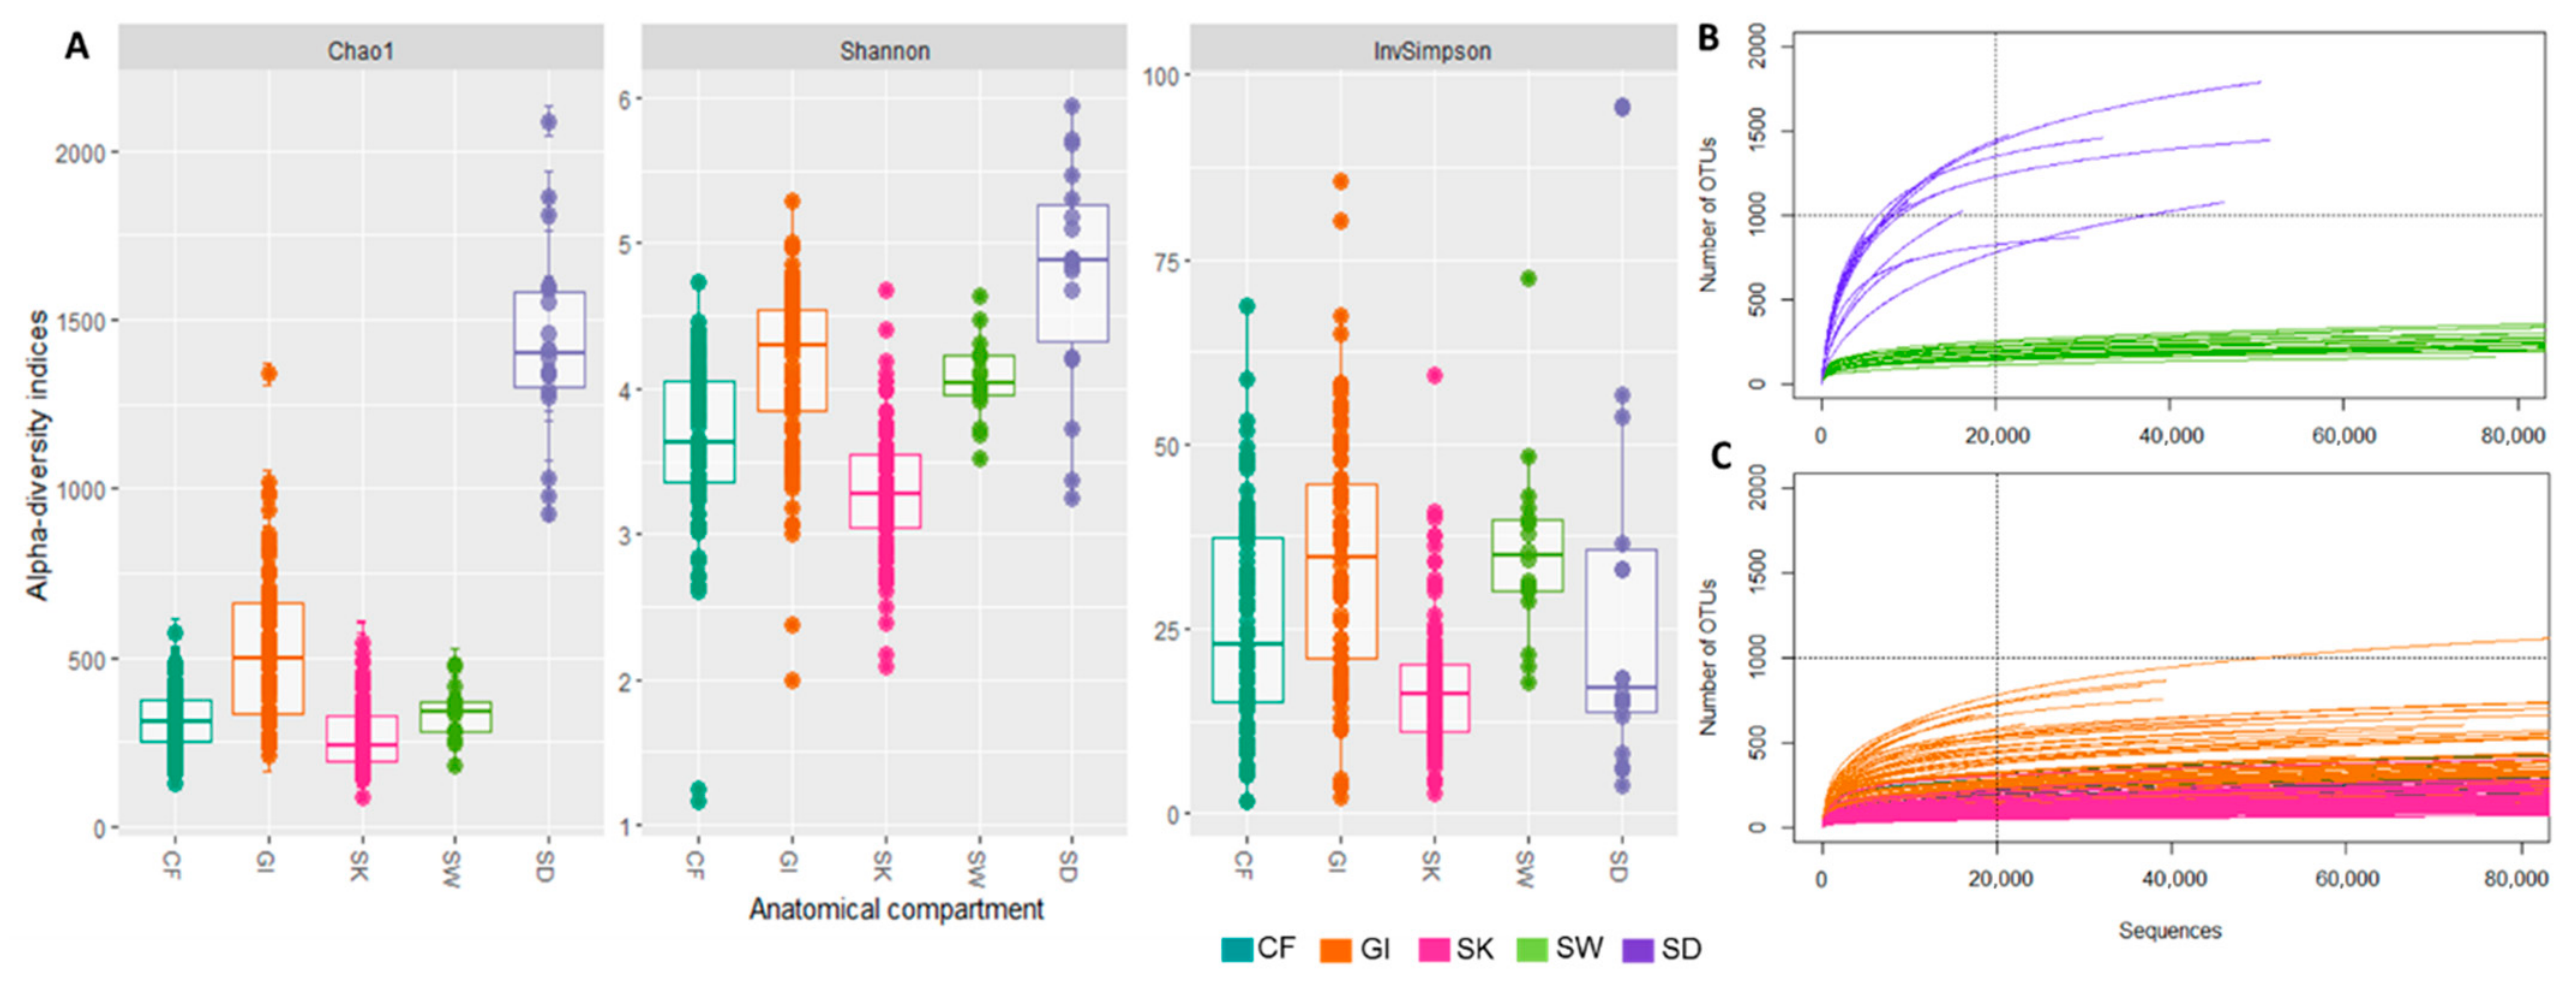
For the samples of studied microbiota of H. forskali and the bacterial communities of seawater, 8610 OTUs were identified. The coelomic microbiota (CF) of H. forskali was composed of 3576 OTUs, the gastrointestinal content (GI) of 5106 OTUs, the epidermis (SK) of 3159 OTUs, the bacterial seawater community (SW) of 1658 OTUs, and the bacterial sediment community (SD) of 3266 OTUs. The highest observed and estimated richness was found in sediment samples (observed richness: 1072 ± 297 OTUs, Chao1: 1427 ± 299; mean ± sd) (Figure 3A,B; Table 2), followed by the gastrointestinal microbiota (observed richness: 395 ± 200; Chao1: 523 ± 222) (Figure 3A–C). The richness and estimated richness for the samples of the coelomic microbiota, epidermal microbiota, and bacterial seawater community were lower than both the gastrointestinal content microbiota and the bacterial sediment community, and ranged between 170 and 258 OTUs per sample (Figure 3A–C). Concerning the diversity indices of Shannon and inverse Simpson, the differences were less pronounced, even if he values for the sediment and gastrointestinal microbiota samples were higher (Figure 3). Moreover, analysis of the different alpha diversity indices revealed that the bacterial communities of sediment were composed of many species with low abundances, whereas the gastrointestinal content was characterised by a high proportion of abundant OTUs, as validated by the rarefaction curves. Thus, the differences in richness and diversity between the different sample types were statistically supported by non-parametric Kruskal–Wallis tests (Table 2).

3.3. Beta-Diversity

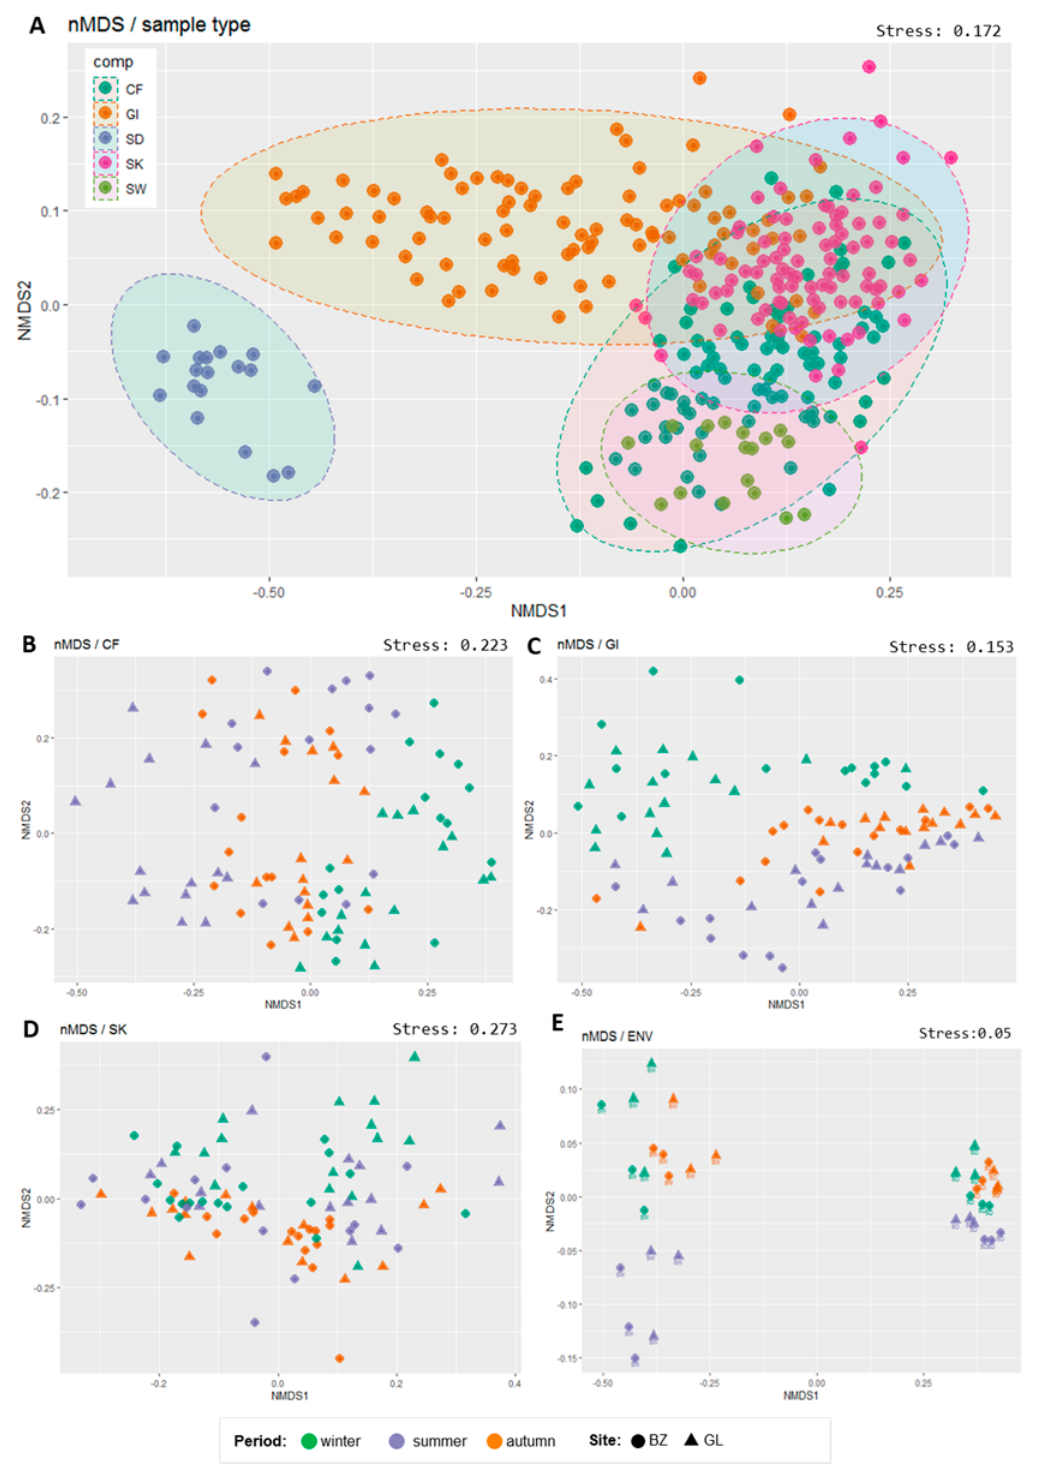
Beta-diversity analysis was performed using the Bray–Curtis distance metric. Samples were classified by sample type (coelomic fluid microbiota, gastrointestinal content microbiota, epidermal microbiota, bacterial communities of seawater, and sediment), as validated by permutational multivariate analysis of variance (Figure 4A, Table 3). Moreover, in each of the three body regions, the nMDS plots demonstrated a temporal segregation (Figure 4B–D) and a spatial organisation that was clearly visible for the epidermal microbiota and the coelomic fluid microbiota (Figure 4B,D). The sampling period and the site influenced all three microbiota studied, as confirmed by statistical analysis (Table 3). For the two environmental components, samples were grouped by type and by period of sampling (Figure 4E).

3.4. Composition of the Bacterial Environmental Communities and the Three Microbiota Associated with Body Regions Within H. forskali

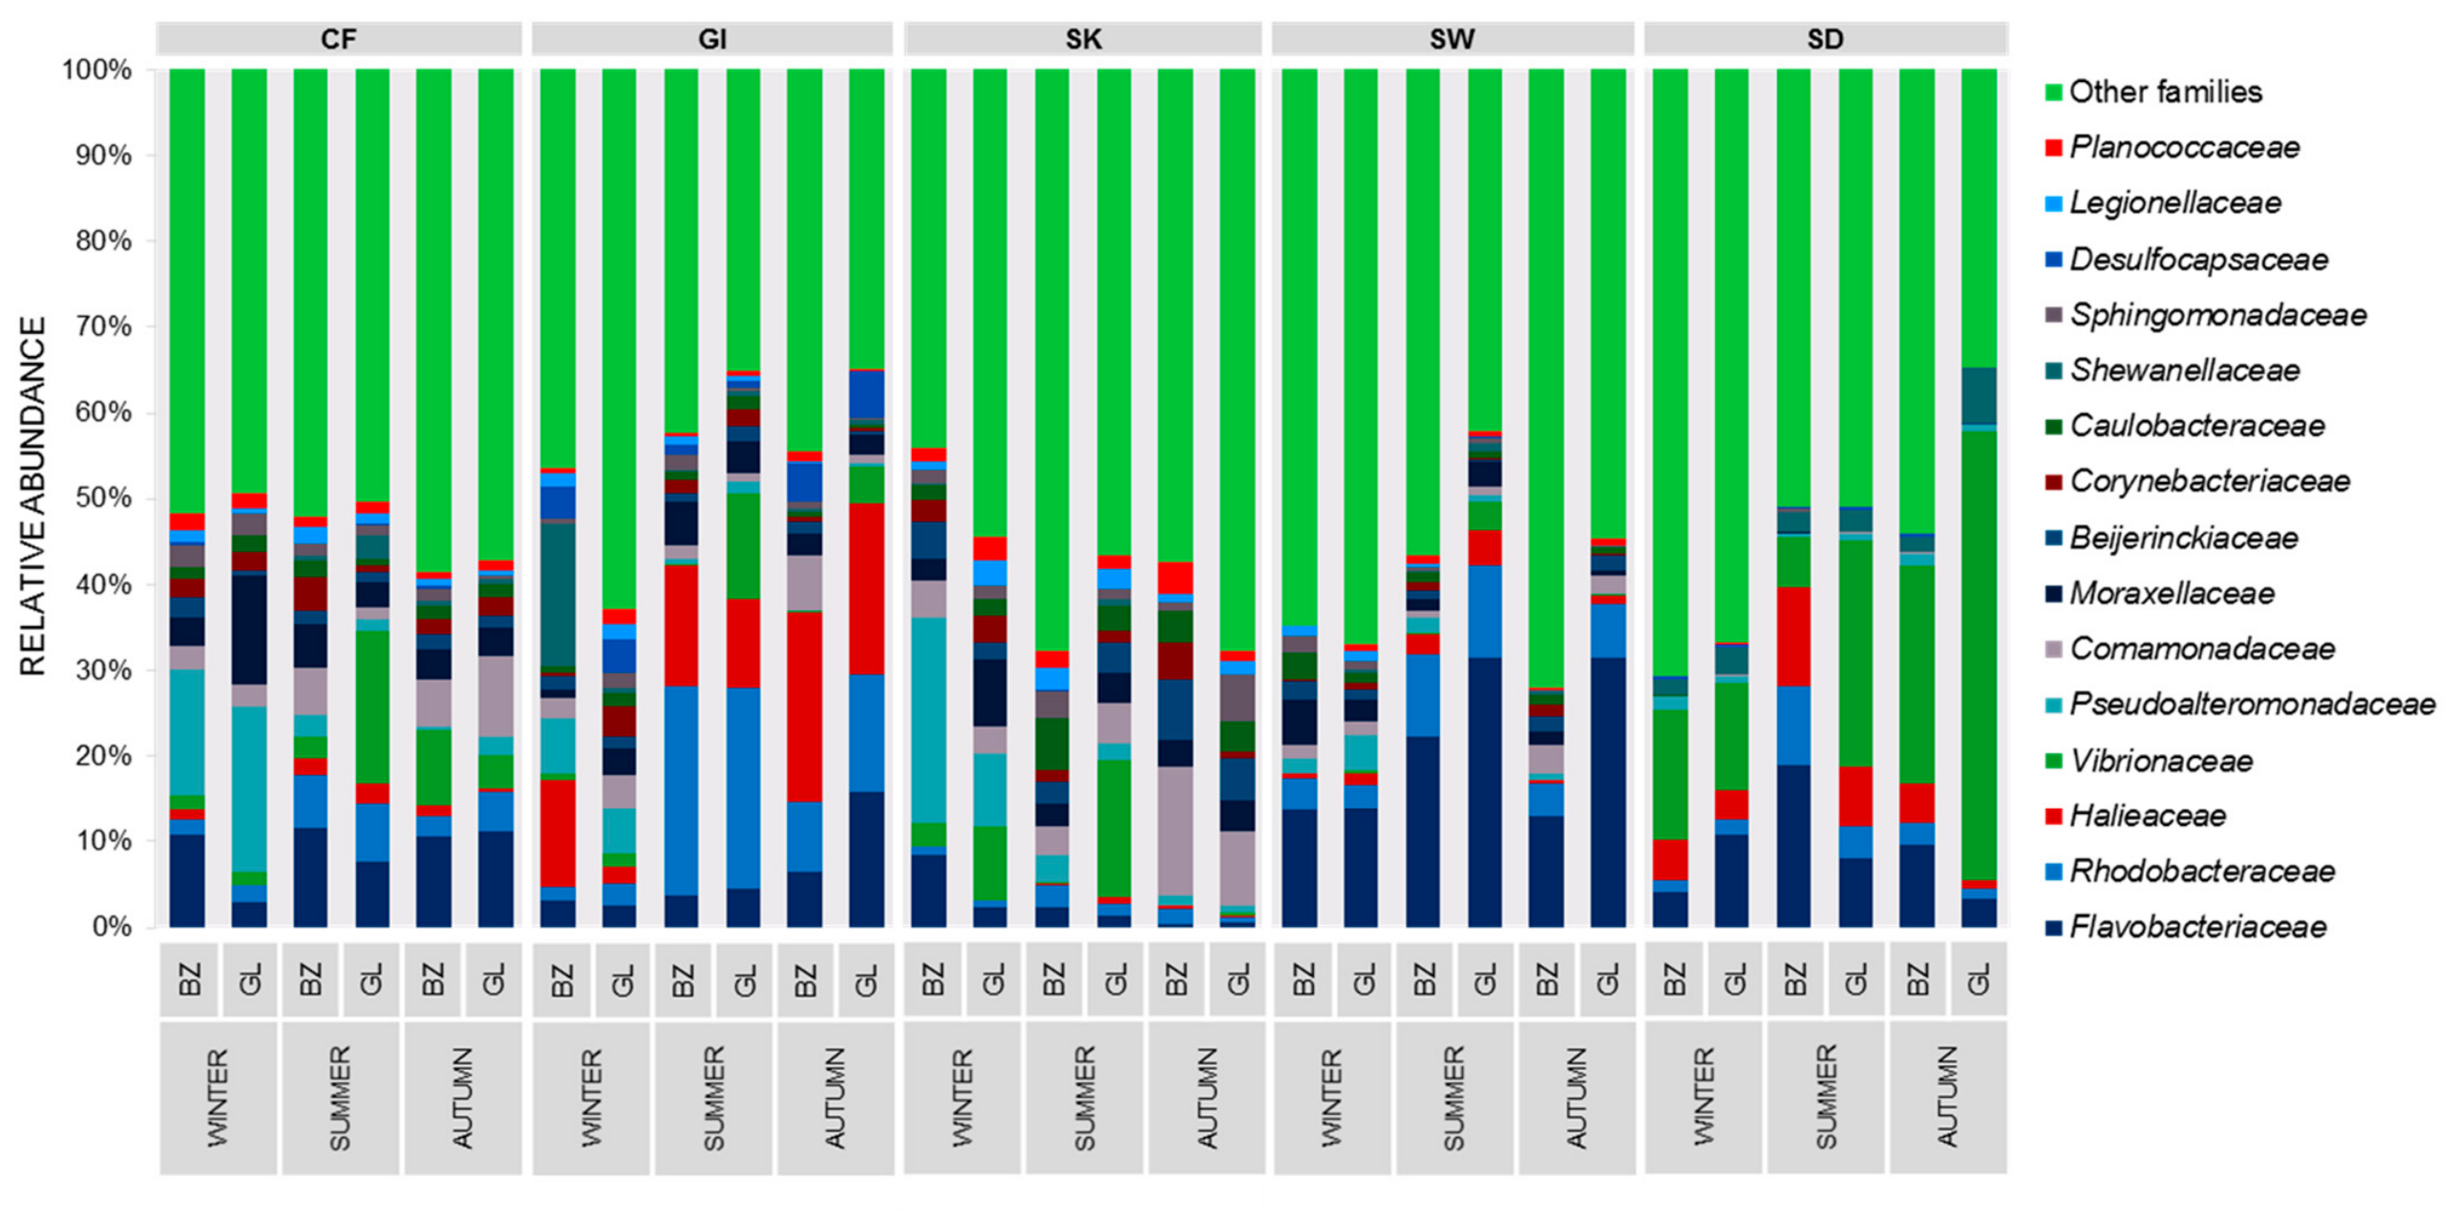
The bacterial communities and microbiota were dominated by the Proteobacteria, regardless of sample type, with a mean abundance of 57%, ranging from 42% for the seawater samples to 63% in the sediment. The Bacteroidota (14%), the Actinobacteria (10%), and the Firmicutes (7%) were also abundant in all samples.
The composition of the bacterial communities and the microbiota varied at the family level according to the sample type (Figure 5). Fourteen families contributed to between 40% and 56% of the total abundance, and their relative abundance varied strongly between samples. In the coelomic fluid microbiota, the Flavobacteriaceae (9%), the Pseudoalteromonadaceae (7%), and the Vibrionaceae (6%) were the most abundant families, with a higher abundance of Flavobacteriaceae in winter that decreased in summer and autumn in favour of Vibrionaceae. The composition of the epidermal microbiota was close to the coelomic microbiota with a high content of Comamonadaceae (6%), with more variations according to time and site. In the gastrointestinal microbiota, the main families were the Rhodobacteraceae (14%), the Haliaceae (14%), and the Flavobacteriaceae (6%), and compositions exhibited variations between samples in winter compared with autumn and summer, with an increase in Rhodobacteraceae and Haliaceae, regardless of the site. Moreover, compositions were different between the two sites in winter. For environmental samples, compositions of bacterial communities were different between sediment and seawater, with a dominance of Flavobacteriaceae in seawater samples (21%), and of Vibrionaceae in sediment (26%).

3.5. Core Microbiota Associated with Body Regions Within the Host, H. forskali

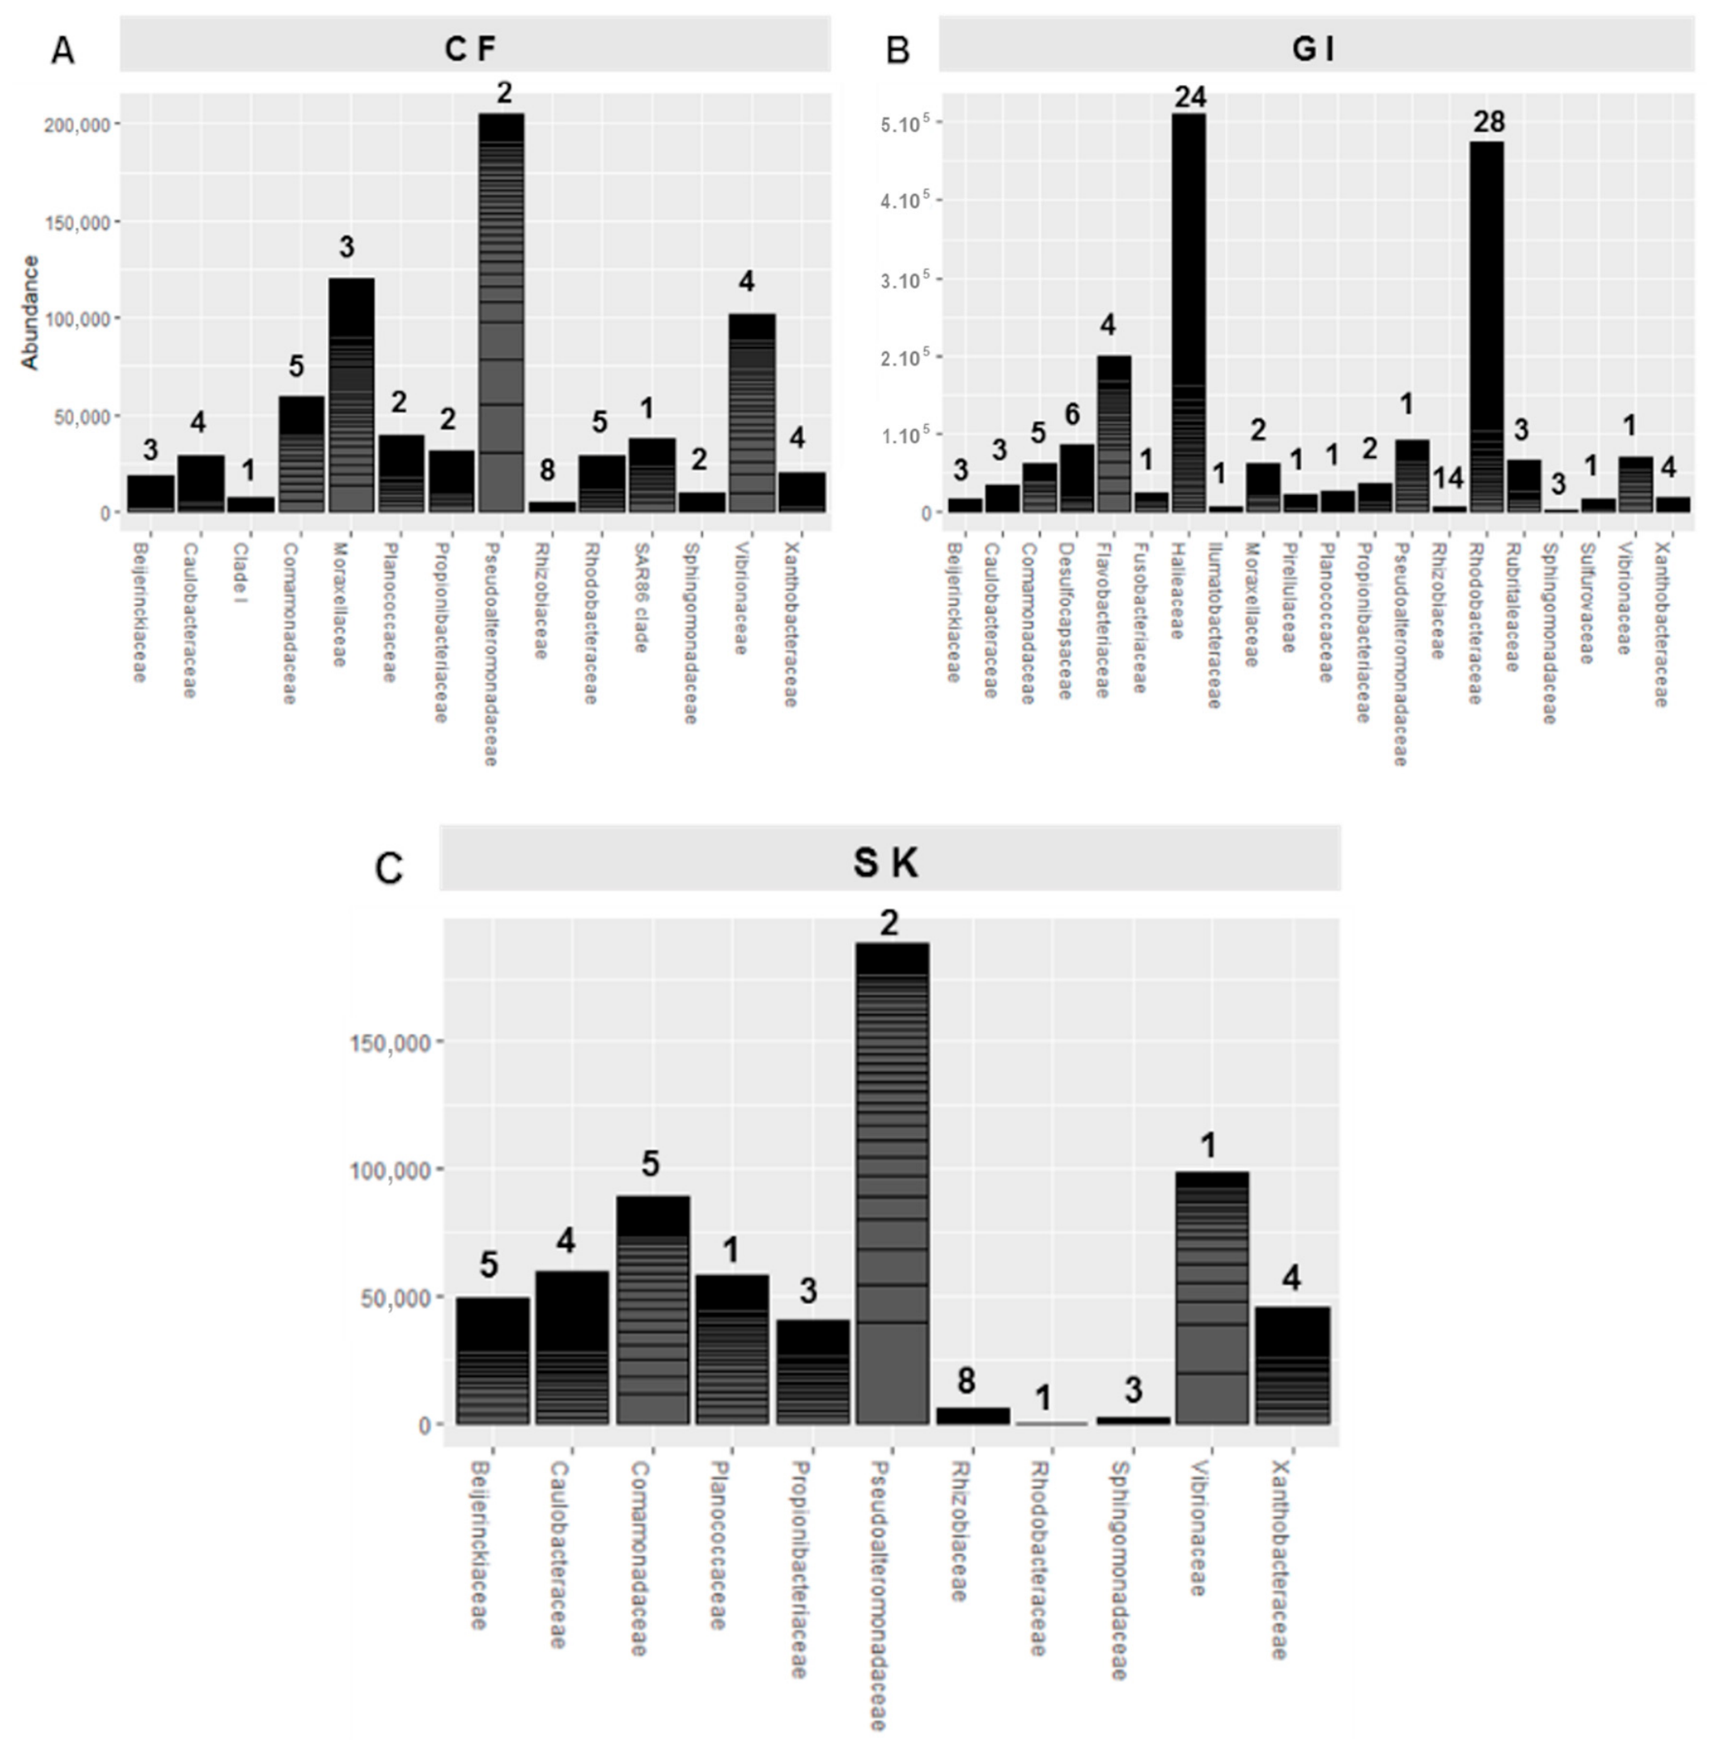
The core microbiota can be analysed at different scales: at the holobiont level or at a tissue-specific scale. Three core microbiota were determined—the coelomic, gastrointestinal, and epidermal microbiota (Figure 5)—using a minimum prevalence threshold of 0.5 among samples. These core microbiota were chosen to be temporally and spatially stable. The coelomic core microbiota consisted of 46 OTUs (Figure 6A), including two abundant Pseudoalteromonadaceae. The gastrointestinal content microbiota, the most diverse among the three body regions, was composed of 108 core OTUs, and was dominated in terms of diversity and abundance by Rhodobacteraceae (28 OTUs) and Haliaceae (24 OTUs) (Figure 6B). The epidermal microbiota contained 37 core OTUs and two abundant taxa of Pseudoalteromonas (Figure 6C). In these associated core OTUs, 29 OTUs were shared between the three compartments.

3.6. Specific Microbiota

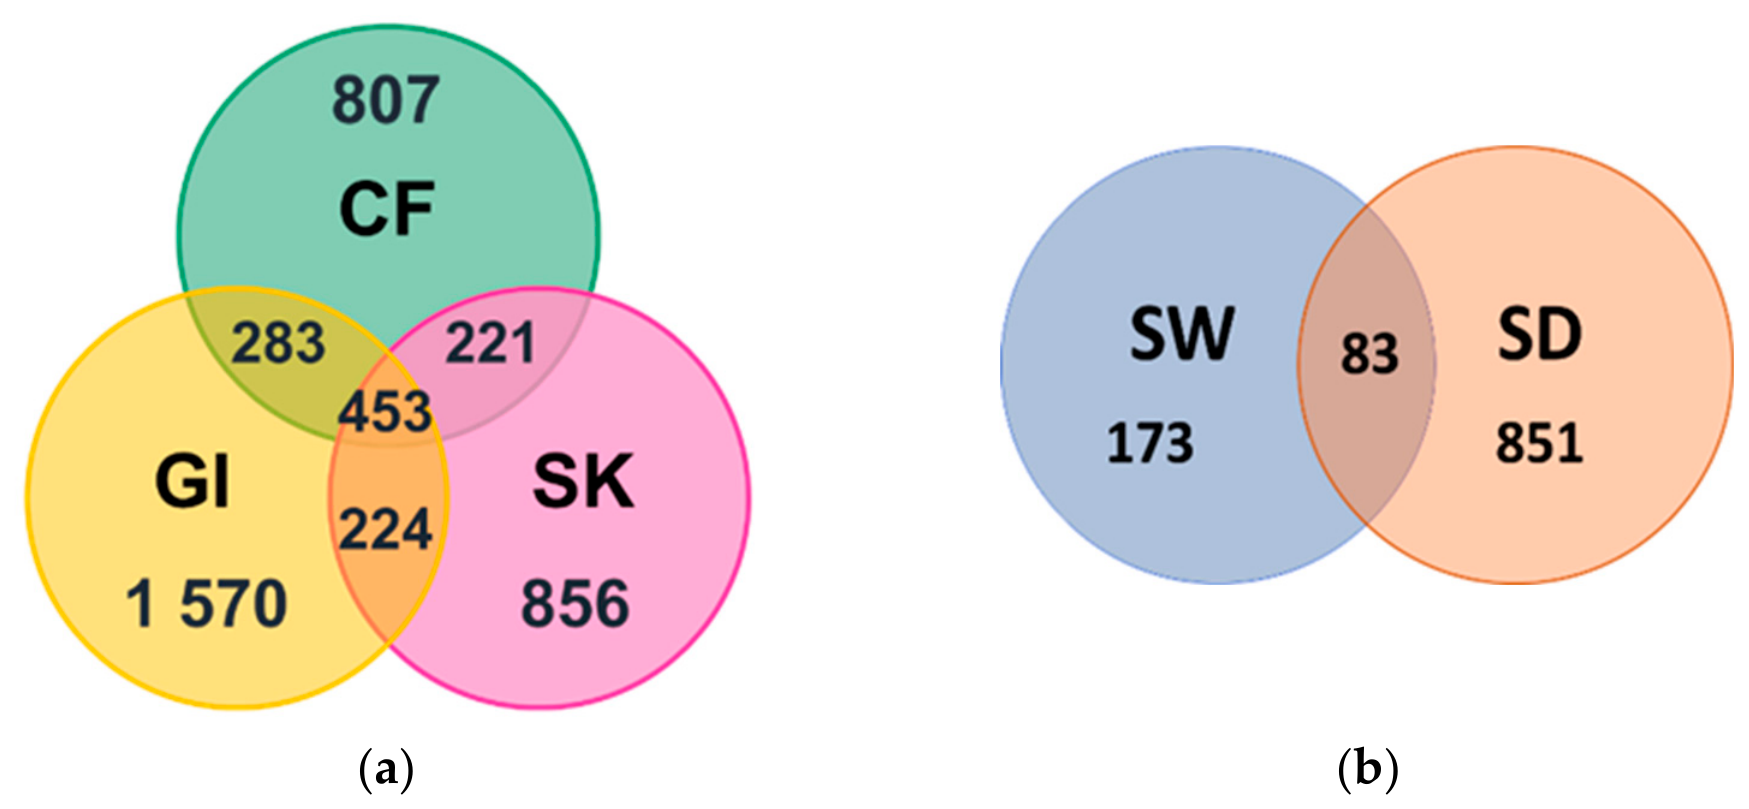
“Specific” OTUs were determined from unshared and specific OTUs within the holobiont H. forskali. Of the 7503 OTUs present in the different microbiota of the host H. forskali, 4414 were unshared with the environment (59%). Among these, only a small proportion was shared between the three studied body regions (453 OTUs, 10%). Among the unshared OTUs, 807 were specific to the coelomic microbiota (representing 23% of the total coelomic microbiota), 1570 to the gastrointestinal microbiota (31% of the total gastrointestinal microbiota), and 856 to the epidermal microbiota (27% of the total epidermal microbiota) (Figure 7a). The most abundant of the specific OTUs belonged to Flavobacteriaceae (23 OTUs) and Legionellacea (38 OTUs) for the coelomic microbiota, Legionellaceae (65 OTUs) and Pirellulaceae (68 OTUs) for the gastrointestinal content microbiota, and Diplorickettsiaceae (43 OTUs) and Legionellaceae (48 OTUs) for the epidermal microbiota. These specific OTUS were mainly low-prevalent OTUs, except in the gastrointestinal microbiota. Among the OTUs from the environmental samples, 1107 were unshared OTUs with those of H. Forskali, and 7.5% was shared between the seawater bacterial community and the sediment bacterial community (Figure 7b).
Table 4 indicates the percentage of OTUs between samples. The highest level of shared OTUs was observed between the seawater sample and coelomic fluid sample (88%). The lowest level of shared OTUs was observed between the gastrointestinal content sample and seawater sample (21.6%).

3.7. Differential Abundance Analysis

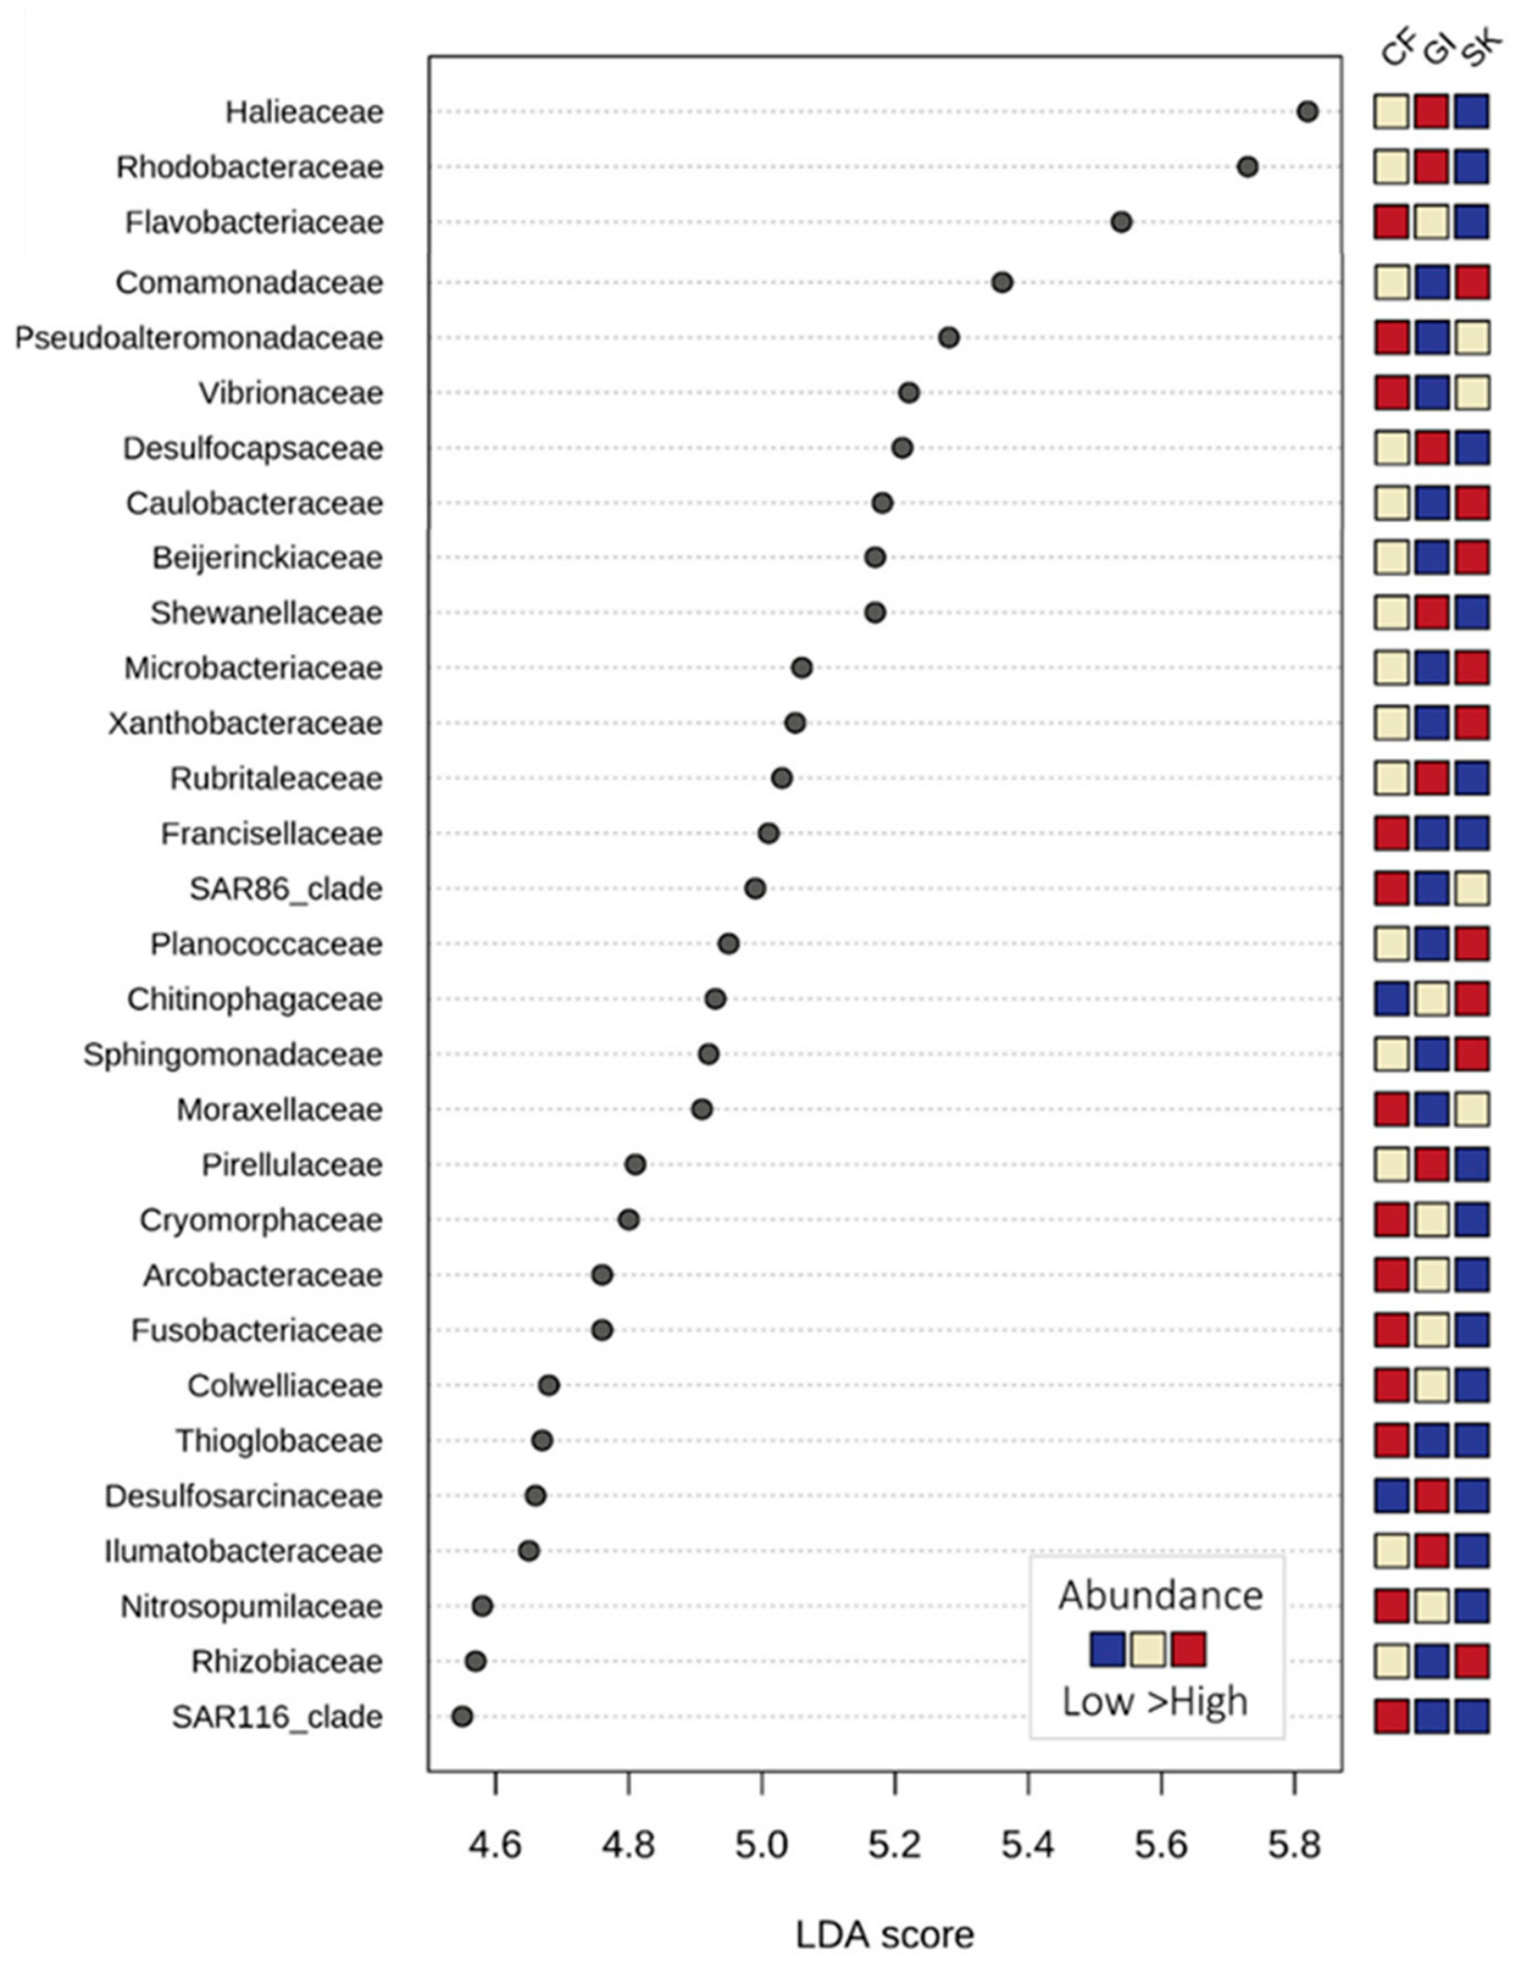
The different abundance profiles between the three explored microbiota were analysed using the LEFSe package (Figure 8). This differential abundance analysis highlighted the variation in the compositions in each compartment (i.e., epidermis surface, coelomic fluid, and gastointesinal content), identifying the most relevant families. Thus, the families Haliaceae, Rhodobacteraceae, Desulfocapsaceae, and Rubritaleaceae were significantly more abundant and representative of the gastrointestinal content microbiota, whereas the marine families SAR116 clade or SAR86 clade were linked to the coelomic microbiota. At a lower taxonomic level, genera associated with differential abundance among compartments were identified, such as the genera Halioglobus or Shewanella in the gastrointestinal content microbiota, Pseudoalteromonas and Vibrio in the coelomic microbiota, and Sphingomonas and Caulobacter in the epidermal microbiota.

4. Discussion

In this study, the composition of the microbiota associated with three body regions (epidermis, gastrointestinal content, and coelomic fluid) within the host sea cucumber, H. forskali, was analysed using 16S metabarcoding at two sites in Brittany (France) and across three different periods in 2020.

4.1. Bacterial Assemblages Linked to Microbiota Associated with Body Regions Within the Host Were Temporally Variable

Bacterial communities from the three studied microbiota of the host sea cucumber and from two environmental components (seawater and sediment) were analysed and compared. Furthermore, this study drew on a large number of samples: seawater samples (n = 18), sediment samples (n = 18), coelomic microbiota (n = 91), gastrointestinal content microbiota (n = 91), and epidermal microbiota (n = 91). These microbiota from the sea cucumber were compared via several analyses: alpha-diversity, composition, and evaluation of community dissimilarities. Analysis of samples from the microbiota (n = 15 per type of sample and per sampling date) and bacterial communities of seawater (n = 3 per sampling date) and sediment (n = 3 per sampling date) exhibited significant differences in terms of intrinsic richness and diversity, with the highest values observed for the gastrointestinal content microbiota in comparison with the coelomic and the epidermal microbiota. The differential richness and intrinsic diversity among anatomical microbiota of a marine invertebrate host have already been described in shellfish [23,24] and in sea-stars [60]. In addition, the beta-diversity analysis based on community dissimilarities with the Bray–Curtis metric and the composition of the three microbiota from the sea cucumber at the family rank demonstrated the existence of distinct bacterial communities for each of the three biological samples, which were also distinct from the environmental bacterial communities of seawater and sediment. Moreover, these specific assemblages varied significantly over time and, to a lesser extent, across sites [61,62,63,64,65], regardless of the analytical approach used.

4.2. A Gastrointestinal Microbiota That Is Highly Diverse and Likely Connected with the Feeding Behaviour of the Host

The sediment and, to a lesser extent, the gastrointestinal content exhibited the richest and most diverse bacterial communities in comparison with the other two explored body regions and the seawater. Moreover, analysis of the alpha-diversity indices showed that the sediment communities were composed of many abundant OTUs per sample, whereas the gastrointestinal microbiota was composed of many low abundant OTUs. In low-anthropised ecosystems, the high diversity of bacterial communities in sediments has already been demonstrated [66,67] and linked to ecosystem services, such as organic matter decomposition and their role as a food source for detritivorous animals [68]. These results could be explained by the feeding behaviour of the sea cucumbers, which feed on the ambient sediment [69,70] and incorporate bacteria from the sediment into their microbiota [28]. The gastrointestinal microbiota and the bacterial communities of sediments shared 1993 OTUs, representing 39% of the total OTUs of the gastrointestinal content, and within these shared OTUs, 47% were specific and only found in these two sample types (n = 943 OTUs). These specific OTUs shared between the gastrointestinal microbiota and the bacterial communities of sediment belonged to abundant families of the gut microbiota, such as Haliaceae, Thermoanaerobaculaceae, or Pirellulaceae, or to typical families of bacteria described in sediments, such as Sedimenticolaceae, Haliaceae, or Desulfolunaceae [71,72]. These last families were shared with differential abundances between the gastrointestinal microbiota and bacterial community of sediment in comparison with the other compartments. These results validated the feeding behaviour and the food source for the host H. forskali [73,74]. Finally, the gastrointestinal microbiota was also subject to spatiotemporal variations, with a main contribution from the sampling period compared to the site. Results on temporal variations were consistent with biological observation of the host H. forskali and with studies conducted in other marine invertebrates. In late winter in the study area, natural broodstock of H. forskali reduces or ceases feeding until spawning in April–May [11,12,73]. Otherwise, seasonal variations in the surrounding environment, such as phytoplankton succession, seaweed development, or winter storms, also have an impact on available organic matter and bacterial assemblages in the sediment. To a lesser extent, spatial variations in the gastrointestinal microbiota were also observed, and were probably linked to local environmental factors such as feeding availability and sediment composition [28,61,75].

4.3. An Epidermal Microbiota as a Mirror of Its Environment

The epidermal microbiota exhibited spatial and temporal variations between site, period, and their interaction. The epidermis is the most external of the body compartments and was in fact in direct contact with the two environmental components, seawater (1006 OTUs shared, 32%) and sediment (821 OTUs shared, 26%). Moreover, 56% of the taxa (1754 OTUs) were absent in environmental samples and likely originated from the host itself and/or from other environmental components, including other eukaryotic organisms living in the same habitat, which contribute to exchanges of bacteria. Thus, these variations in microbiota were characteristic of the host habitat and other environmental factors. This proximity contributed to the diversity of the epidermal microbiota and of its habitat, and also participated in the host’s adaptation to environmental variation, with the epidermis acting as the first barrier against pathogens [64,76,77]. Results showed that the epidermis is a distinct biological compartment with its own microbiota.

4.4. The Coelomic Fluid, the Key Compartment in Echinoderms

In echinoderms, the coelomic fluid has been one of the most studied compartments because it is in contact with all organs and plays a major role in host physiology and immunity [78,79]. Antitumor compounds and antimicrobial and antifungal strains have been frequently detected in many different species of echinoderms [40,80,81] and in H. forskali [12,37,39,40]. The coelomic fluid contains its own microbiota, which includes a small proportion of culturable bacteria [32,37,40]. This microbiota has been described as containing unique bacteria [32,39]. In this study, results demonstrated that the coelomic microbiota differed from the other studied compartments in terms of composition, notably in the differential relative abundance of taxa and the presence of unshared taxa. The coelomic microbiota contained 23% of unshared and unique taxa (807 OTUs), representing a total abundance of 6.3%, suggesting that low-abundance taxa were associated with body-region-specific microbiota. On the other hand, the coelomic fluid and the environment shared typical marine taxa, such as the NS9 marine group or the SAR116 marine group, and exhibited a positive and significant differential abundance between them compared to the epidermis and the gastrointestinal microbiota. Even if the coelomic fluid used to be described as a closed compartment, the presence of marine taxa suggests the existence of exchanges with the environment, mainly the seawater. Given that the abundance of these taxa in the epidermis and gastrointestinal microbiota was much lower, the H. forskali host had to carry out exchanges with other organs, potentially via its respiratory tree. This respiratory tree, attached to the cloaca, is described as an exchange organ, responsible for gas exchange by aspiration of seawater through the anus, acting like a pump, and for excretion of metabolic waste [82,83,84]. Moreover, the coelomic fluid showed spatiotemporal variations. Temporal variations were already reported in the haemolymph of oysters [62], similar to spatial variations in other echinoderms [39,40,41,42,43,44,45,46,47,48,49,50,51,52,53,54,55,56,57,58,59,60,61,62,63,64,65,66,67,68,69,70,71,72,73,74,75,76,77,78,79,80,81,82,83,84,85]. All the organs of the host sea cucumber bathed in the coelomic fluid of the main body cavity and were already linked to it. Physiology and metabolism vary according to the host’s health and developmental stage. Given its diverse functions, the coelomic fluid and its associated microbiota likely exhibit similar variations. No specific organs of the sea cucumber have been investigated to date because they are all bathed in coelomic fluid; therefore, attention has been focused on this unique liquid tissue. There is a clear relationship between the microbiota of the coelomic fluid and that of the respiratory microbiota of the tree.

4.5. From Bacterial Composition to “Core Specific” Microbiota Associated with Body Regions Within the Sea Cucumber

Core microbiota has been widely studied, but its definition and scope remain debated [86,87,88,89]. It has been noted that the core microbiota could be investigated at different scales, from a tissue-specific core microbiota to a broader microbiota of a host or habitat [88]. According to the scientific literature, the parameters used to target the central microbiota include prevalence, with a threshold that varies widely depending on the authors [90,91]; prevalence combined with an abundance threshold [82,83]; or the presence of shared or unshared taxa, with unshared taxa often being correlated with low-abundant taxa [87,88].
Recent studies have explored a functional and dynamic core [89,92,93,94] that was temporally variable but also predictable. Depending on the scale of the microbiota and the information sought, the focus could be placed either on the commonalities or on divergence and specificities. In this study, different analyses were conducted to explore the concepts of core microbiota and specific microbiota and apply them to the host sea cucumber H. forskali. The core microbiota associated with each region/compartment was determined using a prevalence threshold of 0.5, exhibiting 46 core OTUs for the coelomic microbiota, 37 for the epidermal microbiota, and 108 for the gastrointestinal content microbiota. In these core OTUs, 29 were shared between the three compartments and may play a functional role for the host or its habitat [88,89]. These core OTUs were also characterised by high abundance. Conversely, some taxa were unevenly distributed according to the compartment in terms of abundance or were absent. These OTUs could reflect a specific role in the present compartment. Another point of view was to identify specific and unshared taxa for each compartment, and to focus on differences between the three microbiota. The presence of OTUs in one of the three compartments must be interpreted according to the specificities of that compartment. Finally, families correlated with a positive and significant differential abundance have been identified by biomarker analysis with the LEFSe package. By integrating data on core microbiota, specific microbiota, and abundant-correlated microbiota, some taxa were always found regardless of the indicator chosen, which indicated a strong relationship with the relevant compartment. These specific taxa were likely associated with anatomical functions—such as digestion with the family Rhodobacteraceae that is often found in the gastrointestinal content [27,95,96]—or immunity in the coelomic fluid, with the presence of Pseudoalteromonas, which is known to produce antibacterial peptides and is associated with marine invertebrates [97,98].
Remaining questions focus on the multiscale modulation of the microbiota, the reciprocal relationship between the host and its microbiota, and the mechanisms underlying these interactions.

5. Conclusions

In the present study, the microbiota of H. forskali was analysed and compared at different scales: in three “biological” compartments, at two sites, and at three periods across the year. Results confirmed the existence of distinct microbiota associated with body regions within the sea cucumber host—namely, the epidermal microbiota, the coelomic microbiota and the gastrointestinal content microbiota—and also highlighted their spatiotemporal variations. Regarding the coelomic fluid, it is noteworthy that bacteria and coelomocytes coexist; the antimicrobial and phagocytic activities of the latter likely prevent pathogen proliferation, thereby contributing to host immunity. Furthermore, a substantial microbiota was found to be common to both compartments analysed in this study. Do coelomocytes select bacteria present in the coelomic fluid? No comparison of the microbiota structures in the studied animal between the Glénan Archipelago and Pointe de Brézellec sites in relation to environmental factors was made due to the difficulty of analysing environmental parameters (except for temperature). Further investigation showed specific and core taxa associated with body regions within this host; these results offer new perspectives for studies aimed at understanding the function of these microbiota linked to the host. However, many questions remain unanswered. Further research is required to identify the factors maintaining these consistent bacterial associations. Understanding how variables like temperature and nutrient availability shape these consortia will help determine whether these relationships are truly symbiotic or whether certain bacteria simply occupy the host as a commensal habitat without offering functional advantages.

Author Contributions

Conceptualization, H.L. and P.L.C.; methodology, H.L. and P.L.C.; software, H.L. and C.N.; validation, H.L., C.N. and P.L.C.; formal analysis, C.M.; investigation, C.N.; resources, P.L.C. and C.J.; data curation, C.M.; writing—original draft preparation, H.L.; writing—review and editing, H.L. and P.L.C.; visualization, Y.F.; supervision, S.R.; project administration, P.L.C. All authors have read and agreed to the published version of the manuscript.

Funding

This work was funded by the European Maritime and Fisheries Fund in France (HOLOFARM project 4320175244-1.48 M €, FEAMP—Innovative Aquaculture—2018–2021).

Data Availability Statement

The original contributions presented in this study are included in the article. Further inquiries can be directed to the corresponding author.

Acknowledgments

Thanks to Hélène Laguerre for her thesis work: thesis title “Microbiote des Echinodermes: spécificité et plasticité des microbiotes chez Holothuria forskali (Echinodermata, Holothuroidea), Université de Bretagne Occidentale (UBO), Brest, France, 17 December 2021. Thanks to Loïc Gleyzes from Institut Universitaire Technologique (UBO) for logistical support (van, diving equipment, aquariums). Anthony Moyou is acknowledged for the correction of the text in English.

Conflicts of Interest

The authors declare no conflicts of interest.

Abbreviations

The following abbreviations are used in this manuscript:
dday
mmonth
OTUOperational Taxonomic Unit
RNARiboNucleic Acid
DNADesoxy riboNucleic Acid
LLiter
mLmilliLiter
BZPort of BZellec
GLGLénan Archipelagos
SKEpidermidis (SKin)
CFCoelomic Fluid
GIGastroIntesninal content
SWSea Water sample
SDSeDiment sample
ENVENVironmental samples (ie SW and SD)
PCRPolymerase Chain Reaction
LDALinear Discriminant Analysis
LEfSeLinear discriminant analysis Effect Size
nMDSnon-metric MultiDimensional Scaling

References

  1. Anderson, S.C.; Flemming, J.M.; Watson, R.; Lotze, H.K. Serial exploitation of global sea cucumber. Fish Fish. 2010, 12, 317–339. [Google Scholar] [CrossRef]
  2. Choo, P.S. Population Status; Fisheries and Trade of Sea Cucumbers in Asia; FAO Fisheries and Aquaculture Technical Paper 516; FAO: Rome, Italy, 2008. [Google Scholar]
  3. Conan, C.; Cornet, J.; Lovatelli, A. Global sea cucumber fisheries: An update for the last decade. J. Mar. Biol. Assoc. 2026, 106, e27. [Google Scholar] [CrossRef]
  4. Purcell, S.W.; Hair, C.A.; Mills, D.J. Sea cucumber culture; farming and sea ranching in the tropics: Progress; Problems and Opportunities. Aquaculture 2012, 368–369, 68–81. [Google Scholar] [CrossRef]
  5. Chen, J. Overview of Sea Cucumber Farming and Sea Ranching Practices in China. SPC Beche-de-mer Inf. Bull. 2003, 18, 18–23. [Google Scholar] [CrossRef]
  6. Purcell, S.W.; Conand, C.; Uthicke, S.; Byrne, M. Ecological roles of exploited sea cucumbers. In Oceanography and Marine Biology; CRC Press: Boca Raton, FL, USA, 2016; pp. 367–386. [Google Scholar] [CrossRef]
  7. Clements, C.-S.; Pratte, Z.A.; Stewart, F.-J.; Mark, E.H. Removal of detritivore sea cucumbers from reefs increases coral disease. Nat. Commun. 2024, 15, 1338. [Google Scholar] [CrossRef] [PubMed]
  8. Janakiram, N.; Mohammed, A.; Rao, C. Sea Cucumbers Metabolites as Potent Anti-Cancer Agents. Mar. Drugs 2015, 13, 2909–2923. [Google Scholar] [CrossRef] [PubMed]
  9. Domínguez-Godino, J.A.; Slater, M.J.; Hannon, C.; González-Wangüermert, M. A new species for sea cucumber ranching and aquaculture: Breeding and rearing of Holothuria arguinensis. Aquaculture 2015, 438, 122–128. [Google Scholar] [CrossRef]
  10. Marquet, N.; Conand, C.; Power, D.M.; Canário, A.V.M.; González-Wangüemert, M. Sea cucumbers; Holothuria arguinensis and H. mammata; from the southern Iberian Peninsula: Variation in reproductive activity between populations from different habitats. Fish. Res. 2017, 191, 120–130. [Google Scholar] [CrossRef]
  11. Laguerre, H.; Raymond, G.; Plan, P.; Améziane, N.; Bailly, X.; Le Chevalier, P. First description of embryonic and larval development; juvenile growth of the black sea cucumber Holothuria forskali (Echinodermata: Holothuroidea); a new species for aquaculture in the north-eastern Atlantic. Aquaculture 2020, 521, 734961. [Google Scholar] [CrossRef]
  12. Santos, R.; Dias, S.; Pinteus, S.; Silva, J.; Alves, C.; Tecelão, C. Sea cucumber Holothuria forskali; a new resource for aquaculture? Reproductive biology and nutraceutical approach. Aquac. Res. 2015, 47, 2307–2323. [Google Scholar] [CrossRef]
  13. Rakaj, A.; Fianchini, A.; Boncagni, P.; Lovatelli, A.; Scardi, M.; Cataudella, S. Spawning and rearing of Holothuria tubulosa: A new candidate for aquaculture in the Mediterranean region. Aquac. Res. 2018, 49, 557–568. [Google Scholar]
  14. Margulis, L. Origins of species: Acquired genomes and individuality. Biosystems 1993, 31, 121–125. [Google Scholar] [CrossRef] [PubMed]
  15. Theis, K.R.; Dheilly, N.M.; Klassen, J.L.; Brucker, R.M.; Baines, J.F.; Bosch, T.C.G.; Cryan, J.F.; Gilbert, S.F.; Goodnight, C.J.; Lloyd, E.A.; et al. Getting the Hologenome Concept Right: An Eco-Evolutionary Framework for Hosts and Their Microbiomes. mSystems 2016, 1, e00028-16. [Google Scholar] [CrossRef] [PubMed]
  16. Bordenstein, S.R.; Theis, K.R. Host Biology in Light of the Microbiome: Ten Principles of Holobionts and Hologenomes. PLoS Biol. 2015, 13, e1002226. [Google Scholar] [CrossRef] [PubMed]
  17. Limborg, M.T.; Alberdi, A.; Kodama, M.; Roggenbuck, M.; Kristiansen, K.; Gilbert, M.T.P. Applied Hologenomics: Feasibility and Potential in Aquaculture. Trends Biotechnol. 2018, 36, 252–264. [Google Scholar] [CrossRef] [PubMed]
  18. Rosenberg, E.; Koren, O.; Reshef, L.; Efrony, R.; Zilber-Rosenberg, I. The role of microorganisms in coral health; disease and evolution. Nat. Rev. Microbiol. 2007, 5, 355–362. [Google Scholar] [CrossRef] [PubMed]
  19. Sogin, M.L.; Morrison, H.G.; Huber, J.A.L.; Welch, D.M.; Huse, S.M.; Neal, P.R.; Arrieta, J.M.; Herndl, G.J. Microbial diversity in the deep sea and the underexplored “rare biosphere”. Proc. Natl. Acad. Sci. USA 2006, 103, 12115–12120. [Google Scholar] [CrossRef] [PubMed]
  20. Kumar, A.; Babu, G.; Lakra, W. DNA Metabarcoding: A New Approach for Rapid Biodiversity Assessment. J. Cell Sci. Mol. Biol. 2015, 2, 111. [Google Scholar]
  21. Turnbaugh, P.J.; Ley, R.E.; Hamady, M.; Fraser-Liggett, C.M.; Knight, R.; Gordon, J.I. The Human Microbiome Project. Nature 2007, 449, 804–810. [Google Scholar] [CrossRef] [PubMed]
  22. Butt, R.L.; Volkoff, H. Gut Microbiota and Energy Homeostasis in Fish. Front. Endocrinol. 2019, 10, 9. [Google Scholar] [CrossRef] [PubMed]
  23. Rossbach, S.; Cardenas, A.; Perna, G.; Duarte, C.M.; Voolstra, C.R. Tissue–Specific Microbiomes of the Red Sea Giant Clam Tridacna maxima Highlight Differential Abundance of Endozoicomonadaceae. Front. Microbiol. 2019, 10, 2661. [Google Scholar] [CrossRef] [PubMed]
  24. Dubé, C.E.; Ky, C.-L.; Planes, S. Microbiome of the Black–Lipped Pearl Oyster Pinctada margaritifera; A Multi-Tissue Description with Functional Profiling. Front. Microbiol. 2019, 10, 1548. [Google Scholar] [CrossRef] [PubMed]
  25. Meisterhans, G.; Raymond, N.; Girault, E.; Lambert, C.; Bourrasseau, L.; de Montaudouin, X.; Garabetian, F.; Jude-Lemeilleur, F. Structure of Manila Clam (Ruditapes philippinarum) Microbiota at the Organ Scale in Contrasting Sets of Individuals. Microb. Ecol. 2016, 71, 194–206. [Google Scholar] [PubMed]
  26. Lloyd-Price, J.; Abu-Ali, G.; Huttenhower, C. The healthy human microbiome. Genome Med. 2016, 8, 51. [Google Scholar] [CrossRef] [PubMed]
  27. Bogatyrenko, E.A.; Buzoleva, L.S. Characterization of the gut bacterial community of the Japanese sea cucumber Apostichopus japonicus. Microbiology 2016, 85, 116–123. [Google Scholar] [CrossRef]
  28. Gao, F.; Li, F.; Tan, J.; Yan, J.; Sun, H. Bacterial Community Composition in the Gut Content and Ambient Sediment of Sea Cucumber Apostichopus japonicus Revealed by 16S rRNA Gene Pyrosequencing. PLoS ONE 2014, 9, e100092. [Google Scholar] [CrossRef] [PubMed]
  29. Sha, Y.; Liu, M.; Wang, B.; Jiang, K.; Sun, G.; Wang, L. Gut bacterial diversity of farmed sea cucumbers Apostichopus japonicus with different growth rates. Microbiology 2016, 85, 109–115. [Google Scholar] [CrossRef]
  30. Chi, C.; Liu, J.-Y.; Fei, S.-Z.; Zhang, C.; Chang, Y.-Q.; Liu, X.-L.; Wang, G.-X. Effect of intestinal autochthonous probiotics isolated from the gut of sea cucumber (Apostichopus japonicus) on immune response and growth of A. japonicus. Fish Shellfish Immunol. 2014, 38, 367–373. [Google Scholar] [CrossRef] [PubMed]
  31. Yokoyama, H. Growth and food source of the sea cucumber Apostichopus japonicus cultured below fish cages–Potential for integrated multi-trophic aquaculture. Aquaculture 2013, 372–375, 28–38. [Google Scholar] [CrossRef]
  32. Enomoto, M.; Nakagawa, S.; Sawabe, T. Microbial Communities Associated with Holothurians: Presence of Unique Bacteria in the Coelomic Fluid. Microbes Environ. 2012, 27, 300–305. [Google Scholar] [CrossRef] [PubMed]
  33. Zhang, Z.; Xing, R.; Lv, Z.; Shao, Y.; Zhang, W.; Zhao, X.; Li, C. Analysis of gut microbiota revealed Lactococcus garviaeae could be an indicative of epidermal ulceration syndrome in farmed sea cucumber Apostichopus japonicus. Fish Shellfish Immunol. 2018, 80, 148–154. [Google Scholar] [CrossRef] [PubMed]
  34. Zhao, Y.; Yuan, L.; Wan, J.; Sun, Z.; Wang, Y.; Sun, H. Effects of potential probiotic Bacillus cereus EN25 on growth; immunity and disease resistance of juvenile sea cucumber Apostichopus japonicus. Fish Shellfish Immunol. 2016, 49, 237–242. [Google Scholar] [CrossRef] [PubMed]
  35. Tuwo, A.; Conand, C. Reproductive biology of the holothurian Holothuria forskali (Echinodermata). J. Mar. Biol. Assoc. 1992, 72, 745–758. [Google Scholar] [CrossRef]
  36. David, F.; Raymond, G.; Grys, J.; Ameziane, N.; Sadoul, B. Survival, Growth, and Food Resources of Juvenile Sea Cucumbers Holothuria forskali (Echinodermata, Holothuroidea) in Co-Culture with Shellfish in Brittany (France). Aquac. Nutr. 2024, 2024, 7098440. [Google Scholar] [CrossRef] [PubMed]
  37. León-Palmero, E.; Joglar, V.; Álvarez, P.A.; Martín-Platero, A.; Llamas, I.; Reche, I. Diversity and antimicrobial potential in sea anemone and holothurian microbiomes. PLoS ONE 2018, 13, e0196178. [Google Scholar] [CrossRef] [PubMed]
  38. Laguerre, H. The Echinoderm Microbiota: Specificities and Plasticity in the Microbiota of Holothuria forskali (Echinodermata, Holothuroidea) Microbiote des Echinodermes: Spécificité et Plasticité des Microbiotes chez Holothuria forskali (Echinodermata, Holothuroidea). Ph.D. Thesis, Université de Bretagne Occidentale, Brest, France, 2021. [Google Scholar]
  39. Laguerre, H.; Noël, C.; Jégou, C.; Fleury, Y.; Le Chevalier, P. The Cœlomic Microbiota Among Three Echinoderms: The Black Sea Cucumber Holothuria forskali, the Sea Star, Marthasterias glacialis, and the Sea Urchin, Sphaerechinus granularis. Biology 2025, 14, 430. [Google Scholar] [CrossRef] [PubMed]
  40. Offret, C.; Jégou, C.; Mounier, J.; Fleury, Y.; Le Chevalier, P. New insights into the haemo- and coelo-microbiota with antimicrobial activities from Echinodermata and Mollusca. J. Appl. Microbiol. 2019, 126, 23–31. [Google Scholar] [CrossRef] [PubMed]
  41. Taberlet, P.; Bonin, A.; Zinger, L.; Coissac, E. Environmental DNA: For Biodiversity Research and Monitoring; Oxford University Press: Oxford, UK, 2018; 268p. [Google Scholar]
  42. Boyer, F.; Mercier, C.; Bonin, A.; Le Bras, Y.; Taberlet, P.; Coissac, E. OBITools: A Unix-inspired software package for DNA metabarcoding. Mol. Ecol. Resour. 2015, 16, 176–182. [Google Scholar] [CrossRef] [PubMed]
  43. Escudié, F.; Auer, L.; Bernard, M.; Mariadassou, M.; Cauquil, L.; Vidal, K.; Maman, S.; Hernandez-Raquet, G.; Combes, S.; Pascal, G. FROGS: Find; Rapidly; OTUs with Galaxy Solution. Bioinformatics 2018, 34, 1287–1294. [Google Scholar] [PubMed]
  44. Mahé, F.; Rognes, T.; Quince, C.; de Vargas, C.; Dunthorn, M. Swarm: Robust and fast clustering method for amplicon-based studies. PeerJ 2014, 2, e593. [Google Scholar] [CrossRef] [PubMed]
  45. Edgar, R.C. Search and clustering orders of magnitude faster than BLAST. Bioinformatics 2010, 26, 2460–2461. [Google Scholar] [CrossRef] [PubMed]
  46. Rognes, T.; Flouri, T.; Nichols, B.; Quince, C.; Mahé, F. VSEARCH: A versatile open source tool for metagenomics. PeerJ 2016, 4, e2584. [Google Scholar] [CrossRef] [PubMed]
  47. Camacho, C.; Coulouris, G.; Avagyan, V.; Ma, N.; Papadopoulos, J.; Bealer, K.; Madden, T.L. BLAST+: Architecture and applications. BMC Bioinform. 2009, 10, 421. [Google Scholar] [CrossRef] [PubMed]
  48. R Core Team. R: A Language and Environment for Statistical Computing; R Foundation for Statistical Computing: Vienna, Austria, 2012; Available online: https://www-r-project.org (accessed on 9 June 2026).
  49. McMurdie, P.J.; Holmes, S. phyloseq: An R Package for Reproducible Interactive Analysis and Graphics of Microbiome Census Data. PLoS ONE 2013, 8, e61217. [Google Scholar] [CrossRef] [PubMed]
  50. Oksanen, J.; Blanchet, F.G.; Friendly, M.; Kindt, R.; Legendre, P.; McGlinn, D.; Wagner, H. vegan: Community Ecology Package. 2019. Available online: https://CRAN.R-project.org/package=vegan (accessed on 9 June 2026).
  51. Anderson, M.J.; Ellingsen, K.E.; McArdle, B.H. Multivariate dispersion as a measure of beta diversity. Ecol. Lett. 2006, 9, 683–693. [Google Scholar] [CrossRef] [PubMed]
  52. Legendre, P.; Gallagher, E.D. Ecologically meaningful transformations for ordination of species data. Oecologia 2001, 129, 271–280. [Google Scholar] [CrossRef] [PubMed]
  53. Bokulich, N.A.; Subramanian, S.; Faith, J.J.; Gevers, D.; Gordon, J.I.; Knight, R.; Mills, D.A.; Caporaso, J.G. Quality-filtering vastly improves diversity estimates from Illumina amplicon sequencing. Nat. Methods 2013, 10, 57–59. [Google Scholar] [CrossRef] [PubMed]
  54. Wickham, H. ggplot2: Elegant Graphics for Data Analysis, 2nd ed.; Springer International Publishing: Berlin/Heidelberg, Germany, 2016; Available online: https://www.springer.com/gp/book/9783319242750 (accessed on 9 June 2026).
  55. Anderson, M.J. Permutational Multivariate Analysis of Variance (PERMANOVA). In Statistics American Cancer Society; Wiley StatsRef: Hoboken, NJ, USA, 2017; pp. 1–15. [Google Scholar] [CrossRef]
  56. Shetty, S.A.; Hugenholtz, F.; Lahti, L.; Smidt, H.; de Vos, W.M. Intestinal microbiome landscaping: Insight in community assemblage and implications for microbial modulation strategies. FEMS Microbiol. Rev. 2017, 41, 182–199. [Google Scholar] [CrossRef] [PubMed]
  57. Segata, N.; Izard, J.; Waldron, L.; Gevers, D.; Miropolsky, L.; Garrett, W.S.; Huttenhower, C. Metagenomic biomarker discovery and explanation. Genome Biol. 2011, 12, R60. [Google Scholar] [CrossRef] [PubMed]
  58. Chong, J.; Liu, P.; Zhou, G.; Xia, J. Using MicrobiomeAnalyst for comprehensive statistical; functional; and meta-analysis of microbiome data. Nat. Protoc. 2020, 15, 799–821. [Google Scholar] [CrossRef] [PubMed]
  59. Dhariwal, A.; Chong, J.; Habib, S.; King, I.L.; Agellon, L.B.; Xia, J. MicrobiomeAnalyst: A web–based tool for comprehensive statistical; visual and meta-analysis of microbiome data. Nucleic Acids Res. 2017, 45, W180–W188. [Google Scholar] [CrossRef] [PubMed]
  60. Jackson, E.W.; Pepe-Ranney, C.; Debenport, S.J.; Buckley, D.H.; Hewson, I. The Microbial Landscape of Sea Stars and the Anatomical and Interspecies Variability of Their Microbiome. Front. Microbiol. 2018, 9, 1829. [Google Scholar] [CrossRef] [PubMed]
  61. Offret, C.; Paulino, S.; Gauthier, O.; Château, K.; Bidault, A.; Corporeau, C.; Miner, P.; Petton, B.; Pernet, F.; Fabioux, C.; et al. The marine intertidal zone shapes oyster and clam digestive bacterial microbiota. FEMS Microbiol. Ecol. 2020, 96, fiaa078. [Google Scholar] [CrossRef] [PubMed]
  62. Lokmer, A.; Goedknegt, M.A.; Thieltges, D.W.; Fiorentino, D.; Kuenzel, S.; Baines, J.F.; Wegner, K.M. Spatial and Temporal Dynamics of Pacific Oyster Hemolymph Microbiota across Multiple Scales. Front. Microbiol. 2016, 7, 1367. [Google Scholar] [CrossRef] [PubMed]
  63. Yung, C.M.; Ward, C.S.; Davis, K.M.; Johnson, Z.I.; Hunt, D.E. Insensitivity of Diverse and Temporally Variable Particle-Associated Microbial Communities to Bulk Seawater Environmental Parameters. Appl. Environ. Microbiol. 2016, 82, 3431. [Google Scholar] [CrossRef] [PubMed]
  64. Chiarello, M.; Auguet, J.C.; Bettarel, Y.; Bouvier, C.; Claverie, T.; Graham, N.A.J.; Rieuvilleneuve, F.; Sucré, E.; Bouvier, T.; Villéger, S. Epidermis microbiome of coral reef fish is highly variable and driven by host phylogeny and diet. Microbiomes 2018, 6, 147. [Google Scholar] [CrossRef] [PubMed]
  65. Gobet, A.; Mest, L.; Perennou, M.; Dittami, S.M.; Caralp, C.; Coulombet, C.; Huchette, S.; Roussel, S.; Michel, G.; Leblanc, C. Seasonal and algal diet-driven patterns of the digestive microbiota of the European abalone Haliotis tuberculate: A generalist marine herbivore. Microbiome 2018, 6, 60. [Google Scholar] [CrossRef] [PubMed]
  66. Polinski, J.M.; Bucci, J.P.; Gasser, M.; Bodnar, A.G. Metabarcoding assessment of prokaryotic and eukaryotic taxa in sediments from Stellwagen Bank National Marine Sanctuary. Sci. Rep. 2019, 9, 14820. [Google Scholar] [CrossRef] [PubMed]
  67. Harrison, J.P.; Chronopoulou, P.-M.; Salonen, I.S.; Jilbert, T.; Koho, K.A. 16S and 18S rRNA Gene Metabarcoding Provide Congruent Information on the Responses of Sediment Communities to Eutrophication. Front. Mar. Sci. 2021, 8, 862. [Google Scholar] [CrossRef]
  68. Kristensen, E.; Haese, R.R.; Kostka, J.E. Interactions Between Macro–and Microorganisms in Marine Sediments; American Geophysical Union: Washington, DC, USA, 2005; 391p. [Google Scholar]
  69. Uthicke, S. Sediment bioturbation and impact of feeding activity of Holothuria (Halodeima) Atra and Stichopus Chloronotus, two sediment feeding Holothurians, at Lizard Island, Great Barrier Reef. Bull. Mar. Sci. 1999, 64, 129–141. [Google Scholar]
  70. Plotieau, T.; Lavitra, T.; Gillan, D.; Eeckhaut, I. Bacterial diversity of the sediments transiting through the gut of Holothuria scabra (Holothuroidea; Echinodermata). Mar. Biol. 2013, 160, 3087–3101. [Google Scholar] [CrossRef]
  71. Vavourakis, C.D.; Mehrshad, M.; Balkema, C.; van Hall, R.; Andrei, A.Ş.; Ghai, R.; Sorokin, D.Y.; Muyzer, G. Metagenomes and metatranscriptomes shed new light on the microbial-mediated sulfur cycle in a Siberian soda lake. BMC Biol. 2019, 17, 69. [Google Scholar] [CrossRef] [PubMed]
  72. Han, J.R.; Ye, M.Q.; Wang, C.; Du, Z.J. Halioglobus sediminis sp. nov.; isolated from coastal sediment. Int. J. Syst. Evol. Microbiol. 2019, 69, 1601–1605. [Google Scholar] [CrossRef] [PubMed]
  73. David, F.; Hubas, C.; Laguerre, H.; Badou, A.; Herault, G.; Bordelet, T.; Sorokin, D.Y.; Muyzer, G. Food sources; digestive efficiency and resource allocation in the sea cucumber Holothuria forskali (Echinodermata: Holothuroidea): Insights from pigments and fatty acids. Aquac. Nutr. 2020, 26, 1568–1583. [Google Scholar] [CrossRef]
  74. MacDonald, C.L.E.; Stead, S.M.; Slater, M.J. Consumption and remediation of European Seabass (Dicentrarchus labrax) waste by the sea cucumber Holothuria forskali. Aquac. Int. 2013, 21, 1279–1290. [Google Scholar] [CrossRef]
  75. Mattila, J.M.; Zimmer, M.; Vesakoski, O.; Jormalainen, V. Habitat-specific gut microbiota of the marine herbivore Idotea balthica (Isopoda). J. Exp. Mar. Biol. Ecol. 2014, 455, 22–28. [Google Scholar] [CrossRef]
  76. Rebollar, E.A.; Gutiérrez-Preciado, A.; Noecker, C.; Eng, A.; Hughey, M.C.; Medina, D.; Walke, J.B.; Borenstein, E.; Jensen, R.V.; Belden, L.K.; et al. The Epidermis Microbiome of the Neotropical Frog Craugastor fitzingeri: Inferring Potential Bacterial-Host-Pathogen Interactions From Metagenomic Data. Front. Microbiol. 2018, 9, 466. [Google Scholar] [CrossRef] [PubMed]
  77. Deng, H.; He, C.; Zhou, Z.; Liu, C.; Tan, K.; Wang, N.; Jiang, B.; Gao, X.; Liu, W. Isolation and pathogenicity of pathogens from epidermis ulceration disease and viscera ejection syndrome of the sea cucumber Apostichopus japonicus. Aquaculture 2009, 287, 18–27. [Google Scholar] [CrossRef]
  78. Smith, L.C.; Ghosh, J.; Buckley, K.M.; Clow, L.A.; Dheilly, N.M.; Haug, T.; Henson, J.H.; Li, C.; Lun, C.M.; Majeske, A.J.; et al. Echinoderm Immunity. In Invertebrate Immunity; Söderhäll, K., Ed.; Springer: Boston, MA, USA, 2010; pp. 260–301. [Google Scholar] [CrossRef] [PubMed]
  79. Chen, M.; Wang, F.; Xing, K.; Zhu, A.; Zhang, S. Immunology and Diseases. In Developments in Aquaculture and Fisheries Science; Elsevier: Amsterdam, The Netherlands, 2015; pp. 257–287. Available online: https://linkinghub.elsevier.com/retrieve/pii/B9780127999531000155 (accessed on 9 June 2026).
  80. Smith, L.C.; Arizza, V.; Barela-Hudgell, M.A.; Barone, G.; Bodnar, A.G.; Buckley, K.M.; Cunsolo, V.; Dheilly, N.M.; Franchi, N.; Fugmann, S.D.; et al. Echinodermata: The Complex Immune System in Echinoderms. In Advances in Comparative Immunology; Cooper, E.L., Ed.; Springer International Publishing: Cham, Switzerland, 2018; pp. 409–501. [Google Scholar] [CrossRef]
  81. Yu, S.; Ye, X.; Chen, L.; Xie, X.; Zhou, Q.; Lian, X.Y.; Zhang, Z. Cytotoxic and anti-colorectal tumor effects of sulfated saponins from sea cucumber Holothuria moebii. Phytomedicine 2015, 22, 1112–1119. [Google Scholar] [CrossRef] [PubMed]
  82. Jaeckle, W.B.; Strathmann, R.R. The anus as a second mouth: Anal suspension feeding by an oral deposit-feeding sea cucumber. Invertebr. Biol. 2013, 132, 62–68. [Google Scholar] [CrossRef]
  83. Huo, D.; Sun, L.; Li, X.; Ru, X.; Liu, S.; Zhang, L.; Xing, L.; Yang, H. Differential Expression of miRNAs in the Respiratory Tree of the Sea Cucumber Apostichopus japonicus Under Hypoxia Stress. G3 2017, 7, 3681–3692. [Google Scholar] [CrossRef] [PubMed]
  84. Ru, X.; Zhang, L.; Liu, S.; Yang, H. Plasticity of Respiratory Function Accommodates High Oxygen Demand in Breeding Sea Cucumbers. Front. Physiol. 2020, 11, 283. [Google Scholar] [CrossRef] [PubMed]
  85. Nakagawa, S.; Saito, H.; Tame, A.; Hirai, M.; Yamaguchi, H.; Sunata, T.; Aida, M.; Muto, H.; Sawayama, S.; Takaki, Y. Microbiota in the coelomic fluid of two common coastal starfish species and characterization of an abundant Helicobacter-related taxon. Sci. Rep. 2017, 7, 8764. [Google Scholar] [CrossRef] [PubMed]
  86. Astudillo-García, C.; Bell, J.J.; Webster, N.S.; Glasl, B.; Jompa, J.; Montoya, J.M.; Taylor, M.W. Evaluating the core microbiota in complex communities: A systematic investigation: Core microbiota in complex communities. Environ. Microbiol. 2017, 19, 1450–1462. [Google Scholar] [CrossRef] [PubMed]
  87. Ainsworth, T.D.; Krause, L.; Bridge, T.; Torda, G.; Raina, J.-B.; Zakrzewski, M.; Gates, R.D.; Padilla-Gamiño, J.L.; Spalding, H.L.; Smith, C.; et al. The coral core microbiome identifies rare bacterial taxa as ubiquitous endosymbionts. ISME J. 2015, 9, 2261–2274. [Google Scholar] [CrossRef] [PubMed]
  88. Risely, A. Applying the core microbiome to understand host–microbe systems. J. Anim. Ecol. 2020, 89, 1549–1558. [Google Scholar] [CrossRef] [PubMed]
  89. Lemanceau, P.; Blouin, M.; Muller, D.; Moënne-Loccoz, Y. Let the Core Microbiota Be Functional. Trends Plant Sci. 2017, 22, 583–595. [Google Scholar] [CrossRef] [PubMed]
  90. Lowe, B.A.; Marsh, T.L.; Isaacs-Cosgrove, N.; Kirkwood, R.N.; Kiupel, M.; Mulks, M.H. Defining the « core microbiome » of the microbial communities in the tonsils of healthy pigs. BMC Microbiol. 2012, 12, 20. [Google Scholar] [CrossRef] [PubMed]
  91. Aguirre de Cárcer, D. The human gut pan-microbiome presents a compositional core formed by discrete phylogenetic units. Sci. Rep. 2018, 8, 14069. [Google Scholar] [CrossRef] [PubMed]
  92. Shade, A.; Handelsman, J. Beyond the Venn diagram: The hunt for a core microbiome: The hunt for a core microbiome. Environ. Microbiol. 2012, 14, 4–12. [Google Scholar] [PubMed]
  93. Piazzon, C.; Naya-Català, F.; Simó-Mirabet, P.; Picard-Sanchez, A.; Roig, F.; Calduch-Giner, J.; Sitjà-Bobadilla, A.; Pérez-Sánchez, J. Sex; Age; and Bacteria: How the Intestinal Microbiota Is Modulated in a Protandrous Hermaphrodite Fish. Front. Microbiol. 2019, 10, 2512. [Google Scholar] [CrossRef] [PubMed]
  94. Björk, J.R.; O’Hara, R.B.; Ribes, M.; Coma, R.; Montoya, J.M. The dynamic core microbiome: Structure; dynamics and stability. BioRxiv 2017. [Google Scholar] [CrossRef]
  95. Wang, Y.; Wang, K.; Huang, L.; Dong, P.; Wang, S.; Chen, H.; Lu, Z.; Hou, D.; Zhang, D. Fine-scale succession patterns and assembly mechanisms of bacterial community of Litopenaeus vannamei larvae across the developmental cycle. Microbiome 2020, 8, 106. [Google Scholar] [CrossRef] [PubMed]
  96. Steiner, K.; Heasman, K.; Laroche, O.; Pochon, X.; Preece, M.; Bowman, J.P.; Walker, S.P.; Symonds, J.E. The microbiome of Chinook salmon (Oncorhynchus tshawytscha) in a recirculation aquaculture system. Aquaculture 2021, 534, 736227. [Google Scholar] [CrossRef]
  97. Offret, C.; Desriac, F.; Le Chevalier, P.; Mounier, J.; Jégou, C.; Fleury, Y. Spotlight on Antimicrobial Metabolites from the Marine Bacteria Pseudoalteromonas: Chemodiversity and Ecological Significance. Mar. Drugs 2016, 14, 129. [Google Scholar] [CrossRef] [PubMed]
  98. Yvin, M.; Mühle, E.; Chesneau, O.; Laguerre, H.; Brillet, B.; Fleury, Y.; Jégou, C.; Kämpfer, P.; Lipski, A.; Criscuolo, A.; et al. Pseudoalteromonas holothuriae sp. nov., isolated from the sea cucumber Holothuria forskali. Int. J. Syst. Evol. Microbiol. 2025, 75, 006601. [Google Scholar] [CrossRef] [PubMed]
Figure 1. Sampling areas along the west coast of Brittany, France. The Port of Brézellec in the western tip of Brittany (site and diving area located with a green point noted “BZ”), and the Glénan Archipelago in the southwest coast of Brittany (site and diving area located with a blue point, noted “GL”).
Diversity 18 00399 g001
Figure 2. Basic sea cucumber anatomy and sampling areas. All organs are bathed in the coelomic fluid and cavity. Sampling areas in the sea cucumber for this study include the following: (❶) epidermis swabbing (SK), (❷) coelomic fluid (CF) collection with syringe within the coelomic cavity, and (❸) dissection of the posterior gastrointestinal (GI) tractus to extract the fluid/solid content.
Diversity 18 00399 g002
Figure 3. Alpha-diversity analysis. (A): Chao1 richness, Shannon, and inverse Simpson diversity indices according to the three body regions within the organism and environmental compartment; (B): Rarefaction curves of environmental samples; (C): Rarefaction curves of the three studied microbiota of H. forskali. Code: CF = coelomic fluid microbiota, GI = gastrointestinal content, SK = epidermis, SW = seawater, SD = sediment.
Diversity 18 00399 g003
Figure 4. nMDS plots of sample dissimilarities based on the Bray–-Curtis distance. (A): nMDS plot of all samples with ellipses (95% confidence); (B): nMDS on samples of coelomic fluid microbiota (CF); (C): nMDS with samples of gastrointestinal content microbiota (GI); (D): nMDS with samples of epidermal microbiota (SK); (E): nMDS with environmental samples (ENV = SW (seawater sample) + SD (sediment sample)); Code: BZ = site of Brézellec; GL = Glénan Archipelago.
Diversity 18 00399 g004
Figure 5. Relative abundance of the 15 principal families present in each type of sample. Code: CF = coelomic fluid microbiota; GI = gastrointestinal microbiota; SK = epidermal microbiota; SW = seawater; SD = sediment; BZ = site of Brézellec; GL = Glénan Archipelago.
Diversity 18 00399 g005
Figure 6. Plot of studied microbiota at the taxonomic rank family. (A). CF: Coelomic fluid core microbiota; (B). GI: Microbiota of the gastrointestinal content; (C). SK: epidermal microbiota. Values on each bar plot: number of core OTUs per family. Code: CF = coelomic fluid microbiota; GI = gastrointestinal content microbiota; SK = epidermal microbiota.
Diversity 18 00399 g006
Figure 7. (a): Venn diagrams representing the numbers of shared and unshared OTUs between the three body regions’ microbiota within the host: CF, coelomic fluid microbiota (green); GI, gastrointestinal content microbiota (yellow); SK, epidermal microbiota (red). (b): Venn diagram representing the numbers of unshared OTUs from the environment (seawater—SW (grey) and sediment—SD (chair)) with those of the three body regions’ microbiota; within these environmental OTUs, shared and unshared OTUs between the two environmental samplings are also shown.
Diversity 18 00399 g007
Figure 8. Differential abundance profiles among explored compartment by LDA analysis (LEFSe). The thirty most relevant families were selected with LDA. Code: CF = coelomic fluid microbiota; GI = gastrointestinal content microbiota; SK = epidermal microbiota.
Diversity 18 00399 g008
Table 1. Sampling dates and conditions (d = day; m = month).
YearDate (d/m)SiteSeawater
Temperature (°C)
Season
202031/1BZ9winter
22/1GL9winter
26/5BZ15summer
2/6GL15summer
29/9BZ16autumn
16/10GL14autumn
Table 2. Statistics on alpha-diversity indices. Kruskal—Wallis test, threshold 0.05.
Total
Samples
Chao1ShannonInverse Simpson
dfChi-Squaredp-ValueChi-Squaredp-ValueChi-Squaredp-Value
3094131.45<2.2 × 10−16 *119.24<2.2 × 10−16 *62.6188.17 × 10−13 *
* Significant for p-value < threshold 0.05.
Table 3. Permutational multivariate analysis of variance (Permanova). Number of permutations: 999; method: distance of Bray–Curtis; threshold 0.05.
Body Region of
the Sea Cucumber
PERMANOVA
VariablesdfSum of SqsR2Fp-Value
AllBody region of
the sea cucumber
418.2970.1923118.0960.001 *
Coelomic fluid
(n = 91)
Site10.65240.027452.7540.001 *
Period22.50810.105515.29350.001 *
Site × Period54.79590.201754.29650.001 *
Gastro-intestinal
content (n = 91)
Site10.58050.023592.37780.005 *
Period22.78470.113195.70370.001 *
Site × Period54.59760.186873.90680.001 *
Epidermis
(n = 91)
Site10.45590.021792.06080.005 *
Period21.2170.058172.75050.001 *
Site × Period52.62630.125532.44040.001 *
* Significant for p-value < threshold 0.05.
Table 4. Percentage of shared OTUs between the three body-region microbiota within the host and the environmental bacterial communities: CF, coelomic fluid microbiota; GI, gastrointestinal content microbiota; SK, epidermal microbiota; SW, bacterial communities of seawater; SD, bacterial communities of sediment. (Horizontal reading of the table: number of shared OTUs between the two microbiota/total number of OTUs of the horizontal microbiota designated as “reference microbiota”). For instance, 35.2% of the OTUs found in seawater are also present in the coelomic fluid.
Reference
microbiota
% Shared OTUs
CFGISKSWSD
CF100.060.051.034.732.1
GI42.0100.037.121.639.0
SK57.760.0100.031.826.0
SW88.078.171.2100.049.8
SD35.261.025.121.5100.0
Disclaimer/Publisher’s Note: The statements, opinions and data contained in all publications are solely those of the individual author(s) and contributor(s) and not of MDPI and/or the editor(s). MDPI and/or the editor(s) disclaim responsibility for any injury to people or property resulting from any ideas, methods, instructions or products referred to in the content.