Article

Butterfly Community Structure in Ziwuling Forest of Gansu Province and Its Environmental Correlates: A Focus on Sericinus montela


1
School of Agriculture and Bioengineering, Longdong University, Qingyang 745000, China
2
Gansu Key Laboratory of Protection and Utilization for Biological Resources and Ecological Restoration, Qingyang 745000, China
3
Panke Forest Farm, Ningxian Branch, Ziwuling Forestry Administration of Gansu Province, Qingyang 745000, China
*
Author to whom correspondence should be addressed.
Diversity 2026, 18(6), 352; https://doi.org/10.3390/d18060352
Submission received: 29 April 2026 / Revised: 6 June 2026 / Accepted: 8 June 2026 / Published: 11 June 2026
(This article belongs to the Special Issue Biodiversity, Ecology and Conservation of Lepidoptera)

Abstract

Butterflies are key components of biodiversity and sensitive indicators of environmental change. Ziwuling Forest is one of the essential biodiversity conservation areas in China. In this study, we investigated butterfly diversity and community structure across different habitats and months in Ziwuling Forest using the line transect method from May to September 2024. We also investigated the connection between the abundance of Sericinus montela Gray and environmental factors. A total of 2337 individuals were recorded across 84 species, 43 genera, and five families. The most frequent family was Nymphalidae, and the dominant species were Fabriciana adippe (Denis et Schiffermüller) and Gonepteryx mahaguru (Gistel). There were extremely high levels of variation in the butterfly diversity between habitats, with the highest diversity index observed in deciduous shrublands. Species richness, number of individuals and diversity index of butterflies varied statistically significantly higher in July as compared to any other month. The investigation of the relationship between the amount of S. montela and environmental conditions showed that altitude, precipitation, and temperature are the key factors that define the distribution of S. montela, and thus can serve as a reliable indicator of environmental change. Overall, this paper elucidates the structural features of butterfly communities of Ziwuling Forest in Gansu Province and the environmental flexibility of S. montela and thus provides sound reasoning to protect the diversity of butterfly communities and ecosystem management of the Loess Plateau.

1. Introduction

Biodiversity is important in maintaining the structural and functional stability of ecosystems [1]. In that sense, butterflies are quite useful because they can serve as indicators of climatic conditions, ecological balance, habitat quality, and the success of the restoration project [2,3,4]. It has an impact on significant ecosystem processes like nutrient cycling, plant population dynamics, and predator–prey interactions. The association between butterfly diversity and various environmental variables has been studied in previous works, such as local climate [5,6], vegetation habitat [7,8], altitude [9], and disturbance [10,11]. Such sensibility being considered, long-term observation of butterflies can be a realistic opportunity to assess the sustainability and resilience of the ecosystems in any locality. Furthermore, it is necessary to have a thorough understanding of the structure of the butterfly community and how it responds to environmental changes so as to be able to effectively use and preserve the butterfly resources over time.
As early as the conclusion of the 20th century, some other countries, including the United States and the United Kingdom, had conducted butterfly resource national surveys. Other studies have greatly contributed to the understanding of the dynamics of butterfly communities, diversity structure, phylogeny and conservation of threatened species [12,13,14,15]. These results have given a scientific basis to the conservation and use of butterfly resources in a sustainable way. The subsequent research on the butterfly community diversity has been performed in the Chinese nature reserves, forest parks and other various biodiversity hotspots in China, where the butterfly diversity is especially high [16,17,18]. Ziwuling Forest lies in the Loess Plateau area of Northwestern China, and it is the biggest continuous secondary forest in the area. It serves as a major water conservancy reserve and plays an important part in maintaining the soil and water of the Yellow River Basin [19]. The Ziwuling Forest region has an invaluable ecological position in the biodiversity of the region because it has diverse vegetation, which supports many rare species, and is conducive to butterflies. Butterflies in Ziwuling Forest were studied by Jiang et al. in 2000 [20]. However, due to natural succession and anthropogenic factors, the species composition and diversity of butterfly communities in this area have likely changed over the past two decades. We therefore conducted a survey of butterfly community diversity in this region with the following objectives: (1) describing the composition of butterfly species; (2) comparing the richness, abundance, and diversity of species among major habitats; and (3) studying monthly changes in butterfly diversity. These results will offer a scientific basis for the conservation and sustainable use of the butterfly resources in the Ziwuling Forest.
Sericinus montela Gray is a species of swallowtail butterfly endemic to East Asia. Larvae mostly eat the plants of the family Aristolochiaceae and exhibit specific habitat requirements, and thus this species is a good environmental indicator [21,22,23]. The butterfly survey carried out in this research indicated that S. montela is mainly situated in low-altitude zones, whereas it is rarely found in high-altitude zones. This species’ distribution seems to depend on the altitude and climatic conditions. Consequently, the research examined the relationship between the abundance of S. montela and different environmental variables as the basis of the overall knowledge of the distribution patterns of the species and its possible response to climate change.

2. Materials and Methods

2.1. Study Area

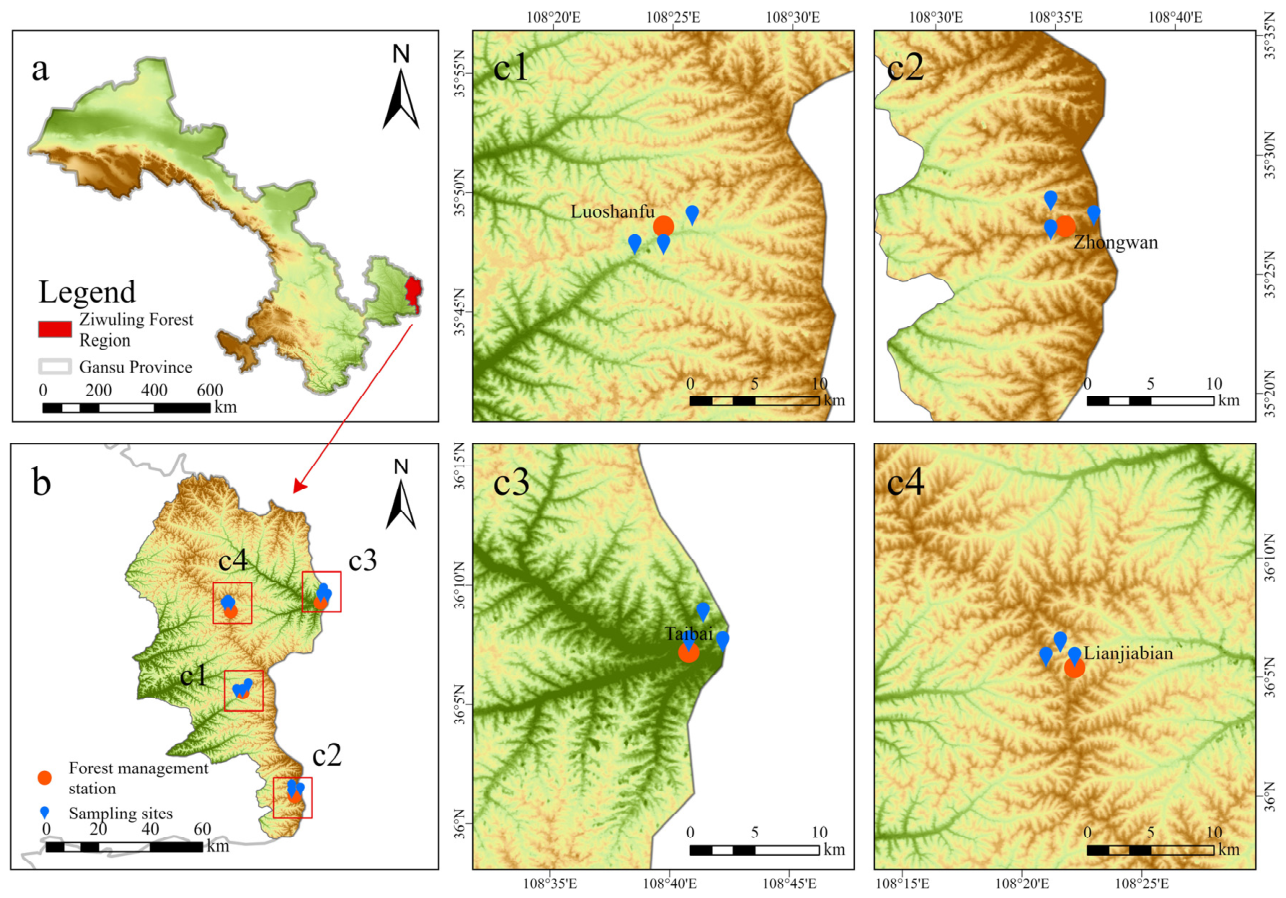
Ziwuling Forest is located on the territory of Qingyang City, Gansu Province, crossing over Huachi, Heshui, Ning, and Zhengning counties (Figure 1). It has Fuxian, Huangling, and Yijun counties in Shaanxi Province to the southeast. This region is in the Central Loess Plateau, which includes a temperate arid zone to the north and temperate semi-humid regions in the middle and south. The terrain is chiefly made up of mountains, hills, gullies, and plateaus, and the height of the elevation decreases from northwest to southeast [24]. The altitudes of the area are between 1200 and 1900 m. The average annual temperature fluctuates between 7 and 10 °C, and there are 110–150 days without frost. The mean annual rainfall is 587.6 mm, and the relative humidity is between 63% and 68% [25]. The region can be used as a natural biological gene reservoir of the Loess Plateau, which has a great amount of biological resources and a high ecological environment. Vegetation consists mainly of natural and planted coniferous forests, secondary deciduous broadleaf forests, shrubs, and wild grasslands [26]. It is one of the regions of China that has been prioritized in the protection of biodiversity [27], and it hosts a variety of plant communities that offer good opportunities for butterflies to live and reproduce.

2.2. Research Methods

The research was conducted in four state-owned forest management stations of the Ziwuling region, namely: Zhongwan, Luoshanfu, Taibai, and Lianjiabian (Figure 1). Three transects (each 1 km long) were set up at each of these sites, with the nearest distance between any two transects being at least 1 km apart. Surveyed habitats were divided into three types depending on the dominant vegetation: deciduous shrubland, coniferous–broadleaf mixed forest, and farmland. Monthly surveys were done in the middle of every month between May and September 2024. Observations were carried out between 9:00 and 17:00, coinciding with the peak period of butterfly activity. Butterfly species observed within 3 m to the left of each transect and up to 5 m above it were recorded through visual observation and photography. Specimens that could not be identified in the field were captured using insect nets and subsequently transported to the laboratory for identification. Butterflies were classified according to the latest seven-family classification system [28]. The identification process was based on reference works, including Monographia Rhopalocerorum Sinensium [29] and Monograph of Butterflies in Xiaolongshan Mts, Gansu Province [30]. All specimens were deposited in the Animal Specimen Museum of the School of Agriculture and Bioengineering, Longdong University.

2.3. Environmental Data Collection

The altitude values for each survey sample line were measured using a GPS locator. Climate factor data were obtained from the World Climate Database, WorldClim (https://www.worldclim.org/, accessed on 10 November 2025), which provided a global phenology factor data map. Using ArcMap 10.8.1, the latitude and longitude of the survey samples were analyzed to extract the phenology factor data [31].

2.4. Diversity Analysis

Butterfly diversity in the study area was assessed using the Shannon–Wiener diversity index (H’): (1) H’ = −∑PilnPi; Margalef species richness index (R): (2) R = (S − 1)/ln N; Pielou’s evenness index (J): (3) J = H’/ln S; and Simpson’s dominance index (D): (4) D = 1 − ∑Pi2 [32,33,34,35,36]. The relative abundance of each species was calculated using the following Formula: (5) R’ = Ni/N × 100%. In these equations, Pi represents the proportion of individuals of the i-th species, Ni is the number of individuals of the i-th species, N is the total number of individuals across all species, and S is the total number of species.
Dominant species were defined by their relative abundance. A species was classified as dominant when its relative abundance R’ ≥ 10%, as common in the case of 10% > R’ ≥ 1%, and as rare if R’ < 1%.

2.5. Data Analysis

All statistical analyses were carried out using SPSS 22.0. To test whether there are significant differences in species diversity across groups, one-way analysis of variance (ANOVA) and the least significant difference (LSD) test were applied. Species rarefaction and extrapolation curves were constructed, and sample coverage (SC) was determined using the “iNEXT” package in R 4.5.3. Sampling adequacy was considered to be achieved when SC exceeded 0.9 [37,38,39]. Non-metric multidimensional scaling (NMDS) based on Bray–Curtis dissimilarity was performed using the ‘vegan’ package to visualize differences in butterfly community structure across habitats and months [40]. Hierarchical cluster analysis using the unweighted pair-group method with arithmetic means (UPGMA) was applied to examine butterfly community similarities among habitats and seasons. Dendrograms and bar plots were generated using the ‘vegan’, ‘ggdendro’, ‘gridExtra’, and ‘ggplot2’ packages in R 4.5.3 [41]. Pearson correlation analysis was employed to examine the relationships between species and environmental variables, and the results were visualized using Origin Pro 2025.

3. Results

3.1. Species Composition and Community Structure

According to the information obtained by identifying and statistics, a total of 2337 butterflies were recorded and identified, consisting of 84 species that belong to 54 genera and five families (Table 1). Among them, the Nymphalidae exhibited the highest species diversity and population, namely 47 species in 32 genera. Pieridae followed with 12 species in seven genera, and Lycaenidae with 13 species in seven genera. Hesperidae had eight species in six genera, and Papilionidae was the least abundant group with four species in two genera. There were 33 monotypic genera, or 61.11% of all the genera, at the genus level. These monotypic genera were dominated by the main taxa of Limenitis and Neptis (Nymphalidae) and Satyrium (Lycaenidae). The dominant species in the study area were Fabriciana adippe and Gonepteryx mahaguru, with relative frequencies of 13.78% and 13.31%, respectively. There were altogether 22 common species, 26.19% of the total species, and 60 rare species, 71.43% of the total species.

3.2. Diversity of Butterfly Communities in Different Habitats

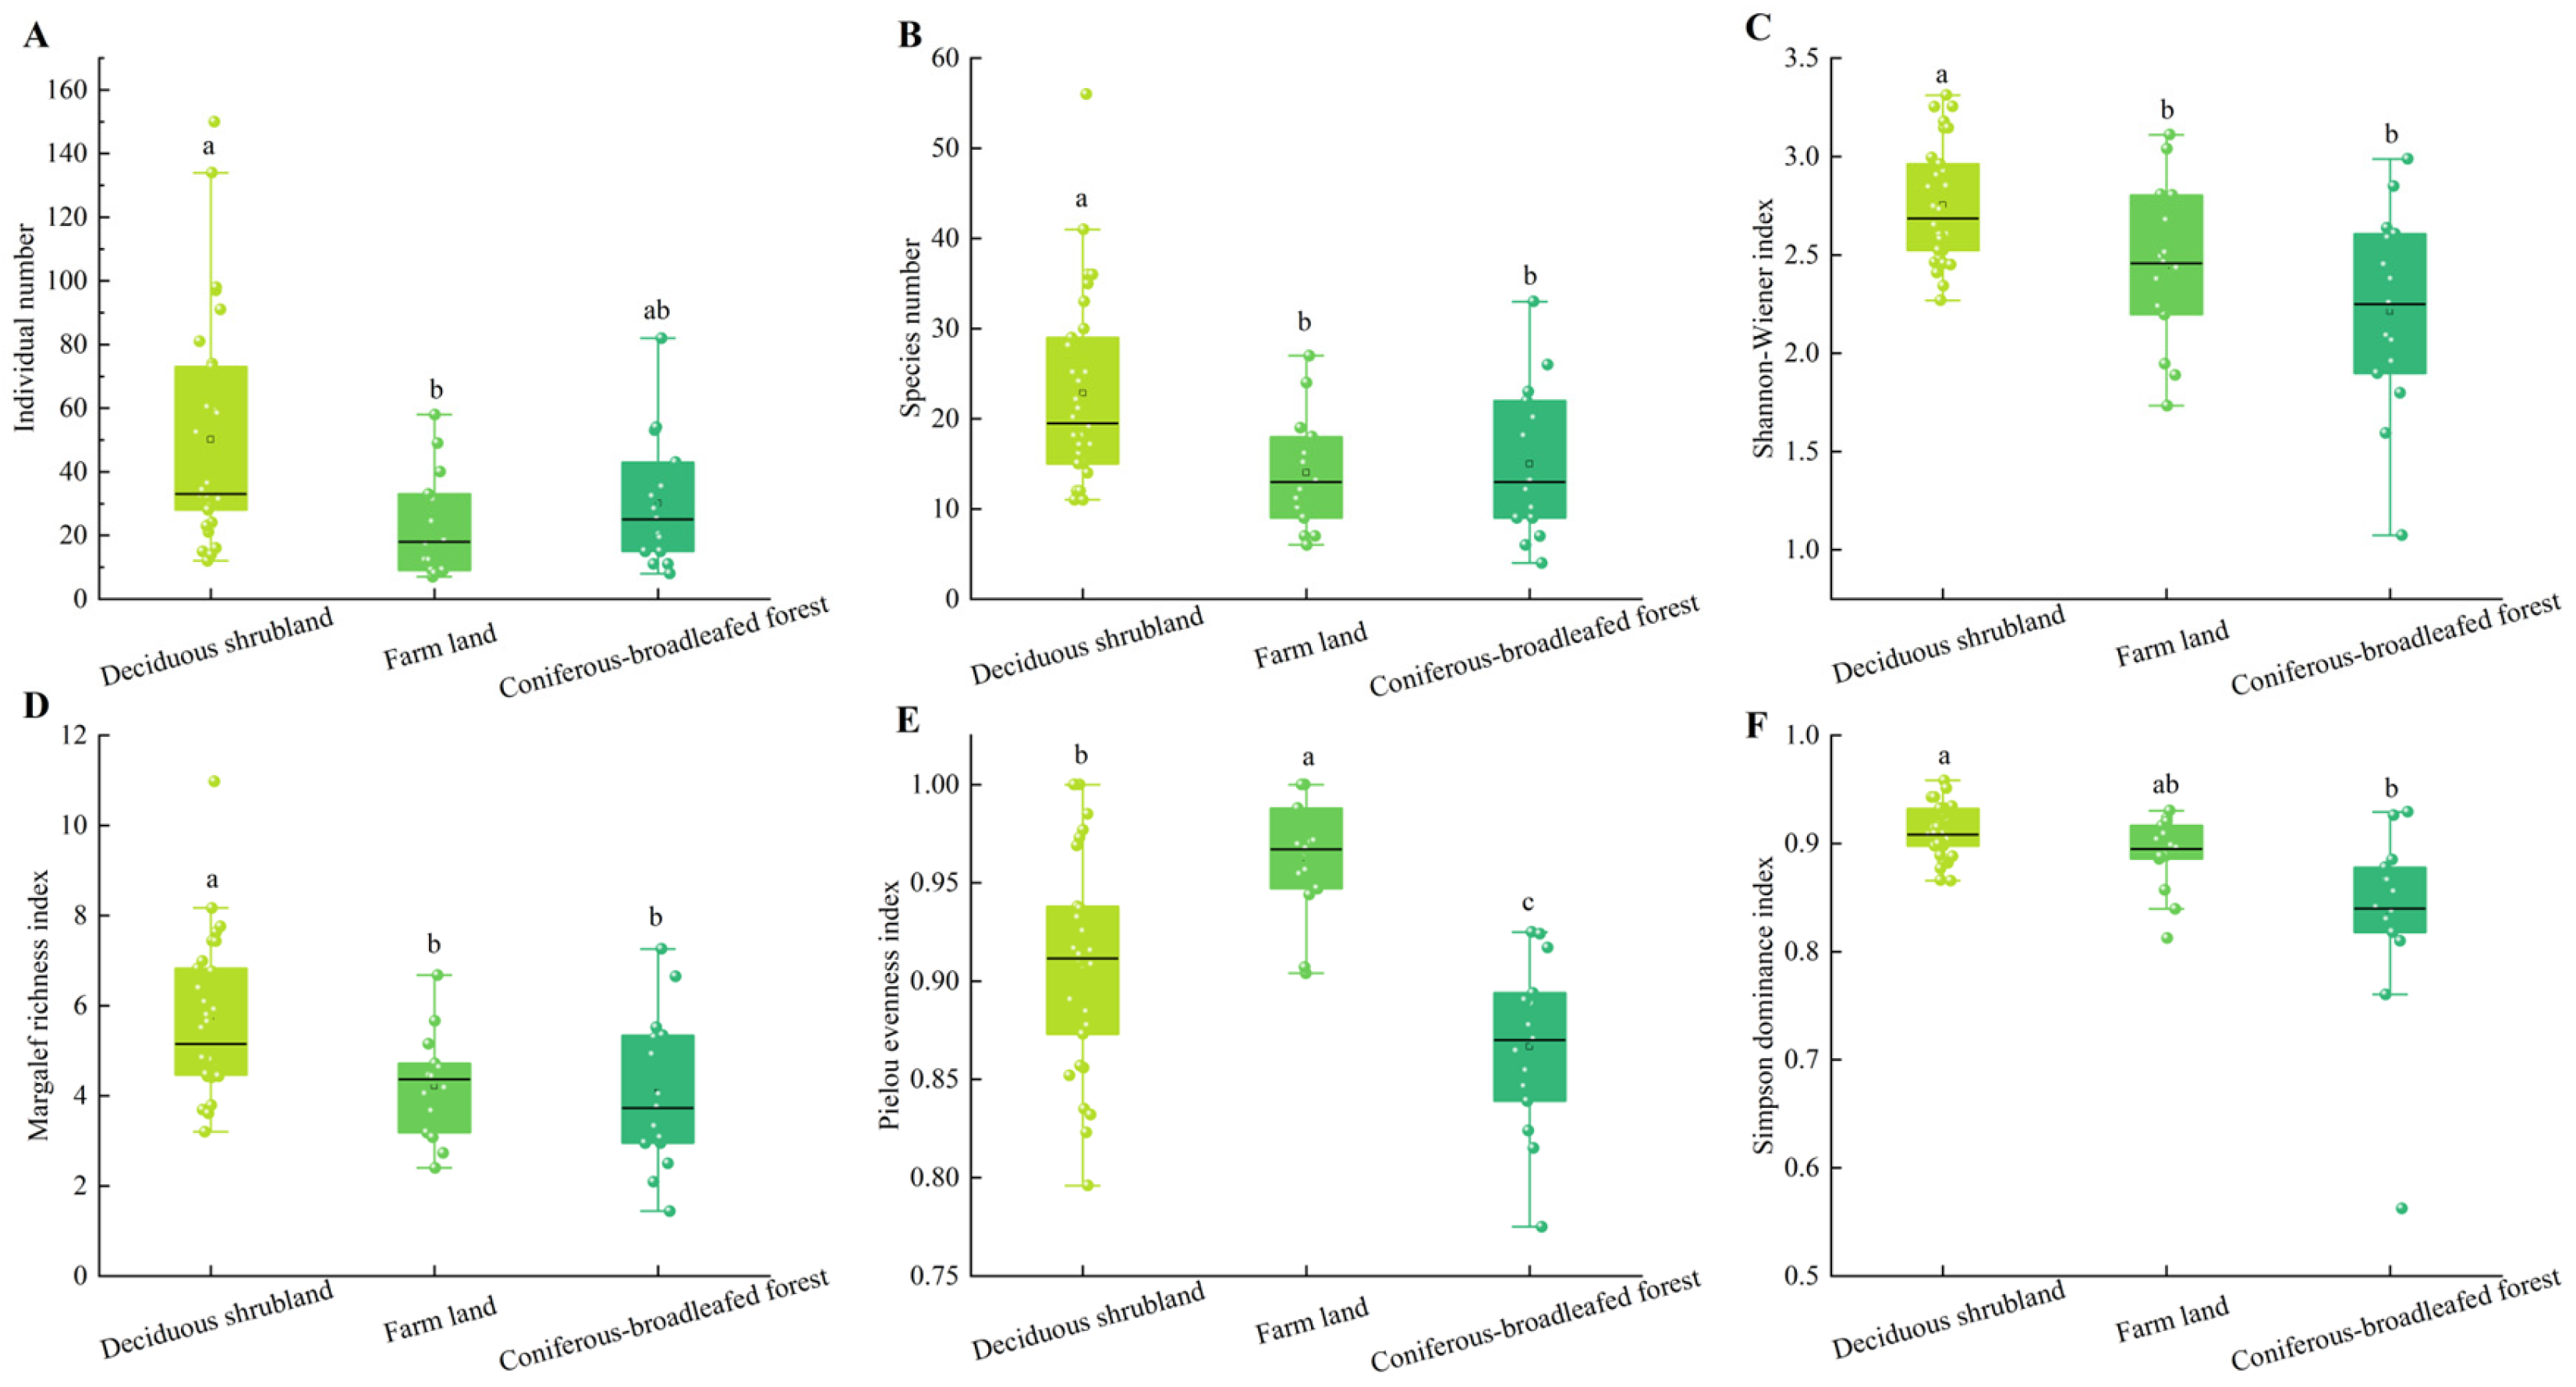
The diversity of butterflies across the three habitat types was found to be highly significant (Figure 2). The individual abundance, species richness, Shannon–Wiener index, and Margalef richness index were all significantly greater in deciduous shrubland than in farmland and coniferous–broadleaf mixed forest (p < 0.05). The Pielou evenness index of deciduous shrubland was significantly lower than the evenness index of farmland (p < 0.05), but significantly greater than that of coniferous–broadleaf mixed forest (p < 0.05). Evenness index of farmland was the highest, and richness-related indices were the lowest of the three habitats. The evenness index of coniferous–broadleaf mixed forest was the lowest, and its Simpson dominance index was also the lowest, meaning that species distribution in this forest was very uneven.
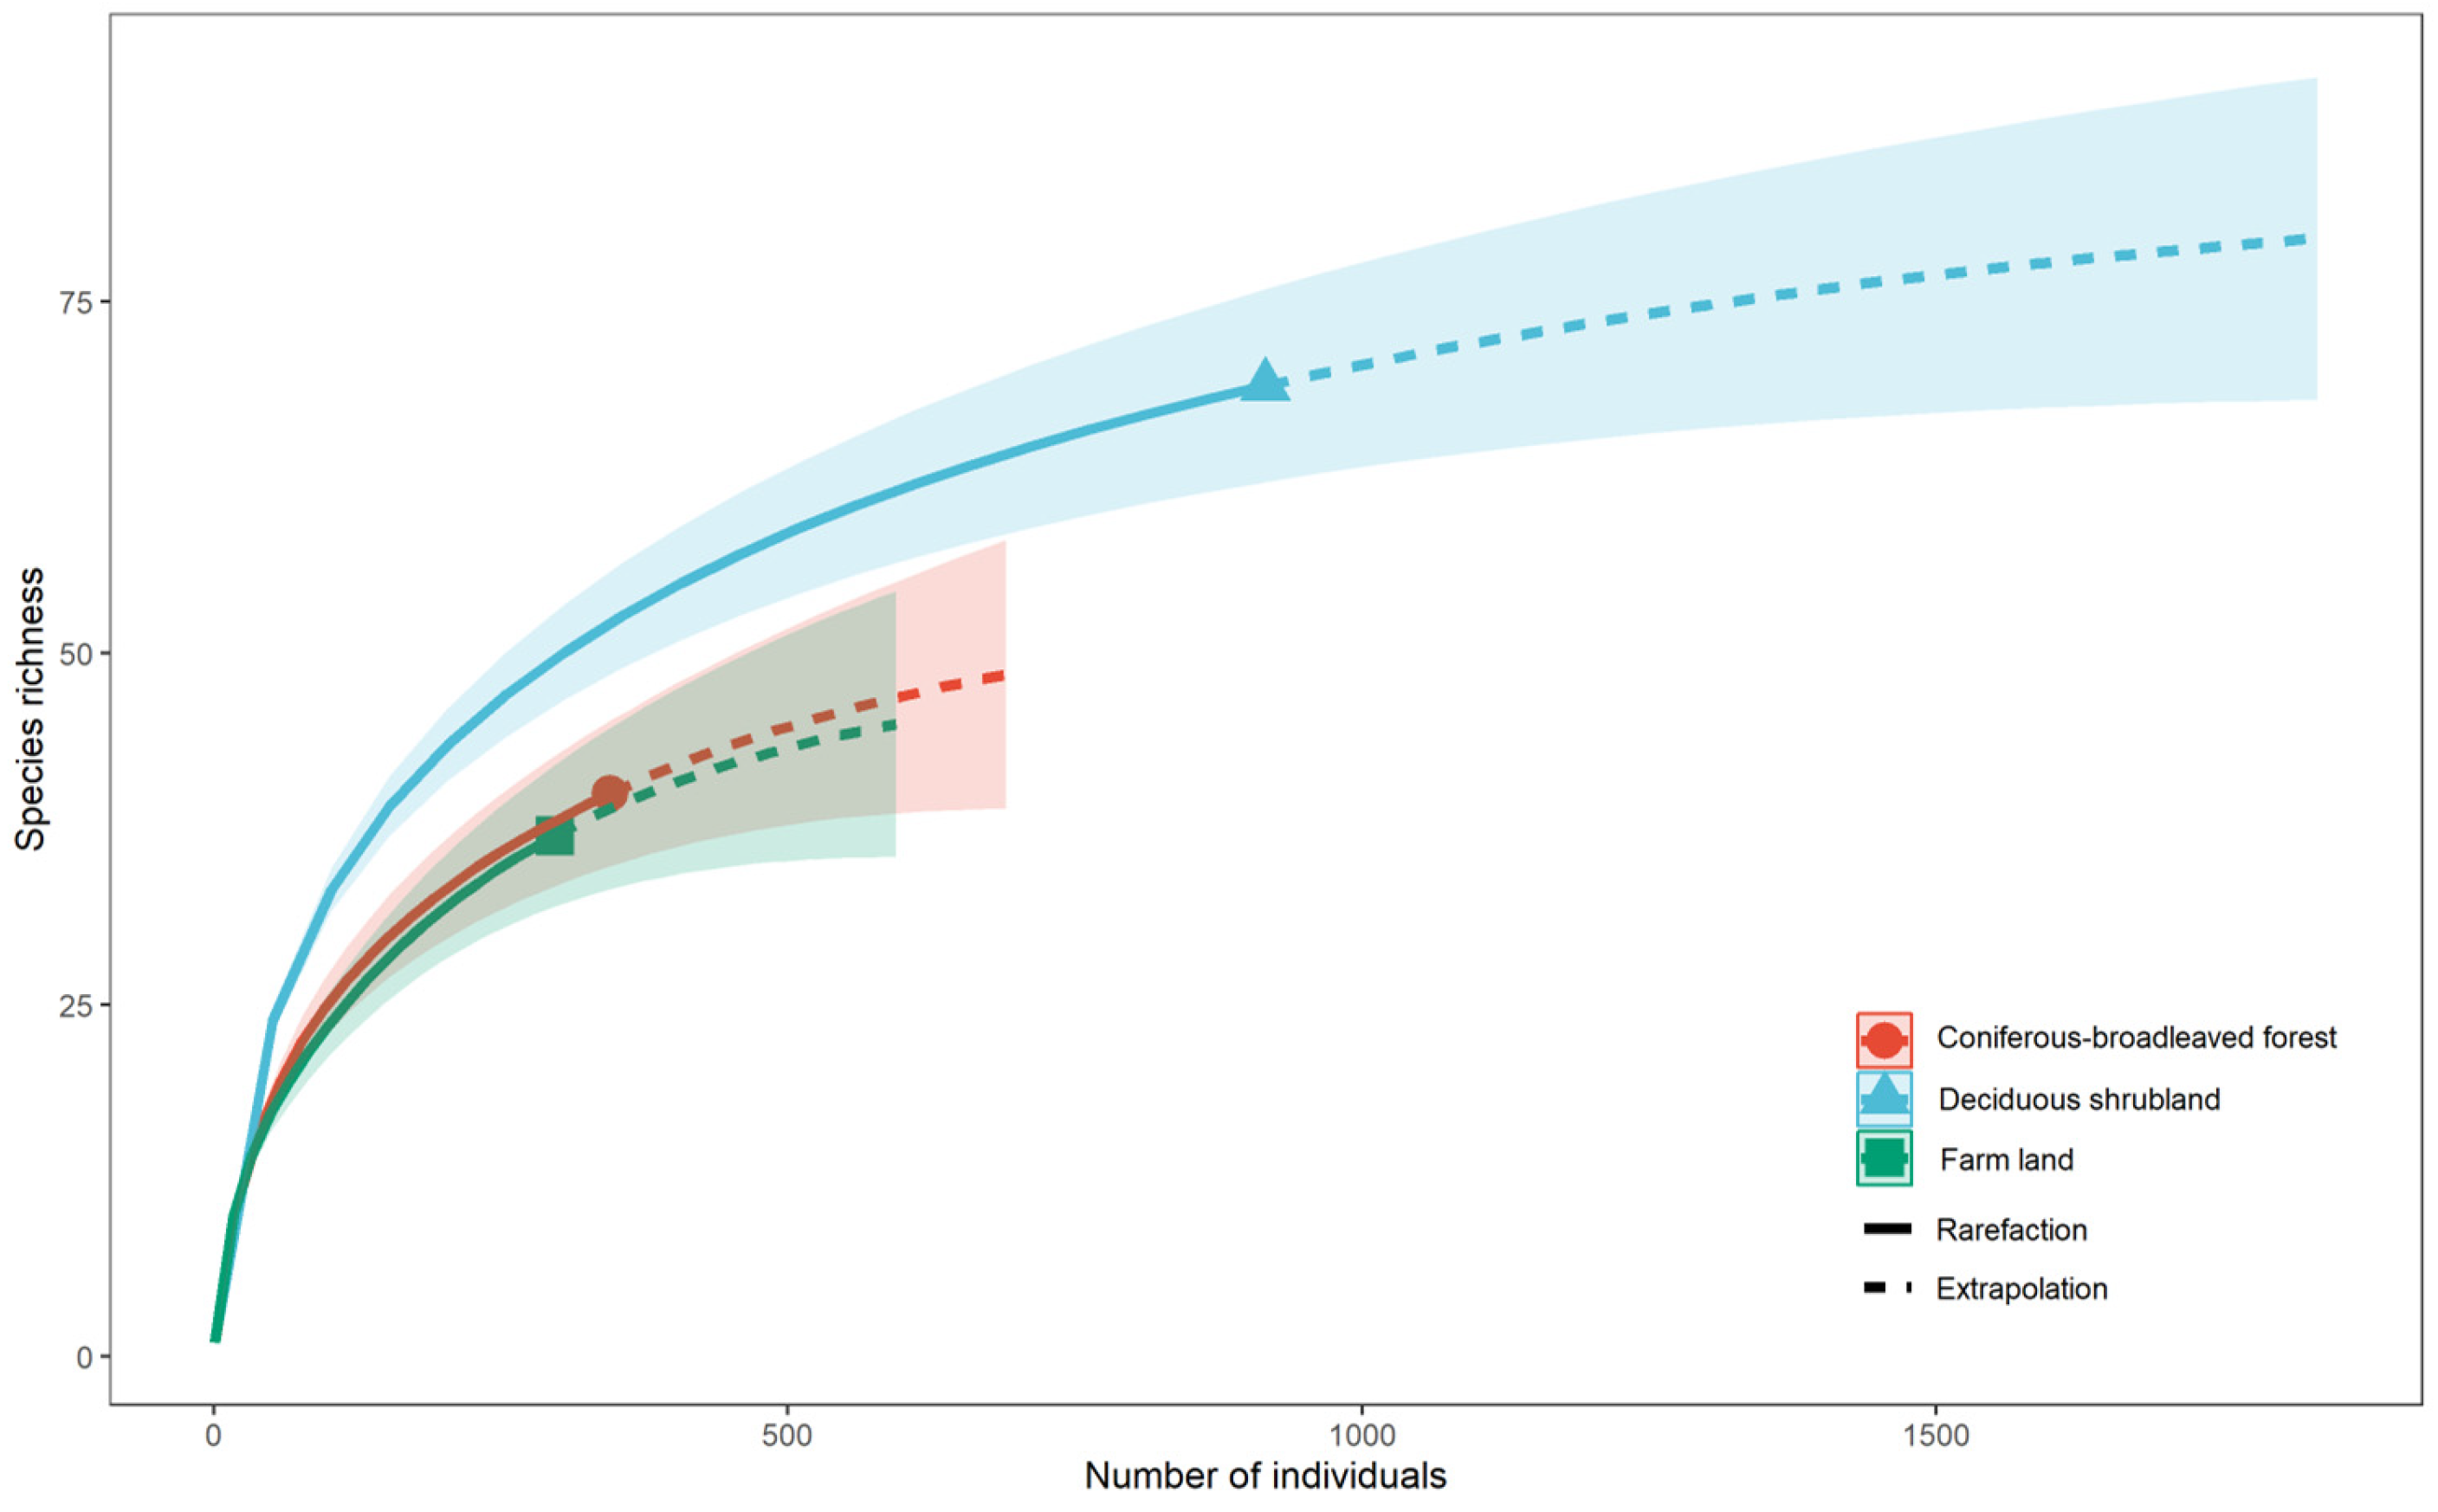
Based on the results of rarefaction and extrapolation analysis, the sampling effort was adequate in all habitats depending on sample coverage (SC > 0.9) (Figure 3). Species accumulation curves varied significantly across three types of habitats. Cumulative species richness was greatest in deciduous shrubland. Curves of coniferous and broadleaved mixed forest and farmland were closer to a plateau, which means that both habitats had less complex species pools and enough sampling. The steepness of the deciduous shrubland curve was the most significant, indicating a larger share of rare species. On the other hand, the farmland curve achieved the plateau first, which can be explained by the low richness and high evenness of its communities.

3.3. Butterfly Diversity Across Different Months

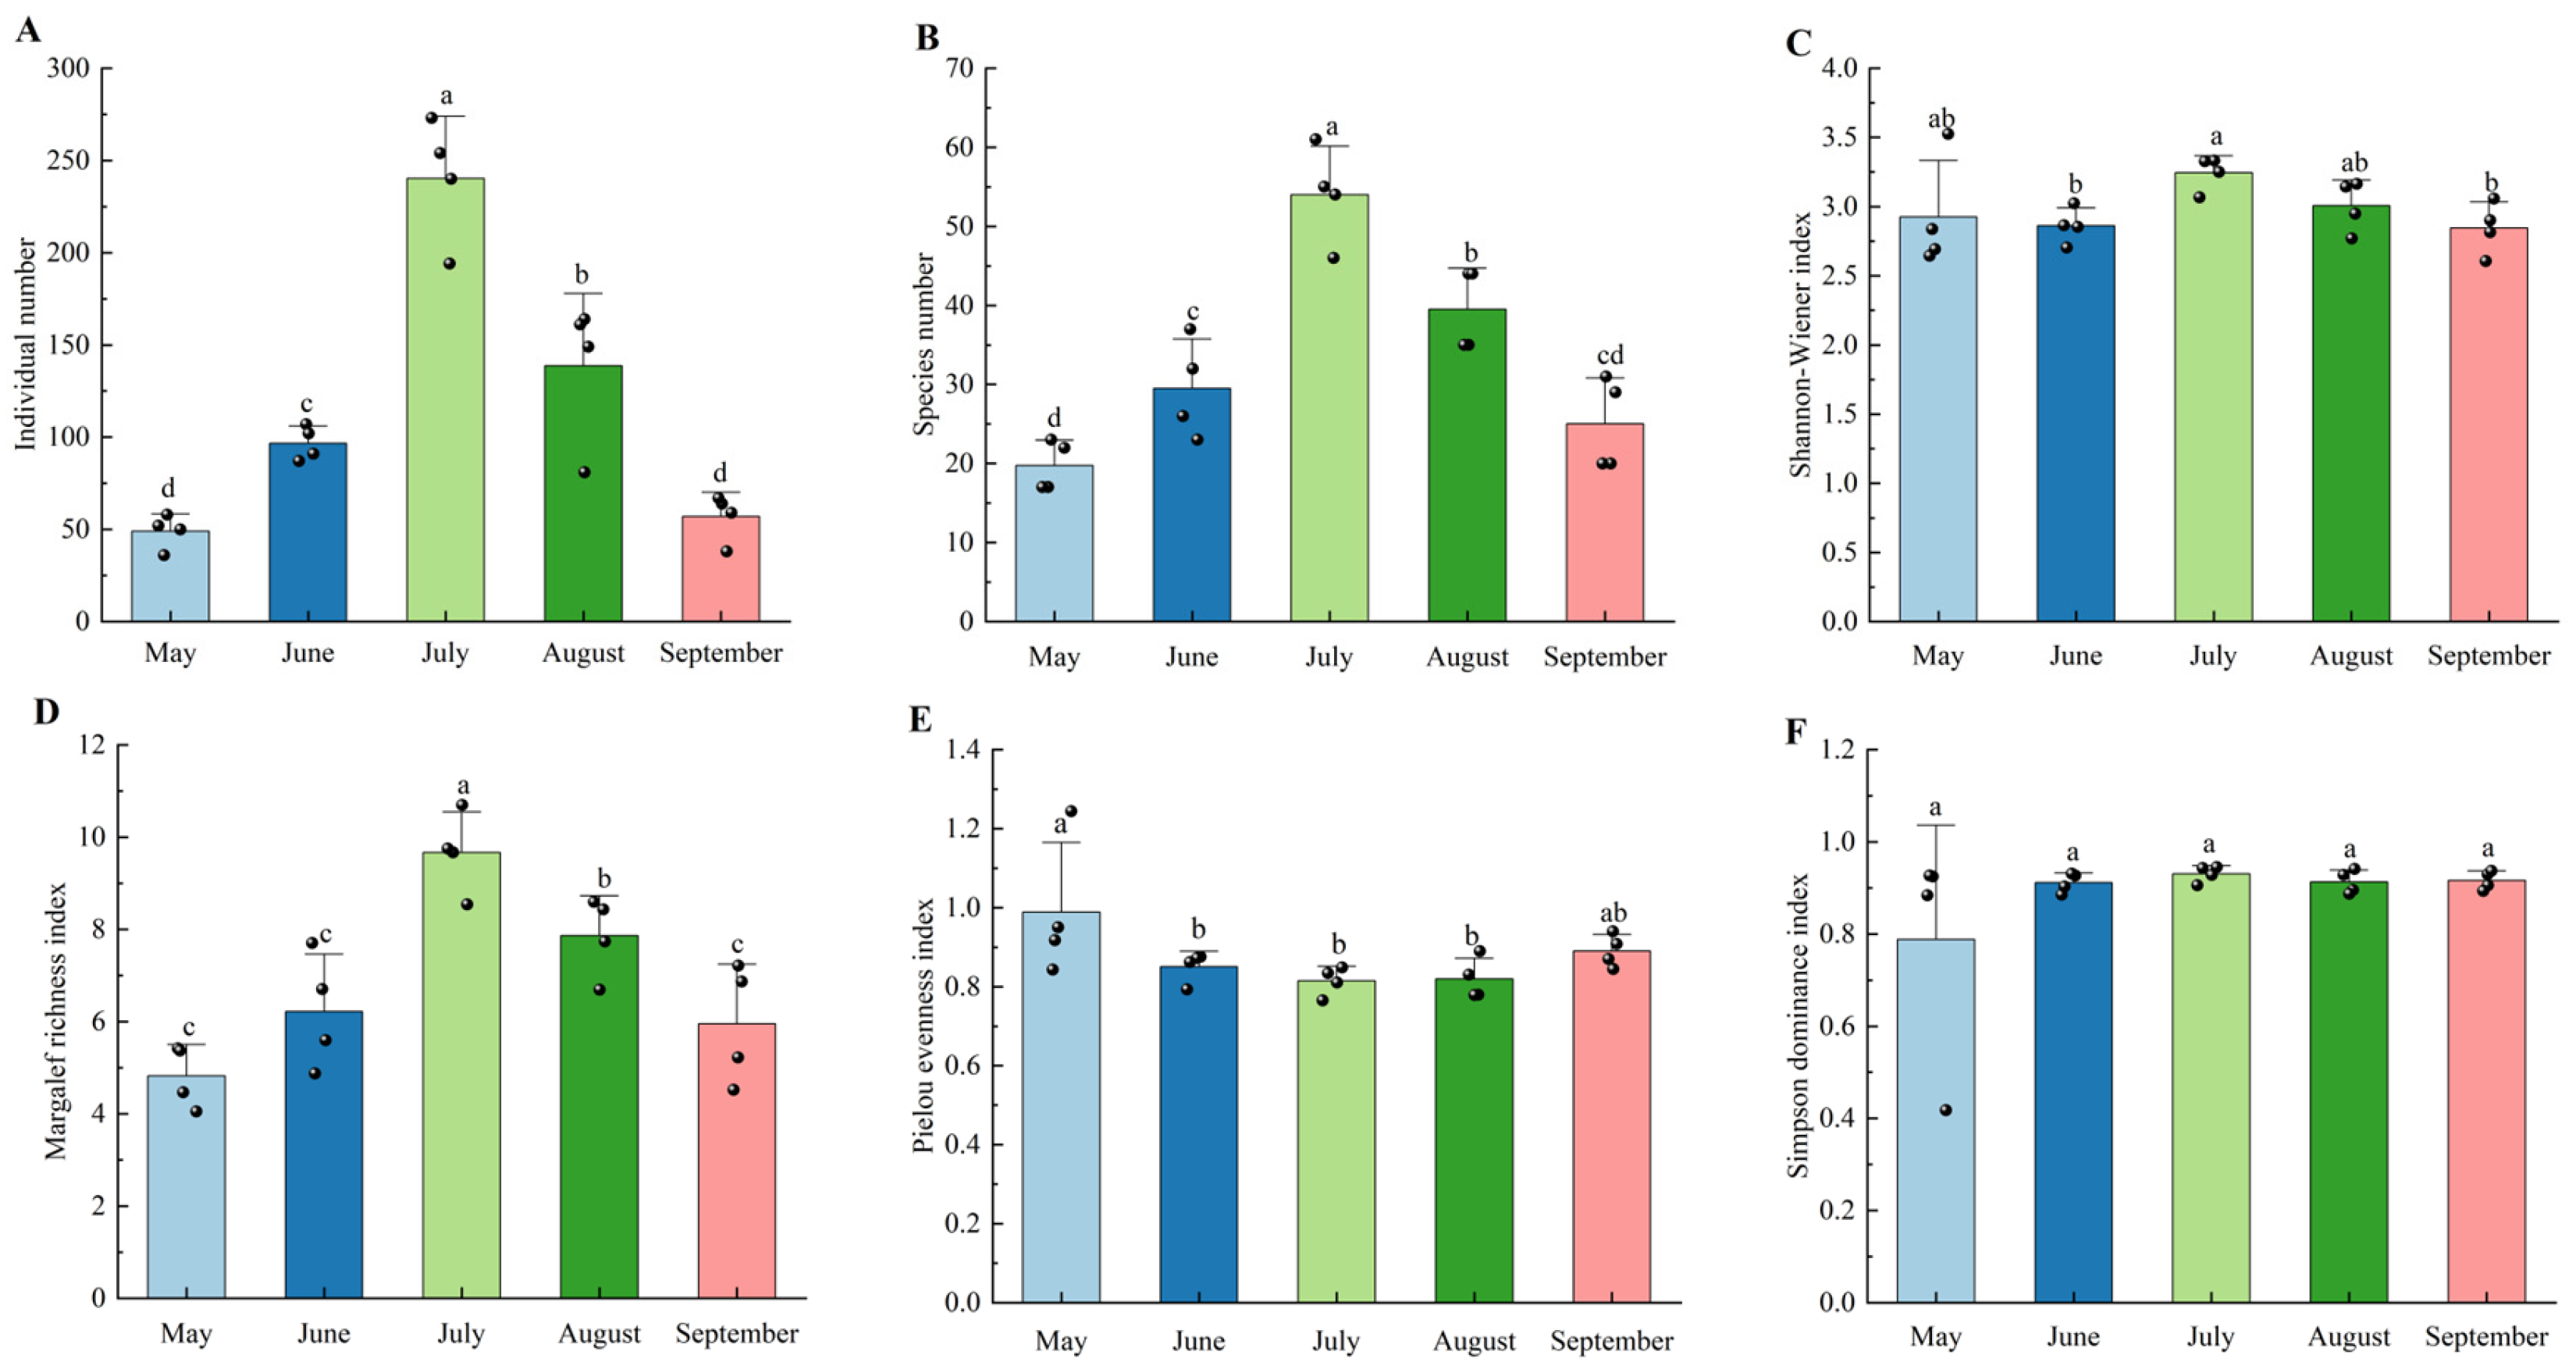
The monthly fluctuations of butterfly diversity in the study location were assessed (Figure 4). Both species richness and individual abundance reached their highest point in July, and significant differences were observed (p < 0.05) when compared to the rest of the months. The Shannon–Wiener diversity index and Margalef richness index also reached peak values in July, and this is very significant when compared with other months (p < 0.05). The Simpson dominance index was also at its peak in July; however, there was no significant difference between July and other months (p > 0.05). Conversely, the index of Pielou evenness was the highest in May, and it had a significant difference with the other months (p < 0.05).
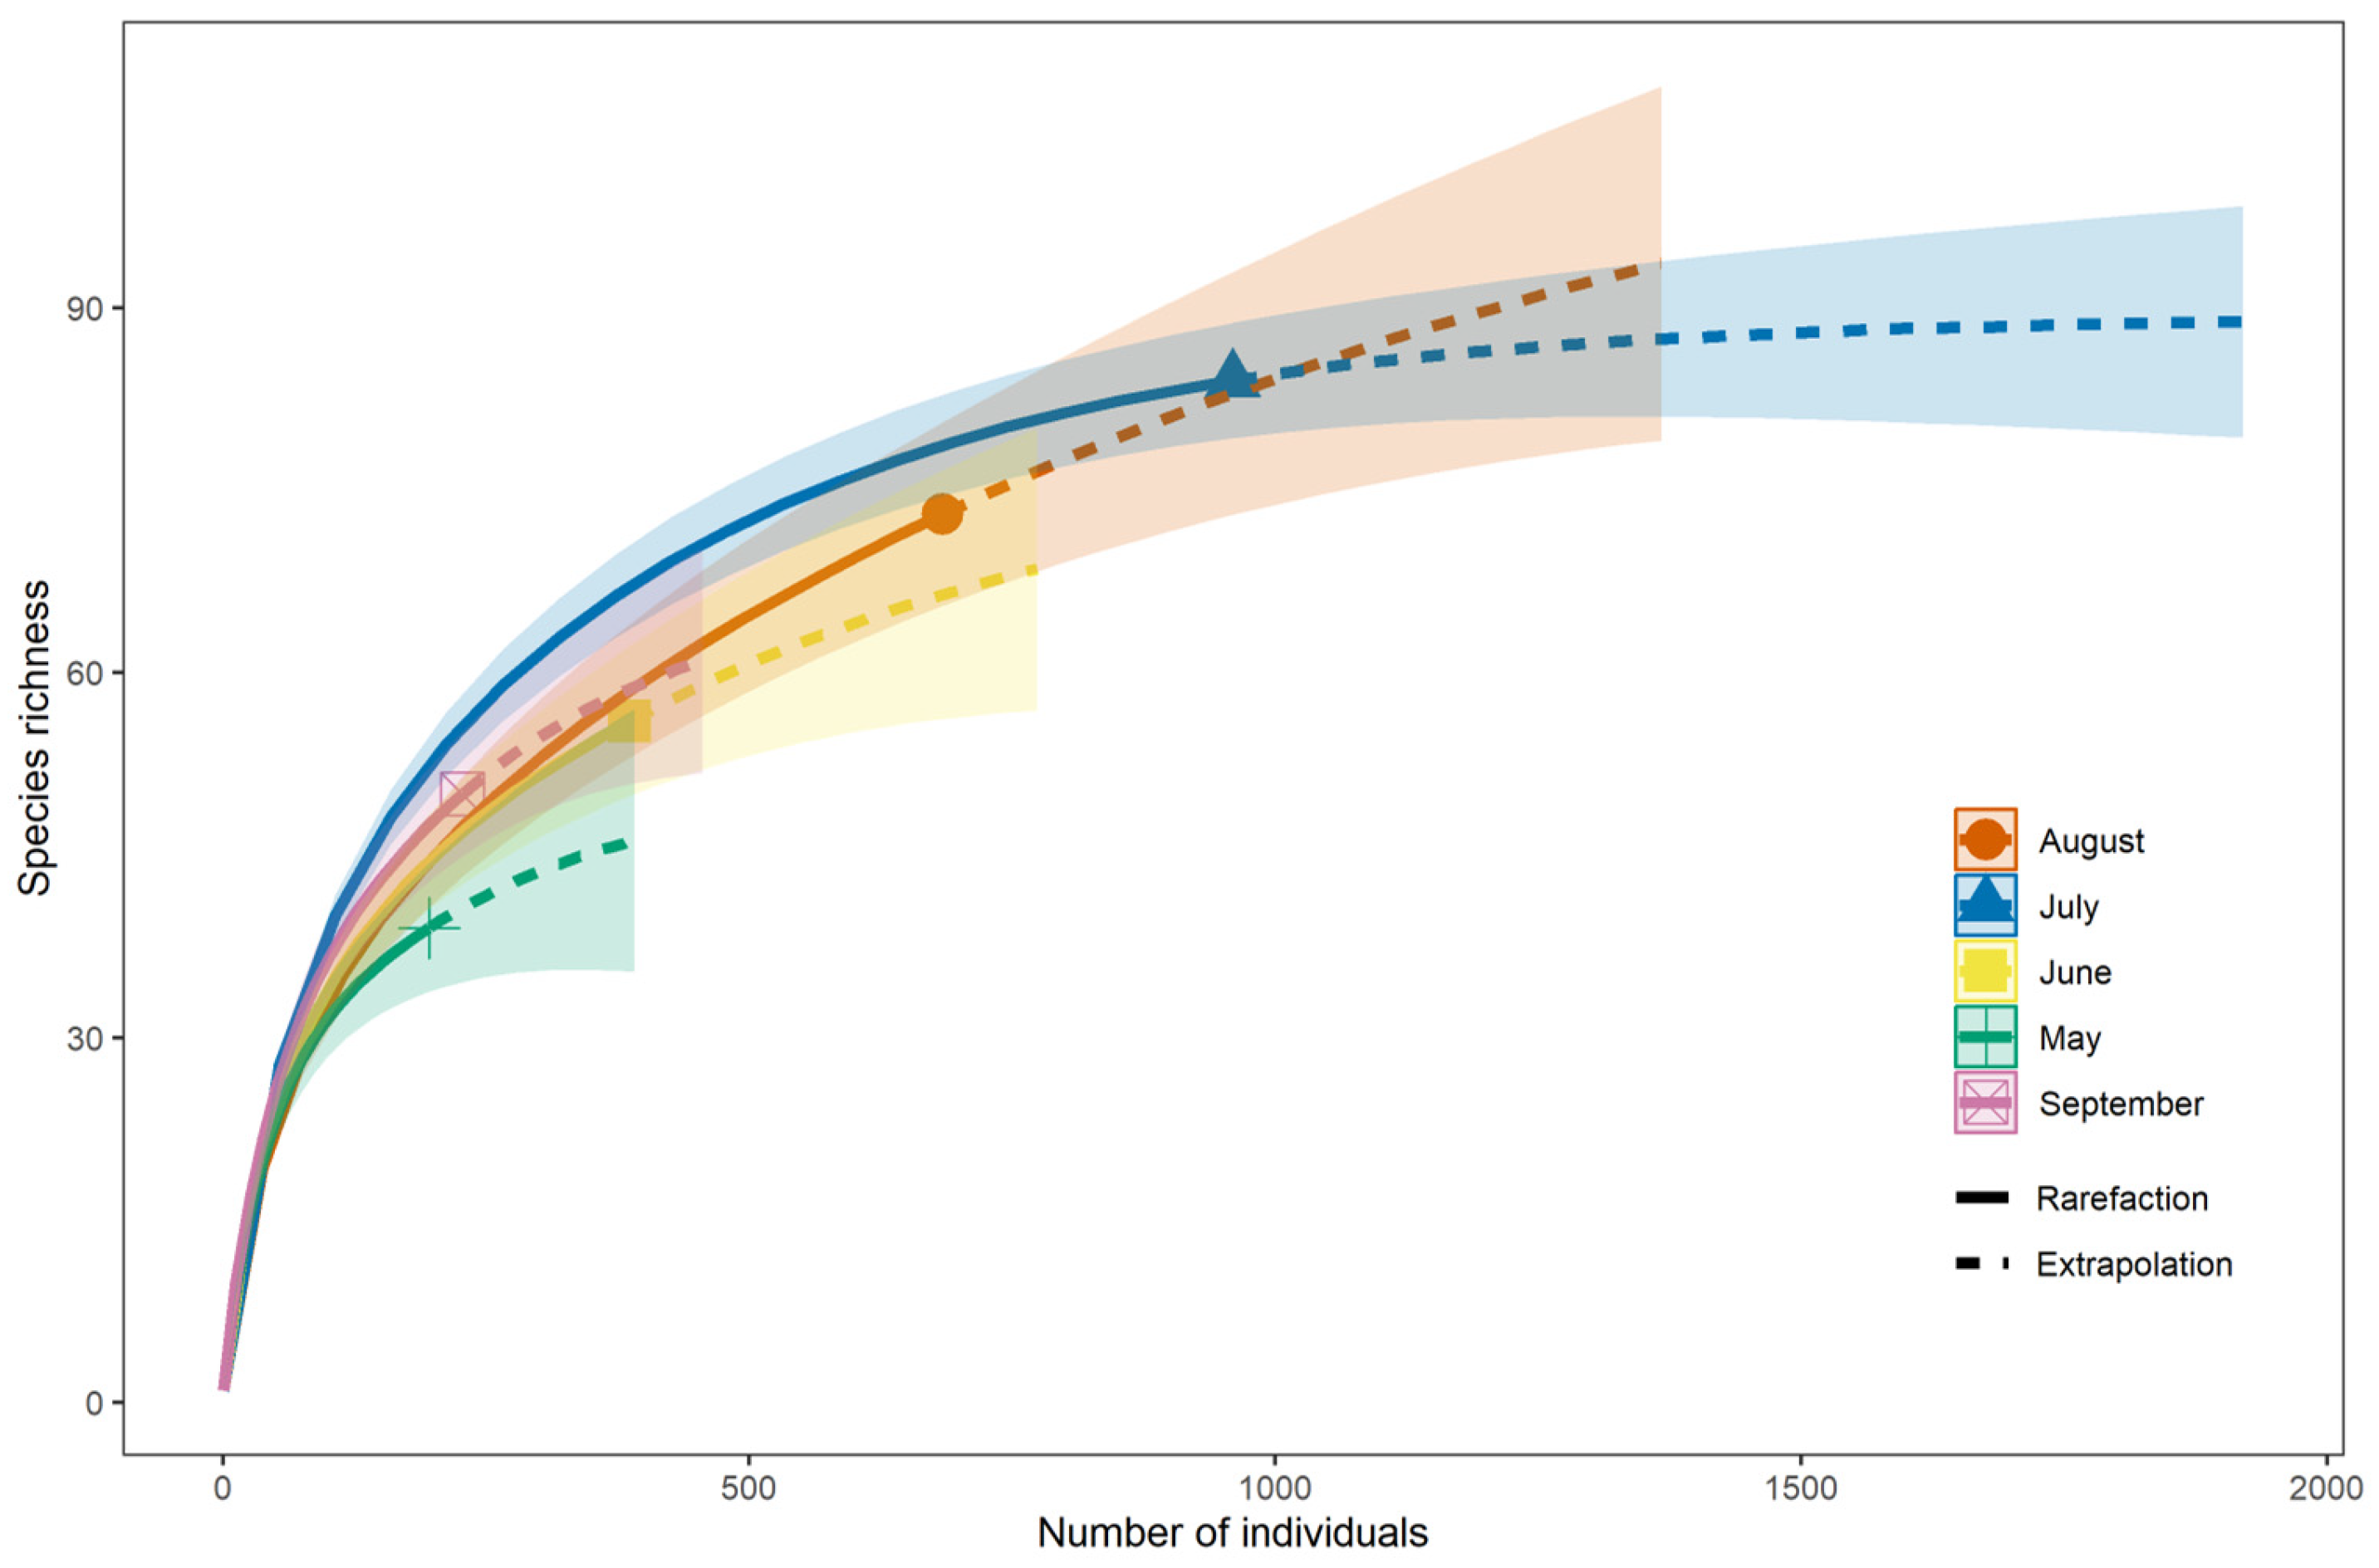
The rarefaction and extrapolation analysis based on a sample revealed that there were considerable differences in butterfly species diversity in the months when adequate sampling intensity of the months was achieved (SC > 0.9) (Figure 5). The butterfly population in the research site was very diverse during the late summer and early autumn. The diversity was very high in the summer months (July and August), but low in late spring and early summer months (May and June).

3.4. NMDS and UPGMA Clustering Results of Butterfly Communities in Different Habitats

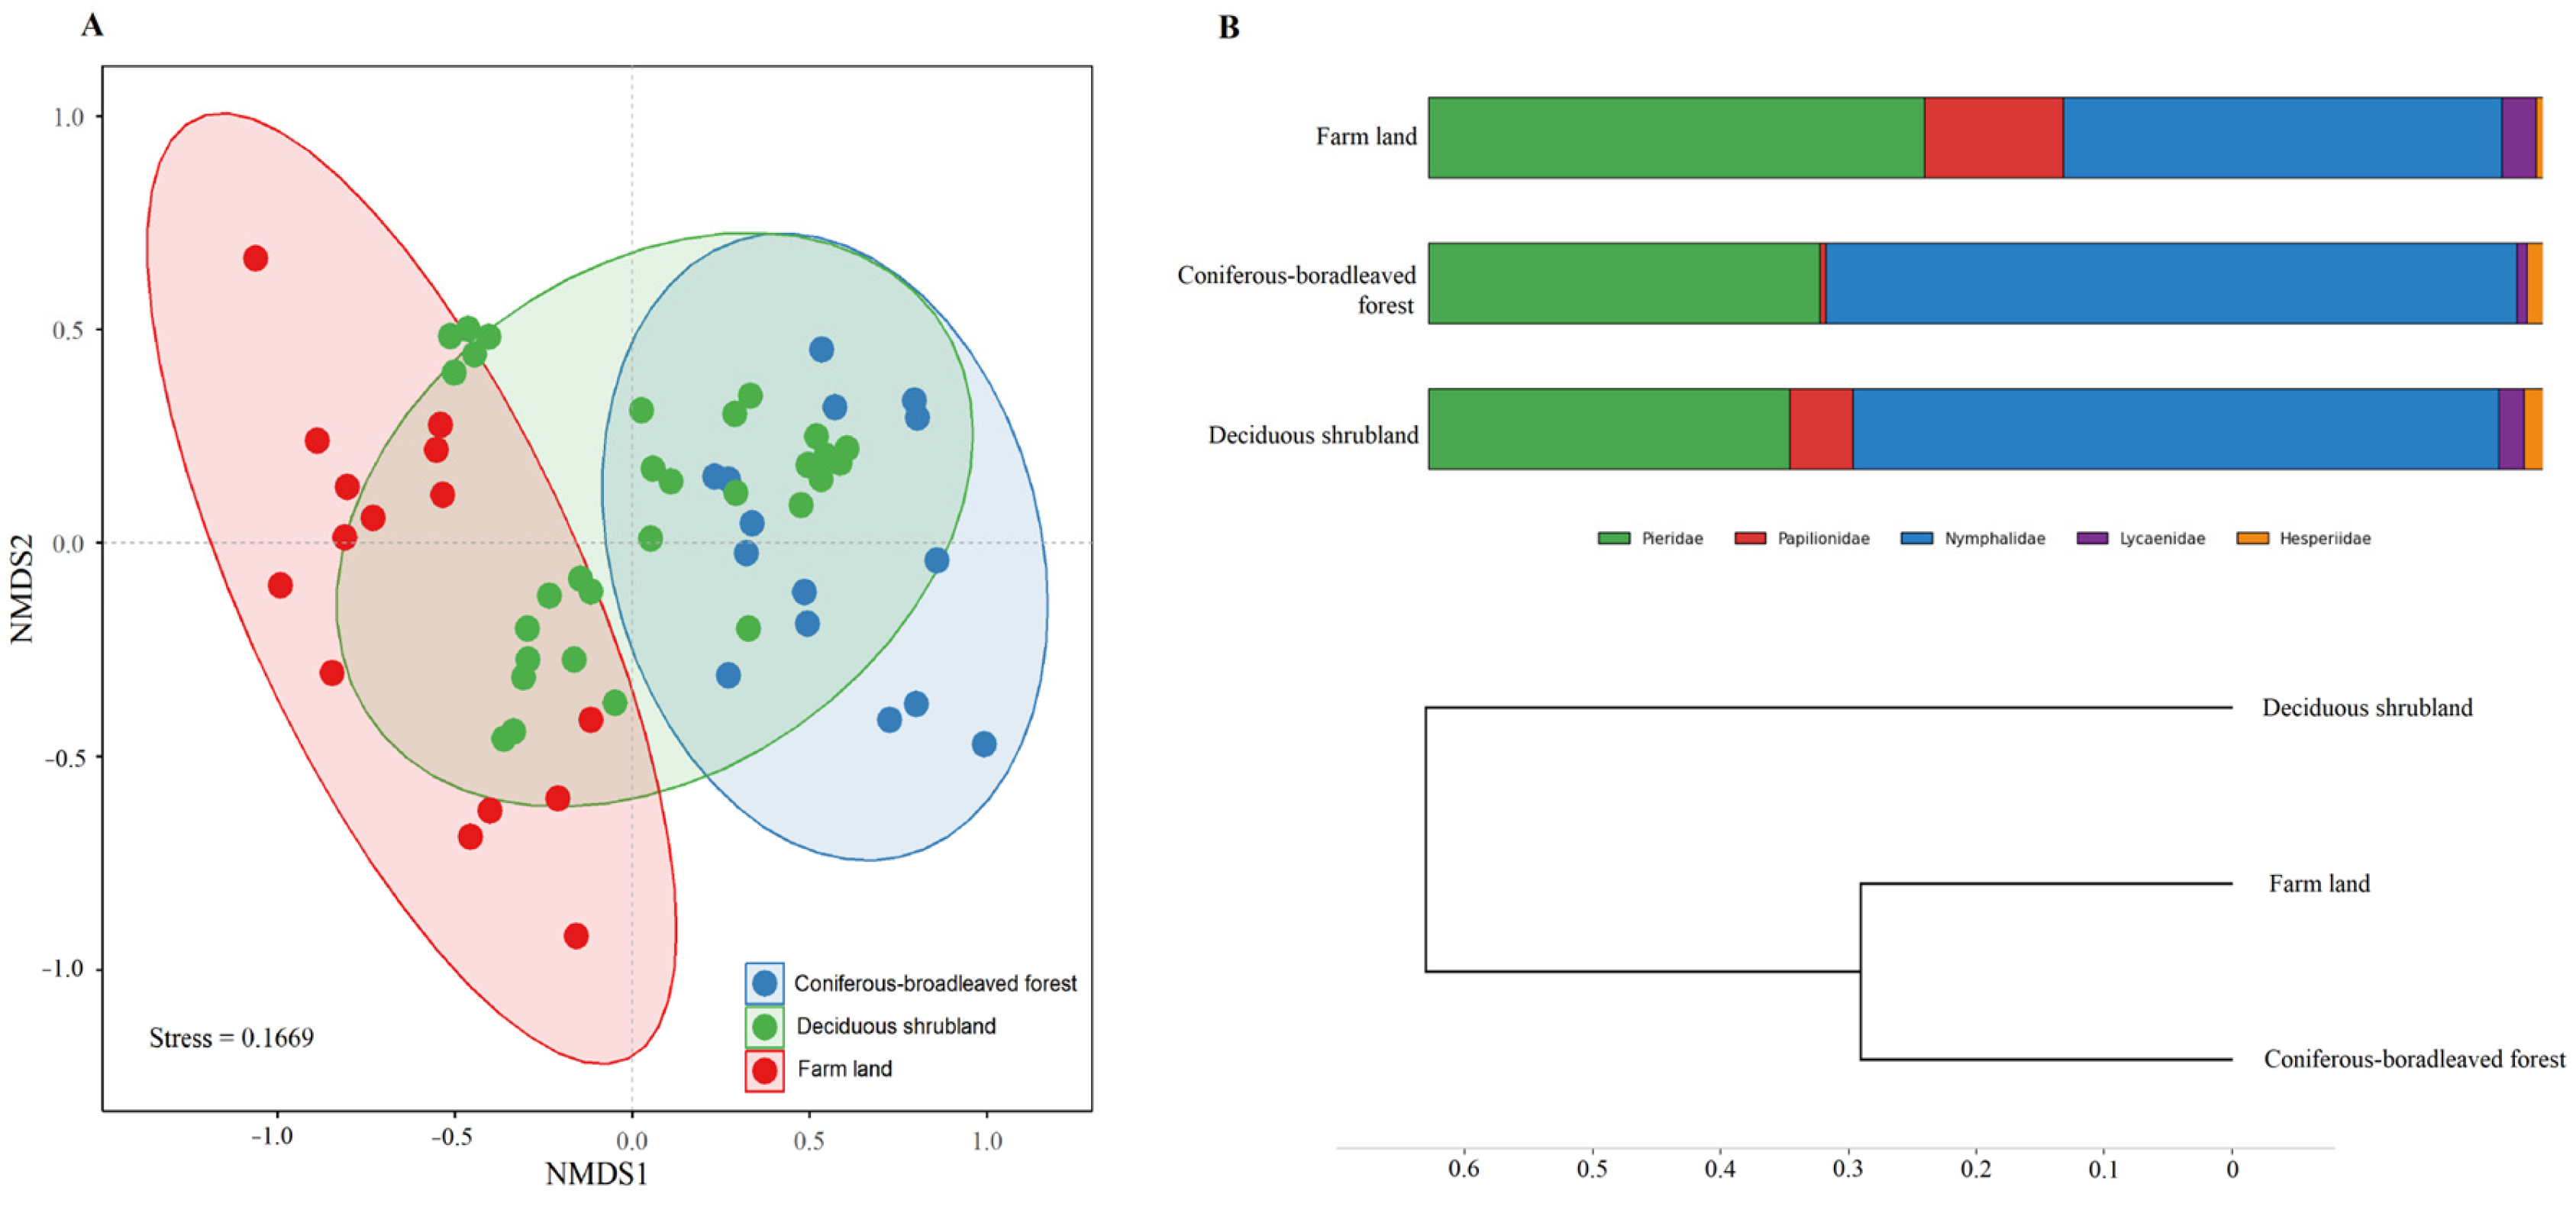
Partial separation of butterfly species composition among the three habitat types was observed in the ordination space by non-metric multidimensional scaling (NMDS) (Figure 6A). Coniferous and broadleaved mixed forests were well separated from deciduous shrubland and farmland. Conversely, the samples of deciduous shrubland and farmland overlapped greatly in the ordination space, which means that these two habitats have a very similar butterfly community.
The UPGMA clustering analysis of diversity among different habitats showed (Figure 6B) that the farmland and coniferous–broadleaved mixed forest were grouped together when the inter-class distance was greater than 0.3, and the deciduous shrubland alone became a separate habitat type when the distance between them was more than 0.6. Nymphalidae was the dominant family in all habitats, yet its relative abundance was greater in deciduous shrubland and coniferous–broadleaf mixed forest than in farmland. The proportion of Pieridae peaked in farmland, which was significantly higher than that in deciduous shrubland and coniferous–broadleaf mixed forest. Papilionidae made up a considerable proportion of farmland, appeared in small numbers in deciduous shrubland, and were almost absent from coniferous–broadleaf mixed forest. Lycaenidae and Hesperiidae occurred at very low abundances in all three habitats.

3.5. NMDS and UPGMA Clustering Results of Butterfly Communities in Different Months

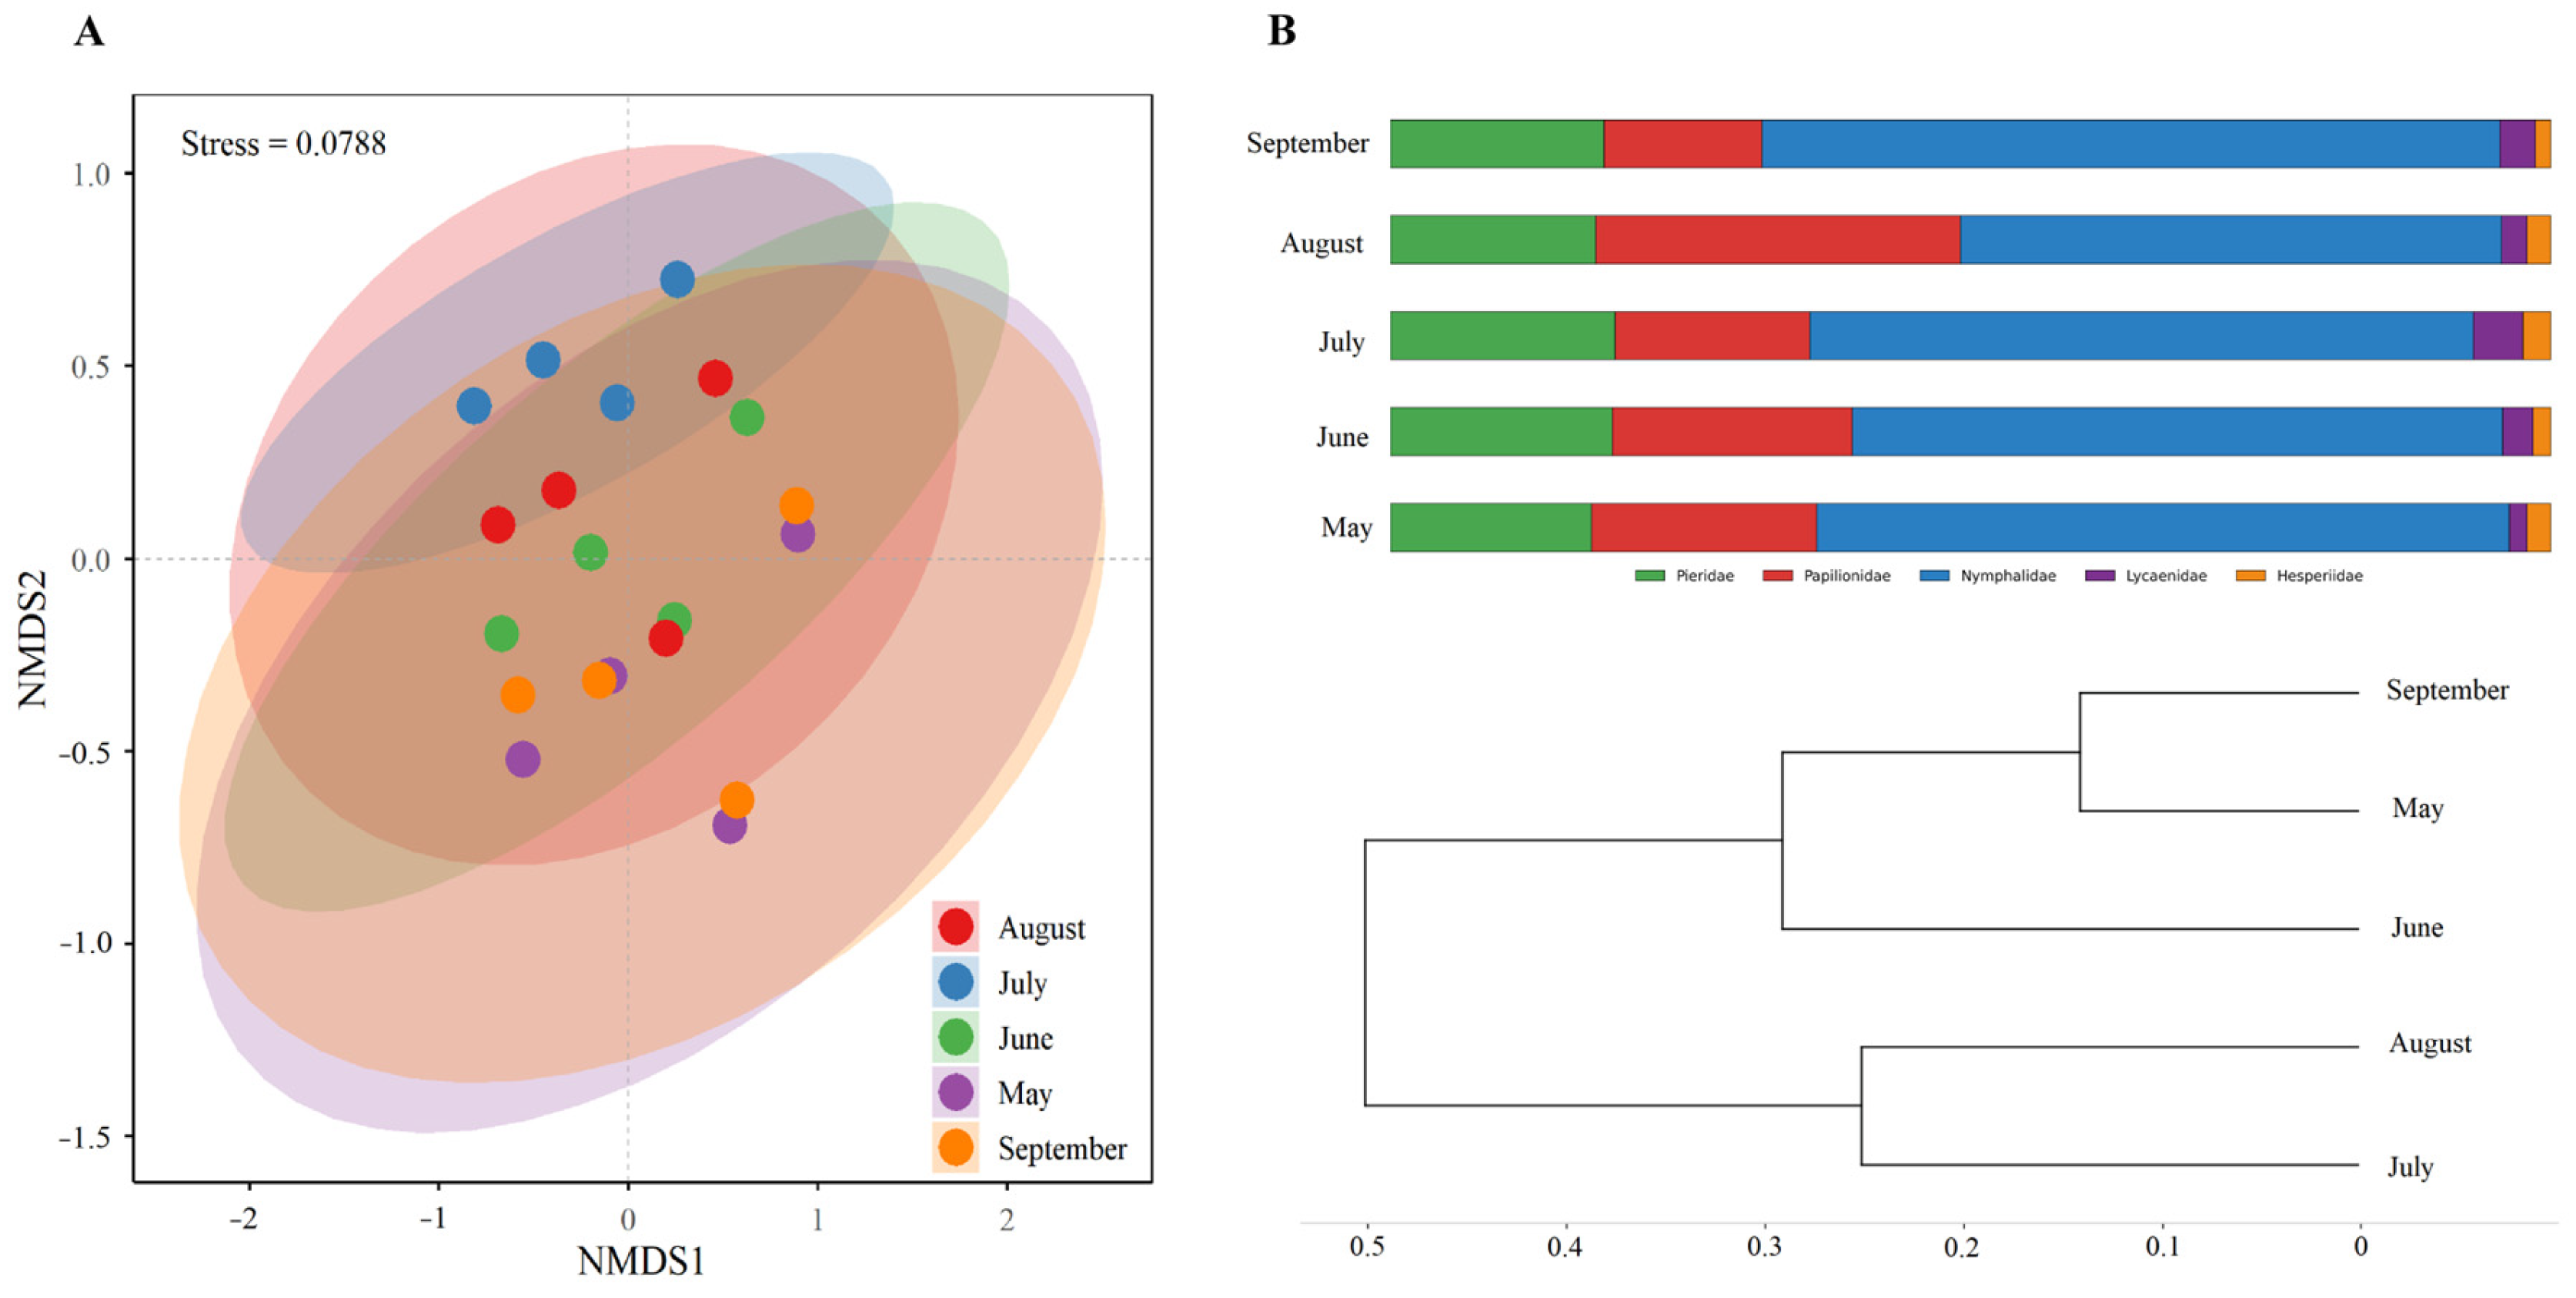
The stress of the NMDS analysis was 0.0788, which is an indication of the good representation of the original distance matrix (Figure 7A). The NMDS plot showed large overlap between butterfly communities of different months in the ordination space, indicating low beta diversity and a high level of similarity in community composition between months.
The analysis of clustering proved the presence of seasonal differences within the butterfly communities (Figure 7B). July and August were clustered into a mid-summer branch with a distance of roughly 0.25, and September and May clustered into a spring–autumn branch of around 0.15, indicating that these two seasonal assemblies are clearly separated. This result was similar to the NMDS findings, which indicated a seasonal trend in the structure of butterfly communities. Nymphalidae was the most common family in every month. The highest percentage of Pieridae was recorded in May and June, which is associated with the dominance of this family in spring. Lycaenidae and Hesperiidae were at extremely low numbers during the duration of the study.

3.6. Correlation Between S. montela Abundance and Environmental Variables

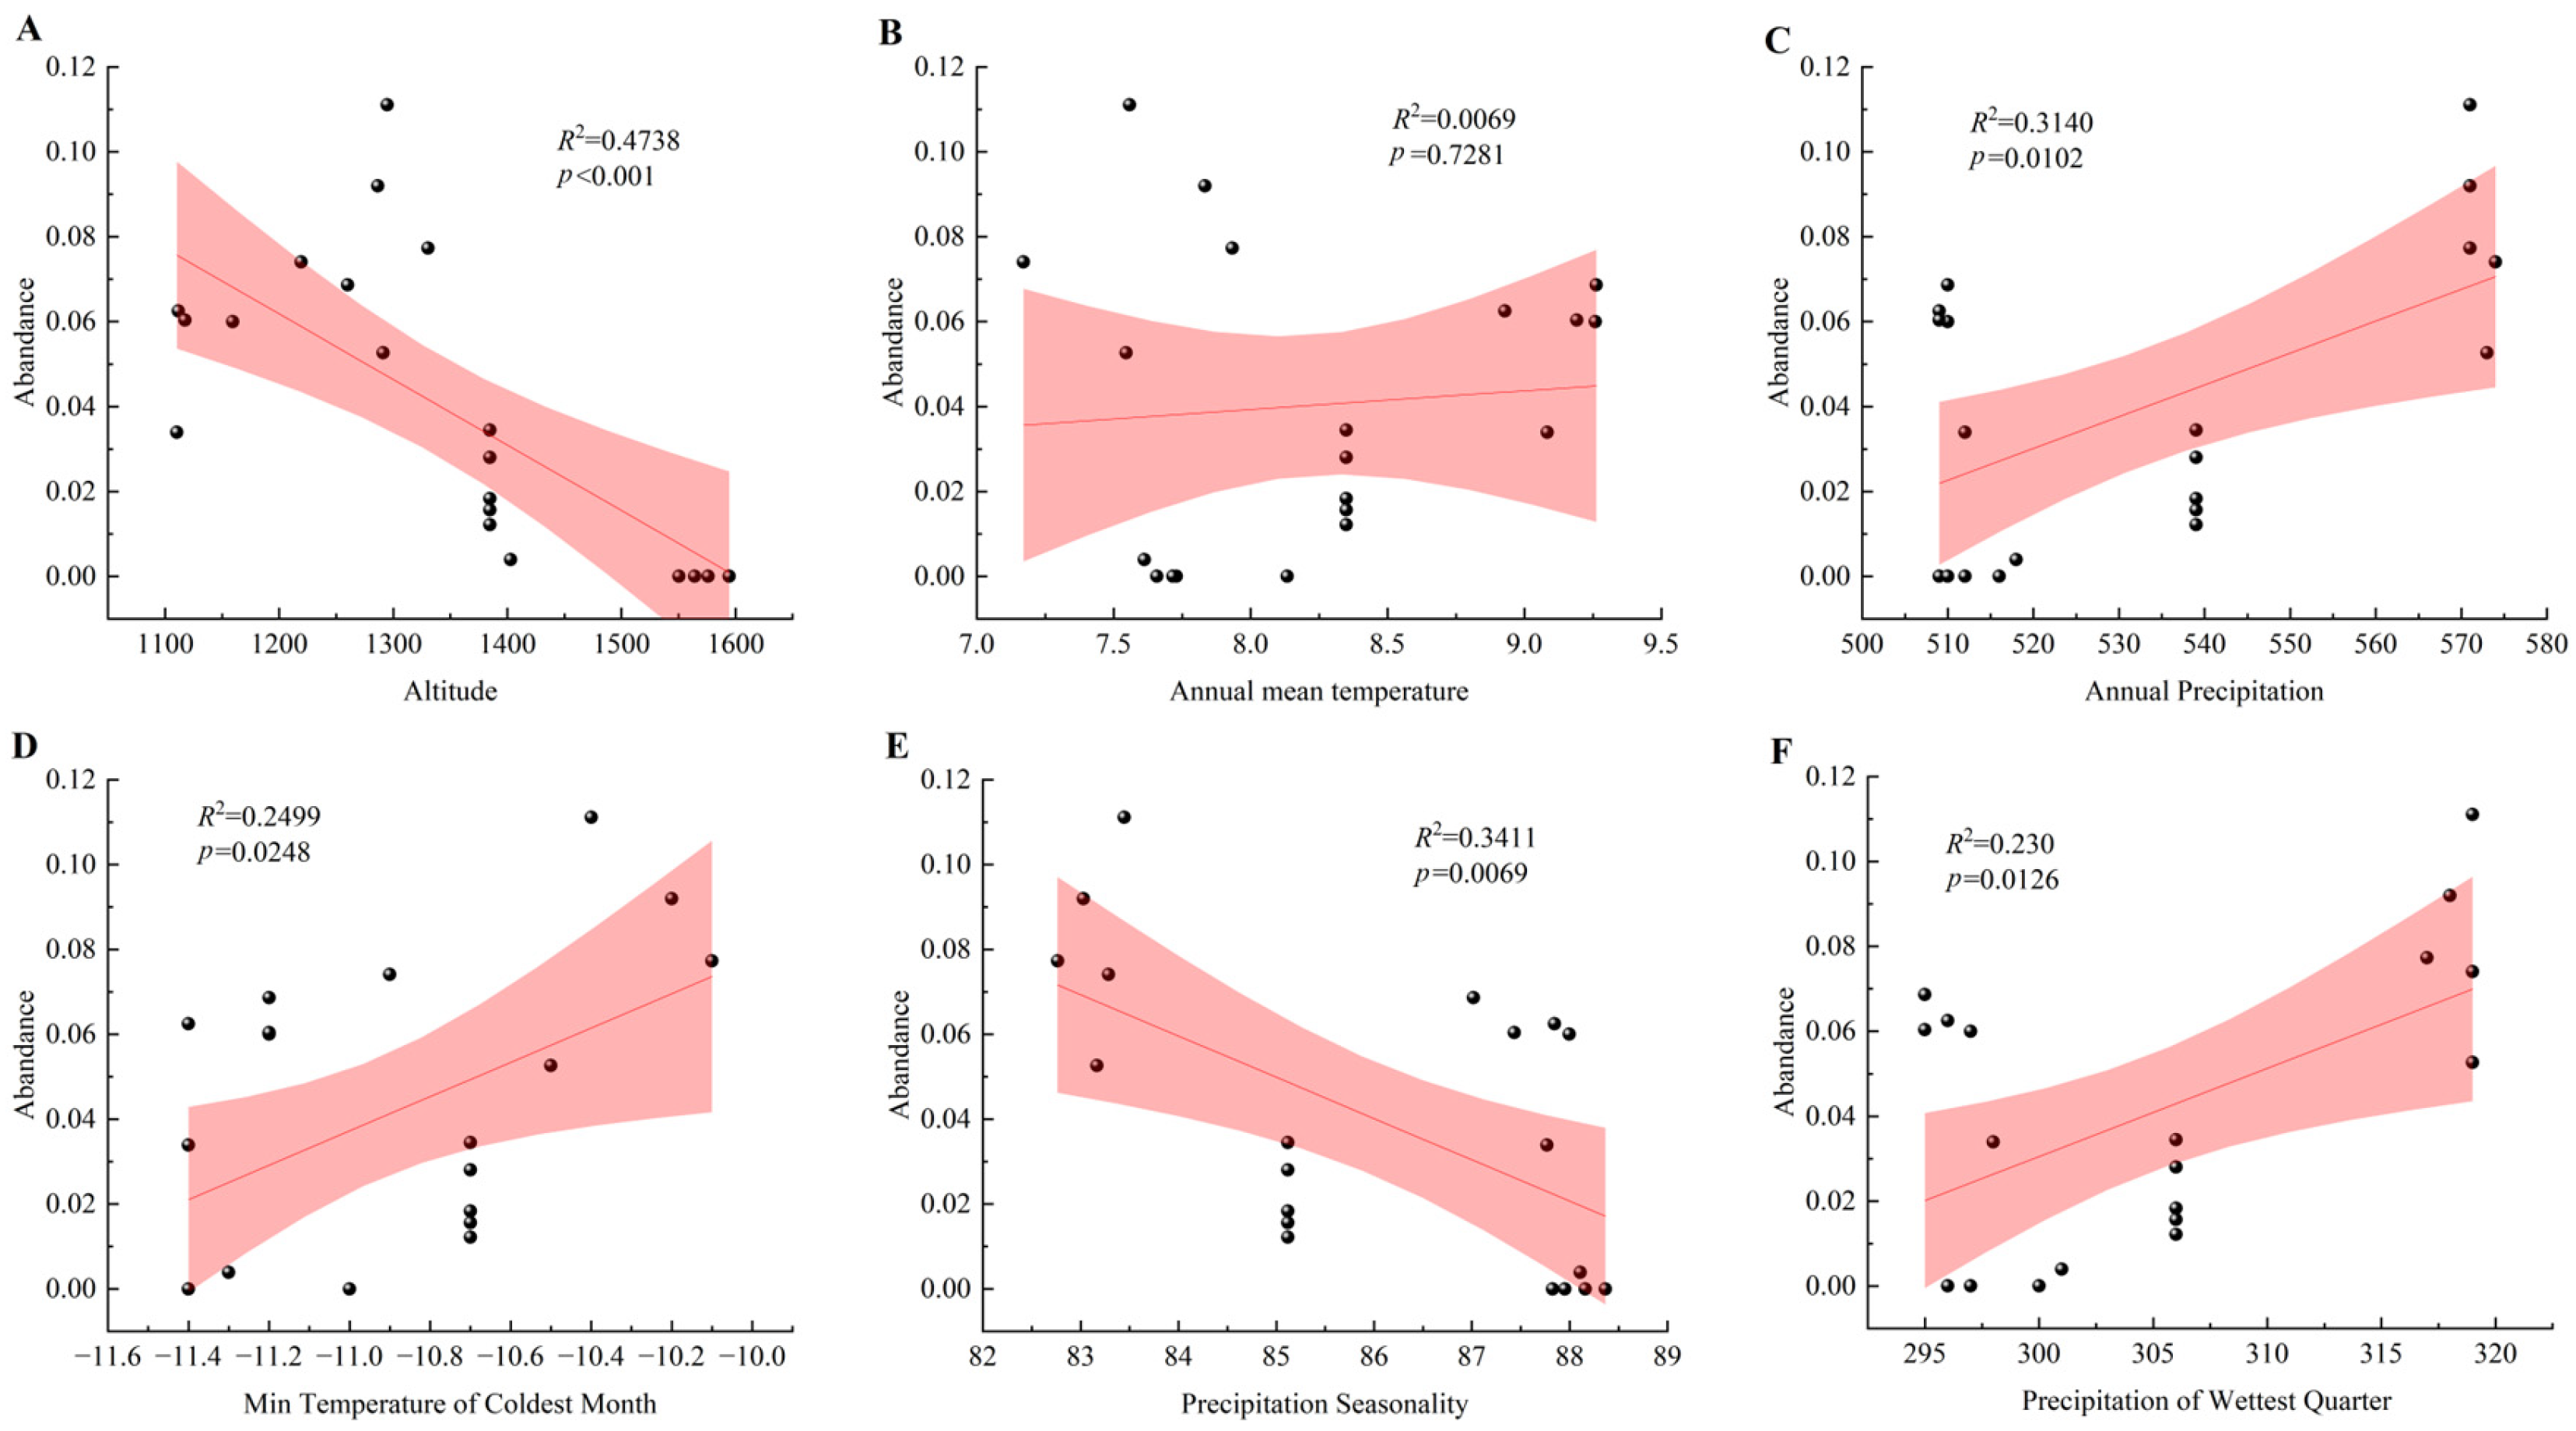
S. montela was found to be abundant at low-altitude areas in the butterfly survey, but the absence of the species was obvious at higher altitudes. To investigate the connection between this species and environmental factors, correlation analyses were performed (Figure 8). S. montela abundance had a significant negative correlation with altitude (p < 0.001), and the abundance of S. montela dropped when altitude increased. Although there was a positive correlation between the number of species and the annual average temperature, it was not statistically significant. Conversely, there was a positive correlation between the abundance and the annual mean precipitation (p = 0.0102) such that increased levels of precipitation resulted in greater abundances of S. montela. In addition, there were also important positive associations between the abundance and the lowest temperature of the coldest month (p = 0.0248), and between abundance and precipitation of the wettest quarter (p = 0.0126). Nevertheless, there was a highly significant negative correlation between abundance and the coefficient of variation in precipitation (p < 0.01).

4. Discussion

4.1. Species Composition of Butterflies

The paper investigated the structural features of the butterfly community in the Ziwuling Forest Region of Gansu Province. The findings indicated that Nymphalidae was the most prevalent family in the area with the greatest generic and specific diversity. This result is in agreement with the results of earlier butterfly studies in the Ziwuling Forest Region of Shaanxi Province [42] and indicates the typical distribution pattern of butterfly species in the temperate forest areas of China [17,43]. The great variety of Nymphalidae species in this region can be explained by the wide range of host plant choice patterns and high environmental versatility, which might be related to the adaptive physiological properties of Nymphalidae [44,45]. For example, the high flight performance of most Nymphalidae species might help them to avoid predators and colonize a wide variety of habitats [44]. The dominance of F. adippe and G. mahaguru in this area is probably due to their physiological and ecological adaptation to the local climatic conditions. The population dynamics of such species can be used as a measure of ecosystem stability [46]. Remarkably, the rare species made up 71.43% of all the species recorded, and 33 genera were represented by only one species each, making up 61.11% of all the genera. These results underscore the importance of the Ziwuling Forest in Gansu Province as an important natural biological gene pool of the Loess Plateau.

4.2. Butterfly Diversity in Different Habitats

The number of butterflies is strongly related to the spatial distribution of their host plants [47]. Adult butterflies lay eggs on the host plants, and larvae feed on them. Most butterfly larvae are highly specific to particular plants they require as hosts, as well as being specialized to use them as food sources [48]. Consequently, the alteration of the plant communities directly affects the butterfly diversity, indicating the close ecological connection between the vegetation and butterflies [49]. As we found, the structure of the butterfly communities varied greatly across the three habitat types, with the highest levels of butterfly diversity being recorded in the deciduous shrubland habitats, followed by the coniferous–broadleaved forest, and the lowest found in the farmland. The various layers of herbaceous and shrub vegetation in the deciduous shrubland habitat in the region of study provide sufficient food and shelter to butterfly populations to meet the needs of most butterfly populations to obtain food and reproduce, and make the environment relatively stable. It conforms to the findings of the diversity of flower-visiting insects of the Yanshan region [50], and the findings of Baguette et al., who reported similar trends concerning the distribution of nymphalid butterflies and habitat quality in Southeastern Belgium [51]. On the other hand, the diversity and richness indices were lower in the farmland habitat, which might be attributed to the simplification of vegetation structure and human interference, since habitat disruption and human activity can cause the local extinction or extirpation of butterfly species [52,53].
The NMDS ordination demonstrated that the butterfly community composition in the coniferous and broadleaved mixed forest differed significantly from that in the deciduous shrubland and farmland. This difference is probably caused by the more complex vegetation of the mixed forest, its more stable microclimate, and the presence of many host plants offering appropriate niches to specialist or forest-biology butterflies [54]. The similarity in butterfly communities between deciduous shrubland and farmland likely reflects that both habitats have relatively high proportions of herbaceous plants and edge habitat characteristics, which facilitate the coexistence of some generalist species in both habitat types [55,56].

4.3. Butterfly Diversity in Different Months

Temporal dynamics of the number of individuals, species richness, and diversity index of butterflies in the Ziwuling Forest Region were found to be significantly higher in July than in other months (p < 0.05). This finding conforms to the temporal dynamics patterns of butterfly populations in the Ziwuling part of the Shaanxi Province [42]. July is rich in light and rainfall that may support the enhancement of the productivity of the host plants and therefore offer the best conditions to grow and breed the butterfly larvae [57,58]. Seasonal trend is a reflection of the usual characteristics of butterfly populations in the temperate regions [59], and it is a great scientific basis for the creation of butterfly resource surveys and the tracking of conservation measures to preserve biodiversity.
NMDS revealed that the butterfly community structure changed by season. The similarity in spring (May) and autumn (September) populations may be attributable to a synchrony between spring and autumn germination phenology of their host plants (e.g., Brassicaceae, Fabaceae) [60]. High temperatures in summer (July and August) filtered species composition: few spring-dominant species became extinct, whereas heat-tolerant ones like Papilionidae exploited the empty niches [61]. These seasonal changes are very related to the phenology of the host plants, temperature, and life history.

4.4. Correlation of S. montela Abundance with Environmental Variables

S. montela richness had a significant correlation with different environmental factors. Specifically, it correlated negatively with altitude (p < 0.001), coefficient of variation in precipitation (p < 0.01) and positively with annual average precipitation, minimum temperature of the coldest month and precipitation of the wettest quarter (p < 0.05). These results suggest that S. montela is largely found in low-altitude areas that are warm and humid and where precipitation is relatively constant. Its distribution can be influenced by altitude and associated variations in temperature and humidity. An increase in altitude may cause a decrease in temperature and a shift in precipitation patterns, which may affect the survival of host plants due to their distribution, as well as the survival rate of larvae [22]. The relatively stable precipitation regime allows the uninterrupted growth of the host plants and, therefore, provides the essential resources for the development of the population. All in all, low-altitude, warm, and humid regions with stable precipitation are favorable habitats of S. montela, and it may serve as an indicator of environmental change.
Our results suggest that S. montela prefers low-elevation, warm, humid, and precipitation-stable environments. Those environmental conditions are probably going to control the butterfly population dynamics in an indirect way because they determine the distribution, growth, and phenology of its obligate host plants. However, we have not measured the amount of the host plant, canopy closure, or microclimate directly. The future research ought to measure the quantity of host plants, their coverage, vertical structure, and canopy closure in the range of the species, as well as plot-scale micro-environmental variables, to find out how responsive the S. montela is to its habitat of the host plant.
In comparison to the historical accounts, there are a number of species that had been documented earlier but were not found in this survey. Nevertheless, because of the small size of the sample and the absence of environmental data, it is impossible to say if these losses arise out of sampling bias or habitat degradation. The further research must include systematic gathering of appropriate environmental variables across transects, development of species–environment response models, and long-term monitoring integration to explain the underlying mechanisms of the butterfly community dynamics in this area.

5. Conclusions

Ziwuling Forest has a large variety of butterflies, with a total of 84 species of 54 genera and five families being reported in the three habitats studied. The most dominant family was Nymphalidae, and the dominant species were F. adippe and G. mahaguru. The measures of butterfly biodiversity differed greatly between the types of habitats: deciduous shrubland maintained the greatest individual abundance, species richness, Shannon–Wiener diversity, and Margalef richness, presumably due to its rich vegetation and its complex vegetation structure and edge-induced microclimatic diversity. On a seasonal level, butterfly abundance and diversity reached their maximum in July, which is also the period of maximized abundance of host plants and maximized thermal optima of the flight, and therefore could be regarded as the best time to conduct annual monitoring surveys. It is worth noting that the elevational distribution pattern of S. montela was unique, whereby its population decreased with altitude and rainfall variation, but increased with annual rainfall, winter minimum temperature, and wet-season rainfall. Such connections suggest a preference for warm, wet, low-altitude ecosystems with steady moisture regimes, and hence, it can act as a bioindicator of habitat movements caused by climate change. Taken together, the butterfly community of Ziwuling Forest has significant conservation value. We are recommending focusing on in situ preservation of deciduous shrubland as one of the main habitats with long-term monthly monitoring of climatically sensitive species like S. montela to monitor the response of communities to environmental factors.

Author Contributions

Conceptualization, S.-J.X.; methodology, S.-J.X.; software, S.-J.X.; validation, S.-J.X.; formal analysis, S.-J.X.; investigation, Y.-Y.C., M.-J.M. and Z.-W.Y.; resources, S.-J.X.; data curation, S.-J.X.; writing—original draft preparation, S.-J.X.; writing—review and editing, S.-J.X.; visualization, S.-J.X.; supervision, S.-J.X.; project administration, S.-J.X.; funding acquisition, S.-J.X. All authors have read and agreed to the published version of the manuscript.

Funding

This research was funded by the Gansu Provincial Natural Science Foundation Project (24JRRM003), the Qingyang City Science and Technology Plan Project (QY-STK-2022A-023), Gansu Province Higher Education Institutions Innovation Fund Project (2020B-221).

Institutional Review Board Statement

Ethical review and approval were waived for this study as the limited number of butterfly species collected is not protected by Wildlife Laws in China or by CITES.

Data Availability Statement

The original contributions presented in this study are included in the article. Further inquiries can be directed to the corresponding author.

Conflicts of Interest

The authors declare no conflicts of interest.

References

  1. Ren, J.; Li, S.; He, M.; Zhang, Y. Butterfly Community Diversity in the Qinling Mountains. Diversity 2022, 14, 27. [Google Scholar] [CrossRef] [Scilit]
  2. Oostermeijer, J.G.B.; Van Swaay, C.A.M. The Relationship between Butterflies and Environmental Indicator Values: A Tool for Conservation in a Changing Landscape. Biol. Conserv. 1998, 86, 271–280. [Google Scholar] [CrossRef] [Scilit]
  3. Grill, A.; Cleary, D.F.R. Diversity Patterns in Butterfly Communities of the Greek Nature Reserve Dadia. Biol. Conserv. 2003, 114, 427–436. [Google Scholar] [CrossRef] [Scilit]
  4. Wang, W.-L.; Suman, D.O.; Zhang, H.-H.; Xu, Z.-B.; Ma, F.-Z.; Hu, S.-J. Butterfly Conservation in China: From Science to Action. Insects 2020, 11, 661. [Google Scholar] [CrossRef] [Scilit]
  5. Birch, R.; Nebel, L.; Chittaro, Y.; Hermann, G.; Trusch, R.; Gelbrecht, J.; Markl, G. The Diverse Reactions of Butterflies and Zygaenids (Lepidoptera) to Climate Change—A Large Scale, Multi-Species Study. Glob. Ecol. Biogeogr. 2025, 34, e70112. [Google Scholar] [CrossRef] [Scilit]
  6. Harsh, S. Impact of Climate Warming and Landscape Change on Monarch Butterfly. J. Insect Conserv. 2025, 29, 11. [Google Scholar] [CrossRef] [Scilit]
  7. Lee, J.; Kim, S.; Hong, S.; Choi, S. Impact of Habitat Loss on the Decline of Threatened Butterflies in South Korea. Entomol. Res. 2025, 55, e70070. [Google Scholar] [CrossRef] [Scilit]
  8. He, K.; Li, B.; Yang, X.; Bai, Q.; Wang, L.; Bao, G.; Wang, J.; Li, Q. A Spatial and Temporal Analysis of Butterfly Diversity in Different Habitat Types in Xundian County, Yunnan. J. Southwest For. Univ. (Nat. Sci.) 2024, 44, 116–127. [Google Scholar]
  9. Wei, F.; Xie, T.; Su, C.; He, B.; Shu, Z.; Zhang, Y.; Xiao, Z.; Hao, J. Stability and Assembly Mechanisms of Butterfly Communities across Environmental Gradients of a Subtropical Mountain. Insects 2024, 15, 230. [Google Scholar] [CrossRef] [Scilit]
  10. Huang, D.; Huang, S.; Wang, J.; Li, H.; Dou, F.; Zhang, K.; Zhu, X.; Ma, F. Diversity of Butterfly Communities in the Qiyunshan National Nature Reserve. Biodivers. Sci. 2018, 28, 958–964. [Google Scholar] [CrossRef] [Scilit]
  11. Zhu, E.; Zhang, Z.; He, Q.; Li, C.; Shi, W.; Yi, C. Preliminary Study on Spatial and Temporal Dynamics of Butterfly Diversity in Maandi Area of Jinping County, Yunnan Province. J. Southwest For. Univ. (Nat. Sci.) 2021, 41, 168–175. [Google Scholar]
  12. Brower, A.V.Z.; Freitas, A.V.L.; Lee, M.; Silva-Brandão, K.L.; Whinnett, A.; Willmott, K.R. Phylogenetic Relationships among the Ithomiini (Lepidoptera: Nymphalidae) Inferred from One Mitochondrial and Two Nuclear Gene Regions. Syst. Entomol. 2006, 31, 288–301. [Google Scholar] [CrossRef] [Scilit]
  13. Rosa, A.H.B.; Barbosa, E.P.; Wahlberg, N.; Freitas, A.V.L. Systematic Position and Conservation Aspects of Melinaea Mnasias Thera (Lepidoptera: Nymphalidae: Danainae). Nat. Conserv. Res. 2024, 9, 1–8. [Google Scholar] [CrossRef] [Scilit]
  14. Chazot, N.; Willmott, K.R.; Lamas, G.; Freitas, A.V.L.; Piron-Prunier, F.; Arias, C.F.; Mallet, J.; De-Silva, D.L.; Elias, M. Renewed Diversification Following Miocene Landscape Turnover in a Neotropical Butterfly Radiation. Glob. Ecol. Biogeogr. 2019, 28, 1118–1132. [Google Scholar] [CrossRef] [Scilit]
  15. Wepprich, T.; Adrion, J.R.; Ries, L.; Wiedmann, J.; Haddad, N.M. Butterfly Abundance Declines over 20 Years of Systematic Monitoring in Ohio, USA. PLoS ONE 2019, 14, e0216270. [Google Scholar] [CrossRef] [Scilit] [PubMed]
  16. Ge, X.; Hong, X.; Ma, F.; Liu, B.; Li, J. The Species Diversity of Butterfly Community in Saihanwula Nature Reserve of Inner Mon Golia. Chin. J. Ecol. 2018, 37, 2376–2383. [Google Scholar]
  17. Sang, S.; Wu, X.; Wang, Z.; Peng, H.; Zhou, H.; Zhang, H.; Bai, Y. Butterfly Community Structure and Species-Abundance Distribution in Different Habitats in the Xinglong Mountains National Nature Reserve. Biodivers. Sci. 2020, 28, 983–992. [Google Scholar] [CrossRef] [Scilit]
  18. Hu, J.; Li, J.; Wu, H.; Huang, Z.; Zheng, X. Structure and Diversity of Butterfly Community in the Shiwandashan National Forest Park District of Guangxi. Chin. J. Ecol. 2021, 40, 1478–1490. [Google Scholar]
  19. Yang, Y.; Gao, W.; Han, Y.; Zhou, T. Predicting the Impact of Climate Change on the Distribution of North China Leopards (Panthera Pardus Japonensis) in Gansu Province Using MaxEnt Modeling. Biology 2025, 14, 126. [Google Scholar] [CrossRef] [Scilit] [PubMed]
  20. Jiang, S.; Zhang, L. Composition and Fauna Analysis of Butterflies in the Ziwu Mountains of East Gansu Province. J. Lanzhou Univ. (Nat. Sci.) 2000, 36, 112–117. [Google Scholar]
  21. Zhai, Q.; Yuan, S.; Liu, J.; Song, N.; Zeng, X. Morphological, Biological Characteristics and Annual Life History of Sericinus Montela Gray in Zhengzhou Area. J. Henan Norm. Univ. (Nat. Sci. Ed.) 2015, 43, 110–116. [Google Scholar]
  22. Li, X.; Luo, Y.; Yang, H.; Yang, Q.; Settele, J.; Schweiger, O. On the Ecology and Conservation of Sericinus Montelus (Lepidoptera: Papilionidae)—Its Threats in Xiaolongshan Forests Area (China). PLoS ONE 2016, 11, e0150833. [Google Scholar] [CrossRef] [Scilit]
  23. Park, S.-H.; Kim, J.H.; Kim, J.G. Effects of Human Activities on Sericinus Montela and Its Host Plant Aristolochia Contorta. Sci. Rep. 2023, 13, 8289. [Google Scholar] [CrossRef] [Scilit]
  24. Yang, Y.; Wang, B.; Wang, G.; Li, Z. Ecological Regionalization and Overview of the Loess Plateau. Acta Ecol. Sin. 2019, 39, 7389–7397. [Google Scholar] [CrossRef] [Scilit]
  25. Jin, T.; Cao, E.; Gong, J. Spatiotemporal Variations of Vegetation Coverage and Its Relationships with Climate Change and Human Activities in Ziwuling Region During 2000–2018. Bull. Soil Water Conserv. 2022, 42, 335–343. [Google Scholar]
  26. Wang, B.; Wu, J.; Zhao, S. Impacts of Vegetation Types on Soil Nitrogen in Ziwuling Forest Region. Bull. Soil Water Conserv. 2002, 22, 23–25. [Google Scholar]
  27. Ministry of Environmental Protection. National Biodiversity Strategy and Action Plan (2011–2030); China Environmental Science Press: Beijing, China, 2011.
  28. Kawahara, A.Y.; Plotkin, D.; Espeland, M.; Meusemann, K.; Toussaint, E.F.A.; Donath, A.; Gimnich, F.; Frandsen, P.B.; Zwick, A.; Dos Reis, M.; et al. Phylogenomics Reveals the Evolutionary Timing and Pattern of Butterflies and Moths. Proc. Natl. Acad. Sci. USA 2019, 116, 22657–22663. [Google Scholar] [CrossRef] [Scilit] [PubMed]
  29. Zhou, Y. Monographia Rhopalocerorum Sinensium; Henan Science and Technology Press: Zhengzhou, China, 1999. [Google Scholar]
  30. Cai, J. Monograph of Butterflies in Xiaolongshan Mts, Gansu Province; Gansu Science and Technology Press: Lanzhou, China, 2011. [Google Scholar]
  31. Jiang, H.; Wu, F.; Huang, J.; Wen, J.; Wang, L.; Li, H. Diversity of Flower-Visiting Insects and the Influence of Environmental Factors in Hangzhou-Ningbo Area, East China. Acta Entomol. Sin. 2025, 68, 321–334. [Google Scholar]
  32. Ma, K. Measurement of Biotic Community Diversity I α Diversity (Part 1). Biodivers. Sci. 1994, 2, 162–168. [Google Scholar] [CrossRef] [Scilit]
  33. Shannon, C.E. A Mathematical Theory of Communication. Bell Syst. Tech. J. 1948, 27, 379–423. [Google Scholar] [CrossRef] [Scilit]
  34. Margalef, R. Information Theory in Ecology. Gen. Syst. 1958, 3, 36–71. [Google Scholar]
  35. Simpson, E.H. Measurement of Diversity. Nature 1949, 163, 688. [Google Scholar] [CrossRef] [Scilit]
  36. Pielou, E.C. The Measurement of Diversity in Different Types of Biological Collections. J. Theor. Biol. 1967, 15, 177. [Google Scholar] [CrossRef] [Scilit]
  37. Hsieh, T.C.; Ma, K.H.; Chao, A. iNEXT: An R Package for Rarefaction and Extrapolation of Species Diversity (H Ill Numbers). Methods Ecol. Evol. 2016, 7, 1451–1456. [Google Scholar] [CrossRef] [Scilit]
  38. Li, Q. Species Accumulation Curves and Its Application. Chin. J. Appl. Entomol. 2011, 48, 1882–1888. [Google Scholar]
  39. Hu, W.; Pang, R.; Yao, J.; Che, X.; Wang, D.; Wang, L.; Mao, K.; Dou, L. Butterfly Diversity and Community Assembly Mechanisms Along an Elevational Gradient in Wenchuan County. Sichuan J. Zool. 2026, 45, 1–14. [Google Scholar]
  40. Dixon, P. VEGAN, a Package of R Functions for Community Ecology. J. Veg. Sci. 2003, 14, 927–930. [Google Scholar] [CrossRef]
  41. Zhang, C.; Li, J.; Cheng, H.; Duan, J.; Pan, Z. Patterns and Environmental Drivers of the Butterfly Diversity in the Western Region of Qinling Mountains. Biodivers. Sci. 2023, 31, 22272. [Google Scholar] [CrossRef] [Scilit]
  42. Xu, S.; Zhao, Y.; Liu, J.; Li, S.; Wang, L. Analysis on Diversity of Butterfly Insects in Ziwuling National Nature Reserve in Shaanxi Province. J. Yan’an Univ. (Nat. Sci. Ed.) 2021, 40, 21–26. [Google Scholar]
  43. Li, X.; Yuan, X.; Deng, H. Vertical Distribution and Diversity of Butterflies in Hengduan Mountains, Southwest China. Chin. J. Ecol. 2009, 28, 1833–1840. [Google Scholar]
  44. Weingartner, E.; Wahlberg, N.; Nylin, S. Dynamics of Host Plant Use and Species Diversity in Polygonia Butterflies (Nymphalidae). J. Evol. Biol. 2006, 19, 483–491. [Google Scholar] [CrossRef] [Scilit]
  45. Nylin, S.; Slove, J.; Janz, N. Host Plant Utilizaton, Host Range Oscillations Anddiverdification in Nymphalid Butterflies: A Phylogenetic Investigation. Evolution 2014, 68, 105–124. [Google Scholar] [CrossRef] [Scilit] [PubMed]
  46. Chen, Z.; Zeng, Y.; Bao, M.; Ma, J.; Ke, J. Butterfly Diversity in Different Habitat Types at the Huzhu Northern Mountain National Forest Park, Qinghai. Biodivers. Sci. 2006, 14, 517–524. [Google Scholar] [CrossRef] [Scilit]
  47. Mukherjee, K.; Mondal, A. Butterfly Diversity in Heterogeneous Habitat of Bankura, West Bengal, India. J. Threat. Taxa 2020, 12, 15804–15816. [Google Scholar] [CrossRef] [Scilit]
  48. Tudor, O.; Dennis, R.L.H.; Greatorex-Davies, J.N.; Sparks, T.H. Flower Preferences of Woodland Butterflies in the UK: Nectaring Specialists Are Species of Conservation Concern. Biol. Conserv. 2004, 119, 397–403. [Google Scholar] [CrossRef] [Scilit]
  49. Munisi, E.J.; Masenga, E.H.; Nkwabi, A.K.; Kiwango, H.R.; Mjingo, E.E. Butterfly Abundance and Diversity in Different Habitat Types in the Usangu Area, Ruaha National Park. Psyche J. Entomol. 2024, 2024, 8833655. [Google Scholar] [CrossRef] [Scilit]
  50. Han, Y.; Xue, Q.; Song, H.; Qi, J.; Gao, R.; Cui, S.; Men, L.; Zhang, Z. Diversity and Influencing Factors of Flower-Visiting Insects in the Yanshan Area. Biodivers. Sci. 2022, 30, 21448. [Google Scholar] [CrossRef] [Scilit]
  51. Baguette, M.; Clobert, J.; Schtickzelle, N. Metapopulation Dynamics of the Bog Fritillary Butterfly: Experimental Changes in Habitat Quality Induced Negative Density-dependent Dispersal. Ecography 2011, 34, 170–176. [Google Scholar] [CrossRef] [Scilit]
  52. Efenakpo, O.D.; Zakka, U.; Omanoye, D.T. Butterfly Diversity, Distribution, and Abundance in the University of Port Harcourt River State, Nigeria. J. For. Environ. Sci. 2021, 37, 243–250. [Google Scholar] [CrossRef]
  53. Blair, R.B.; Launer, A.E. Butterfly Diversity and Human Land Use: Species Assemblages along an Urban Grandient. Biol. Conserv. 1997, 80, 113–125. [Google Scholar] [CrossRef] [Scilit]
  54. Tang, C.; Yang, Q.; Cai, J. The Butterfly Diversity of Different Habitat Types in Xiaolongshan Forest area, Gansu Province. Chin. Bull. Entomol. 2010, 47, 563–567. [Google Scholar]
  55. Vujanović, D.; Arok, M.; Veselić, S.; Skendžić, T.; Andrić, A.; Đorđević, A.; Vujić, A. Butterfly Community Dynamics in a Monoculture-dominated Agricultural Landscape. Ecol. Entomol. 2025, 50, 360–372. [Google Scholar] [CrossRef] [Scilit]
  56. Gaigher, R.; Pryke, J.S.; Samways, M.J. Indigenous Forest Edges Increase Habitat Complexity and Refuge Opportunities for Grassland Butterflies. J. Insect Conserv. 2024, 28, 27–41. [Google Scholar] [CrossRef] [Scilit]
  57. Xu, Z.; Zhong, W.; Zhang, D.; Hu, H. Diversity of Butterfly Communities in Jimusaer County, Xinjiang. Biodivers. Sci. 2020, 28, 993–1002. [Google Scholar] [CrossRef] [Scilit]
  58. Sharma, N.; Sharma, S. Assemblages and Seasonal Patterns in Butterflies across Different Ecosystems in a Sub-Tropical Zone of Jammu Shiwaliks, Jammu and Kashmir, India. Trop. Ecol. 2021, 62, 261–278. [Google Scholar] [CrossRef] [Scilit]
  59. Dan, Z.; Bao, M.; Ma, C.; Li, L.; Hao, H.; Cheng, F.; Chen, Z. Community Structure and Butterfly Diversity in Different Habitat Types in Qinghai Yushu Plateau. Acta Ecol. Sin. 2018, 38, 7557–7564. [Google Scholar]
  60. Kharouba, H.M.; Vellend, M. Flowering Time of Butterfly Nectar Food Plants Is More Sensitive to Temperature than the Timing of Butterfly Adult Flight. J. Anim. Ecol. 2015, 84, 1311–1321. [Google Scholar] [CrossRef] [Scilit]
  61. Rawlins, J.E. Thermoregulation by the Black Swallowtail Butterfly, Papilio Polyxenes (Lepidoptera: Papilionidae). Ecology 1980, 61, 345–357. [Google Scholar] [CrossRef] [Scilit]
Figure 1. Geographic location of Ziwuling Forest Region and distribution of butterfly sampling sites. (a) Location of Ziwuling Forest Region in Gansu Province; (b) extent of Ziwuling Forest Region and distribution of four sampling areas (c1c4). (c1c4) Detailed locations of forest management stations (orange dots) and butterfly sampling sites (blue dots) within each sampling area.
Diversity 18 00352 g001
Figure 2. Butterfly species diversity across different habitats in the study area. (A) Individual number; (B) species number; (C) Shannon-Wiener index; (D) Margalef richness index; (E) Pielou evenness index; (F) Simpson dominance index. Different lowercase letters indicate significant differences at the p < 0.05 level.
Diversity 18 00352 g002
Figure 3. Rarefaction and extrapolation curves for butterfly species diversity in different habitats.
Diversity 18 00352 g003
Figure 4. Differences in butterfly diversity in different months. (A) Individual number; (B) species number; (C) Shannon-Wiener index; (D) Margalef richness index; (E) Pielou evenness index; (F) Simpson dominance index. Different lowercase letters indicate significant differences at the p < 0.05 level.
Diversity 18 00352 g004
Figure 5. Rarefaction and extrapolation curves for butterfly species diversity across different months.
Diversity 18 00352 g005
Figure 6. NMDS and UPGMA clustering results of butterfly communities in different habitats. (A) NMDS analysis of butterflies in different habitats; (B) UPGMA cluster of butterflies in different habitats.
Diversity 18 00352 g006
Figure 7. NMDS and UPGMA clustering results of butterfly communities in different months. (A) NMDS analysis of butterflies in different months; (B) UPGMA cluster of butterflies in different months.
Diversity 18 00352 g007
Figure 8. Linear correlation between the abundance of S. montela and environmental factors. (A) altitude; (B) annual mean temperature; (C) annual precipitation; (D) minimum temperature of the coldest month; (E) precipitation seasonality; (F) precipitation of the wettest quarter. Red shading denotes 95% confidence intervals. R2 and p values indicate the coefficient of determination and statistical significance, respectively.
Diversity 18 00352 g008
Table 1. Number and relative proportion of butterfly species and genera recorded in this study.
FamilyGenusSpeciesIndividual
NumberPercentageNumberPercentageNumberPercentage
Papilionidae23.70%44.76%1004.28%
Pieridae712.96%1214.29%75532.31%
Nymphalidae3259.26%4755.95%134715.36%
Lycaenidae712.96%1315.48%8542.19%
Hesperiidae611.11%89.52%500.09%
Disclaimer/Publisher’s Note: The statements, opinions and data contained in all publications are solely those of the individual author(s) and contributor(s) and not of MDPI and/or the editor(s). MDPI and/or the editor(s) disclaim responsibility for any injury to people or property resulting from any ideas, methods, instructions or products referred to in the content.